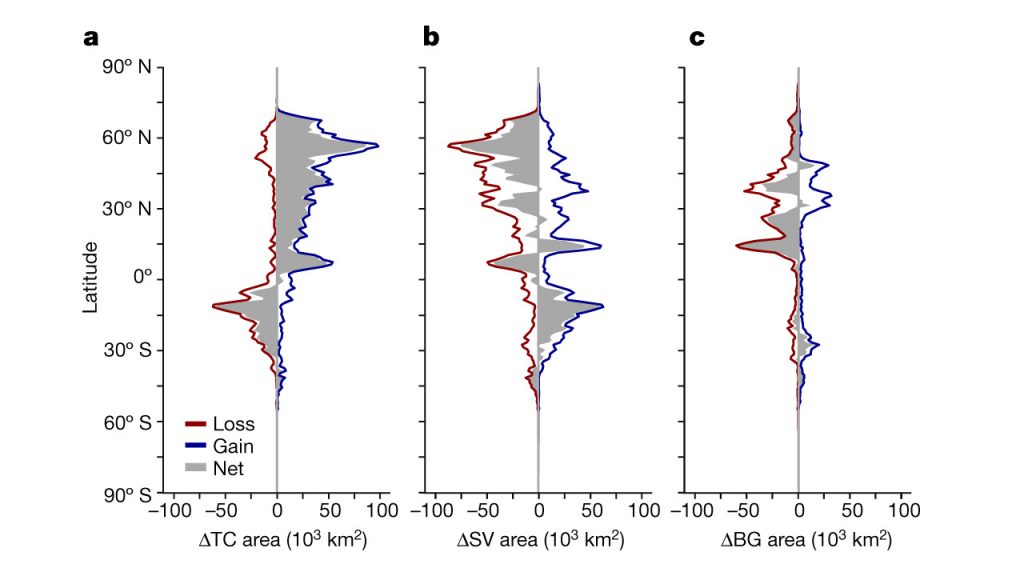
Diagrams showing latitudinal profiles of land cover change over the period 1982 to 2016 based on analysis of time-series of NOAA AVHRR imagery:a) tree canopy cover change (ΔTC); b) short vegetation cover change (ΔSV); c) bare ground cover change (ΔBG). Area statistics were calculated for every 1° of latitude (Song et al. 2018). Source of data: NOAA AVHRR.