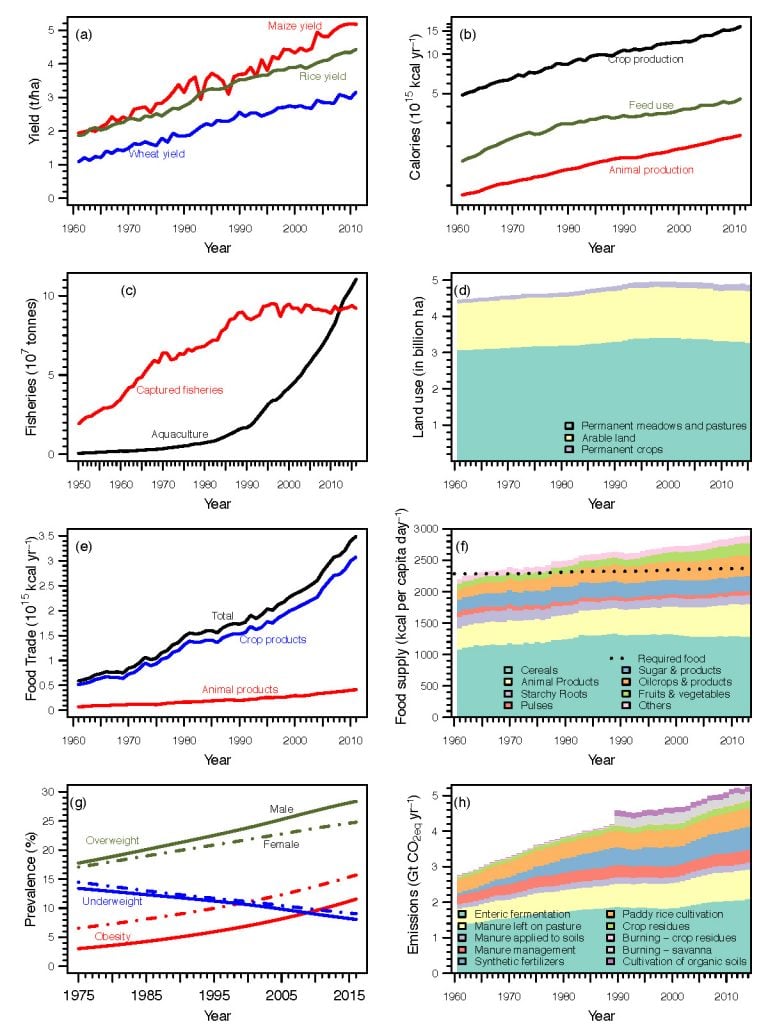
Figure 5.2
Global trends in (a) yields of maize, rice, and wheat (FAOSTAT 2018) – the top three crops grown in the world; (b) production of crop and animal calories and use of crop calories as livestock feed (FAOSTAT 2018); (c) production from marine and aquaculture fisheries (FishStat 2019); (e) food trade in calories (FAOSTAT 2018); (f) food supply and required food (i.e., based on human energy requirements for medium physical activities) from 1961–2012 (FAOSTAT 2018; Hiç et al. 2016); (g) prevalence of overweight, obesity and underweight from 1975–2015 (Abarca-Gómez et al. 2017); and (h) GHG emissions for the agriculture sector, excluding land-use change (FAOSTAT 2018). For figures (b) and (e), data provided in mass units were converted into calories using nutritive factors (FAO 2001b). Data on emissions due to burning of savanna and cultivation of organic soils is provided only after 1990 (FAOSTAT 2018).