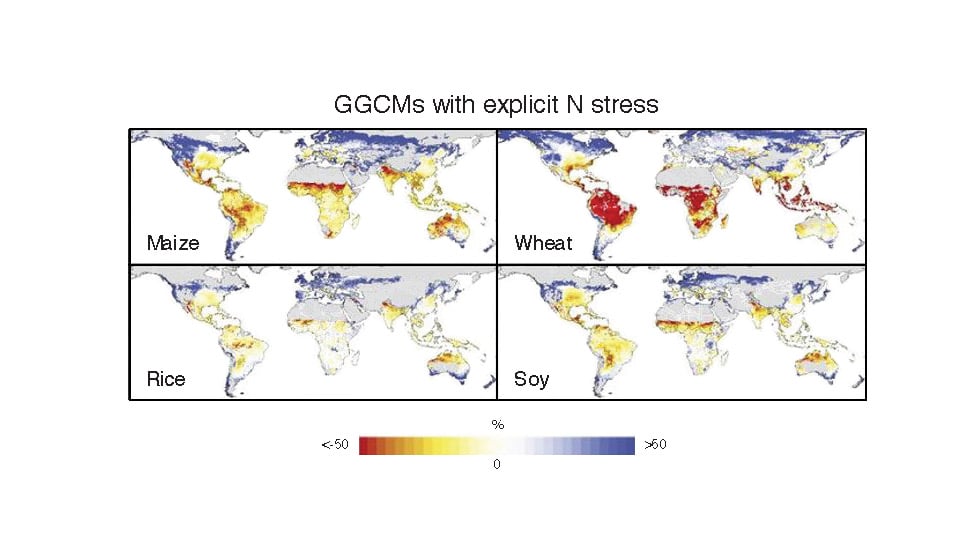
AgMIP median yield changes (%) for RCP8.5 (2070–2099 in comparison to 1980–2010 baseline) with CO2 effects and explicit nitrogen stress over five GCMs 힆 four Global Gridded Crop Models (GGCMs) for rainfed maize, wheat, rice, and soy (20 ensemble members from EPIC, GEPIC, pDSSAT, and PEGASUS; except for rice which has 15). Grey areas indicate historical areas with little to no yield capacity. All models use a 0.5°C grid, but there are differences in grid cells simulated to represent agricultural land. While some models simulated all land areas, others simulated only potential suitable cropland area according to evolving climatic conditions. Others utilised historical harvested areas in 2000 according to various data sources (Rosenzweig et al. 2014).