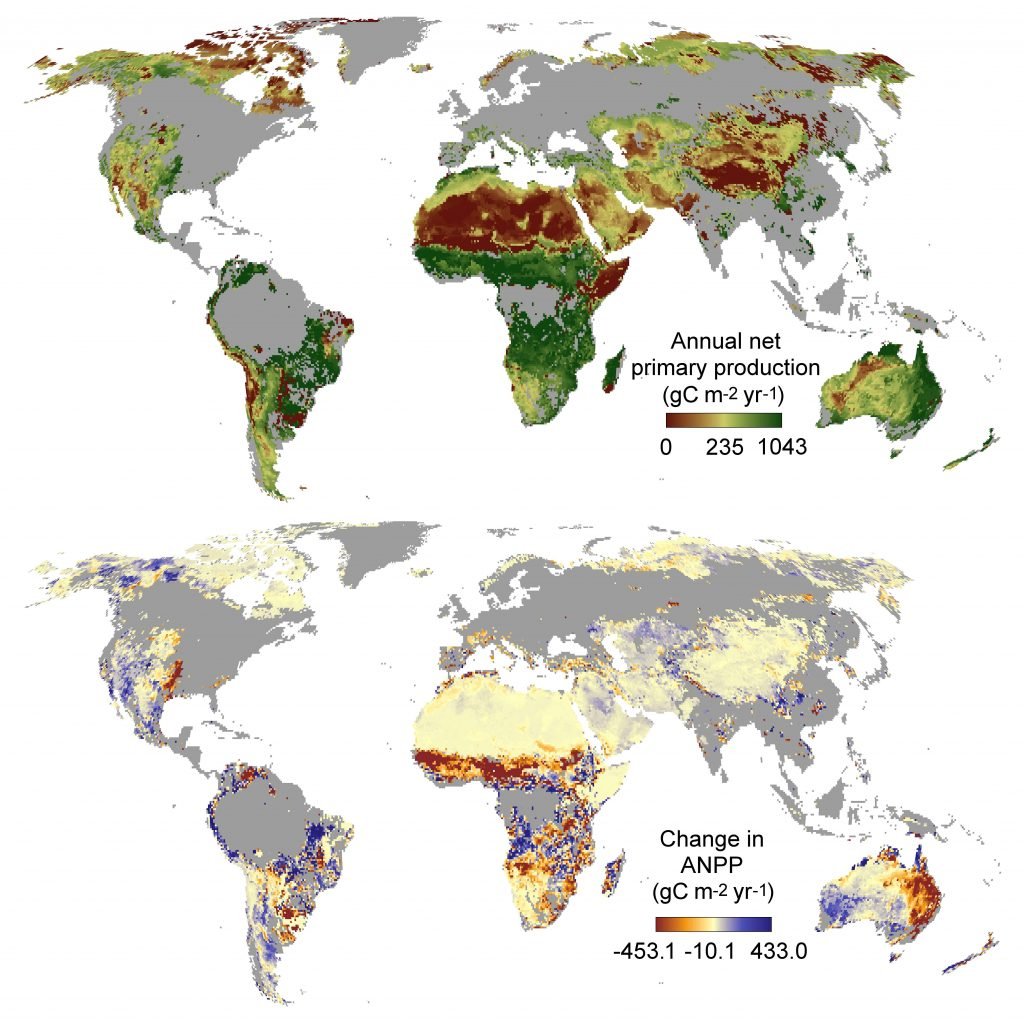
Ensemble simulation results for projected annual net primary productivity of rangelands as simulated in 2000 (top) and their change in 2050 (bottom) under emissions scenario RCP 8.5, with plant responses enhanced by CO2 fertilisation. Results from RCP 4.5 and 8.5, with and without positive effects of atmospheric CO2 on plant production, differed considerably in magnitude but had similar spatial patterns, and so results from RCP 8.5 with increasing production are portrayed spatially here and in other figures. Scale bar labels and the stretch applied to colours are based on the spatial mean value plus or minus two standard deviations (Boone et al. 2017).