Chapter 11: Australasia


This chapter should be cited as:
Lawrence, J., B. Mackey, F. Chiew, M.J. Costello, K. Hennessy, N. Lansbury, U.B. Nidumolu, G. Pecl, L. Rickards, N. Tapper, A. Woodward, and A. Wreford, 2022: Australasia. In: Climate Change 2022: Impacts, Adaptation and Vulnerability. Contribution of Working Group II to the Sixth Assessment Report of the Intergovernmental Panel on Climate Change [H.-O. Pörtner, D.C. Roberts, M. Tignor, E.S. Poloczanska, K. Mintenbeck, A. Alegría, M. Craig, S. Langsdorf, S. Löschke, V. Möller, A. Okem, B. Rama (eds.)]. Cambridge University Press, Cambridge, UK and New York, NY, USA, pp. 1581–1688, doi:10.1017/9781009325844.013.
Executive Summary 
Observed changes and impacts
Ongoing climate trends have exacerbated many extreme events (very high confidence). The Australian trends include further warming and sea level rise sea level rise (SLR), with more hot days and heatwaves, less snow, more rainfall in the north, less April–October rainfall in the southwest and southeast and more extreme fire weather days in the south and east. The New Zealand trends include further warming and sea level rise (SLR), more hot days and heatwaves, less snow, more rainfall in the south, less rainfall in the north and more extreme fire weather in the east. There have been fewer tropical cyclones and cold days in the region. Extreme events include Australia’s hottest and driest year in 2019 with a record-breaking number of days over 39°C, New Zealand’s hottest year in 2016, three widespread marine heatwaves during 2016–2020, Category 4 Cyclone Debbie in 2017, seven major hailstorms over eastern Australia and two over New Zealand from 2014–2020, three major floods in eastern Australia and three over New Zealand during 2019–2021 and major fires in southern and eastern Australia during 2019–2020. {11.2.1, Table 11.2, 11.3.8}
Climate trends and extreme events have combined with exposure and vulnerabilities to cause major impacts for many natural systems, with some experiencing or at risk of irreversible change in Australia (veryhigh confidence) and in New Zealand (high confidence) . For example, warmer conditions with more heatwaves, droughts and catastrophic wildfires have negatively impacted terrestrial and freshwater ecosystems. The Bramble Cay melomys, an endemic mammal species, became extinct due to loss of habitat associated with sea level rise (SLR) and storm surges in the Torres Strait. Marine species abundance and distributions have shifted polewards, and extensive coral bleaching events and loss of temperate kelp forests have occurred due to ocean warming and marine heatwaves across the region. In New Zealand’s southern Alps, from 1978 to 2016, the area of 14 glaciers declined 21%, and extreme glacier mass loss was at least 6 times more likely in 2011 and 10 times more likely in 2018 due to climate change. The end-of-summer snowline elevation for 50 glaciers rose 300 m from 1949 to 2019. {11.3.1.1, 11.3.2.1, Table 11.2b, Table 11.4, Table 11.6, Table 11.9}
Climate trends and extreme events have combined with exposure and vulnerabilities to cause major impacts for some human systems (high confidence). Socioeconomic costs arising from climate variability and change have increased. Extreme heat has led to excess deaths and increased rates of many illnesses. Nuisance and extreme coastal flooding have increased due to sea level rise (SLR) superimposed upon high tides and storm surges in low-lying coastal and estuarine locations, including impacts on cultural sites, traditions and lifestyles of Aboriginal and Torres Strait Islander Peoples in Australia and Tangata Whenua Māori in New Zealand. Droughts have caused financial and emotional stress in farm households and rural communities. Tourism has been negatively affected by coral bleaching, fires, poor ski seasons and receding glaciers. Governments, business and communities have experienced major costs associated with extreme weather, droughts and sea level rise (SLR). {11.3, 11.4, 11.5.2, Table 11.2, Boxes 11.1–11.6}
Climate impacts are cascading and compounding across sectors and socioeconomic and natural systems (high confidence). Complex connections are generating new types of risks, exacerbating existing stressors and constraining adaptation options. An example is the impacts that cascade between interdependent systems and infrastructure in cities and settlements. Another example is the 2019–2020 southeast Australia wildfires, which burned 5.8 to 8.1 million hectares, with 114 listed threatened species losing at least half of their habitat and 49 losing over 80%, over 3,000 houses destroyed, 33 people killed, a further 429 deaths and 3230 hospitalisations due to cardiovascular or respiratory conditions, AUD$1.95 billion in health costs, AUD$2.3 billion in insured losses and AUD$3.6 billion in losses for tourism, hospitality, agriculture and forestry. {11.5.1, Box 11.1}
Increasing climate risks are projected to exacerbate existing vulnerabilities and social inequalities and inequities (high confidence). These include inequalities between Indigenous and non-Indigenous Peoples and between generations, rural and urban areas, incomes and health status, increasing the climate risks and adaptation challenges faced by some groups and places. Resultant climate change impacts include the displacement of some people and businesses and threaten social cohesion and community well-being. {11.3.5, 11.3.6, 11.3.10, 11.4}
Projected impacts and key risks
Further climate change is inevitable, with the rate and magnitude largely dependent on the emission pathway (very high confidence1 ). Ongoing warming is projected, with more hot days and fewer cold days (very high confidence). Further sea level rise (SLR), ocean warming and ocean acidification are projected (very high confidence). Less winter and spring rainfall is projected in southern Australia, with more winter rainfall in Tasmania, less autumn rainfall in southwestern Victoria and less summer rainfall in western Tasmania (medium confidence), with uncertain rainfall changes in northern Australia. In New Zealand, more winter and spring rainfall is projected in the west and less in the east and north, with more summer rainfall in the east and less in the west and central North Island (medium confidence). In New Zealand, ongoing glacier retreat is projected (very high confidenc e). More extreme fire weather is projected in southern and eastern Australia (high confidence) and over northern and eastern New Zealand (medium confidence). Increased drought frequency is projected for southern and eastern Australia and northern New Zealand (medium confidence). Increased heavy rainfall intensity is projected, with fewer tropical cyclones and a greater proportion of severe cyclones (medium confidence). {11.2.2, Table 11.3, Box 11.6}
Climate risks are projected to increase for a wide range of systems, sectors and communities, which are exacerbated by underlying vulnerabilities and exposures (high confidence) {11.3; 11.4}. Nine key risks have been identified, based on magnitude, likelihood, timing and adaptive capacity {11.6, Table 11.14}:
Ecosystems at critical thresholds, where recent climate change has caused significant damage and further climate change may cause irreversible damage, with limited scope for adaptation
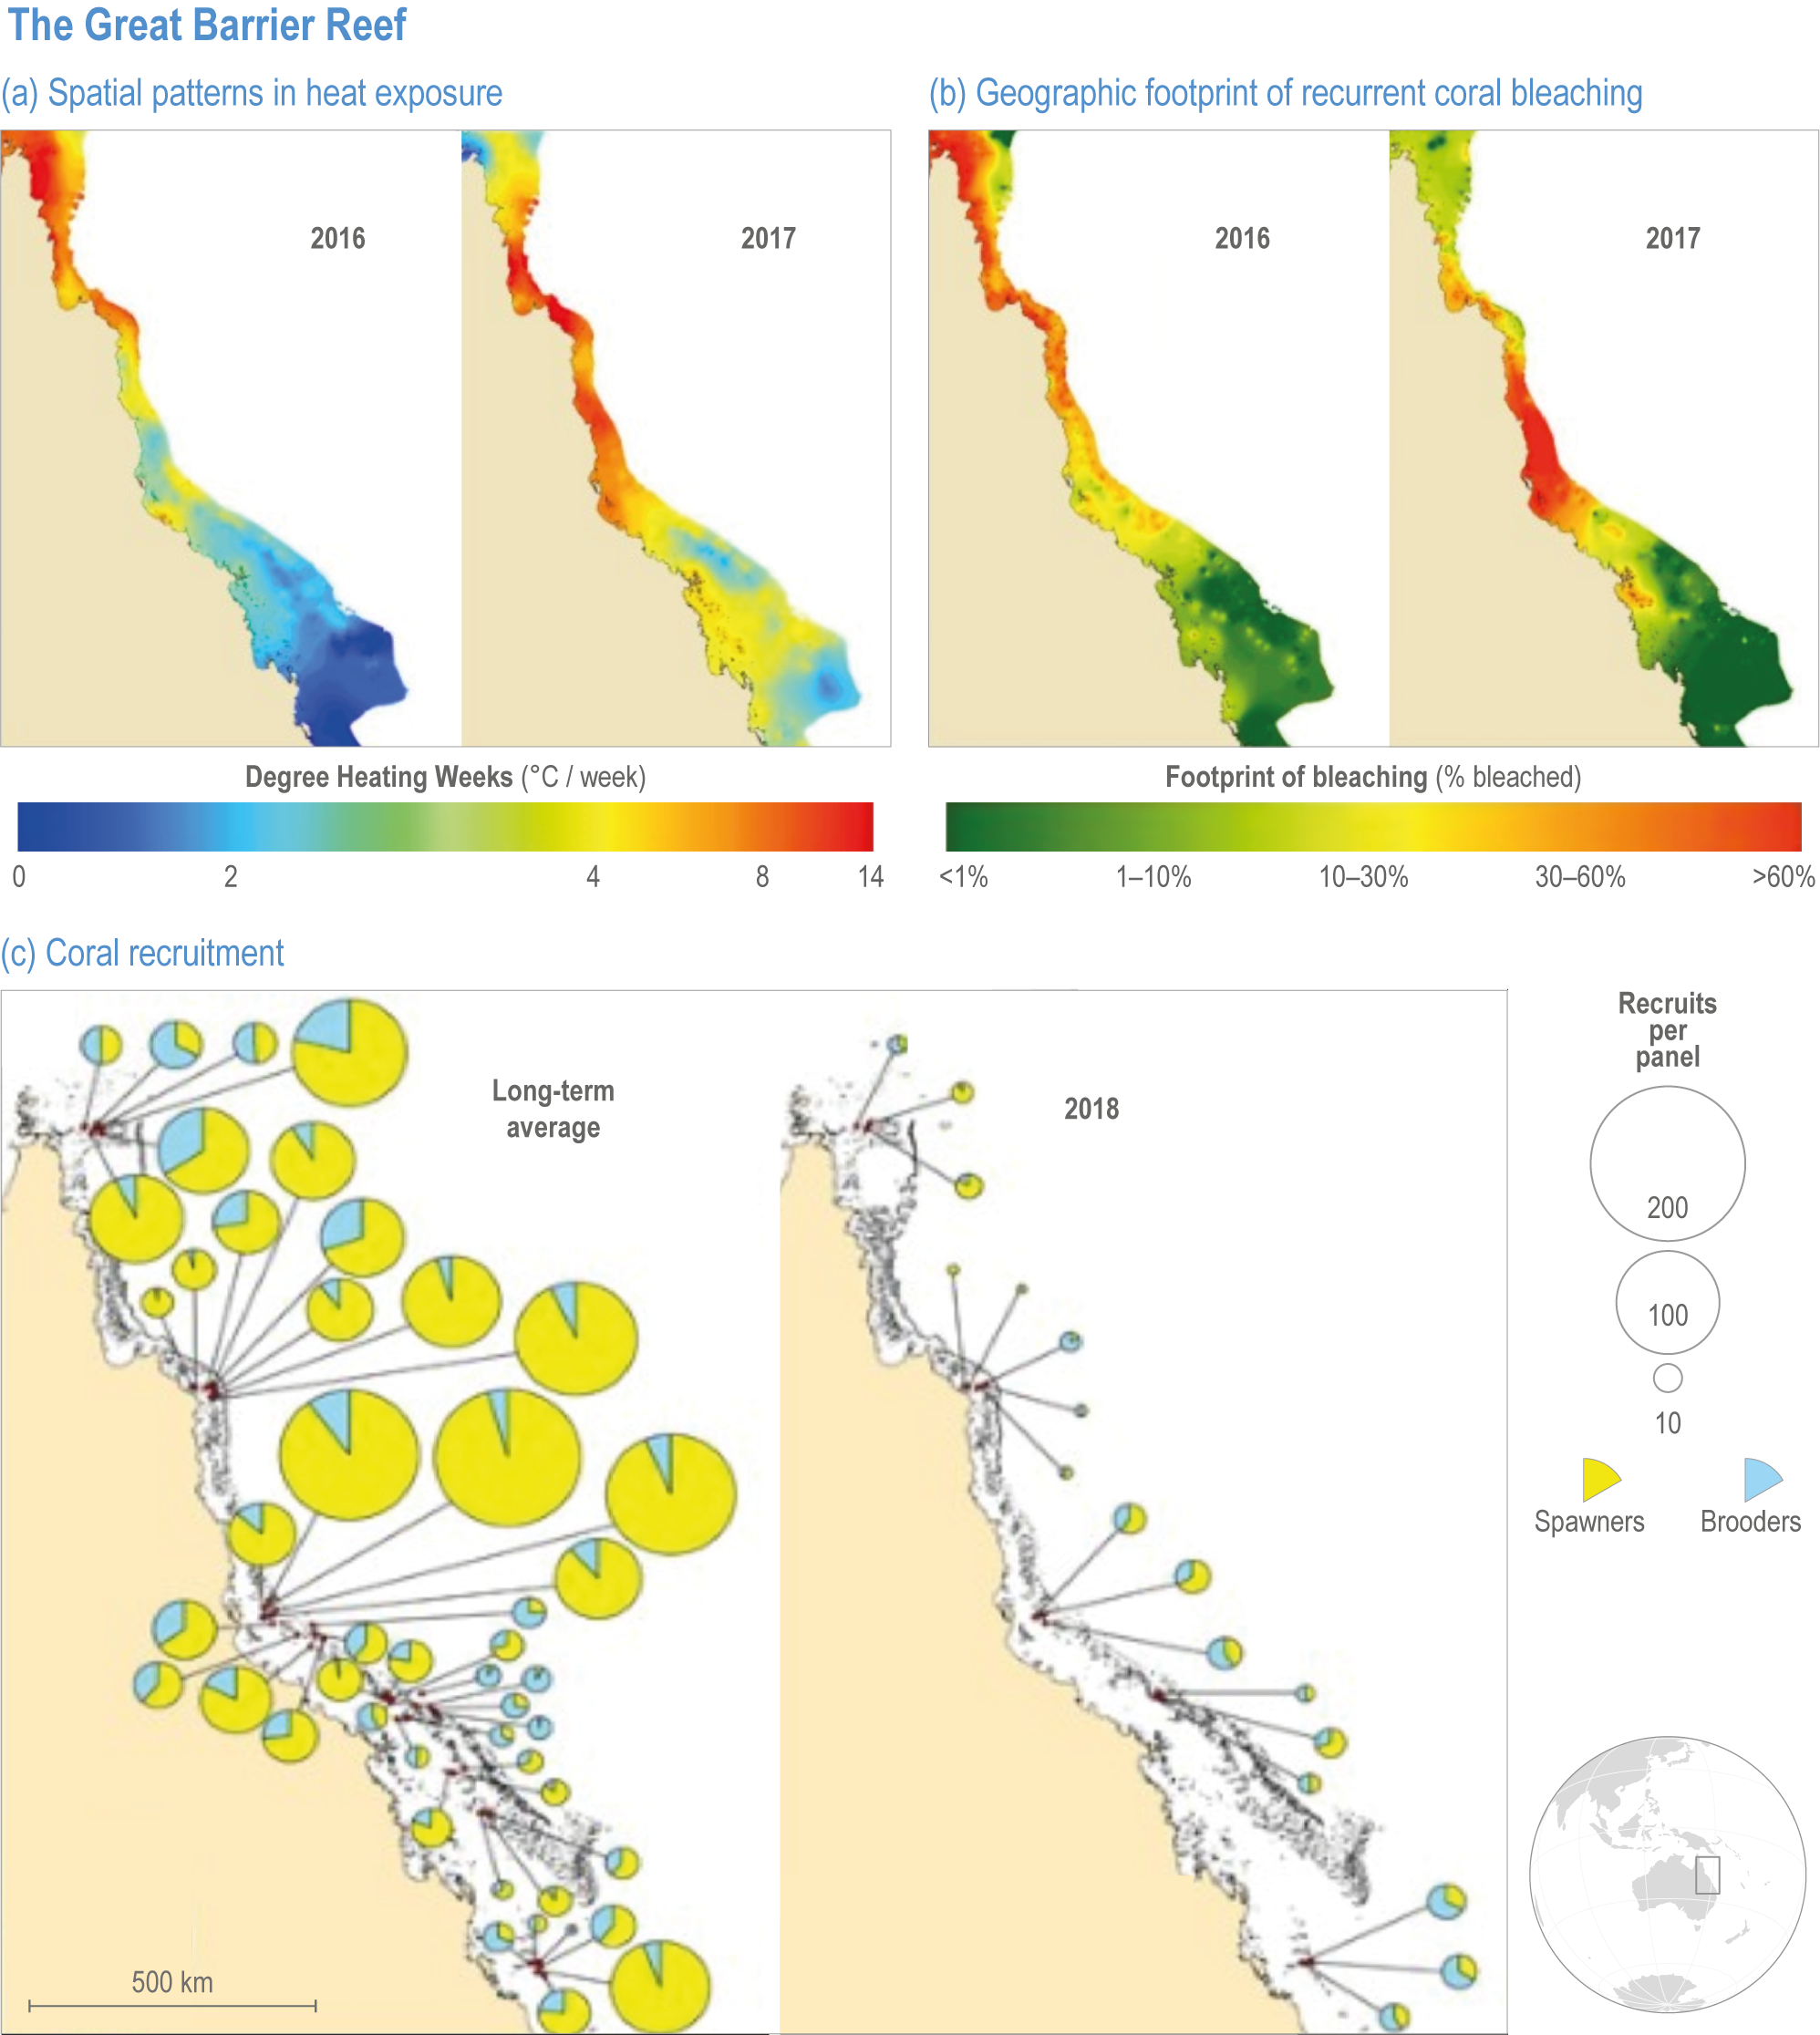
- Loss and degradation of coral reefs and associated biodiversity and ecosystem service values in Australia due to ocean warming and marine heatwaves. For example three marine heatwaves on the Great Barrier Reef (GBR) during 2016–2020 caused significant bleaching and loss (very high confidence). {11.3.2.1, 11.3.2.2, Box 11.2}
- Loss of alpine biodiversity in Australia due to less snow. For example loss of alpine vegetation communities (snow patch Feldmark and short alpine herb-fields) and increased stress on snow-dependent plant and animal species (high confidence). {11.3.1.1, 11.3.1.2}
Key risks that have potential to be severe but can be reduced substantially by rapid, large-scale and effective mitigation and adaptation
- Transition or collapse of alpine ash, snowgum woodland, pencil pine and northern jarrah forests in southern Australia due to hotter and drier conditions with more fires. For example declining rainfall in southern Australia over the past 30 years, has led to drought-induced canopy dieback across a range of forest and woodland types and death of fire-sensitive tree species due to unprecedented wildfires (high confidence). {11.3.1.1, 11.3.1.2}
- Loss of kelp forests in southern Australia and southeast New Zealand due to ocean warming, marine heatwaves and overgrazing by climate-driven range extensions of herbivore fish and urchins. For example less than 10% of giant kelp in Tasmania was remaining by 2011 due to ocean warming (high confidence). {11.3.2.1, 11.3.2.2}
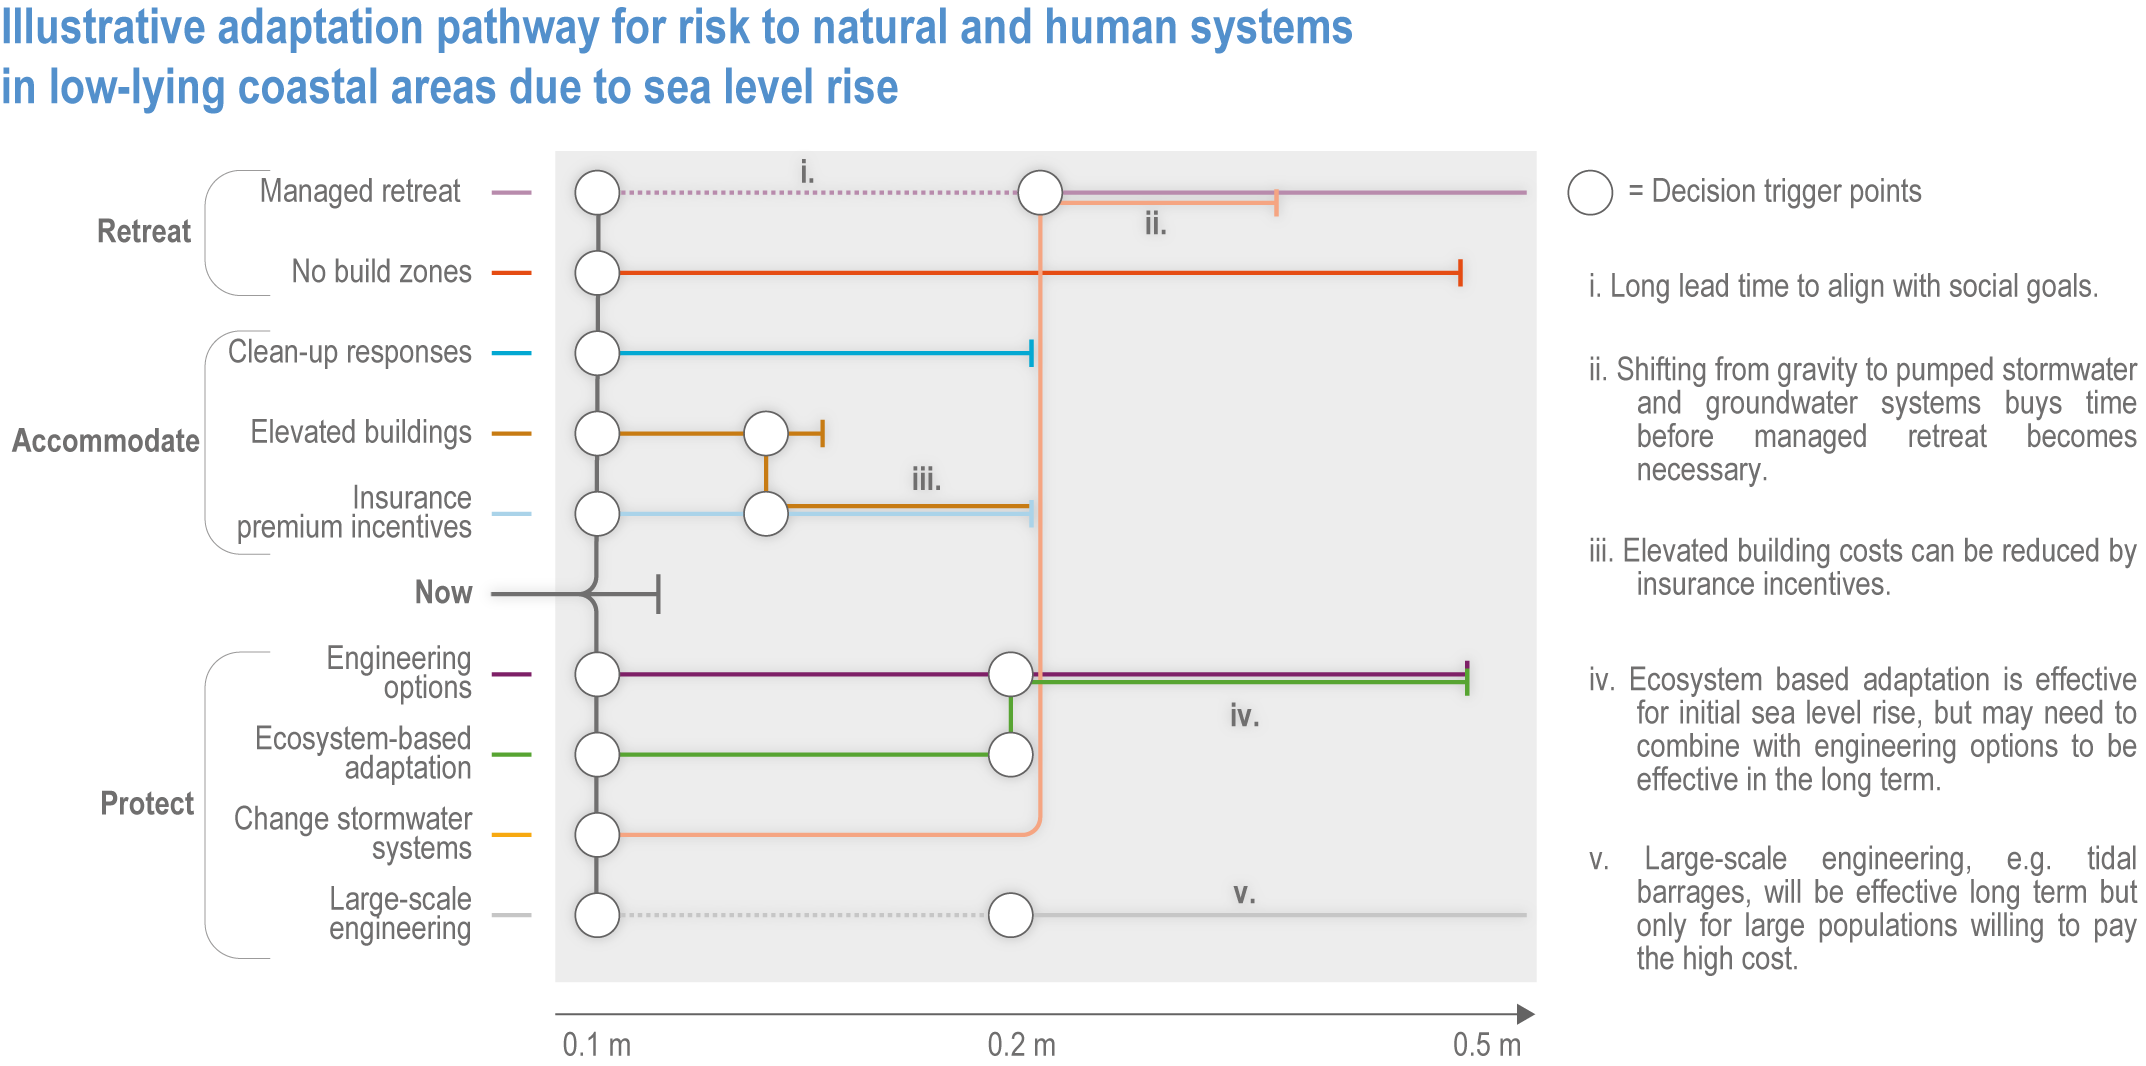
- Loss of natural and human systems in low-lying coastal areas due to sea level rise (SLR). For example for 0.5 m sea level rise (SLR), the value of buildings in New Zealand exposed to 1-in-100-year coastal inundation could increase by NZ$12.75 billion and the current 1-in-100-year flood in Australia could occur several times a year (high confidence). {11.3.5; Box 11.6}
- Disruption and decline in agricultural production and increased stress in rural communities in southwestern, southern and eastern mainland Australia due to hotter and drier conditions. For example by 2050, a decline in median wheat yields of up to 30% in southwestern Australia and up to 15% in South Australia and increased heat stress in livestock by 31–42 days per year (high confidence). {11.3.4; 11.3.5; Box 11.3}
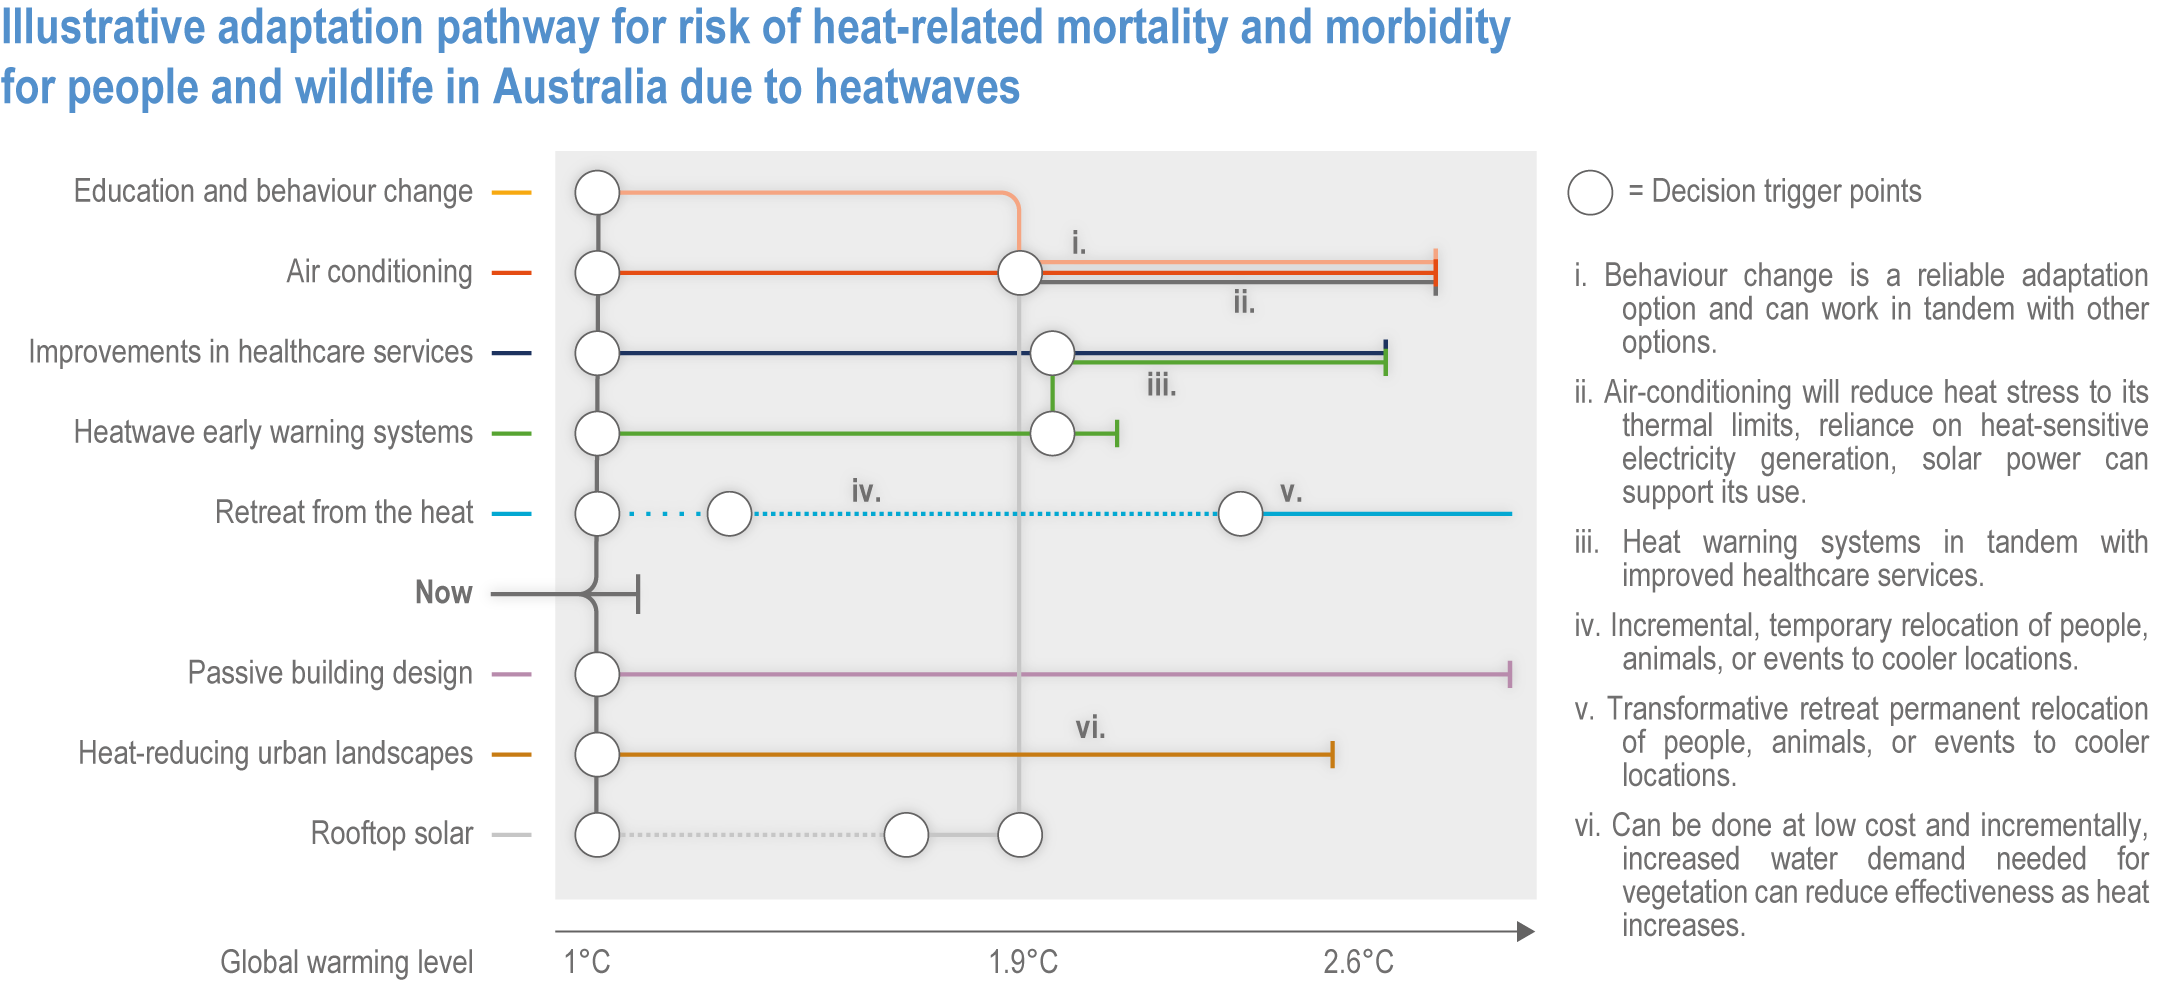
- Increase in heat-related mortality and morbidity for people and wildlife in Australia due to heatwaves. For example heat-related excess deaths in Melbourne, Sydney and Brisbane are projected to increase by about 300/year (low emission pathway) to 600/year (high emission pathway) during the 2031–2080 period relative to 142/year in the period 1971–2020 (high confidence). {11.3.1, 11.3.5.1, 11.3.5.2, 11.3.6.1, 11.3.6.2}
Key cross-sectoral and system-wide risk
- Cascading, compounding and aggregate impacts on cities, settlements, infrastructure, supply chains and services due to wildfires, floods, droughts, heatwaves, storms and sea level rise (SLR). For example in New Zealand, extreme snow, heavy rainfall and wind events have combined to impact road networks, power and water supply, interdependent wastewater and stormwater services and business activities (high confidence) {11.3.3, 11.5.1, 11.8.1}.
Key implementation risk
- Inability of institutions and governance systems to manage climate risks. For example the scale and scope of projected climate impacts overwhelm the capacity of institutions, organisations and systems to provide necessary policies, services, resources and coordination to address socioeconomic impacts (high confidence) {11.5.1.2, 11.5.1.3, 11.5.2.3, 11.7.1, 11.7.2, 11.7.3}.
There are important interactions between mitigation and adaptation policies and their implementation (high confidence). Integrated policies in interdependent systems across biodiversity, water quality, water availability, energy, transport, land use and forestry for mitigation can support synergies between adaptation and mitigation. These have co-benefits for the management of land use, water and associated conflicts and for the functioning of cities and settlements. For example, projected increases in fire, drought, pest incursions, storms and wind place forests at risk and affect their ongoing role in meeting New Zealand’s emissions reduction goals. {11.3.4.3, 11.3.10.2, 11.3.5.3, Box 11.5}
Challenges and solutions
The ambition, scope and progress of the adaptation process have increased across governments, non-government organisations, businesses and communities (high confidence). This process includes vulnerability and risk assessments, identification of strategies and options, planning, implementation, monitoring, evaluation and review. Initiatives include legislated institutional frameworks for risk assessment and national adaptation planning and monitoring in New Zealand, a National Recovery and Resilience Agency and National Disaster Risk Reuction Framework in Australia, deployment of new national guidance, decision tools, collaborative governance approaches and the introduction of climate risk and disclosure regimes for the private sector. The focus, however, has been on adaptation planning, rather than on implementation. {11.5.1, 11.7.1.1, Box 11.6, Table 11.15a, Table 11.15b, Table 11.17}
Adaptation progress is uneven, due to gaps, barriers and limits to adaptation and adaptive capacity deficits (very high confidence). Progress in adaptation planning, implementation, monitoring and evaluation is lagging. Barriers include lack of consistent policy direction, competing objectives, divergent risk perceptions and values, knowledge constraints, inconsistent information, fear of litigation, up-front costs and lack of engagement, trust and resources. Adaptation limits are being approached for some species and ecosystems. Adaptive capacity to address the barriers and limits can be built through greater engagement with groups and communities to build trust and social legitimacy through the inclusion of diverse values, including those of Aboriginal and Torres Strait Islander Peoples and Tangata Whenua Māori. {11.4, 11.5, 11.6, 11.7, 11.8, Table 11.4, Table 11.5, Table 11.6, Table 11.16, Box 11.2}
A range of incremental and transformative adaptation options and pathways is available as long as enablers are in place to implement them (high confidence). Key enablers for effective adaptation include shifting from reactive to anticipatory planning, integration and coordination across levels of government and sectors, inclusive and collaborative institutional arrangements, government leadership, policy alignment, nationally consistent and accessible information and decision-support tools, along with adaptation funding and finance, and robust, consistent and strategic policy commitment. Over 75% of people in Australia and New Zealand agree that climate change is occurring and over 60% believe climate change is caused by humans, giving climate adaptation and mitigation action further social legitimacy. {11.7.3, Table 11.17}
New knowledge on system complexity, managing uncertainty and how to shift from reactive to adaptive implementation is critical for accelerating adaptation (high confidence). Priorities include a greater understanding of impacts on natural system dynamics; the exposure and vulnerability of different groups within society, including Indigenous Peoples; the relationship between mitigation and adaptation; the effectiveness and feasibility of different adaptation options; the social transitions needed for transformative adaptation; and the enablers for new knowledge to better inform decision-making (e.g., monitoring data repositories, risk and vulnerability assessments, robust planning approaches, sharing adaptation knowledge and practice). {11.7.3.3}
Aboriginal and Torres Strait Islander Peoples and Tangata Whenua Māori can enhance effective adaptation t hrough the passing down of knowledge about climate change planning that promotes collective action and mutual support across the region (high confidence). Supporting Aboriginal and Torres Strait Islander Peoples and Tangata Whenua Māori institutions, knowledge and values enable self-determination and create opportunities to develop adaptation responses to climate change. Actively upholding the UN Declaration on the Rights of Indigenous Peoples and Māori interests under the Treaty of Waitangi at all levels of government enables intergenerational approaches for effective adaptation. {11.3, 11.4, 11.6, 11.7.3; Cross-Chapter Box INDIG in Chapter 18}
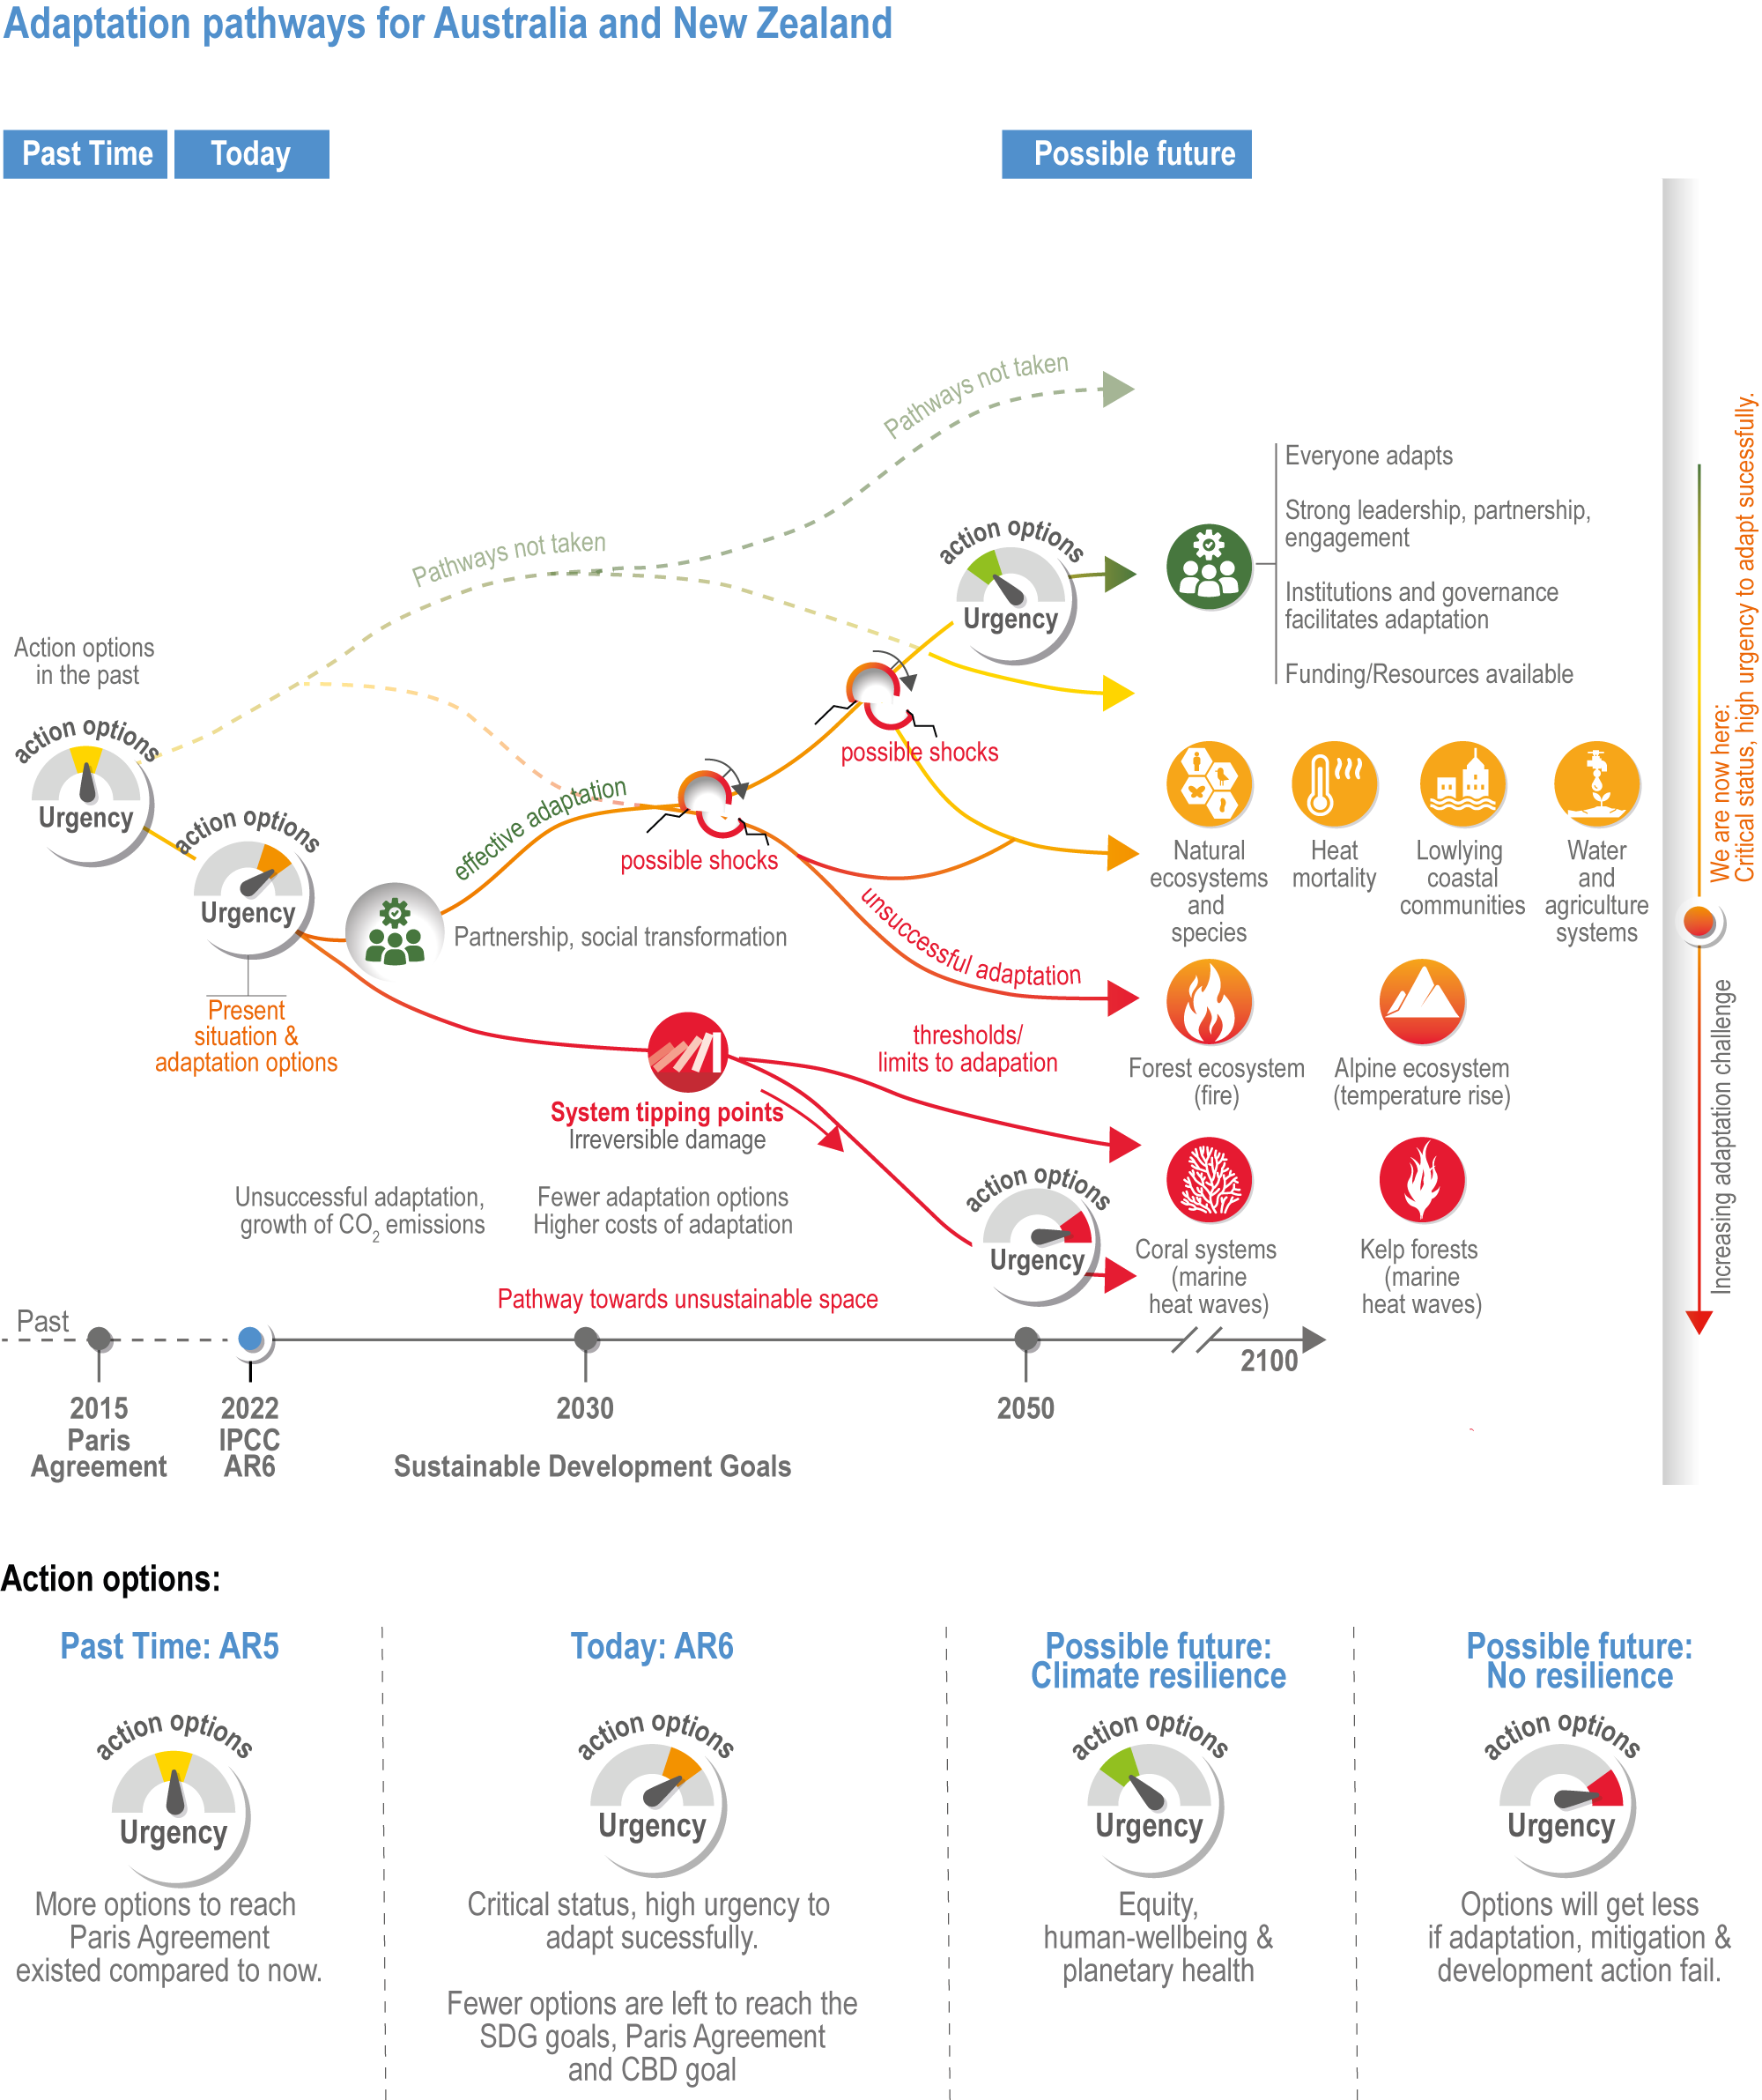
A step change in adaptation is needed to match the rising risks and to support climate resilient development (very high confidence). Current adaptation is largely incremental and reactive. A shift to transformative and proactive adaptation can contribute to climate resilient development. The scale and scope of cascading, compounding and aggregate impacts require new, larger-scale and timely adaptation. Monitoring and evaluation of the effectiveness of adaptation progress and continual adjustment is critical. The transition to climate resilient development pathways can generate major co-benefits, but complex interactions between objectives can create trade-offs. {11.7, 11.8.1, 11.8.2}
Delay in implementing adaptation and emission reductions will impede climate resilient development, resulting in more costly climate impacts and greater scale of adjustments (very high confidence). The region faces an extremely challenging future. Reducing the risks would require significant and rapid emission reductions to keep global warming to 1.5°C–2.0°C, as well as robust and timely adaptation. The projected warming under current global emissions reduction policies would leave many of the region’s human and natural systems at very high risk and beyond adaptation limits. {11.8, Table 11.1, Table 11.14, Figure 11.6}
11.1 Introduction
This chapter assesses the observed impacts, projected risks, vulnerability and adaptation, and the implications for climate resilient development for the Australasia region, based on the literature published up to 1 September 2021. It should be read in conjunction with other Working Group (WG) II chapters, the climate science assessment in the WGI report and the greenhouse gas emissions and mitigation assessment in the WGIII report.
11.1.1 Context
The Australasia region is defined as the Exclusive Economic Zones (EEZs) and territories of Australia and New Zealand. In both countries, climate adaptation is largely implemented at a sub-national level through the devolution of functions constitutionally or by statute, alongside disaster risk reduction (COAG, 2011; Lawrence et al., 2015; Macintosh et al., 2015).
Australia’s economy is dominated by financial and insurance services, education, mining, construction, tourism, health care and social assistance (ABS, 2018) with Australian exports accruing mostly from mining (ABS, 2018; ABS, 2019). In New Zealand, service industries, including tourism, collectively account for around two-thirds of GDP (NZ Treasury, 2016). The primary sector contributes 6% of New Zealand’s GDP and over half of the country’s export earnings (NZ Treasury, 2016).
Existing vulnerabilities expose and exacerbate inequalities between rural, regional and urban areas, Indigenous and non-Indigenous Peoples, those with health and disability needs, and between generations, incomes and health status, increasing the relative climate change risk faced by some groups and places (high confidence) (Jones et al., 2014; Bertram, 2015; Perry, 2017; Hazledine and Rashbrooke, 2018).
Previous IPCC reports (Table 11.1) have documented observed climate impacts, projected risks, adaptation challenges and opportunities. This chapter presents more evidence of observed climate impacts and adaptation, better quantification of socioeconomic risks, new information about cascading and compounding risks, greater emphasis on adaptation enablers and barriers, and links to climate resilient development.
Table 11.1 | Summary of key conclusions from the IPCC 5th Assessment Report (AR5) Australasia chapter (Reisinger et al., 2014) and relevant conclusions from the IPCC Special Reports on Global Warming of 1.5°C (IPCC, 2018), Climate Change and Land (IPCC, 2019a) and Oceans and Cryosphere (IPCC, 2019b).
Conclusions | Report |
Our regional climate is changing (very high confidence) and warming will continue through the 21st century (virtually certain) with more hot days, fewer cold days, less snow, less rainfall in southern Australia and the northeast of both of New Zealand’s islands, more rainfall in western New Zealand, more extreme rainfall, SLR, increased fire weather in southern Australia and across New Zealand and fewer cyclones but a greater proportion of intense cyclones. | |
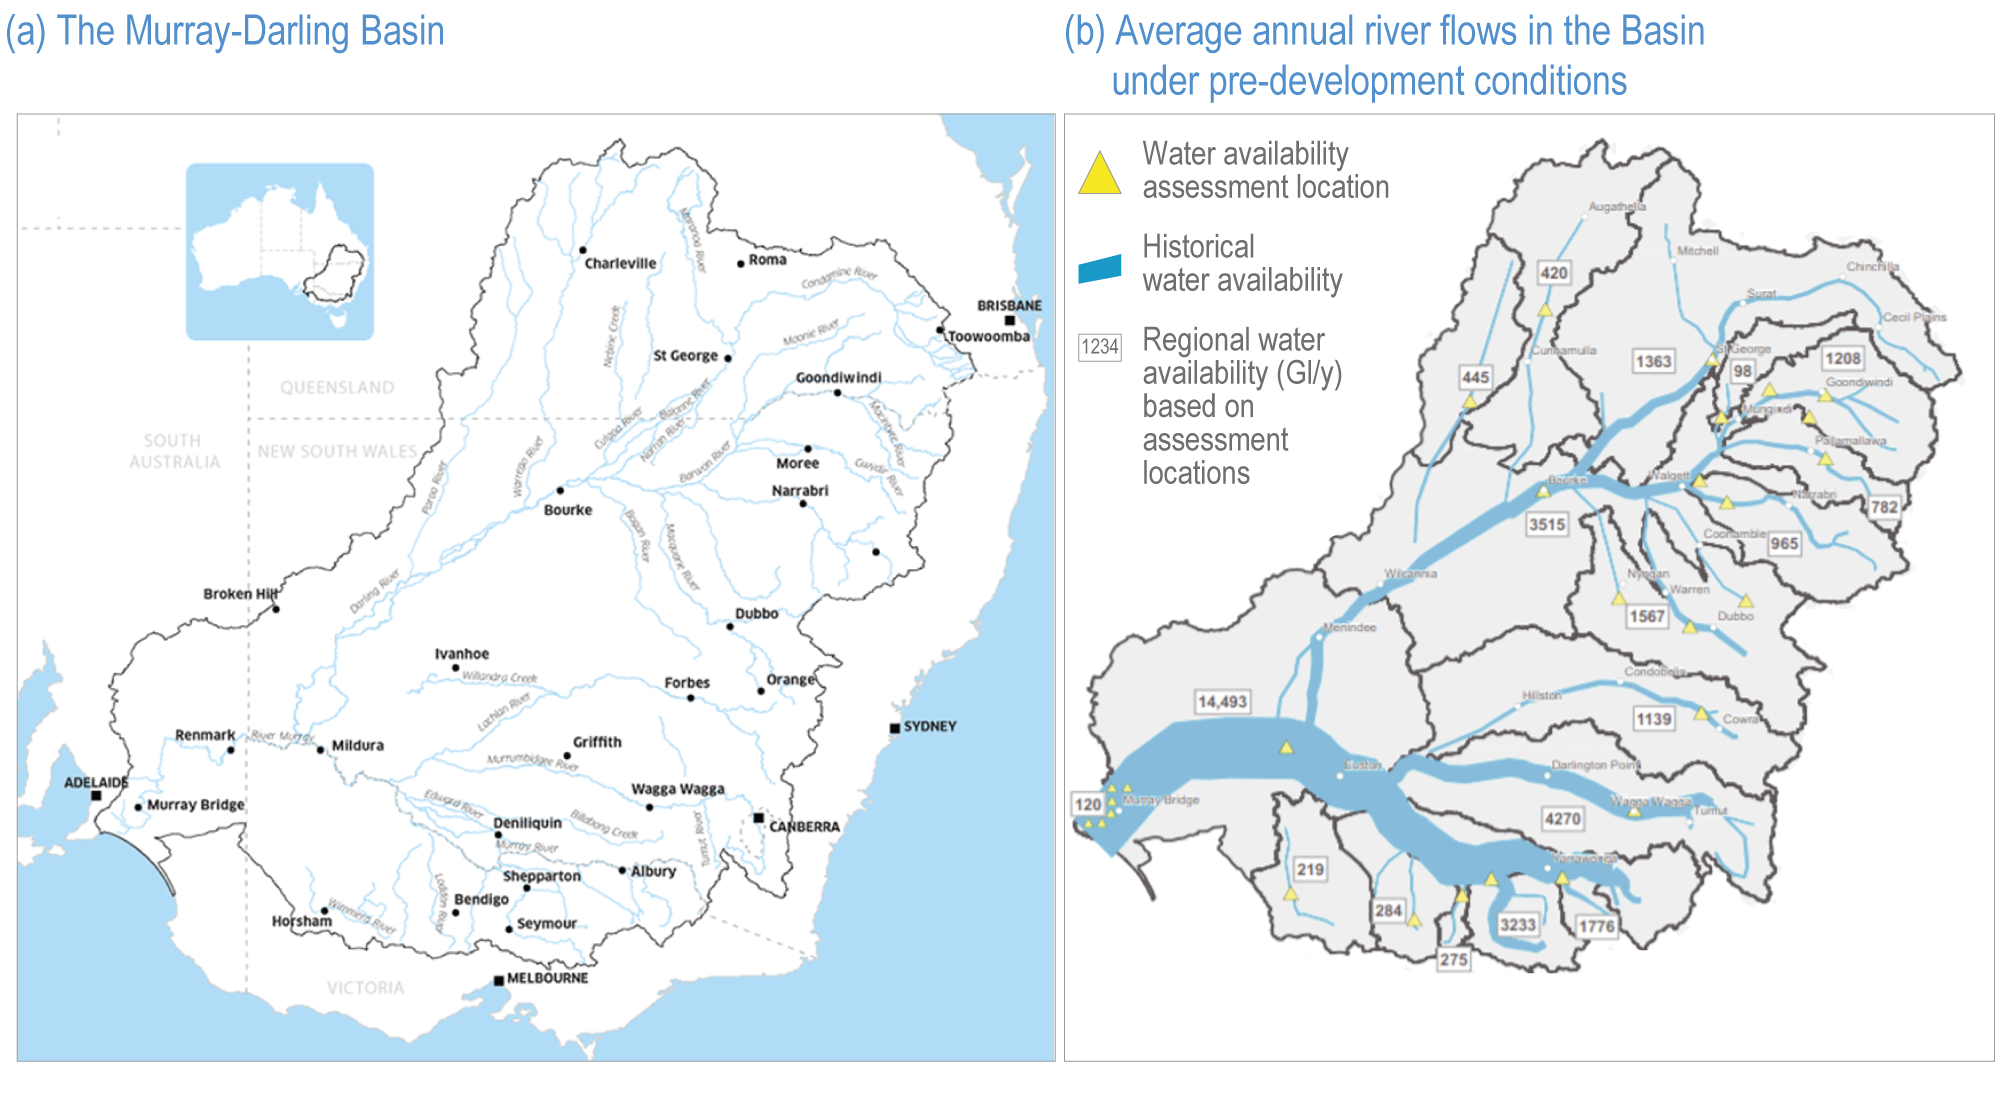
Key risks include changes in the structure and composition of Australian coral reefs, loss of montane ecosystems, increased flood damage, reduced water resources in southern Australia, more deaths and infrastructure damage during heatwaves, more fire-related impacts on ecosystems and settlements in southern Australia and across New Zealand, greater risk to coastal infrastructure and ecosystems and reduced water availability in the Murray-Darling Basin (MDB) and southern Australia (high confidence). Benefits are projected for some sectors and locations (high confidence), including reduced winter mortality and energy demand for heating, increased forest growth and enhanced pasture productivity. | |
Adaptation is occurring and becoming mainstreamed in some planning processes (high confidence). Adaptive capacity is considered generally high in many human systems, but adaptation implementation faces major barriers, especially for transformational responses (high confidence). Some synergies and trade-offs exist between different adaptation responses and between mitigation and adaptation, with interactions occurring both within and outside the region (very high confidence). | |
Vulnerability remains uncertain due to incomplete consideration of socioeconomic dimensions (very high confidence), including governance, institutions, patterns of wealth and ageing, access to technology and information, labour force participation and societal values. | |
Emissions reductions under Nationally Determined Contributions from signatories to the Paris Agreement are consistent with a global warming of 2.5°C–3.0°C above pre-industrial temperatures by 2100. Much deeper emission reductions are needed prior to 2030 to limit warming to 1.5°C. There are limits to adaptation and adaptive capacity for some human and natural systems at global warming of 1.5°C, with associated losses. | |
Climate impacts will disproportionately affect the welfare of impoverished and vulnerable people because they lack adaptation resources. Strengthening the climate-action capacities of national and sub-national authorities, civil society, the private sector, Indigenous People and local communities can support implementation of actions. | |
Land-related responses that contribute to climate change adaptation and mitigation can also combat desertification and land degradation and enhance food security. | |
Appropriate design of policies, institutions and governance systems at all scales can contribute to land-related adaptation and mitigation while facilitating the pursuit of climate-adaptive development pathways. | |
Mutually supportive climate and land policies have the potential to save resources, amplify social resilience, support ecological restoration and foster collaboration between stakeholders. | |
Near-term action to address climate change adaptation and mitigation, desertification, land degradation and food security can bring social, ecological, economic and development co-benefits. Delaying action (both mitigation and adaptation) will be more costly. | |
The rate of global mean SLR of 3.6 mm yr −1 for 2006–2015 is unprecedented over the last century. Extreme wave heights, coastal erosion and flooding have increased in the Southern Ocean by around 1.0 cm yr −1 over the period 1985–2018. | |
Some species of plants and animals have increased in abundance, shifted their range and established in new areas as glaciers receded and the snow-free season lengthened. Some cold-adapted or snow-dependent species have declined in abundance, increasing their risk of extinction, notably on mountain summits. | |
Many marine species have shifted their range and seasonal activities. Altered interactions between species have caused cascading impacts on ecosystem structure and functioning. | |
Mean SLR projections are higher by 0.1 m compared to AR5 under RCP8.5 in 2100. Extreme sea level events that are historically rare (once per century) are projected to occur frequently (at least once yr −1) at many locations by 2050. | |
Projected ecosystem responses include losses of species habitat and diversity and degradation of ecosystem functions. Warm water corals are at high risk already and are projected to transition to very high risk even if global warming is limited to 1.5°C. | |
Governance arrangements (e.g., marine protected areas, spatial plans and water management systems) are too fragmented across administrative boundaries and sectors to provide integrated responses to the increasing and cascading risks. Financial, technological, institutional and other barriers exist for implementing responses. | |
Enabling climate resilience and sustainable development depends critically on urgent and ambitious emissions reductions coupled with coordinated, sustained and increasingly ambitious adaptation actions. This includes better cooperation and coordination among governing authorities, education and climate literacy, sharing of information and knowledge, finance, addressing social vulnerability and equity, and institutional support. |
11.1.2 Economic, Demographic and Social Trends
Economic, demographic and sociocultural trends influence the exposure, vulnerability and adaptive capacity of individuals and communities (high confidence) (Elrick-Barr et al., 2016; Smith et al., 2016; Hayward, 2017; B. Frame et al., 2018; Plummer et al., 2018; Smith et al., 2018; Gartin et al., 2020). In the absence of proactive adaptation, climate change impacts are projected to worsen inequalities between Indigenous and non-Indigenous peoples and other vulnerable groups (Green et al., 2009; Manning et al., 2014; Ambrey et al., 2017) (high confidence). Socioeconomic inequality, low incomes and high levels of debt, poor health and disabilities increase vulnerability and limit adaptation (Hayward, 2012) (11.7.2). A lack of services, such as schools and medical services, in poorer and rural areas and decision-making processes that privilege some voices over others exacerbate inequalities (Kearns et al., 2009; Hinkson and Vincent, 2018).
Changes to the composition and location of different demographic groups in the region contribute to increased exposure or vulnerability to climate change (medium confidence). Australia’s population reached 25 million in 2018 and is projected to grow to 37.4–49.2 million by 2066, with most growth in major cities (accounting for 81% of Australia’s population growth from 2016 to 2017) (ABS, 2018), although COVID-19 is expected to slow the growth rate (CoA, 2020c). The highest growth rates outside of major cities occurred mostly in coastal regions (ABS, 2017), which have built assets exposed to sea level rise (SLR). New Zealand’s population was 5.1 million at the end of 2020 and is projected to increase to 6.0–6.5 million by 2068, assuming no marked changes in migration patterns (Stats NZ, 2016; Stats NZ, 2021). Although the population densities of both countries are much lower than other OECD countries, they are highly urbanised with over 86% living in urban areas in both countries (Productivity Commission, 2017; World Bank, 2018). This proportion is projected to increase to over 90% by 2050 (UN DESA, 2019) mostly in coastal areas (Rouse et al., 2017). Consideration of climate change impacts when planning and managing such growth and associated infrastructure could help avoid new vulnerabilities being created, particularly from wildfires, sea level rise (SLR), heat stress and flooding.
The region has an increasingly diverse population through the arrival of migrants, including those from the Pacific, whose innovations, skills and transnational networks enhance their and others’ adaptive capacity (De et al., 2016; Fatorić et al., 2017; Barnett and McMichael, 2018), although language barriers and socioeconomic disadvantage can create vulnerabilities for some (11.7.2).
Climate change inaction exacerbates intergenerational inequity, including prospects for the current younger population (Hayward, 2012). Increasing transient worker populations (ABS, 2018) may diminish social networks and adaptive capacity (Jiang et al., 2017). The region has an ageing population and increasing numbers of people living on their own who are highly vulnerable to extreme events, including heat stress and flooding (Zhang et al., 2013).
Socioeconomic trends are affected by global mega trends (KPMG, 2021), which are expected to influence the region’s ability to implement climate change adaptation strategies (World Economic Forum, 2014). Digital technological advances have potential benefits for building adaptive capacity (Deloitte, 2017a).
11.2 Observed and Projected Climate Change
11.2.1 Observed Climate Change
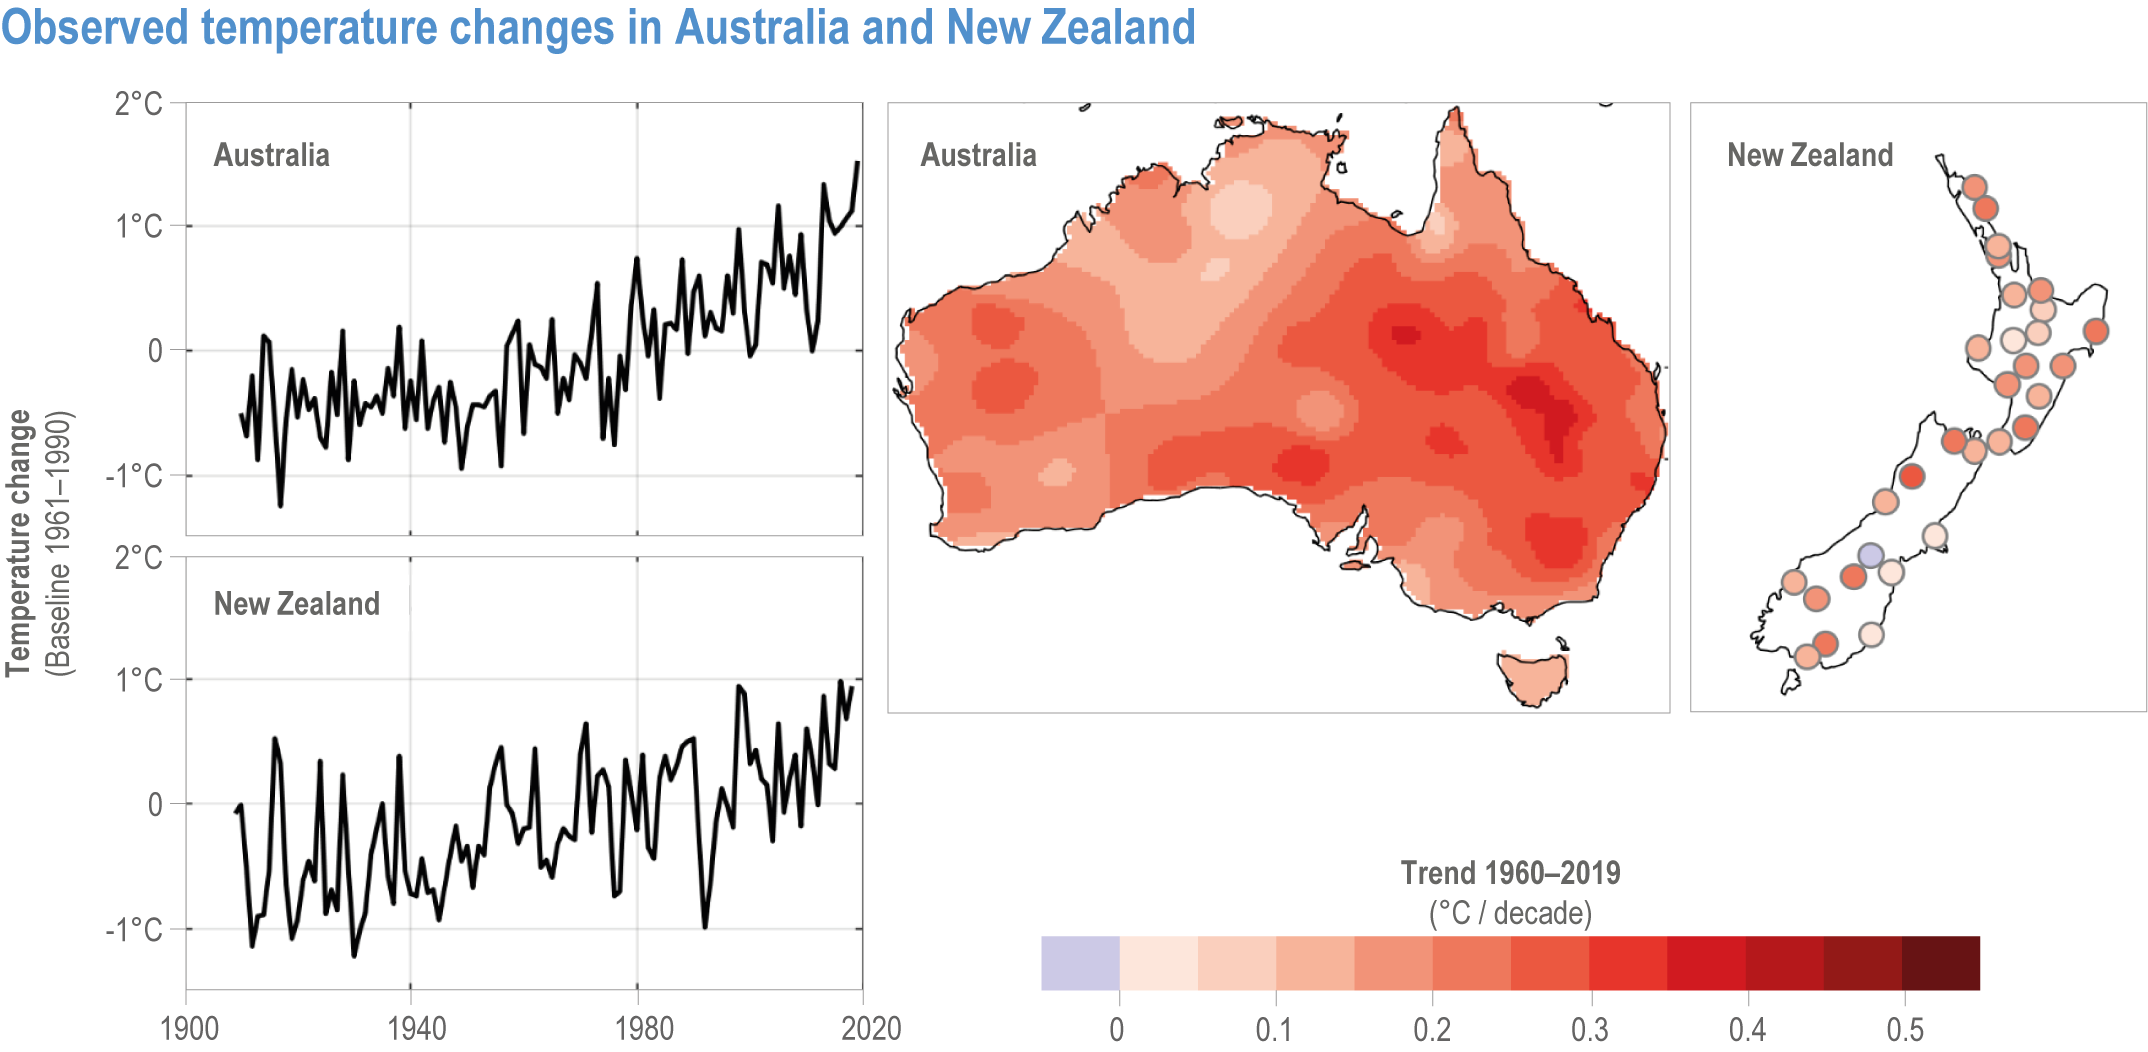
Regional climate change has continued since AR5 was released in 2014, with trends exacerbating many extreme events (very high confidence). The following changes are quantified with references in Tables 11.2a and 11.2b. The region has continued to warm (Figure 11.1), with more extremely high temperatures and fewer extremely low temperatures. Snow depths and glacier volumes have declined. Sea level rise and ocean acidification have continued. Northern Australia has become wetter, while April–October rainfall has decreased in south-western and south-eastern Australia. In New Zealand, most of the south has become wetter, while most of the north has become drier (Figure 11.2). The frequency, severity and duration of extreme fire weather conditions have increased in southern and eastern Australia and eastern New Zealand. Changes in extreme rainfall are mixed. There has been a decline in tropical cyclone frequency near Australia.

Figure 11.1 | Observed temperature changes in Australia and New Zealand. Annual temperature change time series are shown for 1910–2019. Mean annual temperature trend maps are shown for 1960–2019 using contours for Australia and individual sites for New Zealand. Data courtesy of BOM and NIWA.
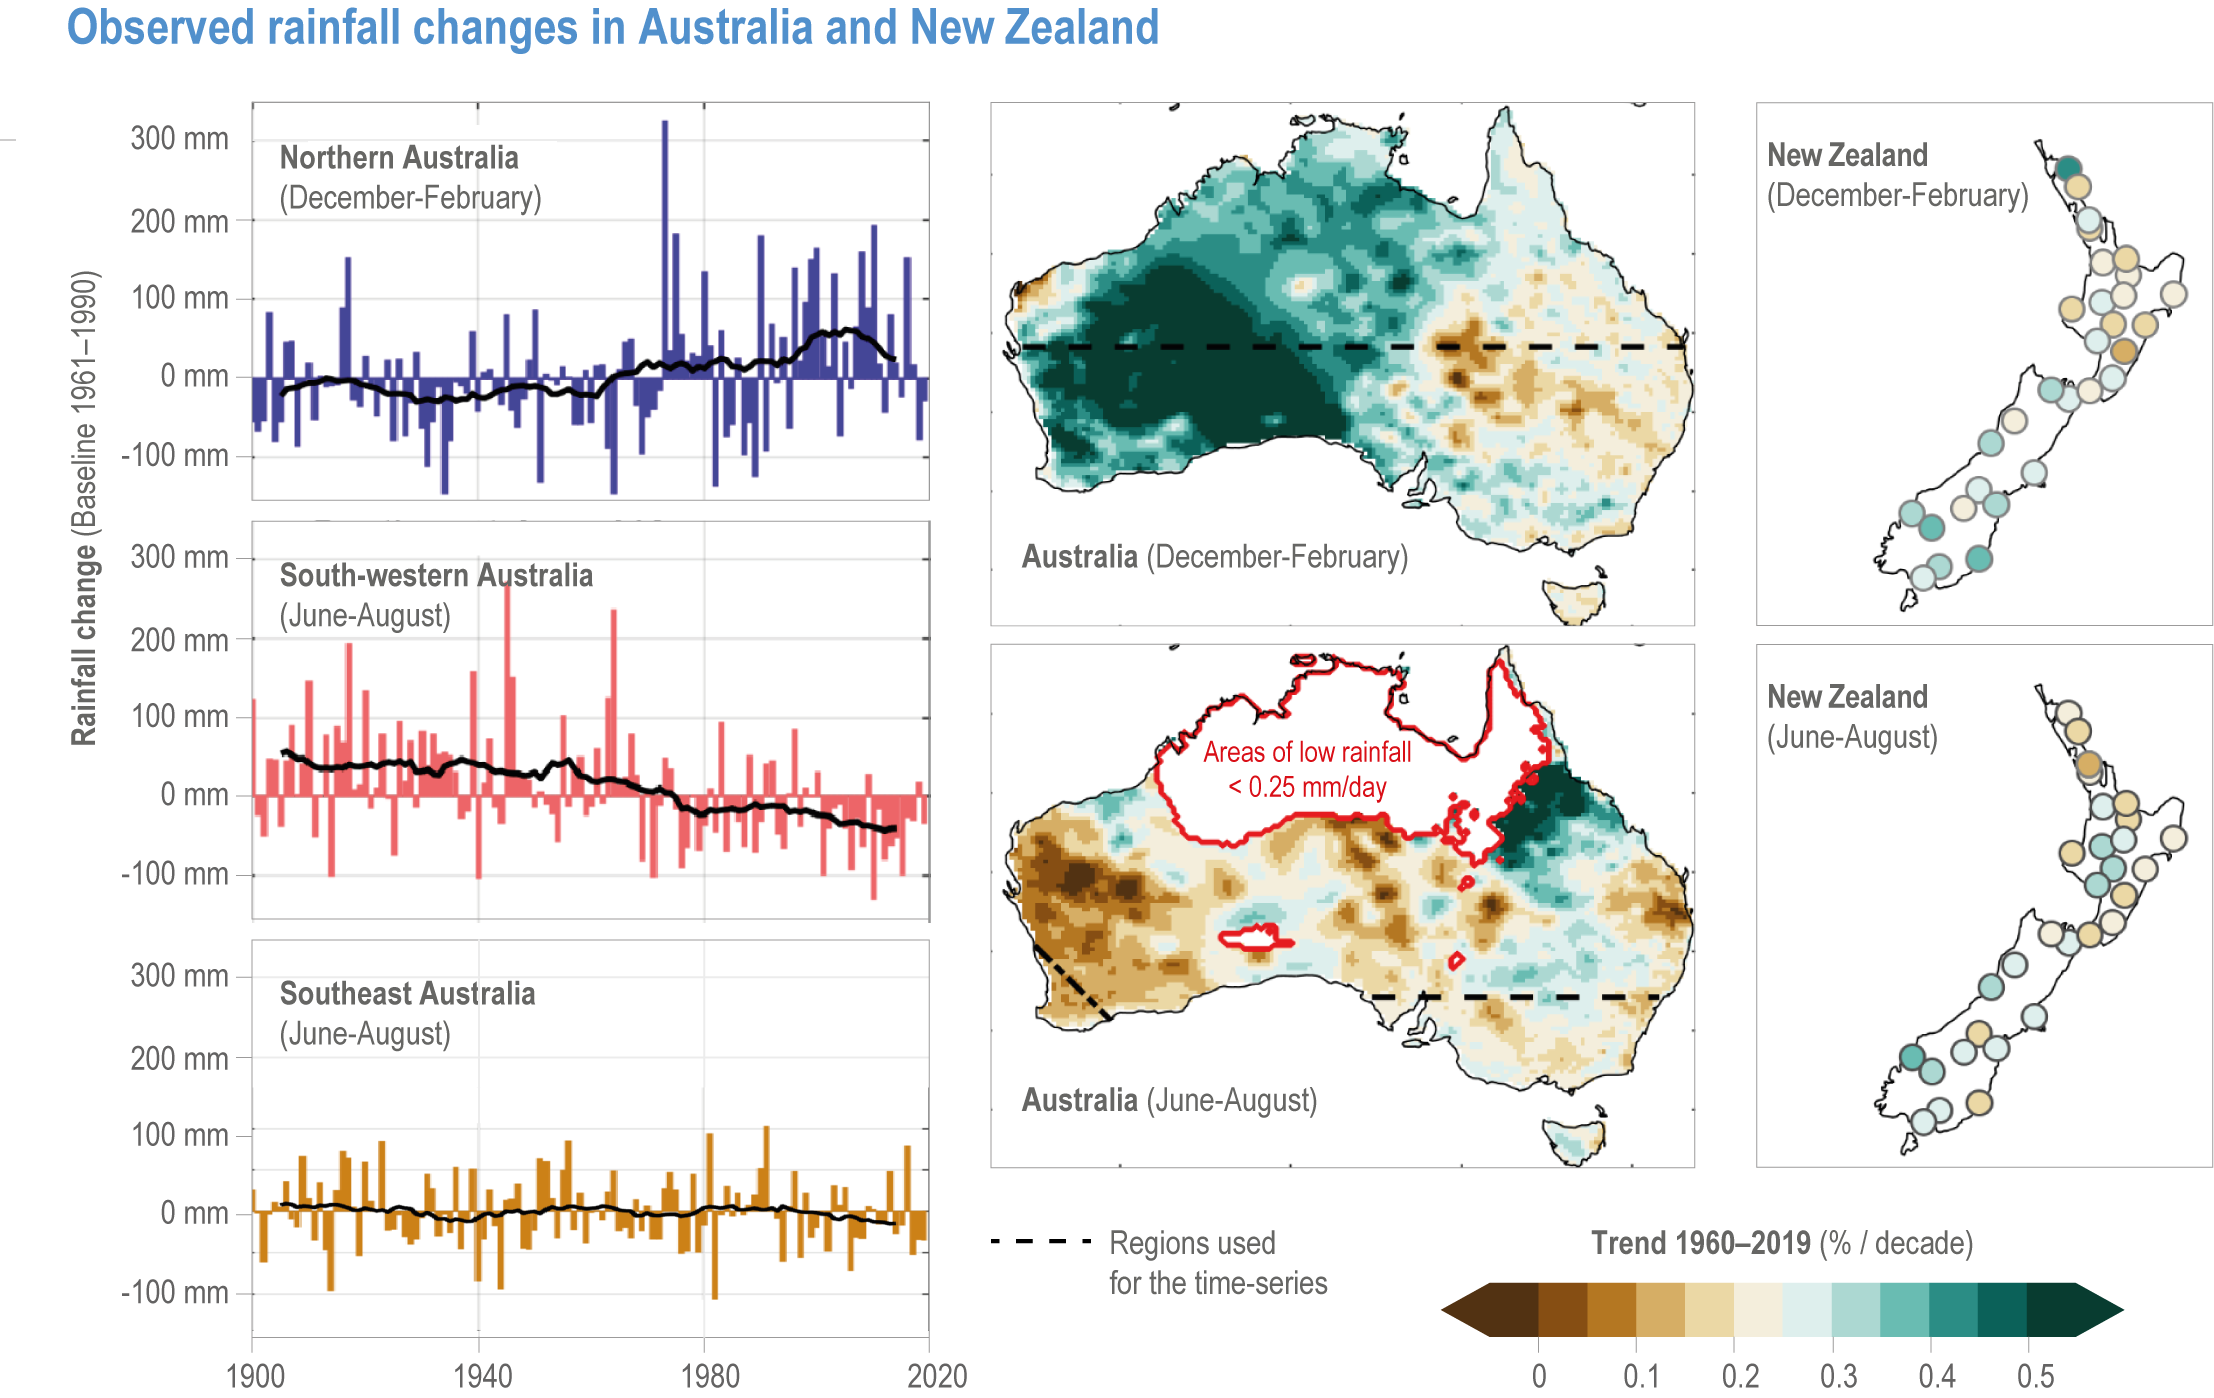
Figure 11.2 | Observed rainfall changes in Australia and New Zealand. Rainfall change time series for 1900–2019 are shown for Northern Australia (December–February: DJF), southwest Australia (June–August: JJA) and southeast Australia (JJA). Dashed lines on the maps for Australia show regions used for the time series. Rainfall trend maps are shown for 1960–2019 (DJF and JJA) using contours for Australia and individual sites for New Zealand. Areas of low Australian rainfall (less than 0.25 mm/day) are shaded white in JJA. Data courtesy of BOM and NIWA.
Reliable measurements are limited for some types of storms, particularly thunderstorms, lightning, tornadoes and hail (Walsh et al., 2016). Many high-impact events are a combination of interacting physical processes across multiple spatial and temporal scales (e.g., fires, heatwaves and droughts), and better understanding of these extreme and compound events is needed (Zscheischler et al., 2018).
Some of the observed trends and events can be partly attributed to anthropogenic climate change, as documented in Chapter 16. Examples include regional warming trends and sea level rise (SLR), terrestrial and marine heatwaves, declining rainfall and increasing fire weather in southern Australia and extreme rainfall and severe droughts in New Zealand.
11.2.2 Projected Climate Change
There are three main sources of uncertainty in climate projections: emission scenarios, regional climate responses and internal climate variability (CSIRO and BOM, 2015). Emission scenario uncertainty is captured in Representative Concentration Pathways (RCPs) for greenhouse gases and aerosols. RCP2.6 represents low emissions, RCP4.5 medium emissions and RCP8.5 high emissions. Regional climate response uncertainty and internal climate variability uncertainty are captured in climate model simulations driven by the RCPs.
Further climate change is inevitable, with the rate and magnitude largely dependent on the emission pathway (very high confidence) (IPCC, 2021). Preliminary projections based on Climate Model Intercomparison Project Phase 6 (CMIP6) models are described in the IPCC Working Group I Atlas. For Australia, the CMIP6 projections broadly agree with CMIP5 projections except for a group of CMIP6 models with greater warming and a narrower range of summer rainfall change in the north and winter rainfall change in the south (Grose et al., 2020). For New Zealand, the CMIP6 projections are similar to CMIP5, but the CMIP6 models indicate greater warming, a smaller increase in summer precipitation and a larger increase in winter precipitation (Gutiérrez et al., 2021).
Dynamical and statistical downscaling offer the prospect of improved representation of regional climate features and extreme weather events (IPCC 2021: Working Group I Chapter 10 (Doblas-Reyes et al., 2021)), but the added value of downscaling is complex to evaluate (Ekström et al., 2015; Rummukainen, 2015; Virgilio et al., 2021). Downscaled simulations are available for New Zealand (MfE, 2018) and various Australian regions (Gutiérrez et al., 2021). Further downscaling was recommended by the Royal Commission into National Natural Disaster Arrangements (CoA, 2020e). Projections for rainfall, thunderstorms, hail, lightning and tornadoes have large uncertainties (Walsh et al., 2016; MfE, 2018).
Future changes in climate variability are affected by the El Niño Southern Oscillation (ENSO), Southern Annular Mode (SAM), Indian Ocean Dipole (IOD) and Interdecadal Pacific Oscillation (IPO). An increase in strong El Niño and La Niña events is projected (Cai, 2015), along with more extreme positive phases of the IOD (Cai et al., 2018) and a positive trend in SAM (Lim et al., 2016), but potential changes in the IPO are unknown (NESP ESCC, 2020). There is uncertainty about regional climate responses to projected changes in ENSO (King et al., 2015; Perry et al., 2020; Virgilio et al., 2021).
Australian climate projections are quantified with references in Table 11.3a. Further warming is projected, with more hot days, fewer cold days, reduced snow cover, ongoing sea level rise (SLR) and ocean acidification (very high confidence). Winter and spring rainfall and soil moisture are projected to decrease, with higher evaporation rates, decreased wind over southern mainland Australia, increased wind over Tasmania, and more extreme fire weather in southern and eastern Australia (high confidence). Heavy rainfall intensity is projected to increase, with more droughts over southern and eastern Australia (medium confidence). Increased winter rainfall is projected over Tasmania, with decreased rainfall in southwestern Victoria in autumn and in western Tasmania in summer, fewer tropical cyclones with a greater proportion of severe cyclones and decreased soil moisture in the north (medium confidence). Hailstorm frequency may increase (low confidence).
Table 11.3a | Projected climate change for Australia. Projections are given for different RCPs (RCP2.6 is low, RCP4.5 is medium, RCP8.5 is high) and years (e.g., 20-year period centred on 2090). Uncertainty ranges are generally 10th–90th percentile, and median projections are given in square brackets where possible. The four Australian regions are shown in Chapter 2 of (CSIRO and BOM, 2015). Preliminary projections based on CMIP6 models are included for some climate variables from the IPCC (2021) WGI report.
Climate variable | Projected change (year, RCP) relative to 1986–2005 | References |
Air temperature | Annual mean temperature
| |
Sea surface temperature |
| |
Air temperature extremes |
| |
Rainfall | Annual mean rainfall
| |
Rainfall extremes | Intensity of daily total rain with 20-year recurrence interval
| |
Drought | Time in drought (Standardised Precipitation Index below −1)
| |
Wind speed | 0–5% decrease over southern mainland Australia and 0–5% increase over Tasmania (2090, RCP8.5) | |
Sea level rise |
These projections have not been updated to include an Antarctic dynamic ice sheet factor which increased global sea level projections for RCP8.5 by approx. 10 cm. Preliminary CMIP6 projections indicate +40–50 cm (2090, SSP1-RCP2.6) and +70–90 cm (2090, SSP5-RCP8.5) | |
Sea level extremes | Increase in the allowance for a storm tide event with 1% annual exceedance probability (100-year return period)
| |
Fire |
| (Clarke and Evans, 2019; Dowdy et al., 2019; Virgilio et al., 2019; Clarke et al., 2020; NESP ESCC, 2020; Clark et al., 2021) |
Tropical cyclones and other storms |
| |
Snow and ice |
| (Bhend et al., 2012; Harris et al., 2016; Di Luca et al., 2018) |
Ocean acidification | pH is projected to drop by about 0.1 (2090, RCP2.6) to 0.3 (2090, RCP8.5) |
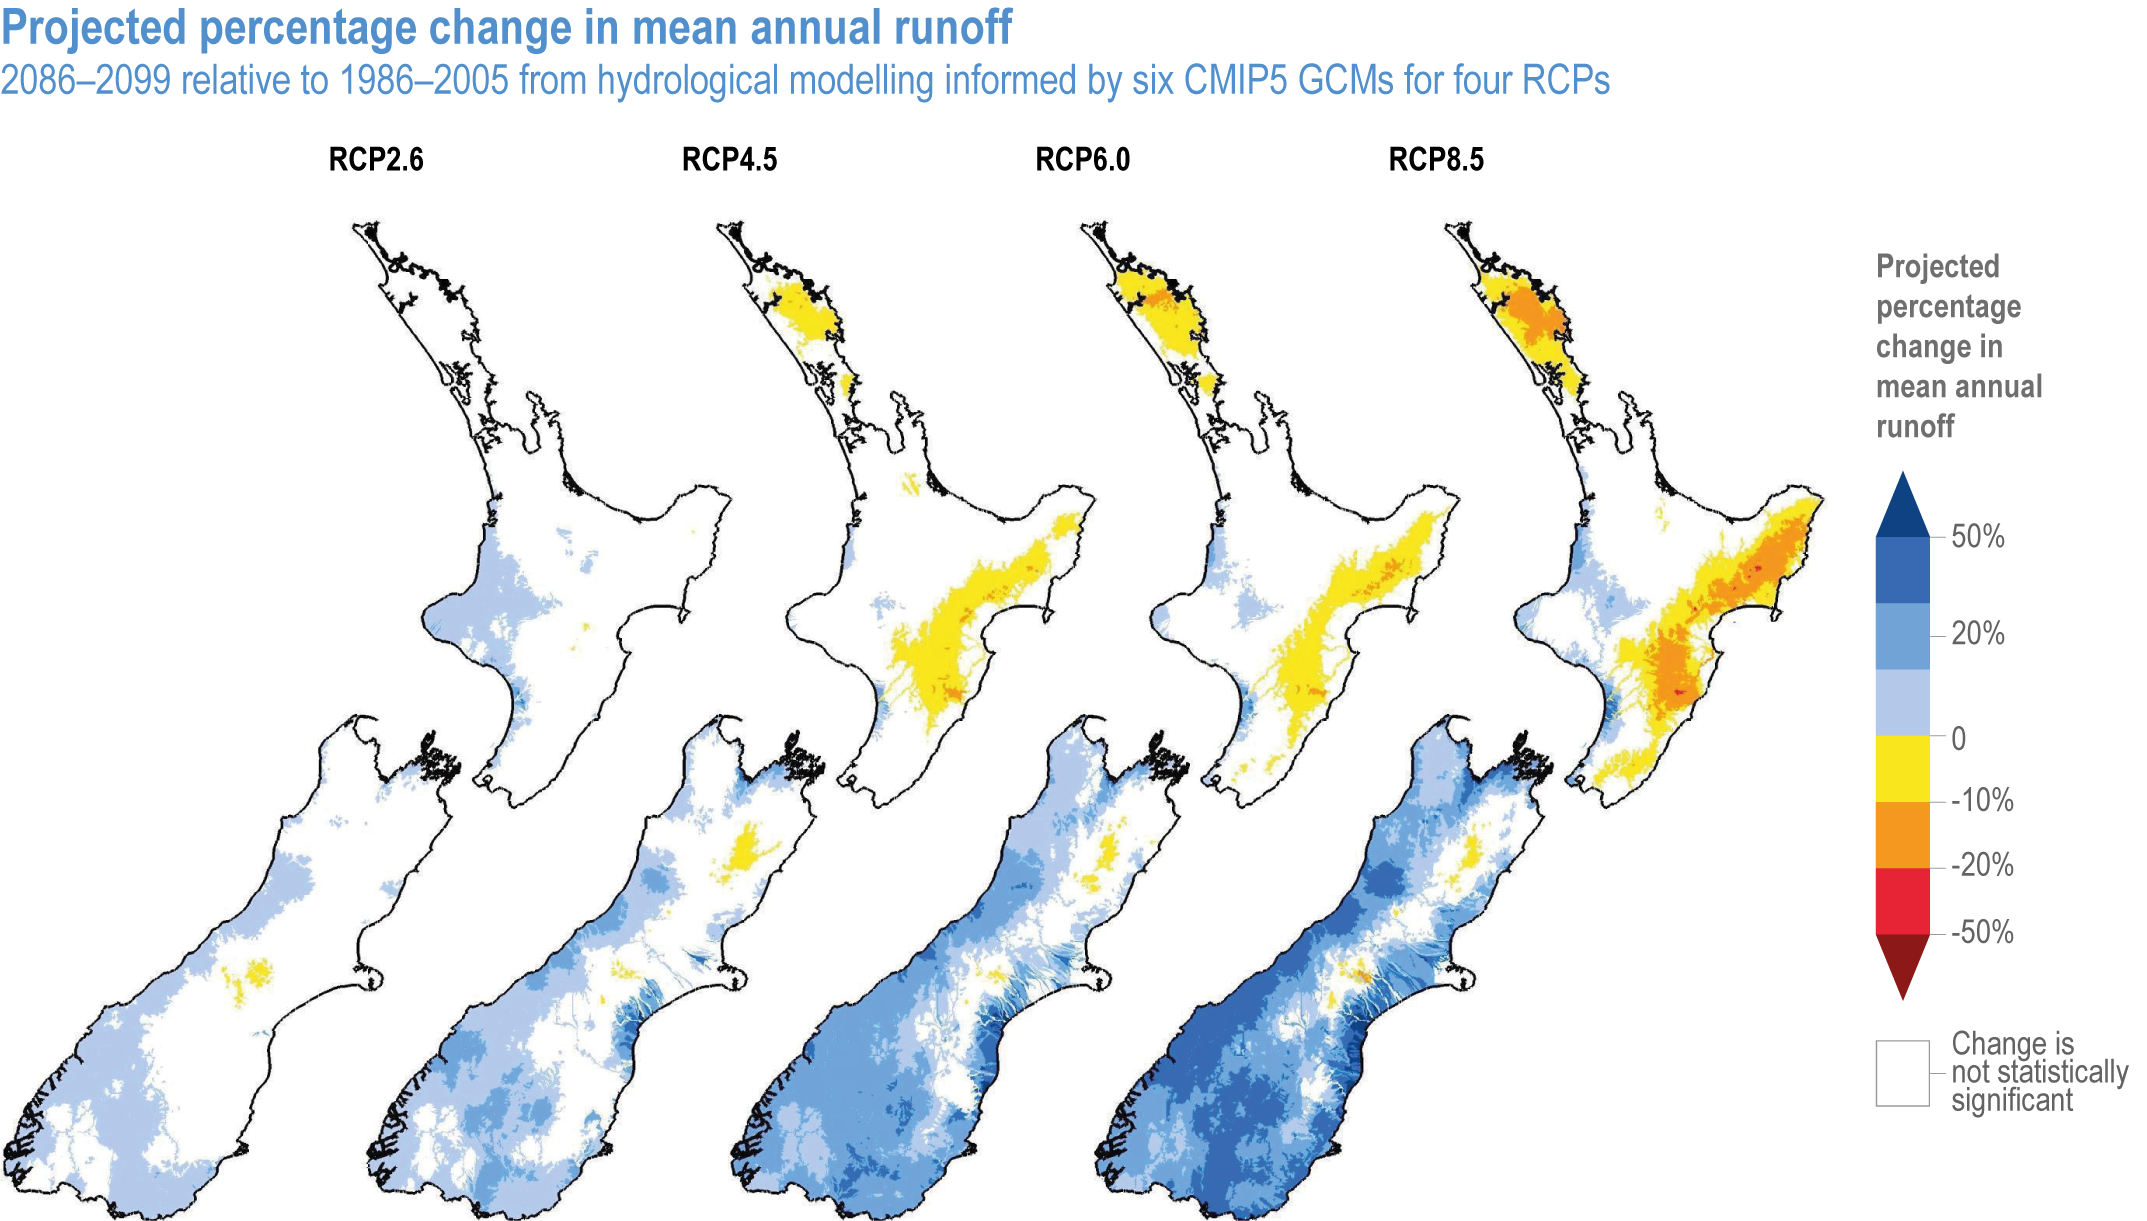
New Zealand climate projections are quantified with references in Table 11.3b. Further warming is projected, with more hot days, fewer cold days, less snow and glacial ice, ongoing sea level rise (SLR) and ocean acidification (very high confidence). Increases in winter and spring rainfall are projected in the west of the North and South Islands, with drier conditions in the east and north, caused by stronger westerly winds (medium confidence). In summer, wetter conditions are projected in the east of both islands, with drier conditions in the west and central North Island (medium confidence). Fire weather indices are projected to increase over northern and eastern New Zealand (medium confidence). Heavy rainfall intensity is projected to increase over most regions, with increased extreme wind speeds in eastern regions, especially in Marlborough and Canterbury, and reduced relative humidity almost everywhere, except for the west coast in winter (medium confidence). Drought frequency may increase in the north (medium confidence).
11.3 Observed Impacts, Projected Impacts and Adaptation
This section assesses observed impacts, projected risks and adaptation for 10 sectors and systems. Boxes provide more details on specific issues. Risk is considered in terms of vulnerability, hazards (impact driver), exposure, reasons for concern and complex and cascading risks (Chapter 1; Figure 1.2).
11.3.1 Terrestrial and Freshwater Ecosystems
11.3.1.1 Observed Impacts
Widespread and severe impacts on ecosystems and species are now evident across the region (very high confidence) (Table 11.4). Climate impacts reflect both ongoing change and discrete extreme weather events (Harris et al., 2018), and the climatic change signal is emerging despite confounding influences (Hoffmann et al., 2019). Fundamental shifts are observed in the structure and composition of some ecosystems and associated services (Table 11.4). Impacts documented for species include global and local extinctions, severe regional population declines and phenotypic responses (Table 11.4). In terrestrial and freshwater ecosystems, land use impacts are interacting with climate, resulting in significant changes to ecosystem structure, composition and function (Bergstrom et al., 2021), with some landscapes experiencing catastrophic impacts (Table 11.4). Some of the observed changes may be irreversible where projected impacts on ecosystems and species persist (Table 11.5). Of note is the global extinction of an endemic mammal species, the Bramble Cay melomys (Melomys rubicola), from the loss of habitat attributable in part to sea level rise (SLR) and storm surges in the Torres Strait (Table 11.4).
Natural forest and woodland ecosystem processes are experiencing differing impacts and responses depending on the climate zone (high confidence). In Australia, an overall increase in the forest fire danger index, associated with warming and drying trends (Table 11.2a), has been observed particularly for southern and eastern Australia in recent decades (Box 11.1). The 2019–2020 mega wildfires of south eastern Australia burnt between 5.8 and 8.1 million hectares of mainly temperate broadleaf forest and woodland, but with substantial areas of rainforest also impacted, and were unprecedented in their geographic location, spatial extent and forest types burnt (Boer et al., 2020; Nolan et al., 2020; Abram et al., 2021; Collins et al., 2021; Godfree et al., 2021). The human influence on these events is evident (Abram et al., 2021; van Oldenborgh et al., 2021) (Box 11.1). The fires had significant consequences for wildlife (Hyman et al., 2020; Nolan et al., 2020; Ward et al., 2020) (Box 11.1) and flow-on impacts for aquatic fauna (Silva et al., 2020). In southern Australia, deeply rooted native tree species can access soil and groundwater resources during drought, providing a level of natural resilience (Bell and Nikolaus Callow, 2020; Liu et al., 2020). However, the Northern Jarrah forests of south western Australia have experienced tree mortality and dieback from long-term precipitation decline and acute heatwave-compounded drought (Wardell-Johnson et al., 2015; Matusick et al., 2018). While there is limited information on observed impacts for New Zealand, increased mast seeding events in beech forest ecosystems that stimulate invasive population irruptions have been recorded (Schauber et al., 2002; Tompkins et al., 2013).
Table 11.2a | Observed climate change for Australia.
Climate variable | Observed change | References |
Air temperature over land | Increased by 1.4°C from 1910 to 2019, with 2019 being the warmest year; 9 of the 10 warmest on record have occurred since 2005; clear anthropogenic attribution. | (BoM and CSIRO, 2020 ; Trewin et al., 2020; BoM, 2021a; Gutiérrez et al., 2021) |
Sea surface temperature | Increased by 1.0°C from 1900 to 2019 (0.09°C/decade), with an increase of 0.16°C–0.20°C/decade since 1950 in the southeast. Eight of the 10 warmest years on record have occurred since 2010. | |
Air temperature extremes over land | More extremely hot days and fewer extremely cold days in most regions. Weaker warming trends in minimum temperatures in southeast Australia compared to elsewhere during 1960–2016. Frost frequency in southeast and southwest Australia has been relatively unchanged since the 1980s. Very high monthly maximum or minimum temperatures that occurred around 2% of the time in the past (1960–1989) now occur 11–12% of the time (2005–2019). Multi-day heatwave events have increased in frequency and duration across many regions since 1950. In 2019, the national average maximum temperature exceeded the 99th percentile on 43 days (more than triple the number in any of the years prior to 2000) and exceeded 39°C on 33 days (more than the number observed from 1960 to 2018 combined). | (Perkins-Kirkpatrick et al., 2016; Alexander and Arblaster, 2017; Pepler et al., 2018; BoM and CSIRO, 2020 ; Perkins-Kirkpatrick and Lewis, 2020; Trancoso et al., 2020) |
Sea temperature extremes | Intense marine heatwave in 2011 near western Australia (peak intensity 4°C, duration 100 days). The likelihood of an event of this duration is estimated to be about five times higher than under pre-industrial conditions. Marine heatwave over northern Australia in 2016 (peak intensity 1.5°C, duration 200 days). Marine heatwave in the Tasman Sea and around southeast mainland Australia and Tasmania from September 2015 to May 2016 (peak intensity 2.5°C, duration 250 days)—likelihood of an event of this intensity and duration has increased about 50-fold. Marine heatwave in the Tasman Sea from November 2017 to March 2018 (peak intensity 3°C, duration 100 days). Marine heatwave on the GBR in 2020 (peak intensity 1.2°C, duration 90 days) | (BoM and CSIRO, 2018 ; BoM, 2020; Laufkötter et al., 2020; Oliver et al., 2021) |
Rainfall | Northern Australian rainfall has increased since the 1970s, with an attributable human influence. April to October rainfall has decreased 16% since the 1970s in southwestern Australia (partly due to human influence) and 12% from 2000–2019 in south-eastern Australia. The lowest recorded average rainfall in Australia occurred in 2019. | (Delworth and Zeng, 2014; Knutson and Zeng, 2018; Dey et al., 2019; BoM and CSIRO, 2020 ; BoM, 2021a) |
Rainfall extremes | Hourly extreme rainfall intensities increased by 10–20% in many locations between 1966 to1989 and 1990 to 2013. Daily rainfall associated with thunderstorms increased 13–24% from 1979 to 2016, particularly in northern Australia. Daily rainfall intensity increased in the northwest from 1950 to 2005 and in the east from 1911 to 2014 and decreased in the southwest and Tasmania from 1911 to 2010. | (Donat et al., 2016; Alexander and Arblaster, 2017; Evans et al., 2017; Guerreiro et al., 2018; Dey et al., 2019; BoM and CSIRO, 2020 ; Bruyère et al., 2020; Dowdy, 2020; Dunn et al., 2020; Gutiérrez et al., 2021) |
Drought | Major Australian droughts occurred in 1895–1902, 1914–1915, 1937–1945, 1965–1968, 1982–1983, 1997–2009 and 2017–2019. Fewer droughts have occurred across most of northern and central Australia since the 1970s, and more droughts have occurred in the southwest since the 1970s; drought trends in the southeast have been mixed since the late 1990s. | (Gallant et al., 2013; Delworth and Zeng, 2014; Alexander and Arblaster, 2017; Dai and Zhao, 2017; Knutson and Zeng, 2018; Dey et al., 2019; Spinoni et al., 2019; Dunn et al., 2020; Rauniyar and Power, 2020; BoM, 2021b; Seneviratne et al., 2021) |
Wind speed | Wind speed decreased 0.067 m/s/decade over land in the period 1941–2016, with a decrease of 0.062 m/s/decade over land from 1979 to 2015, and a decrease of 0.05–0.10 m/s/decade over land from 1988 to 2019. Wind speed increased 0.02 m/s/year across the Southern Ocean during 1985–2018. | (Troccoli et al., 2012; Young and Ribal, 2019; Blunden and Arndt, 2020; Azorin-Molina et al., 2021) |
Sea level rise | Relative SLR was 3.4 mm/year from 1993 to 2019, which includes the influence of internal variability (e.g., ENSO) and anthropogenic greenhouse gases. | |
Fire | An increase in the number of extreme fire weather days from July 1950 to June 1985 compared to July 1985 to June 2020, especially in the south and east, partly attributed to climate change. More dangerous conditions for extreme pyro convection events since 1979, particularly in south-eastern Australia. Extreme fire weather in 2019–2020 was at least 30% more likely due to climate change. | (Dowdy and Pepler, 2018; BoM and CSIRO, 2020 ; van Oldenborgh et al., 2021) |
Tropical cyclones and other storms | Fewer tropical cyclones since 1982, with a 22% reduction in translation speed over Australian land areas in the period1949–2016. No significant trend in the number of East Coast Lows. From 1979 to 2016, thunderstorms and dry lightning decreased in spring and summer in northern and central Australia, decreased in the north in autumn, and increased in the southeast in all seasons. Convective rainfall intensity per thunderstorm increased by about 20% in the north and 10% in the south. An increase in the frequency of large to giant hail events across southeastern Queensland and northeastern and eastern New South Wales in the most recent decade. Seven major hail storms over eastern Australia from 2014 to 2020 and three major floods over eastern Australia from 2019 to 2021. | (Pepler et al., 2015b; Ji et al., 2018; Kossin, 2018; BoM and CSIRO, 2020 ; Dowdy, 2020; ICA, 2021; Bruyère et al., 2020) |
Snow | At Spencers Creek (1830 m elevation) in NSW, annual maximum snow depth decreased 10% and length of snow season decreased 5% during 2000–2013 relative to 1954–1999. At Rocky Valley Dam (1650 m elevation) in Victoria, annual maximum snow depth decreased 5.7 cm/decade from 1954 to 2011. At Mt Hotham, Mt Buller and Falls Creek (1638–1760 m elevation), annual maximum snow depth decreased 15%/decade from 1988 to 2013. | (Bhend et al., 2012; Fiddes et al., 2015; Pepler et al., 2015a; BoM and CSIRO, 2020 ) |
Ocean acidification | Average pH of surface waters has decreased since the 1880s by about 0.1 (over 30% increase in acidity). |
Table 11.3b | Projected climate change for New Zealand. Projections are given for different RCPs (RCP2.6 is low, RCP4.5 is medium, RCP8.5 is high) and years (e.g., 20-year period centred on 2090). Uncertainty ranges are 5th–95th percentiles, and median projections are given in square brackets where possible. Preliminary projections (10th–90th percentiles) based on CMIP6 models are included for some climate variables from the IPCC (2021) WGI report.
Climate variable | Projected change (year, RCP) relative to 1986–2005 | References |
Air temperature | Annual mean temperature
| (MfE, 2018); |
Sea surface temperature |
| |
Air temperature extremes |
| |
Rainfall | Annual mean rainfall
| |
Rainfall extremes | Intensity of daily rain with 20-year recurrence interval
| |
Drought | Increase in potential evapotranspiration deficit
| |
Wind speed | 99th percentile of daily mean wind speed
| |
Sea level rise |
These projections have not been updated to include an Antarctic dynamic ice sheet factor which increased global sea level projections for RCP 8.5 by approx. 10 cm. Preliminary CMIP6 projections indicate 40–50 cm (2090, SSP1-RCP2.6) and 70–90 cm (2090, SSP5-RCP8.5). | |
Sea level extremes | For a rise in sea level of 30 cm, the 1-in-100-year high water levels may occur about
| |
Fire |
| |
Tropical cyclones and other storms | Poleward shift of mid-latitude cyclones and potential for a small reduction in frequency | |
Snow and ice |
| (Hendrikx et al., 2013; MfE, 2018; Marzeion et al., 2020; Anderson et al., 2021) |
Ocean acidification | pH is projected to drop by about 0.1 (2090, RCP2.6) to 0.3 (2090 RCP8.5). |
Table 11.4 | Observed impacts on terrestrial and freshwater ecosystems and species in the region where there is documented evidence that these are directly (e.g., a species thermal tolerances are exceeded) or indirectly (e.g., through changed fire regimes) the result of climate change pressures.
Ecosystem | Climate-related pressure | Impact | Source |
Australia | |||
Forest and woodlands of southern and southwestern Australia | 30-year declining rainfall | Drought-induced canopy dieback across a range of forest and woodland types (e.g., northern jarrah) | |
Multiple wildfires in short succession resulting from increased fire risk conditions, including declining winter rainfall and increasing hot days | Local extirpations and replacement of dominant canopy tree species and replacement by woody shrubs due to seeders having insufficient time to reach reproductive age (alpine ash) or vegetative regeneration capacity is exhausted (snow gum woodlands) | (Slatyer, 2010; Bowman et al., 2014; Fairman et al., 2016; Harris et al., 2018; Zylstra, 2018) | |
Background warming and drying created soil and vegetation conditions that are conducive to fires being ignited by lightning storms in regions that have rarely experienced fire over the last few millennia | Death of fire-sensitive trees species from unprecedented fire events (Palaeo-endemic pencil pine forest growing in sphagnum, Tasmania, killed by lightning-ignited fires in 2016) | ||
Australian Alps Bioregion and Tasmanian alpine zones | Severe winter drought; warming and climate-induced biotic interactions | Shifts in dominant vegetation with a decline in grasses and other graminoids and an increase in forb and shrub cover in Bogong High Plains, Victoria, Australia | |
Snow loss, fire, drought and temperature changes | Changing interactions within and among three key alpine taxa related to food supply and vegetation habitat resources: The mountain pygmy-possum (Burramys parvus), the mountain plum pine (Podocarpus lawrencei) and the bogong moth (Agrostis infusia) | ||
Retreat of snow line | Increased species diversity in alpine zone | ||
Reduced snow cover | Loss of snow-related habitat for alpine zone endemic and obligate species | (ACE CRC, 2010; Pepler et al., 2015a; Thompson, 2016; Mitchell et al., 2019) | |
Wet Tropics World Heritage Area | Warming and increasing length of dry season | Some vertebrate species have already declined in both distribution area and population size, both earlier and more severely than originally predicted | |
Sub-Antarctic Macquarie island | Reduced summer water availability for 17 consecutive summers, and increases in mean wind speed, sunshine hours and evapotranspiration over four decades | Dieback in critically endangered habitat-forming cushion plant Azorella macquariensis in the fellfield and herb field communities | |
Mass mortality of wildlife species (flying foxes, freshwater fish) | Extreme heat events; rising water temperatures, temperature fluctuations, altered rainfall regimes including droughts and reduced in-flows | Flying foxes—thermal tolerances of species exceeded; fish—amplified extreme temperature fluctuations, increasing annual water basin temperatures, extreme droughts and reduced runoff after rainfall | |
Bramble Cay melomys (mammal) Melomys rubicola | SLR and storm surges in Torres Strait | Loss of habitat and global extinction | (Lunney et al., 2014; Gynther et al., 2016; Waller et al., 2017; CSIRO, 2018) |
Koala, Phascolarctos cinereus | Increasing drought and rising temperatures, compounding impacts of habitat loss, fire and increasing human population | Population declines and enhanced risk of local extinctions | |
Tawny dragon lizard, Ctenophorus decresii | Desiccation stress driven by higher body temperatures and declining rainfall | Population decline and potential local extinction in Flinders Ranges, south Australia | |
Birds | Changing thermal regimes including increasing thermal stress and changes in plant productivity are identified as being causal | Changes in body size, mass and condition and other traits linked to heat exchange | (Gardner et al., 2014a; Gardner et al., 2014b; Campbell-Tennant et al., 2015; Gardner et al., 2018; Hoffmann et al., 2019) |
New Zealand | |||
Forest birds | Warming | Increasing invasive predation pressure on endemic forest birds surviving in cool forest refugia, particularly larger-bodied bird species that nest in tree cavities and are poor dispersers | |
Coastal ecosystems | More severe storms and rising sea levels | Erosion of coastal habitats, including dunes and cliffs, is reducing habitat | |
Beech forest ecosystems | Increasing mean temperatures and indirectly through effects of events like ENSO | Increased beech mast seeding events that stimulate population irruptions for invasive rodents and mustelids, which then prey on native species | |
11.3.1.2 Projected Impacts
In the near term (2030–2060), climate change is projected to become an increasingly dominant stress on the region’s biodiversity, with some ecosystems experiencing irreversible changes in composition and structure and some threatened species becoming extinct (high confidence). Climate change will interact with current ecological conditions, threats and pressures, with cascading ecological impacts, including population declines, heat-related mortalities, extinctions and disruptions for many species and ecosystems (high confidence) (Table 11.5). These include inadequate allocation of environmental flows for freshwater fish (Vertessy et al., 2019), native forest logging for old-growth-forest-dependent fauna (Lindenmayer et al., 2015; Lindenmayer and Taylor, 2020a; Lindenmayer and Taylor, 2020b), and invasive species (Scott et al., 2018). Climate change has synergistic and compounding impacts, particularly in bioregions already experiencing ecosystem degradation, threatened endemics and collapse of keystone species, including those of value to Indigenous Peoples, and high extinction rates as a consequence of human activities (Table 11.4) (Gordon, 2009; Australia SoE, 2016; Weeks et al., 2016; Cresswell and Murphy, 2017; Hare et al., 2019; MfE, 2019; Lindenmayer and Taylor, 2020a; Lindenmayer and Taylor, 2020b; Bergstrom et al., 2021). Some native species are projected to have potentially greater geographic range if they can colonise new areas, while other species may be resilient to projected climate change impacts (Bulgarella et al., 2014; K.E. Lawrence et al., 2017; Conroy et al., 2019; Rizvanovic et al., 2019).
Table 11.5 | An indicative selection of projected climate-change impacts on terrestrial and freshwater ecosystems and species in Australia and New Zealand respectively.
Ecosystem, species | Climate-related pressure | Projected Impact | Source |
Australia | |||
Floristic composition of vegetation communities | Increases in temperature and reductions in annual precipitation by 2070. Many plant species based on median projection from five global climate models (ACCESS1.0, CNRM-CM5, HADGEM2-CC, MIROC5, NorESM1-M) centred on the decade 2070 under RCP8.5 | 47% of vegetation types have characteristic plant species at risk of their climatic tolerances being exceeded from increasing mean annual temperature by 2070 with only 2% at risk from reductions in annual precipitation by 2070 | |
Some south east Australian temperate forests | Reduction in winter rainfall and rising spring temperatures resulting in an increase in the frequency of very high fire weather conditions and increased risk of catastrophic wildfires; based on output from 15 CMIP5 GCMs using RCP8.5 for years for 2060–2079 as compared to 1990–2009 | Increase in fire frequency prevents recruitment of obligate seeder resulting in changing dominant species and vegetation structure including long lasting or irreversible shift in formation from tall wet temperate eucalypt forests dominated by obligate seeder trees (e.g., alpine ash) to open forest or in worst case to shrubland Declining rainfall and regolith drying, more unplanned, intense fires and declining productivity place stress on tree growth and compromise biodiversity in northern jarrah forest | (Doherty et al., 2017; Zylstra, 2018; Bowman et al., 2019; Dowdy et al., 2019; Naccarella et al., 2020) |
Tree line stasis or regression (snow gum) | (Doherty et al., 2017); (Bowman et al., 2019; Naccarella et al., 2020) | ||
Increase in lightning-ignited landscape fires along with contracting palaeo-endemic refugia due to warmer and drier climates | Population collapse and severe range contraction of slow-growing, fire-sensitive palaeo-endemic temperate rainforest species (e.g., pencil pine) | ||
Rhizosphere responses or accelerated rates of soil organic matter decomposition | Plant nutrient availability may be enhanced | ||
Alpine ecosystems | Increasing global warming and rising temperatures, ongoing reduction in snow cover and winter rain and increasing frequency and magnitude of wildfires | Loss of alpine vegetation communities (snow patch feldmark and short alpine herb fields) and increased stress on snow-dependent plant and animal species; changing suitability for invasive species | (Slatyer, 2010; Morrison and Pickering, 2013; Pepler et al., 2015a; Williams et al., 2015; Harris et al., 2017) |
Northern tropical savannahs | Rainfall and CO2 effects | Potentially resulting in an increase in ecosystem carbon storage | |
Murray-Darling River Basin | Drought | Reduced river flow; mass fish kills | |
Unimpaired river basins | Elevated CO2 levels | Increase plant water use reduces stream flow | |
Bearded dragons (lizards), Pogona spp. | Changes in precipitation | P. henrylawsoni and P. microlepidota to gain suitable habitat, P. nullarbor and P. vitticeps showing the most potential loss | |
Xeric bees | Broad temperate tolerances, arid climate adapted | Climate-resilient, only small response | |
Great desert skink Liopholis kintorei | Buffering capacity of underground microclimates, for nocturnal and crepuscular ectotherms | Warming impacts projected to be indirect | |
22 narrow-range fish species in imminent risk of extinction | Projected changes in rainfall, run-off, air temperatures and the frequency of extreme events (drought, fire, flood) compound risk from other key threats especially invasive species | Extinction projected within next 20 years | |
Freshwater taxa (freshwater fish, crayfish, turtles and frogs) | Changed hydrological regimes | Substantial changes to the composition of faunal assemblages in Australian rivers well before the end of this century, with gains/losses balanced for fish but suitable habitat area predicted to decrease for many crayfish and turtle species and nearly all frog species | |
New Zealand | |||
Modified lowland wetlands | Intersection of warming, drought and heavy rainfall (ex-tropical cyclones) | Prolonged anoxic conditions in waterways (blackwater events) leading to mortality of fish (e.g., shortfin eels) and invertebrates, while botulism outbreaks can lead to impacts on waterfowl | |
Native forests and lands | Elevated CO2 levels, warming, increased precipitation. | Short-term beneficial effects on carbon storage; droughts in eastern areas would decrease productivity and rates of carbon storage in the medium term | |
Increased fire intensity and frequency in hot and dry parts of New Zealand | Much of the native vegetation has no fire adaptations, causing vulnerability to local extinction due to ‘interval squeeze’ | ||
Freshwater rivers | Rainfall variation | Cascading effects of warming, drought, floods and algal blooms compounded by water abstraction | |
Three species of naturalised woody weeds | Warming and increased CO2 levels | Increased geographic range | |
Kauri tree, Agathis australis | Lower than average rainfall stimulates a drought-deciduous response in this evergreen species | Increased litter fall | |
Windmill palm | Warming | Increased geographic range | |
New Zealand tussock grasslands | Warming | Enhanced respiration | |
Invasive species | Warming | Increased invasive species abundance and increased predation on native species | |
Warming | Expanded ranges of invasive species in higher/cooler areas | ||
Warming | Change in flowering phenology and pollination competition | ||
Warming | Increase in invasive plants, insects and pathogens from sub-tropical/tropical climates | ||
Tuatara (reptile), Sphenodon punctatus | Warming | Temperature-dependent sex determination with more male hatches threatening small, isolated populations | |
Warming | Increased geographic range | ||
Cattle tick | Warming | Increased geographic range and risk of tick-spread anaemia in cattle | (K.E. Lawrence et al., 2017) |
Brown mudfish, Neochanna apoda | Drought | Reduced flow regimes associated with drought interact with reduced habitat due to land use change, leading to population declines and potential local extinction | |
Suter’s skink (lizard)Oligosoma suteri | Warming | Increased suitable range but unclear if dispersal is possible because habitats are isolated | |
Threatened endemic passerine bird, Notiomystis cincta | Fluctuations in total precipitation, particularly increased and more variable rainfall | Heavy rainfall can flood nests and kill fledglings while droughts can cause population-wide reproductive failure | |
Feral cats | Warming | Increased geographic range |
In southern Australia, some forest ecosystems (alpine ash, snow gum woodland, pencil pine, northern jarrah) are projected to transition to a new state or collapse due to hotter and drier conditions with more fires (high confidence) (Table 11.5). In Australia, most native eucalyptus forest plants have a range of traits that enable them to persist with recurrent fire through recovery buds (sprouters) or regenerate through seeding (Collins, 2020), affording them a high level of resilience. For high-end projected 2060–2080 fire weather conditions in southeast Australia (Clarke and Evans, 2019), stand-killing wildfires could occur at a severity and frequency greater than the regenerative capacity of seeders (Enright et al., 2015; Clarke and Evans, 2019). Most New Zealand native plants are not fire resistant and are projected to be replaced by fire-resistant introduced species following climate-change-related fires (Perry et al., 2014).
A loss of alpine biodiversity in the southeast Australian Alps bioregion is projected in the near-term as a result of less snow on snow patch feldmark and short alpine herb fields as well as increased stress on snow-dependent plant and animal species (high confidence) (Table 11.3, Table 11.5). In Australia, invasive plants’ and weeds’ response rates are expected to be faster than for native species, and climate change could foster the appearance of a new set of weed species, with many bioregions facing increased impacts from non-native plants (medium confidence) (Gallagher et al., 2013; Scott et al., 2014; March-Salas and Pertierra, 2020) (Table 11.5), along with declines in some listed weeds (Duursma et al., 2013; Gallagher et al., 2013). In New Zealand, climate change is projected to enable invasive species to expand to higher elevations and southwards (medium confidence) (Table 11.5) (Giejsztowt et al., 2020; MfE, 2020a).
Projected responses of ecosystem processes are uncertain in part due to complex interactions of climate change with soil respiration, plant nutrient availability (Hasegawa et al., 2015; Orwin et al., 2015; Ochoa-Hueso et al., 2017) and changing fire regimes (Table 11.5) (Scheiter et al., 2015; Dowdy et al., 2019). For aquatic biota, responses will reflect seasonal differences in water temperature (Wallace et al., 2015) and changes in rainfall intensity, productivity and biodiversity (Jardine et al., 2015). Extreme floods may have negative impacts on New Zealand river biota, by mobilising nutrients, sediments and toxic chemicals and aiding the dispersal of invasive species. These effects are compounded by homogenisation of rivers through channelisation (Death et al., 2015).
Improved coastal modelling, experiments and in situ studies are reducing uncertainties at a local scale about the impact of future sea level rise (SLR) on coastal freshwater terrestrial wetlands (medium confidence) (Shoo et al., 2014; Bayliss et al., 2018; Grieger et al., 2019). Low-lying coastal wetlands are susceptible to saltwater intrusion from sea level rise (SLR) (Shoo et al., 2014; Kettles and Bell, 2015; Finlayson et al., 2017) with consequences for species dependent on freshwater habitats (Houston et al., 2020). Saline habitat conditions will move inland and new coastal ecosystem states may emerge, including the World Heritage listed Kakadu’s freshwater wetland (Bayliss et al., 2018) (Table 11.5). Increasingly, sea level rise (SLR) will shrink the intertidal zone, having implications for wading birds which use this zone (Tait and Pearce, 2019) (Box 11.6). The ecology of freshwater wetlands in New Zealand are projected to be impacted by the intersection of warming, drought and heavy rainfall (Pingram et al., 2021) (Table 11.5).
The impacts on species from projected global warming depend on their physiological and ecological responses for which knowledge is limited (Table 11.5) (Bulgarella et al., 2014; Carter et al., 2018; Green et al., 2021). Knowledge of projected impacts is constrained by uncertainties about the influence of physiological limits, barriers to dispersal, competition, the availability of habitat resources (Worth et al., 2014) and disruptions to ecological interactions (Lakeman-Fraser and Ewers, 2013; Parida et al., 2015; Porfirio et al., 2016). Gaps in ecological modelling of future climate impacts include consideration of long-term rainfall and temperature changes (Grimm-Seyfarth et al., 2017; Grimm-Seyfarth et al., 2018), species dispersal rates, evolutionary capacity and phenotypic plasticity and the thresholds at which they are considered adequate to counter the impacts of climate change (Ofori et al., 2017b), as well as indirect effects including sea level rise (SLR) and altered fire regimes (Shoo et al., 2014; Cadenhead et al., 2016; He et al., 2016).
11.3.1.3 Adaptation
Managing climate change risks to ecosystems is primarily based on reducing the impact of other anthropogenic pressures, including invasive species, and facilitating natural adaptation (high confidence). This approach is most feasible within protected areas on public, private and Indigenous land and sea (Bellard et al., 2014; Liu et al., 2020) but is also applicable elsewhere (Barnes et al., 2015). Effective strategies promote ecosystem resilience by changing unsustainable land uses and management practices, increasing habitat connectivity, controlling introduced species, restoring habitats, implementing appropriate fire management, integrated risk assessment and adaptation planning (B. Frame et al., 2018; Lindenmayer et al., 2020; Macinnis-Ng et al., 2021). Complementary approaches include ex situ seed banks (Morrison and Pickering, 2013; Christie et al., 2020).
Best practice conservation adaptation planning is informed by data on key habitats, including refugia, and restoration that facilitates species movements and employs adaptive pathways (very high confidence) (Guerin and Lowe, 2013; Reside et al., 2014; Shoo et al., 2014; Keppel et al., 2015; Andrew and Warrener, 2017; Baumgartner et al., 2018; Harris et al., 2018; Jacobs et al., 2018a; Das et al., 2019; Walker et al., 2019; Molloy et al., 2020). Landscape planning (Bond et al., 2014; McCormack, 2018) helps reduce habitat loss, facilitates species dispersal and gene flow (McLean et al., 2014; Shoo et al., 2014; Lowe et al., 2015; Harris et al., 2018; McCormack, 2018) and allows for new ecological opportunities (Norman and Christidis, 2016). Coastal squeeze is a threat to freshwater wetlands and requires planning for the potential inland shift (Grieger et al., 2019). Adaptations that maintain critical volumes and periodicity of environmental flows will help protect freshwater biodiversity (Box 11.3) (Yen et al., 2013; Barnett et al., 2015; Wang et al., 2018b).
Adaptation planning for ecosystems and species requires monitoring and evaluation to identify trigger points and thresholds for new actions to be implemented (high confidence) (Tanner-McAllister et al., 2017; Williams et al., 2020). Best planning practice includes keeping options open (Barnett et al., 2015; Dunlop et al., 2016; Finlayson et al., 2017) and updating management plans in light of new information. New insights are emerging into how species’ natural adaptive capacities can inform adaptation planning (Llewelyn et al., 2016; Steane et al., 2017; Hoeppner and Hughes, 2019). Physiological limits to adaptation in some species are being identified (Barnett et al., 2015; Sorensen et al., 2016), and where natural responses are not feasible, human-assisted translocations may be warranted (Becker et al., 2013; Chauvenet et al., 2013; Innes et al., 2019) for some species (Ofori et al., 2017a; Ofori et al., 2017b). Legal reform may be needed to better enable climate adaptation for biodiversity conservation that recognises species’ natural adjustments to their distributions and the difficulties encountered in predicting the consequences for ecological interactions and ecosystem services (McCormack, 2018; McDonald et al., 2019).
Adaptation research priorities include understanding of the interactions and cumulative impacts of existing stressors and climate change and the implications for managing ecosystems and natural resources (Williams et al., 2020). For Australia, research on implementation strategies for conservation and managing threats, stress and natural assets is a priority (Williams et al., 2020). For New Zealand, understanding how terrestrial ecosystems and species respond to climate change is a priority, and where existing stressors are affecting freshwater quantity and quality, in situ monitoring to detect and evaluate projections of climate change impacts on biodiversity and a national data repository are lacking (MfE, 2020a). The projected increase in invasive species indicates the importance of a step-up in pest management efforts to ensure native species persistence as invasive species spread from climate change (Firn et al., 2015). There remains a gap between the knowledge generated, potential adaptation strategies and their incorporation into conservation instruments (medium confidence) (Graham et al., 2019; Hoeppner and Hughes, 2019), though there is increasing recognition of the need to improve governance and management structures for their implementation (Christie et al., 2020).
Box 11.1 | Escalating Impacts and Risks of Wildfire
Fire activity depends on weather, ignition sources, land management practices and fuel flammability, availability and continuity (Bradstock et al., 2014). Increased fire activity in southeast Australia associated with climate change has been observed since 1950 (Abram et al., 2021), though trends vary regionally (medium confidence) (Bradstock et al., 2014). In New Zealand, there has been an increased frequency of major wildfires in plantations (FENZ, 2018) and at the rural–urban interface (medium confidence) (Pearce, 2018). In northern Australia, increased wet season rainfall (Gallego et al., 2017) has increased dry season fuel loads (Harris et al., 2008).
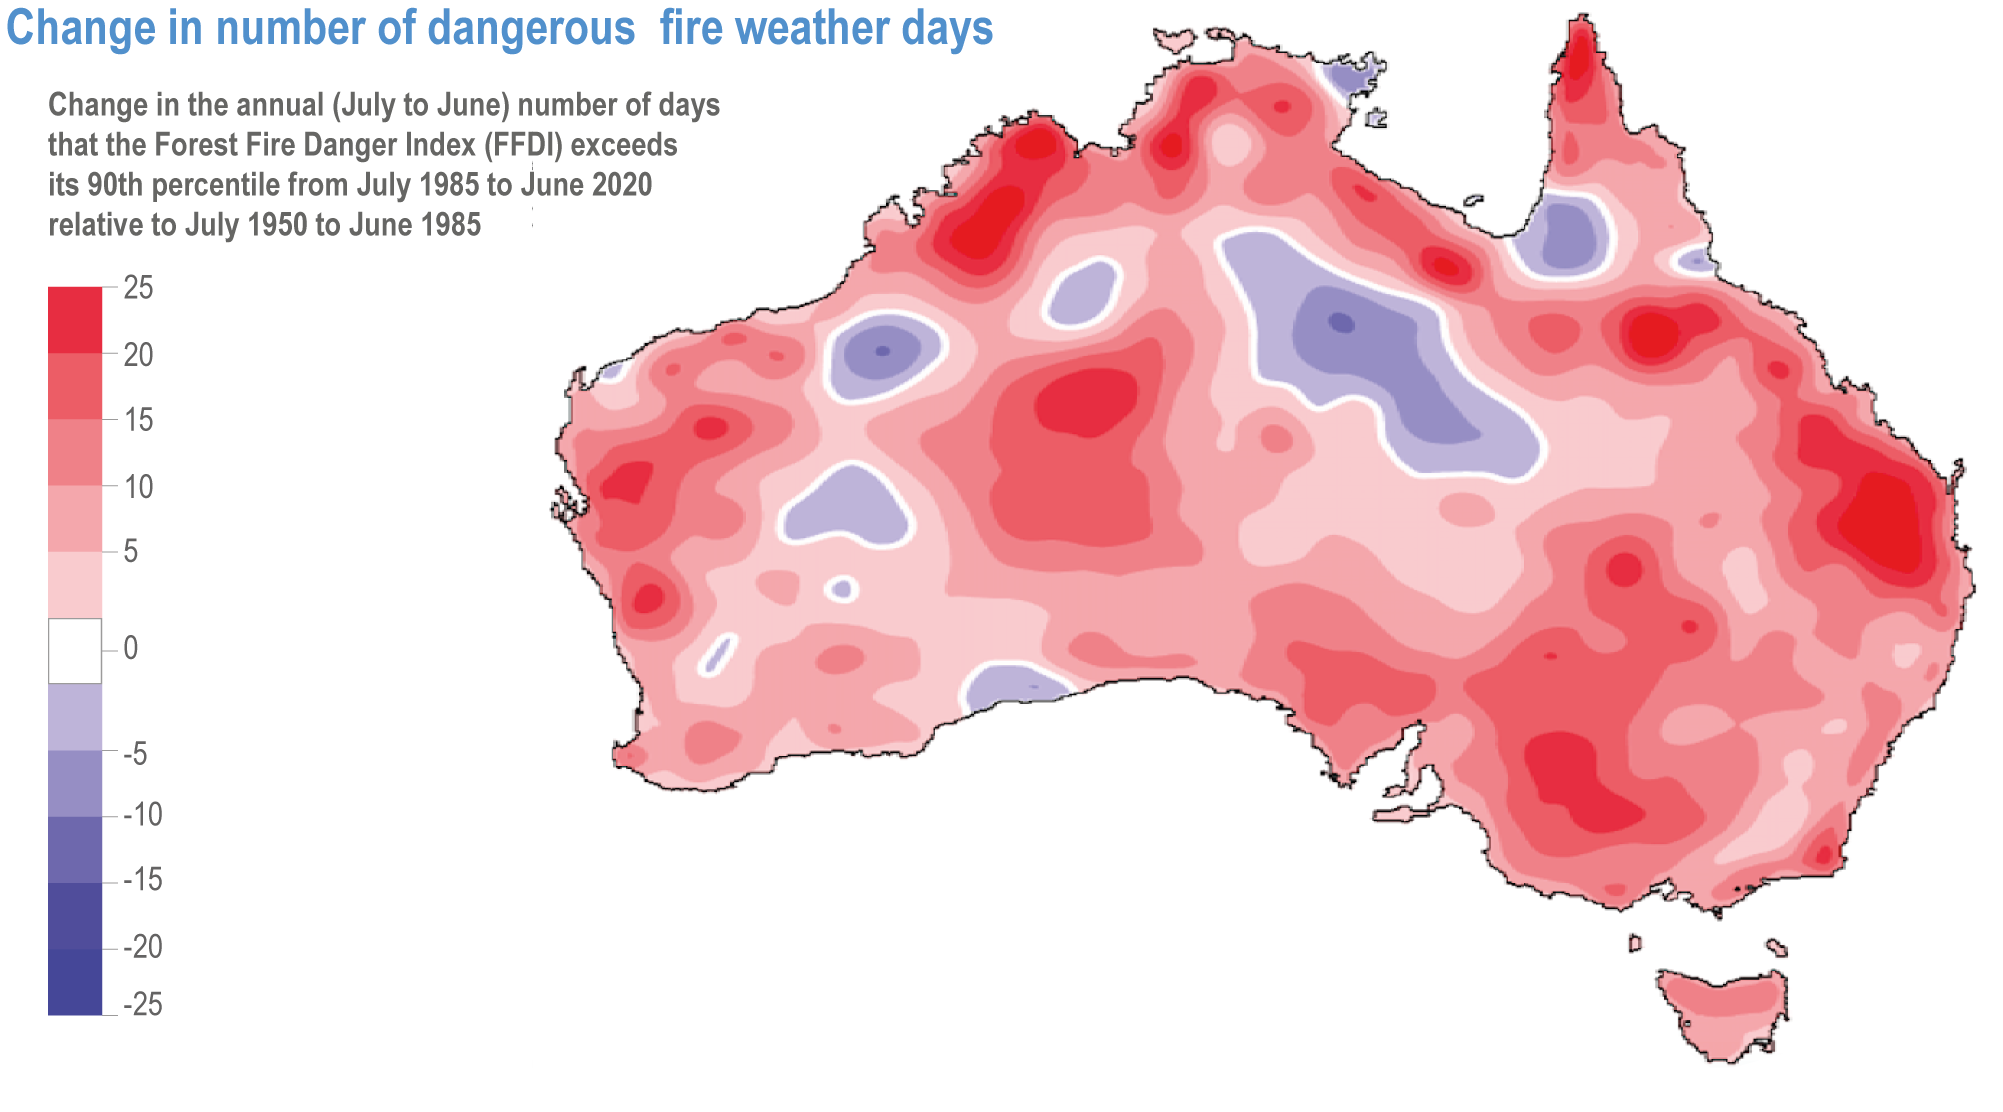
In Australia, the frequency and severity of dangerous fire weather conditions is increasing, with partial attribution to climate change (very high confidence) (Dowdy and Pepler, 2018; Abram et al., 2021) (11.2.1, Figure Box 11.1.1), especially in southern and eastern Australia during spring and summer (Harris and Lucas, 2019). Although Australia’s eucalyptus forests and woodlands are fire adapted (Collins, 2020), increasing intensity and frequency of fires may exceed their resilience because of the shorter intervals between high-severity fires (Bowman et al., 2014; Etchells et al., 2020; Lindenmayer and Taylor, 2020a). Recent fires have severely impacted eastern rainforests, including significant Gondwana refugia (Abram et al., 2021). In New Zealand, the trends in very high and extreme fire weather (1997–2019) have not yet been attributed to climate change (MfE, 2020a).

Figure Box 11.1.1 | Change in the annual (July to June) number of days that the Forest Fire Danger Index (FFDI) exceeds its 90thpercentile from July 1985 to June 2020 relative to July 1950 to June 1985 (BoM and CSIRO, 2020; Abram et al. , 2021).
Fire weather is projected to increase in frequency, severity and duration for southern and eastern Australia (high confidence) and most of New Zealand (medium confidence) (11.2.2), with projected increases in pyro-convection risk for parts of southern Australia (Dowdy et al., 2019) and increased dry-lightning and fire ignition for southeast Australia (Mariani et al., 2019; Dowdy, 2020). Increased fire risk in spring may reduce opportunities for prescribed fuel-reduction burning in some regions (Harris and Lucas, 2019; Di Virgilio et al., 2020). Fuel dryness is a key constraint on wildfire occurrence (Ruthrof et al., 2016). Vegetation change will affect fuel load and fire risk in different areas in complex ways (Watt et al., 2019; Alexandra and Max Finlayson, 2020; Clarke et al., 2020; Sanderson and Fisher, 2020).
Direct effects of wildfire include death and injury to people and animals and damage to ecosystems, property, agriculture, water supplies and other infrastructure (Brodison, 2013; Pearce, 2018; de Jesus et al., 2020; Johnston et al., 2020; Maybery et al., 2020). Indirect effects include electricity and communication blackouts leading to cascading impacts on services, infrastructure and communities (Bowman, 2012; Schavemaker and van der Sluis, 2017).
For New Zealand, there has been recent increased frequency and magnitude of property losses due to wildfire (Pearce, 2018). The 1660-hectare Port Hills fire in 2017 resulted in the greatest house losses (9) in almost 100 years (Langer et al., 2018), but the subsequent 5540-hectare Lake Ohau fire destroyed 53 houses in 2020 (Waitaki District Council, 2020).
In Australia, between 1987 and 2016, there were 218 deaths, 1000 injuries, 2600 people left homeless and 69,000 people affected by wildfire (Deloitte, 2017b). Wildfires cost about AUD$1.1 billion per year on average (11.5.2).
The Australian wildfires of 2019–2020 resulted in 33 deaths, over 3000 houses destroyed, AUD$2.3 billion in insured losses and AUD$3.6 billion in losses for tourism, hospitality, agriculture and forestry (CoA, 2020e; Filkov et al., 2020) (Figure Box 11.1.2). Smoke caused a further 429 deaths and 3230 hospitalisations as a result of respiratory distress and illness, with health costs totalling AUD$1.95 billion (Johnston et al., 2020). These fires burnt about 5.8 to 8.1 million hectares of forest in eastern Australia (Ward et al., 2020; Godfree et al., 2021), resulting in the loss or displacement of nearly 3 billion vertebrate animals (CoA, 2020e; Wintle et al., 2020). Further, 114 listed threatened species lost at least 50% of their habitat, and 49 lost 80% (Wintle et al., 2020), among other severe ecological impacts (Hyman et al., 2020). Smoke carried over 4000 km to New Zealand, where it increased snow/glacier melt through darkening surfaces and produced a detectable odour (Pu et al. 2021;(Filkov et al., 2020). The fire season of 2019–2020 was at least 30% more likely than a century ago due to the influence of climate change (van Oldenborgh et al., 2021). Following the fires, a Royal Commission into National Natural Disaster Arrangements made 80 recommendations, most of which were accepted by government, including establishing a disaster advisory body and a resilience and recovery agency (11.5.2.3) (CoA, 2020e).
In the face of climate change and the increased cost of fire damage and suppression, there has been considerable investment in fire risk reduction (Table Box 11.1.1). Recent analysis of 8800 fires in Australia shows resource constraints in response capacity are a barrier to effectively containing fires (Collins et al., 2018b), compounded by lengthened and more extreme fire seasons.
Table Box 11.1.1 | Examples of adaptation options and enablers to reduce wildfire risk (Hart and Langer, 2011; Mitchell, 2013; Price et al. , 2015; Tolhurst and McCarthy, 2016; Deloitte, 2017b; Miller et al., 2017; Steffen et al., 2017; Kornakova and Glavovic, 2018; Newton et al., 2018; Pearce, 2018; CoA, 2020e; McKemey et al., 2020).
Land management | Communications | Infrastructure |
Prescribed burning to reduce fuel load close to built assets. | Clearer communication of existing exposure and vulnerability to enable informed decisions about risk tolerance and management, including sites of key biodiversity that are sensitive or susceptible to fire. | Enhanced training and support for firefighters and aerial firefighting assets, including sharing of resources nationally and internationally to address the increasing overlap of fire seasons, which are lengthening across the world. |
Engagement with Australia’s Aboriginal and Torres Strait Islander Peoples to utilise and learn from their fire management knowledge and skills to assist in landscape management and greenhouse gas mitigation. | Increased research to understand interactions between fire, fuel, weather, climate and human factors to enhance projections of fire occurrence and behaviour. | Nationally consistent response to exceedance of air quality standards. |
Locating power lines appropriately or underground and decentralising power supply to reduce ignitions. | Community education and engagement, encouraging house and property maintenance, improving early-warning systems, more targeted messaging and increased emergency evacuation planning and sheltering options. | Improved governance arrangements to ensure greater accountability and coordination between agencies, sharing of data and resources for emergency planning and greater understanding of risks to critical infrastructure and supply chains. |
Preventive, community-based interventions to reduce ignitions from arson and accidental fires. | Development of new systems to augment capability of fire services and technological advances to detect and respond to fires. | |
Reduced exposure of new assets through statutory spatial planning and land use regulations, building codes and building design standards. |
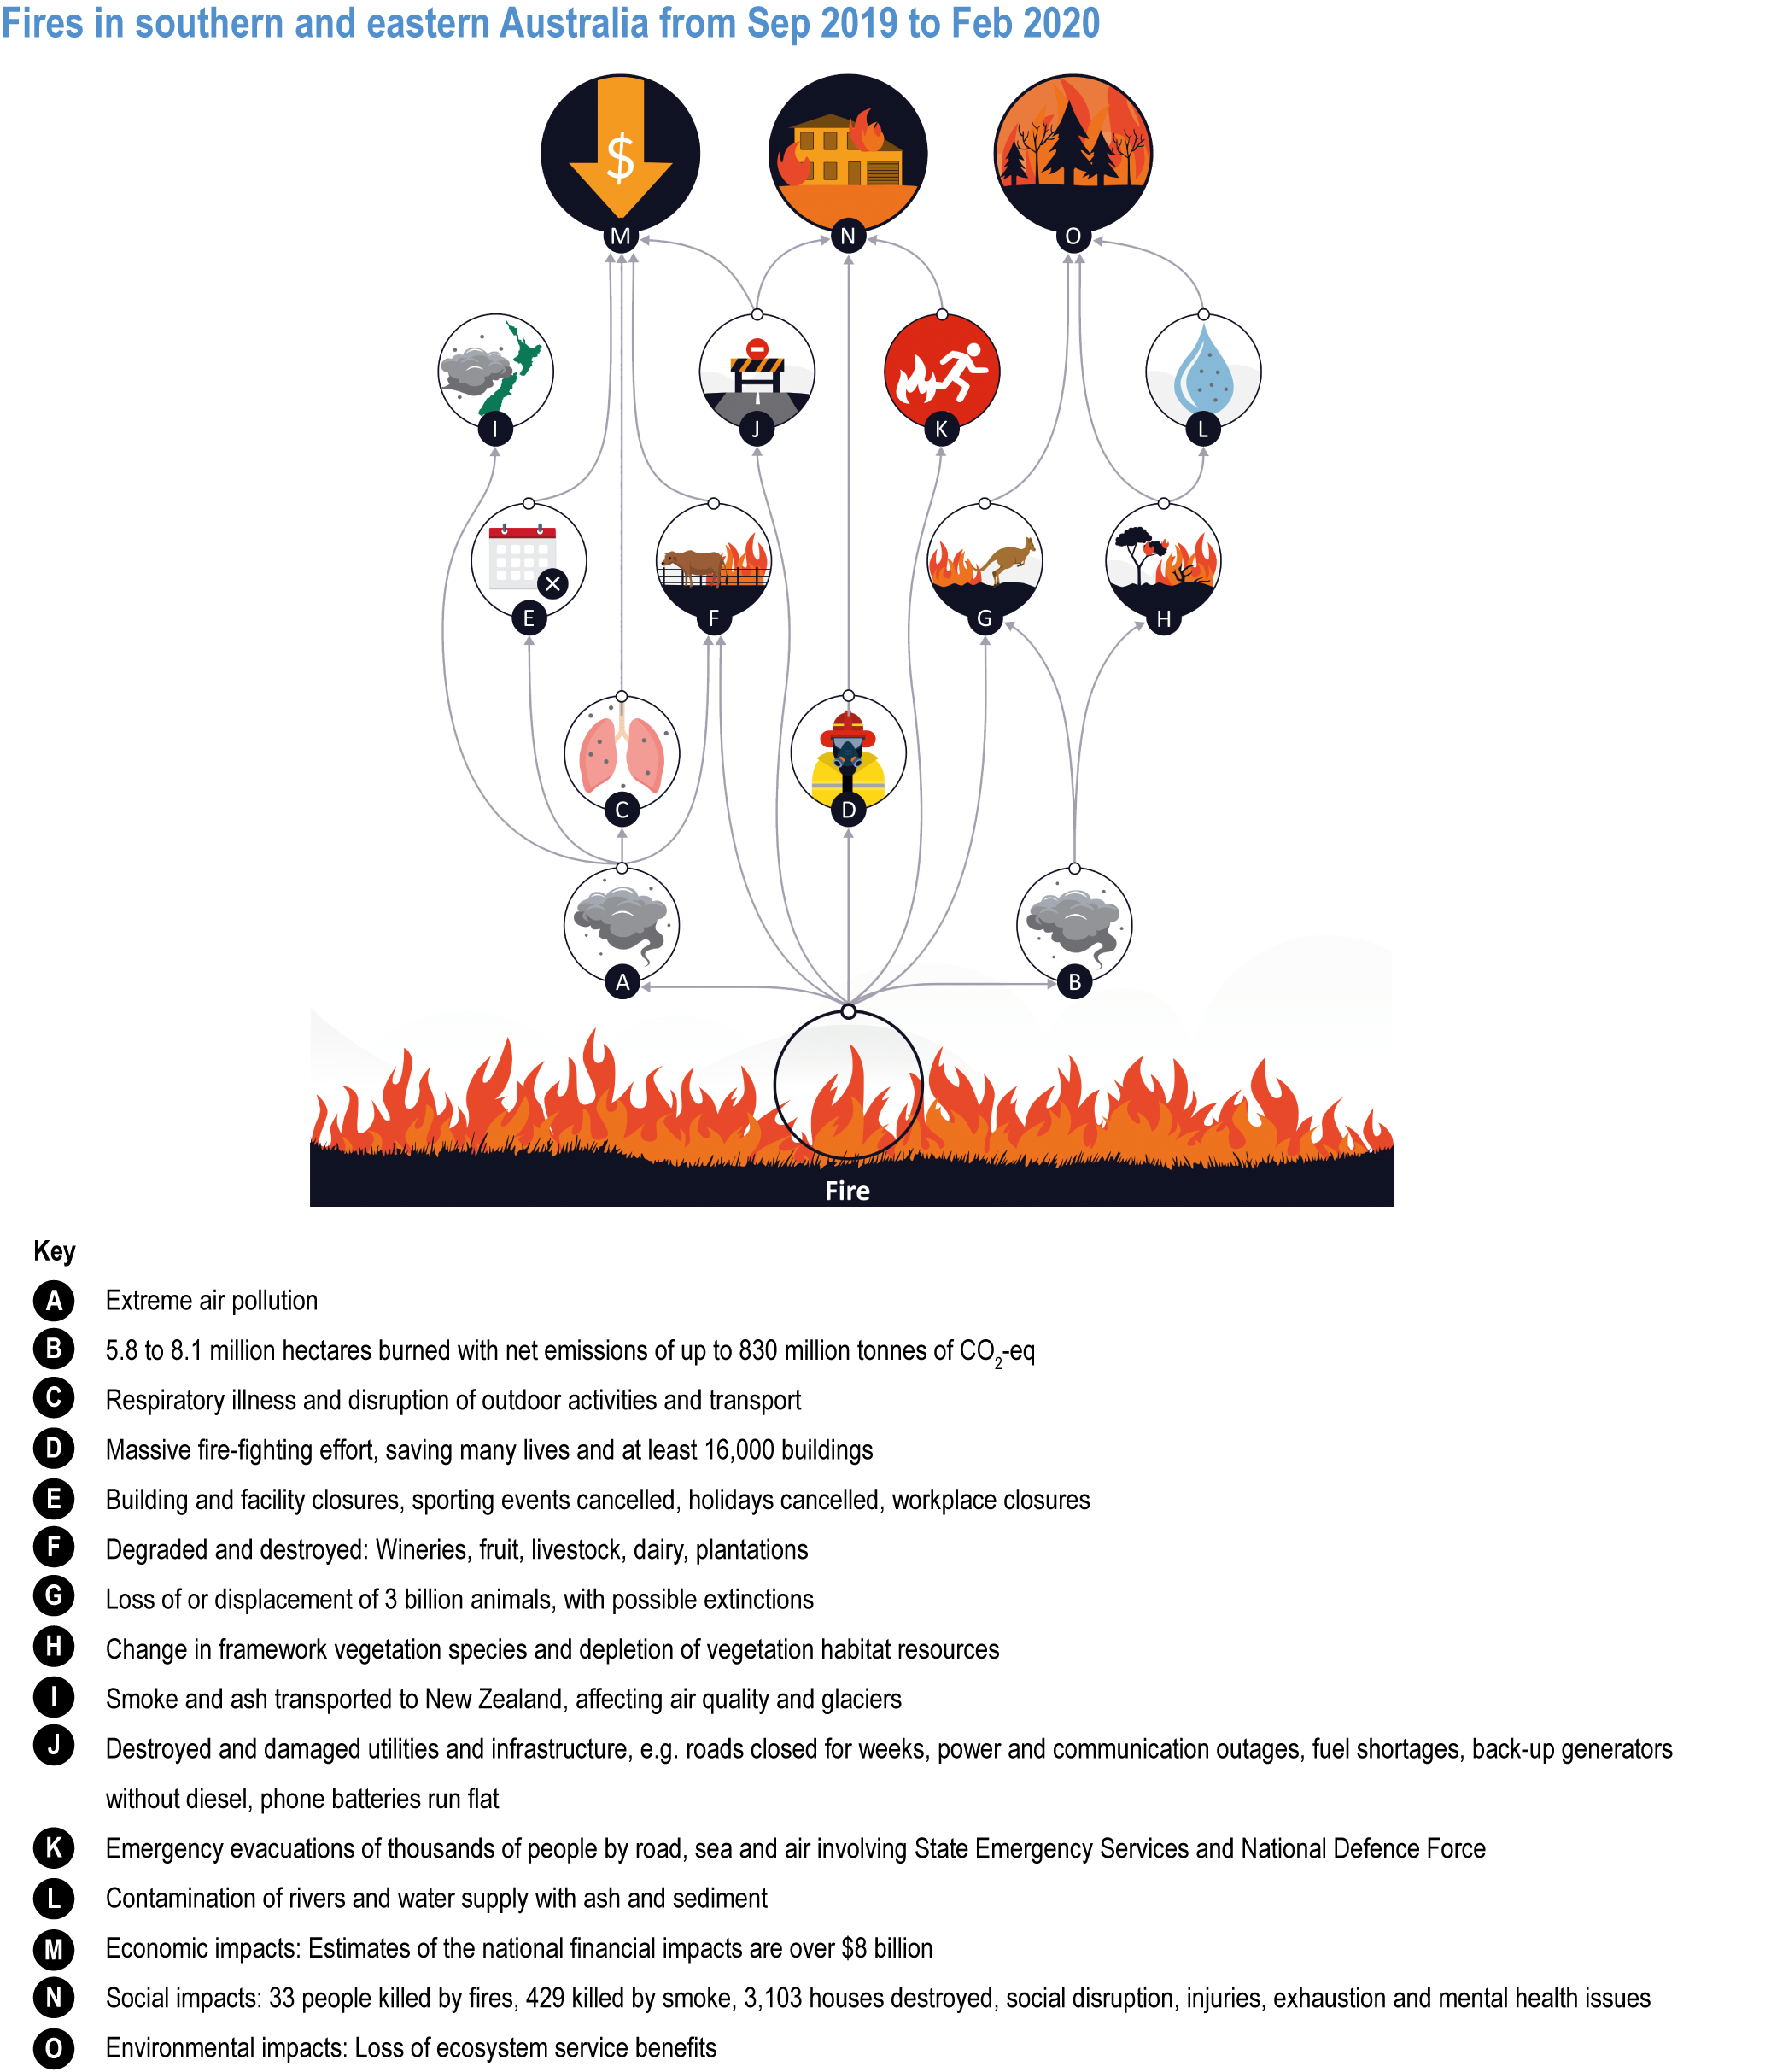
Figure Box 11.1.2 | Cascading impacts on people, economic activity, built assets, ecosystems and species arising from the Black Summer fires of 2019–2020 in eastern and southern Australia (Boer et al. , 2020; CoA, 2020e; CoA, 2020b; CoA, 2020a; CSIRO, 2020; Filkov et al., 2020; Johnston et al., 2020; Ward et al., 2020; Wintle et al., 2020; Abram et al., 2021; Godfree et al., 2021).
11.3.2 Coastal and Ocean Ecosystems
Australia’s EEZ covers over 8.1 million km 2 of marine territory, including 50,000 km of coastline (Dhanjal-Adams et al., 2016), spanning sub-Antarctic islands in the south to tropical waters in the north. New Zealand’s marine territory extends from the sub-tropics to sub-Antarctic waters, encompassing an EEZ of 4 million km 2, 18,000 km of coastline and 700 smaller islands and islets, in addition to the two main islands (Costello et al., 2010a; MfE, 2016).
The marine environment is important to the culture, health and well-being of the region’s diverse Indigenous Peoples, including those who had sovereign ownership, governance, resource rights, and stewardship over ‘Sea Country’ for many thousands of years before the current sea level stabilised approximately 6000 years ago and before current coastal ecosystems were established (Rist et al., 2019). Marine environments contribute AUD$69 billion per year to Australia’s economy (Eadie et al., 2011), and NZD$4 billion per year to New Zealand’s economy (MfE, 2016). They have a high proportion of rare and endemic species (Croxall et al., 2012) and provide ecosystem services including food production, coastal protection, tourism and carbon sequestration (Croxall et al., 2012; Kelleway et al., 2017). Half of the species within New Zealand’s seas are endemic (Costello et al., 2010b).
11.3.2.1 Observed Impacts
Climate change is having major impacts on the region’s oceans (very high confidence) (Table 11.6) (Law et al., 2016; Sutton and Bowen, 2019). Rising sea surface temperatures (SSTs) have exacerbated marine heatwaves, notably near western Australia in 2011, the GBR in 2016, 2017 and 2020 and the Tasman Sea in 2015/2016, 2017/2018 and 2018/2019 (Table 11.2) (BoM and CSIRO, 2018 ; AMS, 2019; NIWA, 2019; Salinger et al., 2019b; Sutton and Bowen, 2019; BoM, 2020; Salinger et al., 2020; Oliver et al., 2021). Temperature anomalies ranged from 1.2°C to 4.0°C and durations ranged from 90–250 days (Table 11.2).
Table 11.6 | Observed climate-change-related changes in the marine ecosystems of Australia and New Zealand. Climate-related impacts have been documented at a range of scales from single-species or region-specific studies to multi-species or community-level changes.
Type of change | Examples | Climate-related Pressure | Source |
Australia | |||
Reduced activity and increased energetic demands | Coral trout (Plectropomus leopardus), one of Australia’s most important commercial and recreational tropical finfish species | Increased temperature (experimental laboratory study) and ocean warming | |
Estuaries warming and freshening | Australian lagoons and rivers warming and decreasing pH at a faster rate than predicted by climate models | Warming and reduction in rainfall (leading to reduced flows and therefore being less frequently open to the sea) | |
Changes in life-history traits, behaviour or recruitment | Reduced size of Sydney rock oysters (for commercial sale) | Limited capacity to bio mineralise under acidification conditions | |
Reduced growth in tiger flathead fish in equatorward range | Ocean warming | ||
55% of 335 fish species became smaller and 45% became larger as seas warmed around Australia | Ocean warming (over three decades) | ||
Rock lobster display reduced avoidance of predators at 23°C compared to 20°C | Increased temperature (experimental laboratory study) | ||
Analysis of stress rings in cores of corals from the GBR dating back to 1815 found that following bleaching events, the coral was less affected by subsequent marine heatwaves | Heat events | ||
Mortality and reductions in spawning stocks of fishery important abalone, prawns, rock lobsters | 2011 marine heatwave | ||
Recruitment of coral on GBR reduced to 11% of long-term average | Warming-driven back-to-back global bleaching events | ||
Green turtle hatchlings from southern GBR 65–69% female and hatchlings from northern GBR 100% female for last two decades | Increased sand temperatures | ||
New diseases, toxins | First occurrence of virulent virus causing Pacific Oyster Mortality Syndrome (POMS), up to 90% of all farmed oysters died in impacted areas | Detected during heatwave | |
Mussels, scallops, oysters, clams, abalone and rock lobsters on east coast of Tasmania found to have high levels of Paralytic Shellfish toxins, originating from a bloom of harmful Alexandrium tamarense | Warming and extension of the East Australian Current | ||
Range expansion of phytoplankton Noctiluca, which can be toxic | Warming and extension of the East Australian Current | ||
Mortality of fish following algal blooms in South Australia | 2013 marine heatwave | ||
Changes in species distributions | Range extensions at the poleward range limit have been detected in: fish, cephalopods, crustaceans, nudibranchs, urchins, corals | Ocean warming | (Baird et al., 2012; Robinson et al., 2015; Sunday et al., 2015; Ling et al., 2018; Nimbs and Smith, 2018; Ramos et al., 2018; Smith et al., 2019; Caswell et al., 2020) |
Contractions in range at the equatorward range edge have been detected in anemones, asteroids, gastropods, mussels, algae | Ocean warming | (Pitt et al., 2010; Poloczanska et al., 2011; Smale et al., 2019) | |
Australia’s most southern dominant reef building coral, Plesiastrea versipora, in eastern Bass Strait, increasing in abundance at the poleward edge of the species’ range and in western Australia | Ocean warming | ||
Southwestern Australia fish assemblages—warm-water fish increasing in density at poleward edge of distributions and cool-water species decreasing in density at equatorward edge of distributions; increase in warm-water habitat forming species leading to reduced habitat for invertebrate assemblages | Combination of increased temperatures and changes in habitat-forming algal species | ||
Predicted reduction range of rare Wilsonia humilis herb in Tasmanian saltmarsh but no change in rest of community | Wetter and drier climate | ||
Changes in abundance | Shift towards a zooplankton community dominated by warm-water small copepods in southeast Australia | Ocean warming | |
Diebacks of tidal wetland mangroves | 2015–2016 heatwaves combined with moisture stress | ||
Decline in giant kelp in Tasmania, Australia, less than 10% remaining; loss of kelp Australia-wide totalling at least 140,187 hectares | Ocean warming and change in East Australian Current (lower nutrients) | (Wahl et al., 2015; Butler et al., 2020; Filbee-Dexter and Wernberg, 2020) | |
Regional loss of seagrass in Shark Bay World Heritage Area, western Australia | High air and water temperatures during 2011 heatwave | ||
Increased annual dugong and inshore dolphin mortality across Queensland | Sustained low air temperature and increased freshwater discharge during high Southern Oscillation Index (SOI) (ENSO) index | ||
Predicted equatorward decline and poleward shift of sea urchin in eastern Australia | Ocean warming | ||
Increasing mortality of Australian fur seal pups in low-lying colonies | Storm surges and high tides amplified by ongoing SLR | (McLean et al., 2018) (Box 11.6) | |
Rapid shifts in community composition, structure and integrity | Community-wide tropicalisation in Australian temperate reef communities; temperate species replaced by seaweeds, invertebrates, corals, and fishes characteristic of sub-tropical and tropical waters | Extreme marine heatwaves led to 100-km range contraction of extensive kelp forests | |
Ongoing declines in habitat-forming seaweeds | Climate-driven shift of tropical herbivores | (Thomson et al., 2015; Nowicki et al., 2017; Zarco-Perello et al., 2017; Wernberg et al., 2016) | |
Dieback of temperate seagrass in Shark Bay, Australia, subsequently replaced by tropical early successional seagrass with seagrass-associated megafauna (sea turtles) declining in health status | 2011 marine heatwave | ||
Increased herbivory by fish on tropicalised reefs of western Australia | Change in species composition due to ocean warming | ||
No recovery 2 years after coral bleaching and macroalgae mortality in western Australia | 2011 marine heatwave | ||
Mass mortality of particular coral species on affected reefs during heatwaves on GBR (Eastern Australia) led to altered coral reef structure and species composition 8 months later. | 2016 marine heatwave | ||
Community-wide restructuring along GBR 1 year after the 2016 mass bleaching event | 2016 marine heatwave | (Stuart-Smith et al., 2018) | |
New Zealand | |||
Changes in life-history | Alteration of shell of pāua (black footed abalone, Haliotis iris) under lowered pH (calcite layer thinner, greater etching of external shell surface) | Lowered pH (experimental laboratory study) | |
Decline in maximum swimming performance of kingfish and snapper | Elevated CO2 (experimental laboratory study) | ||
Increased mortality and faster growth in juvenile kingfish | Increased temperature | ||
Earlier spawning of snapper in South Island | 2017–2018 heatwave | ||
Increase in mortality | Heat stress mortality in salmon farms off Marlborough, New Zealand, where 20% of salmon stocks died | 2017–2018 marine heatwave | |
Changes in species distributions | Species increasingly caught further south (e.g., snapper and kingfish) | Ocean warming and 2017–2018 marine heatwave | |
Non-breeding distribution of New Zealand nesting seabird (Antarctic prion) shifting south with long-term climate inferred from stable isotopes | Climate warming | ||
Less phytoplankton production in Tasman Sea but more on sub-tropical front | Ocean warming | ||
Loss of bull kelp (Durvillaea) populations in southern New Zealand subsequently replaced by introduced kelp Undaria | 2017–2018 heatwave when sea and air temperatures exceeded 23°C and 30°C respectively | (Salinger et al., 2019b; Thomsen et al., 2019; Salinger et al., 2020) | |
Ocean carbon storage and acidification has led to decreased surface pH in the region (Table 11.2), including the sub-Antarctic waters off the East Coast of New Zealand’s South Island (very high confidence) (Law et al., 2016). The depth of the Aragonite Saturation Horizon has shallowed by 50–100 m over much of New Zealand, which may limit and/or increase the energetic costs of growth of calcifying species (low confidence) (Anderson et al., 2015; Bostock et al., 2015; Mikaloff-Fletcher et al., 2017).
In the estuaries of southwestern Australia, sustained warming and drying trends have caused dramatic declines in freshwater flows of up to 70% since the 1970s and increased frequency and severity of hypersaline conditions, enhanced water column stratification and hypoxia and reduced flushing and greater retention of nutrients (Hallett et al., 2017).
Extensive changes in the life history and distribution of species have been observed in Australia’s (very high confidence) (Gervais et al., 2021) and New Zealand’s marine systems (medium confidence) (Table 11.6) (Cross-Chapter box MOVING SPECIES in Chapter 5). New occurrences or increased prevalence of disease, toxins and viruses are evident (de Kantzow et al., 2017; Condie et al., 2019), along with heat stress mortalities and changes in community composition (Wernberg et al., 2016; Zarco-Perello et al., 2017; Thomsen et al., 2019). Extreme climatic events in Australia from 2011 to 2017 led to abrupt and extensive mortality of key habitat-forming organisms — corals, kelps, seagrasses and mangroves — along over 45% of the continental coastline of Australia (high confidence) (Babcock et al., 2019).
In 2016 and 2017, the GBR experienced consecutive occurrences of the most severe coral bleaching in recorded history (very high confidence) (Box 11.2), with shallow-water reef in the top two-thirds of the GBR affected and the severity of bleaching on individual reefs tightly correlated with the level of local heat exposure (Hughes et al., 2018b; Hughes et al., 2019c). Mass mortality of corals from these two unprecedented events resulted in larval recruitment in 2018 declining by 89% compared to historical levels (Hughes et al., 2019b). southern reefs were also affected by warming, although significantly less than in the north (Kennedy et al., 2018). Coral reefs in Australia are at very high risk of continued negative effects on ecosystem structure and function (very high confidence) (Hughes et al., 2019b), cultural well-being (very high confidence) (Goldberg et al., 2016; Lyons et al., 2019), food provision (medium confidence) (Hoegh-Guldberg et al., 2017), coastal protection (high confidence) (Ferrario et al., 2014) and tourism (high confidence) (Deloitte Access Economics, 2017; Prideaux and Pabel, 2018; GBRMPA, 2019). If bleaching persists, an estimated 10,000 jobs and AUD$1 billion in revenue would be lost per year from declines in tourism alone (Swann and Campbell, 2016).
11.3.2.2 Projected Impacts
Future ocean warming, coupled with periodic extreme heat events, is projected to lead to the continued loss of ecosystem services and ecological functions (high confidence) (Smale et al., 2019) as species further shift their distributions and/or decline in abundance (Day et al., 2018). Compounding climate-driven changes in the distribution of habitat-forming species, invasive macroalgae are predicted to exhibit higher growth under all higher pCO2 and lower pH conditions (Roth-Schulze et al., 2018). Corals and mangroves around northern Australia and kelp and seagrass around southern Australia are of critical importance for ecosystem structure and function, fishery productivity, coastal protection and carbon sequestration; these ecosystem services are therefore extremely likely 2 to decline with continued warming. Equally, many species provide important ecosystem structure and function in New Zealand’s seas including in the deep sea (Tracey and Hjorvarsdottir, 2019). The future level of sustainable exploitation of fisheries is dependent on how climate change impacts these ecosystems. Native kelp is projected to further decline in southeastern New Zealand with warming seas (Table 11.6). Climate change could affect New Zealand fisheries’ productivity (Cummings et al., 2021), and both ocean warming and acidification may directly affect shellfish culture (Cunningham et al., 2016; Cummings et al., 2019) and indirectly through changes in phytoplankton production (Pinkerton, 2017).
Climate-change-related temperature and acidification may affect species sex ratios and, thus, population viability (medium confidence) (Table 11.3) (Law et al., 2016; Tait et al., 2016; Mikaloff-Fletcher et al., 2017). Acidification may alter sex determination (e.g., in the oyster Saccostrea glomerate), resulting in changes in sex ratios (Parker et al., 2018), and may thus affect reproductive success (low confidence). Decreasing river flows (Chiew et al., 2017) are projected to cause periodically open estuaries across southwest Australia to remain closed for longer periods, inhibiting the extent to which marine taxa can access these systems (Hallett et al., 2017) and with warming predicted to constrain activity in some large fish (Scott et al., 2019b). Major knowledge gaps include environmental tolerances of key life stages, sources of recruitment, population linkages, critical ecological (e.g., predator–prey interactions) or phenological relationships and projected responses to lowered pH (Fleming et al., 2014; Fogarty et al., 2019).
Black-browed albatrosses breeding on Macquarie Island may be more vulnerable to future climate-driven changes to weather patterns in the Southern Ocean and potential latitudinal shifts in the sub-Antarctic Front (Cleeland et al., 2019). New Zealand coastal ecosystems face risks from sea level rise (SLR) and extreme weather events (MfE, 2020a).
Nutrient availability and productivity in the sub-tropical waters of New Zealand are projected to decline due to increased SST and strengthening of the thermocline, but they may increase in sub-Antarctic waters, potentially bringing some benefit to fish and other species (low confidence) (Law et al., 2018b). For New Zealand waters as a whole, declines in net primary productivity of 1.2% and 4.5% are projected under RCP4.5 and RCP8.5 respectively by 2100, and declines in the primary production of surface waters by an average 6% from the present day under RCP8.5, with sub-tropical waters experiencing the largest decline (Tait et al., 2016).
The pH of surface waters around New Zealand is projected to decline by 0.33 under RCP 8.5 by 2090 (Tait et al., 2016), and the depth at which carbonate dissolves is projected to be significantly shallower (Mikaloff-Fletcher et al., 2017), affecting the distribution of some species of calcifying cold water corals (medium confidence) (Law et al., 2016). However, model projections suggest that the top of the Chatham Rise may provide temporary refugia for scleractinian stony corals from ocean acidification because the Chatham Rise sits above the aragonite saturation horizon (Anderson et al., 2015; Bostock et al., 2015). For sub-tropical corals, skeletal formation will be vulnerable to the changes in ocean pH, with implications for their longer-term growth and resilience (Foster et al., 2015).
11.3.2.3 Adaptation
Climate change adaptation opportunities and pathways have been identified across aquaculture, fisheries, conservation and tourism sectors in the region (MacDiarmid et al., 2013; Fleming et al., 2014; MPI, 2015; Jennings et al., 2016; MfE, 2016; Royal Society Te Apārangi, 2017; Ling and Hobday, 2019), and some stakeholders are already autonomously adapting (Pecl et al., 2019). Some fishing and aquaculture industries use seasonal forecasts of environmental conditions to improve decision-making, risk management and business planning (Hobday et al., 2016), with the potential to use 5-yearly forecasts similarly (Champion et al., 2019). Shifts in the distribution and availability of target species (e.g., oceanic tuna) would impact the ability of domestic fishing vessels to continue current fishing practices, with potential social and economic adjustment costs (Dell et al., 2015), including disruption to supply chains (Fleming et al., 2014; Plagányi et al., 2014) (Cross-Chapter Box MOVING SPECIES in Chapter 5). Species abundance data are insufficient to enable projections of climate impacts on fishery productivity. However, fishery and aquaculture industries are considering adaptation strategies, such as changing harvests and relocating farms (Pinkerton, 2017). Thus, while climate change is extremely likely to affect the abundance and distribution of marine species around New Zealand, insufficient monitoring means there is limited evidence of ecosystem level change in biodiversity to date and no quantitative projections of which species may win and lose to climate change (Table 11.6) (Law et al., 2018a; Law et al., 2018b).
Box 11.2 | The Great Barrier Reef in Crisis
The GBR is the world’s largest coral reef system, comprising 3863 reefs over an area of 348,700 km 2, stretching for 2300 km. The GBR is a central cornerstone of the beliefs, knowledges, lores, languages and ways of living for over 70 geographically and culturally diverse Traditional Owner groups spanning the length of the GBR (Dale et al., 2018), and it contributes an estimated AUD$6.4 billion per year (pre-COVID) to the Australian economy, mainly via tourism. As the world’s most extensive coral reef ecosystem, the GBR is a globally outstanding and significant entity, with practically the entire ecosystem inscribed as a World Heritage Site in 1981 (UNESCO, 1981).
The GBR is already severely impacted by climate change, particularly ocean warming, through more frequent and severe coral bleaching (very high confidence) (Hughes et al., 2018b; Hughes et al., 2019c). The worst coral bleaching event on record affected over 90% of reefs in 2016 (Hughes et al., 2018b). In the most northern 700-km-long section of the GBR in which the heat exposure was the most extreme, 50% of the coral cover on reef crests was lost within 8 months (Hughes et al., 2018c). Throughout the entire GBR, including the southern third where heat exposure was minimal, the cover of corals declined by 30% between March and November 2016 (Hughes et al., 2018b). In 2017, the central third of the reef was the most severely affected and the back-to-back regional-scale bleaching events has led to an unprecedented shift in the composition of GBR coral assemblages, transforming the northern and middle sections of the reef system (Hughes et al., 2018c) to a highly degraded state (very high confidence). Coral recruitment to the GBR in 2018 was reduced to only 11% of the long-term average (Hughes et al., 2019b). A mass bleaching event also occurred in 2020, making it the third event in 5 years (BoM, 2020) (Figure Boxes 11.2.1 and 11.2.2).

Figure Box 11.2.1 | Top panels: spatial patterns in heat exposure along the GBR in 2016 (left pair) and 2017 (right pair), measured from satellites as Degree Heating Weeks (DHW, °C-weeks). Middle panels: geographic footprint of recurrent coral bleaching in 2016 (left) and again in 2017 (right), measured by aerial assessments of individual reefs (adapted from (Hughes et al., 2019c)]). Bottom panels: density of coral recruits (mean per recruitment panel on each reef), measured over three decades, from 1996 to 2016 (n= 47 reefs, 1784 panels) (left), compared to the density of coral recruits in 2018 after the mass mortality of corals in 2016 and 2017 due to the back-to-back bleaching events (n= 17 reefs, 977 panels) (right). The area of each circle is scaled to the overall recruit density of spawners and brooders combined. Yellow and blue indicate the proportion of spawners and brooders respectively (from (Hughes et al., 2019b)]).
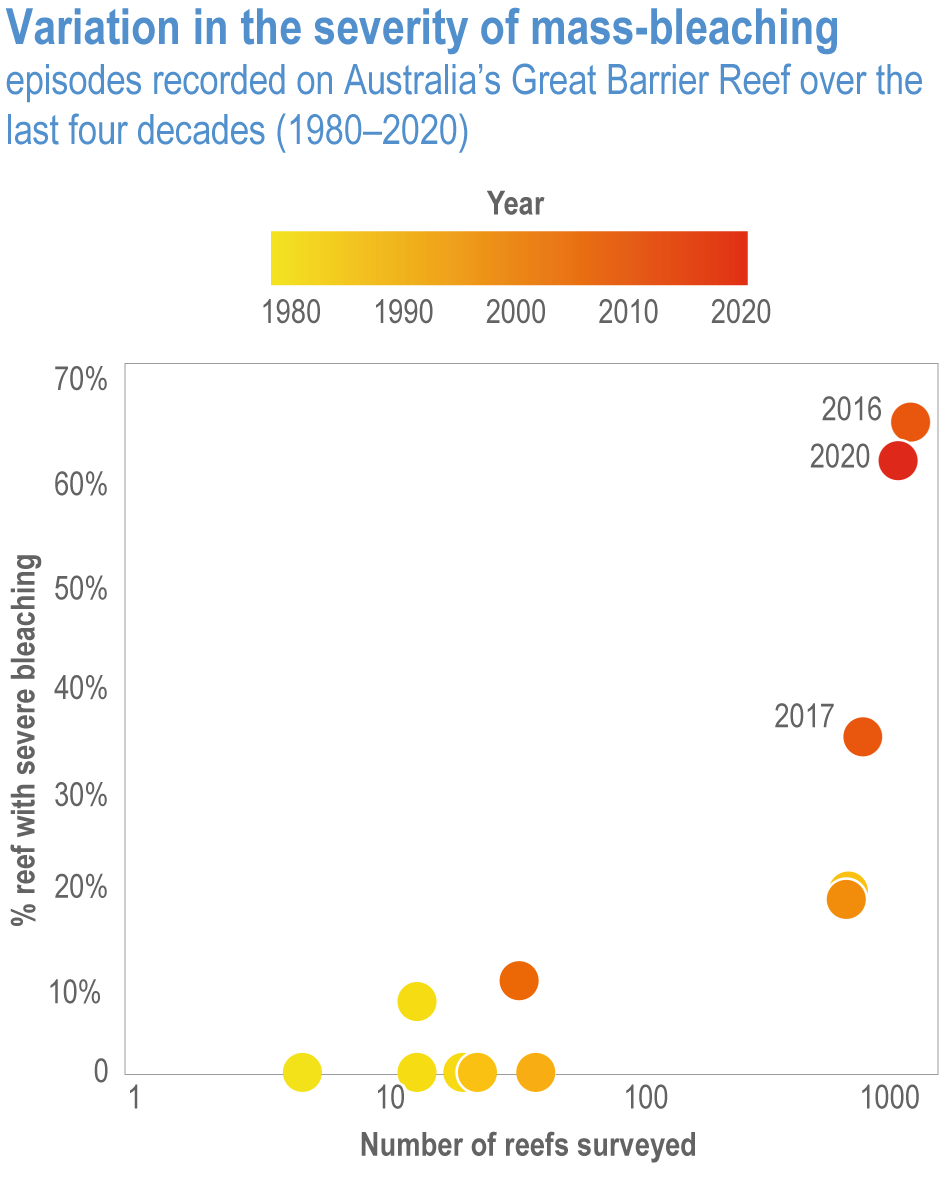
Figure Box 11.2.2 | Variation in the severity of mass-bleaching episodes recorded on Australia’s GBR over the last four decades (1980–2020). The overall number of reefs surveyed was substantially higher in 1998, 2002, 2016, 2017 and 2020 when aerial surveys were undertaken, whereas the severity of other more localised bleaching episodes was documented with in-water surveys (adapted from (Pratchett et al., 2021). Extent of bleaching in 2020 was similar in severity to that of 2016 but more geographically widespread and included southern reefs.
Increased heat exposure also affects the abundance and distribution of associated fish, invertebrates and algae (high confidence) (Stuart-Smith et al., 2018). Thus, coral bleaching is an indicator of thermal effects on coral habitat, fauna and flora. Bleaching is expected to continue for the GBR and Australia’s other coral reef systems (virtually certain). Bleaching conditions are projected to occur twice each decade from 2035, annually after 2044 under RCP8.5 and annually after 2051 under RCP4.5 (Heron et al., 2017). Global warming of 3°C would result in over six times the 2016 level of thermal stress (Lough et al., 2018).
Increases in cyclone intensity projected for this century, and other extreme weather events, will greatly accelerate coral reef degradation (Osborne et al., 2017). Additionally, through interactions between elevated ocean temperature and coastal runoff (nutrient and sediment), extreme weather events may contribute to an increased frequency and/or amplitude of crown-of-thorns starfish outbreaks (Uthicke et al., 2015), further reducing the spatial distribution of coral.
Recovery of coral reefs following repeated disturbance events is slow (Hughes et al., 2019b; IPCC, 2019b), and it takes at least a decade after each bleaching event for the very fastest growing corals to recover (high confidence) (Gilmour et al., 2013; Osborne et al., 2017). Estimates of future levels of thermal stress, measured as degree heating months, which incorporates both the magnitude and duration of warm season SST anomalies, suggest that achieving the 1.5°C Paris Agreement target would be insufficient to prevent more frequent mass bleaching events (very high confidence) (Lough et al., 2018), although it may reduce their occurrence (Heron et al., 2017), and occurrences of warming events similar to 2016 bleaching could be reduced by 25% (King et al., 2017).
Tourist motivations for visiting the GBR are changing, with a recent survey finding that two-thirds of tourists were visiting ‘before it was gone’ and a similar number were reporting damage to the reef—an example of ‘last chance tourism’ (Piggott-McKellar and McNamara, 2016). The Australian government is investing AUD$1.9 billion to support the GBR through science and practical environmental outcomes, including reducing other anthropogenic pressures, which can suppress natural adaptive capacity (CoA, 2019b; GBRMPA, 2019). However, adaptation efforts on the GBR aimed specifically at climate impacts, for example coral restoration following marine heatwave impacts (Boström-Einarsson et al., 2020), may slow the impacts of climate change in small discrete regions of the reef or reduce short-term socioeconomic ramifications, but they will not prevent widespread bleaching (Condie et al. 2021).
11.3.3 Freshwater Resources
Climate change impacts on freshwater resources cascade across people, agriculture, industries and ecosystems (Boxes 11.3 and 11.5). The challenge of satisfying multiple demands with a finite resource is exacerbated by high interannual and inter-decadal variability of river flows, particularly in Australia (Chiew and McMahon, 2002; Peel et al., 2004; McKerchar et al., 2010).
11.3.3.1 Observed Impacts
Streamflow has generally increased in northern Australia and decreased in southern Australia since the mid-1970s (high confidence) (Zhang et al., 2016). Declining river flows since the mid-1970s in southwest Australia have led to changed water management (WA Government, 2012; WA Government, 2016). The large decline in river flows during the so-called 1997–2009 Millennium drought in southeast Australia resulted in low irrigation water allocations, severe water restrictions and major environmental impacts (Potter et al., 2010; Chiew and Prosser, 2011; Leblanc et al., 2012; van Dijk et al., 2013). The drying in southern Australia highlighted the need for hydrological models that adequately account for climate change (Vaze et al., 2010; Chiew et al., 2014; Saft et al., 2016; Fowler et al., 2018). The decline in streamflow was largely due to the decline in cool-season rainfall (which has been partly attributed to climate change) (Figure 11.2) (Timbal and Hendon, 2011; Post et al., 2014; Hope et al., 2017; DELWP, 2020), when most of the runoff in southern Australia occurs.
In New Zealand, precipitation has generally decreased in the north and increased in the southwest (Figure 11.2) (Harrington et al., 2014), but it is difficult to ascertain trends in the relatively short streamflow records. Glaciers in New Zealand’s southern alps have lost one third of their mass since 1977 (Mackintosh et al., 2017; Salinger et al., 2019b), and glacier mass loss in 2018 was at least 10 times more likely to occur with anthropogenic forcing than without (Vargo et al., 2020).
11.3.3.2 Projected Impacts
Projections indicate that future runoff in southeast and southwest Australia are likely to decline (median estimates of 20% and 50% respectively under 2.2°C global average warming) (Figure 11.3) (Chiew et al., 2017; Zheng et al., 2019). These projections are broadly similar to those reported previously and in AR5 (Teng et al., 2012; Reisinger et al., 2014). The range of estimates arises mainly from the uncertainty in projected future precipitation (Table 11.2a).
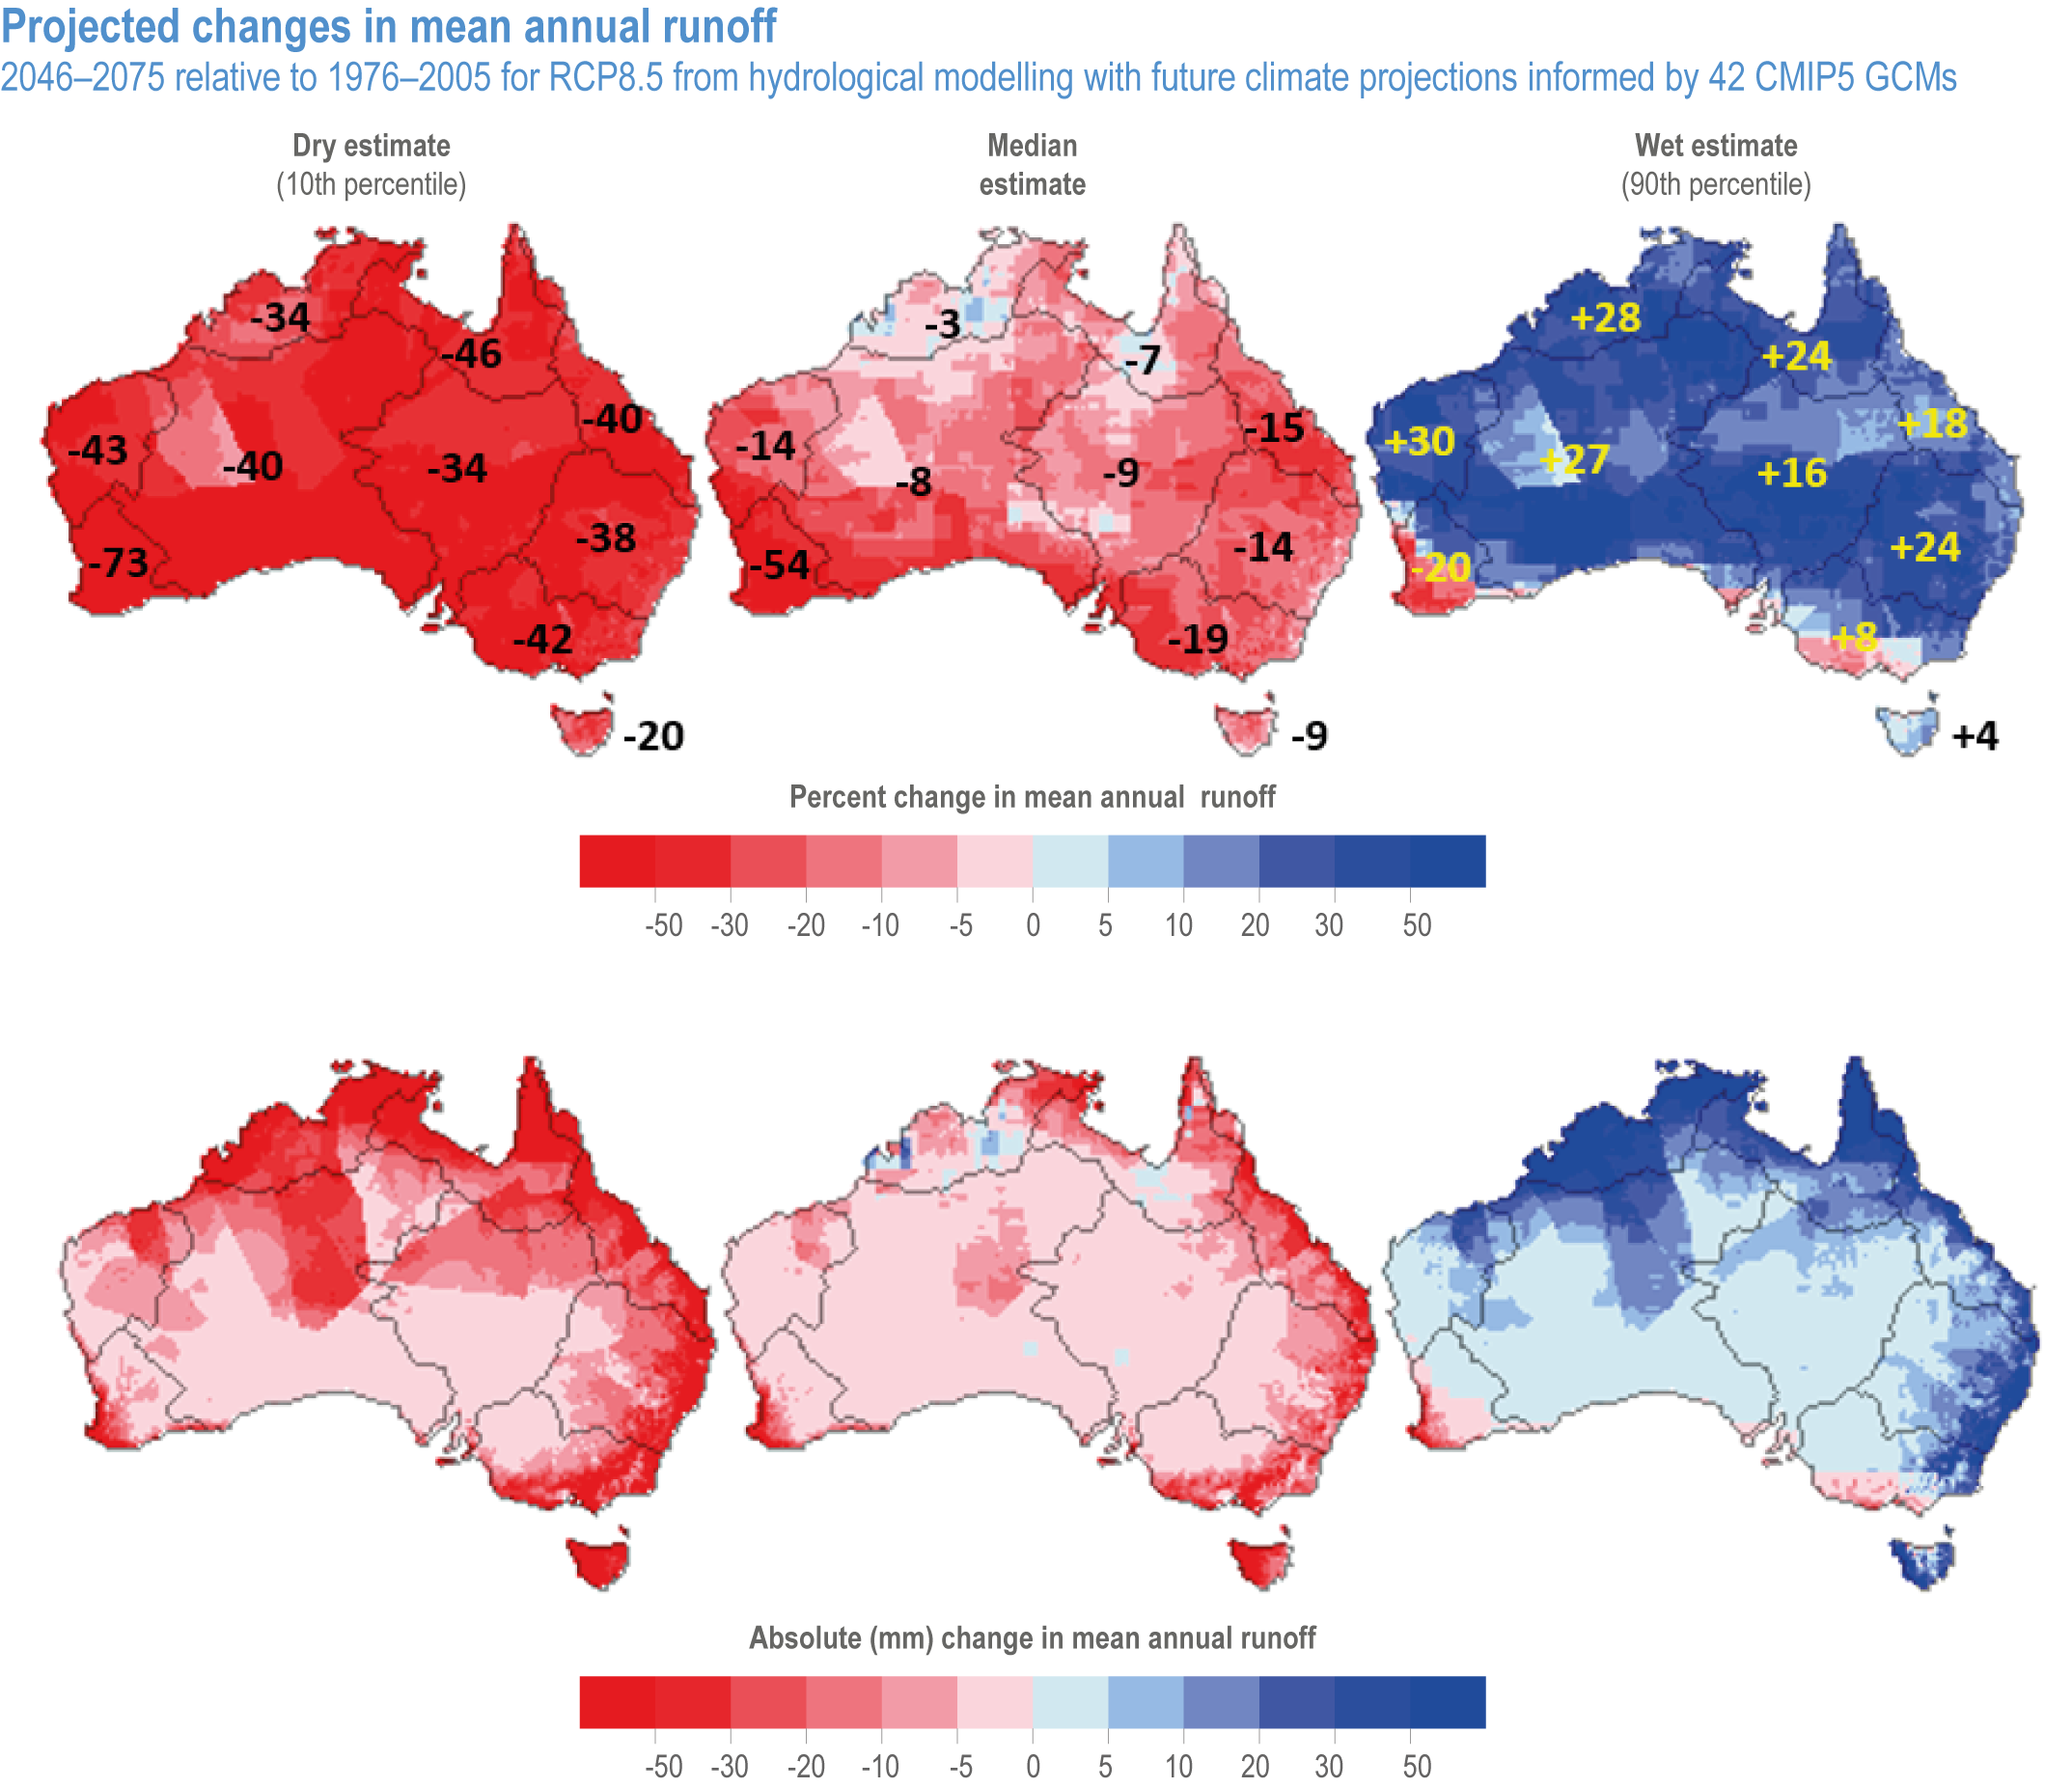
Figure 11.3 | Projected changes in mean annual runoff for 2046–2075 relative to 1976–2005 for RCP8. 5 from hydrological modelling with future climate projections informed by 42 CMIP5 GCMs. Projections for RCP4.5 are about three quarters of the aforementioned projections. Plots show median projection and the 10th and 90th percentile range of estimates. The boundaries are based on hydroclimate regions and major drainage basins. Source: (Zheng et al., 2019).
The runoff decline in southern Australia is projected to be further accentuated by higher temperature and potential evapotranspiration (Potter and Chiew, 2011; Chiew et al., 2014), transpiration from tree regrowth following more frequent and severe wildfires (Brookhouse et al., 2013) (Box 11.1), interceptions from farm dams (Fowler et al., 2015) and reduced surface–groundwater connectivity (limiting groundwater discharge to rivers) in long dry spells (high confidence) (Petrone et al., 2010; Hughes et al., 2012; Chiew et al., 2014). In the longer term, runoff will also be affected by changes in vegetation and surface–atmosphere feedback in a warmer and higher CO2 environment, but the impact is uncertain because of the complex interactions, including changes in climate inputs, fire patterns (Box 11.1) and nutrient availability (Raupach et al., 2013; Ukkola et al., 2016; Cheng et al., 2017).
Climate change is projected to affect groundwater recharge and the relationship between surface waters and aquifers and through rising sea levels where groundwater has a tidal signature (PCE, 2015; MfE, 2017a). Groundwater recharge across southern Australia has decreased in recent decades (Fu et al., 2019), and this trend is expected to continue (high confidence) (Barron et al., 2011; Crosbie et al., 2013). Climate change is also projected to impact water quality in rivers and water bodies, particularly through higher temperature and low flows (Jöhnk et al., 2008) (Box 11.5) and increased sediment and nutrient load following wildfires (high confidence) (Biswas et al., 2021) (Box 11.1) and floods (Box 11.4).
The projected changes in river flows in New Zealand are consistent with the precipitation projections (Table 11.2), with increases in the west and south of the South Island and decreases in the east and north of the North Island (Figure 11.4). In the South Island, the runoff increase occurs mainly in winter due to increasing moisture-bearing westerly airflow, with more precipitation falling as rain and snow melting earlier. In the North Island, the runoff decrease occurs in spring and summer (Caruso et al., 2017; Collins et al., 2018a; Jobst et al., 2018; D. Collins, 2020).

Figure 11.4 | Projected percentage change in mean annual runoff for 2086–2099 relative to 1986–2005 from hydrological modelling informed by six CMIP5 GCMs for four RCPs. Maps show median projection from the six modelling runs. White indicates that the change is not statistically significant. Source: (D. Collins, 2020).
11.3.3.3 Adaptation
In Australia, prolonged droughts and projections of a drier future have accelerated policy and management change in urban and rural water systems. Adaptation initiatives and mechanisms, like significant government investment to enhance the Bureau of Meteorology online water information (Vertessy, 2013; BoM, 2016), funding to improve agricultural water use and irrigation efficiency (Koech and Langat, 2018), enhanced supply through inter-basin transfers and upgrading water infrastructure and an active water trading market (Wheeler et al., 2013; Kirby et al., 2014; Grafton et al., 2016) are helping to buffer regional systems against droughts and facilitating some adaptation to climate change (medium confidence). However, these measures could also be maladaptive because they may perpetuate unsustainable water and land uses under ongoing climate change (Boxes 11.3 and 11.5).
The widespread 2017–2019 drought across eastern Australia (BoM, 2021b) has led to the Australian government establishing a Future Drought Fund (Australian Government, 2019) to enhance drought resilience and a National Water Grid Authority to develop regional water infrastructure to support agriculture. Nevertheless, the ability to adapt to climate change is compounded by uncertainties in future water projections, complex interactions between science, policy, community values and political voice, and competition between different sectors dependent on water (Boxes 11.3 and 11.5). The impact of declining water resources on agricultural, ecosystems and communities in southeastern Australia would escalate with ongoing climate change (medium confidence) (Hart, 2016; Moyle et al., 2017), highlighting the importance of more ambitious, anticipatory, participatory and integrated adaptation responses (Bettini et al., 2015; Abel et al., 2016; Marshall and Lobry de Bruyn, 2021).
Altered water regimes resulting from the combined effects of climatic conditions and water policies carry uneven and far-reaching implications for communities (high confidence). Acting on Indigenous Peoples’ claims to cultural flows (to maintain their connections with their country) is increasingly recognised as an important water management and social justice issue (Taylor et al., 2017; Hartwig et al., 2018; Jackson, 2018; Jackson and Moggridge, 2019; Moggridge et al., 2019). Compounding stressors, such as coal and coal seam gas developments, can also severely impact local communities, water catchments and water-dependent ecosystems and assets, exacerbating their vulnerability to climate change (Navi et al., 2015; Tan et al., 2015; Chiew et al., 2018).
In Australian capital cities and regional centres, water planning has focused on securing new supplies that are resilient to climate change. This includes increasing use of stormwater and sewage recycling and managed aquifer recharge (Bekele et al., 2018; Page et al., 2018; Gonzalez et al., 2020). All major coastal Australian cities have desalination plants. Household scale adaptation, like rainwater harvesting, water-smart gardens, dual flush toilets, water-efficient showerheads and voluntary residential use targets, can help reduce water demand by up to 40% (Shearer, 2011; Rhodes et al., 2012; Moglia et al., 2018). Water utilities across Australia have established climate change adaptation guidelines (WSAA, 2016). Coordinated efforts to reduce demand, design and retrofit infrastructure to reduce flood risk and harvest water and to practice water-sensitive urban design are evident (WSAA, 2016; Kunapo et al., 2018; Rogers et al., 2020b). Transitioning centralised water systems to a more sustainable basis represents adaptation progress but is complex and faces many barriers and limits (medium confidence) (Morgan et al., 2020). Developing multiple redundant or decentralised systems can enhance community resilience and promote autonomous adaptations that may be more sustainable and cost effective in the longer term (Mankad and Tapsuwan, 2011; WSAA, 2016; Iwanaga et al., 2020).
In New Zealand, many water supplies are at risk from drought, extreme rainfall events and sea level rise (SLR), exacerbated by underinvestment in existing water infrastructure (in part due to funding constraints) and urban densification (high confidence) (CCATWG, 2017; MfE and Stats NZ, 2021 ). Lessons can be learned from global experience (e.g., Cape Town, South Africa; Section 4.3.4). Water quality has diminished, with hotter conditions and drought causing algal blooms, combined with intensification of agricultural land uses in some areas, and heavy rainfall and sea level rise (SLR) causing flooding and sedimentation of water sources and health impacts (11.3.6; Box 11.5). Some towns are only partially metered or not metered at all, which exacerbates the adaptation challenge (Hendy et al., 2018; WaterNz, 2018; Paulik 2019a). Unregulated or absent water supplies accentuate risks to vulnerable groups of people (MfE, 2020b). Māori view water as the essence of all life, which makes any impacts on water a governance and stewardship concern, and increasingly, the subject of legal claims (MfE, 2020a; MfE, 2020b; MfE, 2020c) (11.4.2). Māori understanding of time can also open up new spaces for rethinking freshwater management in a climate change context that does not reinforce or rearticulate multiple environmental injustices (Parsons et al., 2021).
Water resource adaptation in New Zealand is variable across local government and water authorities but they all actively monitor water availability, demand and quality, and most have drought management plans. The 2019/2020 drought led to water shortages in the most populated areas of Waikato, Auckland and Northland, resulting in water reduction advisories and 5 to 8 weeks’ waiting time for water tank refills and water rationing. The Havelock North water supply contamination, which arose after an extreme rainfall event (DIA, 2017a; DIA, 2017b), was exacerbated by fragmented governance and led to passage of the Taumata Arawai-Water Services Regulator Act of 2020 and the Water Services Bill of 2020 aimed at the protection of source water. The 2017 update to the National Policy Statement for Freshwater Management contains guidelines for implementation at the regional level (MfE, 2017b), including consideration of climate change, which creates opportunities for adaptation. However, there remain tensions between land, water and people which are exacerbated by climate changes and have yet to be addressed (Box 11.5). The first National Adaptation Plan and the Resource Management law reform have the potential to help resolve these tensions (11.7.1) (CCATWG, 2017; MfE, 2020a).
Table 11.7 | Cities, settlements and infrastructure: key risks and adaptation options.
Sector | Key Risks | Adaptation Options | Inter-Sector Dependencies | Sources |
Road | Heat, SLR, coastal surges, floods and high-intensity rainfall impacts on road foundations | Re-routing, coastal protection, improved drainage | Ports (fuel supply), rail (fuel supply), electricity | |
Rail | Extreme temperatures, flooding, SLR, high-intensity rainfall impacts on track foundations | Drainage and ventilation improvements, systematic risk assessments, overhead wire and rail/sleeper upgrades, re-routing | Electricity, telecommunications, fuel supply (transport, ports) | |
Urban and Rural Built Environment 1 | Extreme temperatures, floods, extreme weather events, wildfire (at urban–rural interface), SLR | Multiple options from the building-to-city scale to reduce heat impacts and improve climate resilience, behavioural change, coastal defences and managed retreat | Road, rail, electricity, air and seaports, telecommunications, water and wastewater | (CoA, 2018a; Newton et al., 2018; Haddad et al., 2019; MfE, 2020a; Paulik et al., 2020; Tapper, 2021) (Box 11.1) (Box 11.4) |
Electricity | High-wind/ temperature events, wildfire, lightning, dust storms, drought (hydro) | Demand management, re-engineering and new technology, network intelligence, smart metering, improved planning for outages | Road, rail, water | (11.3.10.) |
Ports: Air and Sea | SLR, coastal surges, wind, heat, extreme weather events | Air: improved coastal, pluvial and fluvial flood protection, on-site services; sea: widening operational limits, raising wharfs, roads and breakwaters | Electricity, road, rail, water | |
Telecommunications | Floods, wildfires, extreme wind | Protect, place underground, wireless systems | Electricity, digital connectivity, all sectors serviced, rural communities | |
Stormwater Wastewater and Water supply a. | High-intensity rainfall, increased and extreme temperatures, flooding, drought, SLR | Large investments in upgrading centralised infrastructure and capacity, increasing investment in decentralised infrastructure and capacity (e.g., water-sensitive urban design), demand management, fewer options in smaller communities, governance at scale | Electricity, telecommunications, urban and rural built environment | (White et al., 2017; CoA, 2018a; Gilpin et al., 2020; MfE, 2020a; Wong et al., 2020; Hughes et al., 2021) (Box 11.4) |
Notes:
(a) Water supply safety and security and exposure of buildings have been identified as the most significant risks for New Zealand in terms of urgency and consequence (MfE, 2020a). No such ranking of risk has been done for Australia.
Box 11.3 | Drought, Climate Change and Water Reform in the Murray-Darling Basin 
The MDB is Australia’s largest, most economically important and politically complex river system (Figure Box 11.3.1). The MDB supports agriculture worth AUD$24 billion/year, 2.6 million people in diverse rural communities and important environmental assets including 16 Ramsar listed wetlands (DAWE, 2012). Climate change is projected to substantially reduce water resources in the MDB (high confidence), with the median projection indicating a 20% decline in average annual runoff under 2.2°C average global warming (Figure 11.3) (Whetton and Chiew, 2020). This reduction, plus increased demand for water in hot and dry conditions, would increase the already intense competition for water (high confidence) (CSIRO, 2008; Hart, 2016).

Figure Box 11.3.1 | (A) The Murray-Darling Basin, and (B) average annual river flows in the basin under pre-development conditions (from (CSIRO, 2008) showing that most of the runoff comes from the southeastern highlands. The borders show key drainage basins.
The economic, environmental and social impacts of the 1997–2009 Millennium Drought in the MDB (Chiew and Prosser, 2011; Leblanc et al., 2012; van Dijk et al., 2013) and projections of a drier future under climate change have accelerated significant water policy reforms costing more than AUD$12 billion (Bark et al., 2014; Docker and Robinson, 2014; Hart, 2016). These reforms included the development of a Basin Plan (MDBA, 2011; MDBA, 2012) requiring consistent regional water resource plans (MDBA, 2011; MDBA, 2012; MDBA, 2013) and environmental watering strategies (MDBA, 2014) across the MDB. Despite contestation, the reforms have resulted in some substantive achievements, including returning an equivalent of about one-fifth of consumptive water to the environment through the purchase of irrigation water entitlements and infrastructure projects (medium confidence) (Hart, 2016; Gawne et al., 2020; MDBA, 2020). However, the overall impacts of these water management initiatives are difficult to measure due to hydroclimatic variability, time lags and environmental, social and institutional complexity (Crase, 2011; Bark et al., 2014; Docker and Robinson, 2014; MDBA, 2020).
Reform initiatives such as water markets, improving agriculture water use efficiency (Koech and Langat, 2018), and increasing environmental water are helping buffer the system against droughts (medium confidence) (Moyle et al., 2017), but they can also be maladaptive by perpetuating unsustainable water and land use under ongoing climate change. While water markets can allow users to adapt and shift water to higher value uses, they can also have adverse impacts unless supported by wider policy goals and planning processes (Wheeler et al., 2013; Kirby et al., 2014; Grafton et al., 2016; Qureshi et al., 2018).
Adapting MDB management to climate risks is an escalating challenge, with the projected decline in runoff being potentially greater than the water recovered for the environment (Chiew et al., 2017). While the Basin Plan includes mechanisms for climate risk management (Neave et al., 2015), it does not require altering pre-existing rules that distribute the impacts of anticipated reductions in water resources between users (Hart, 2016; Capon and Capon, 2017; Alexandra, 2020). The intense drought conditions in 2017–2019 (BoM, 2021b), the South Australian Royal Commission investigation into the MDB reforms (SA Government, 2019b) and major fish kills in the lower Darling River in the summer of 2018/2019 (AAS, 2019; Vertessy et al., 2019) have increased concerns about the Basin Plan’s climate adaptation deficit (medium confidence). Consequently, the MDB Authority (MDBA) is undertaking an assessment of climate change risks and developing adaptation mechanisms (MDBA, 2019) that can feed into the revisions to the Basin Plan scheduled for 2026. The MDB reforms to date illustrate the difficulties in integrating climate change science and projections into management (Alexandra, 2018; Alexandra, 2020). Anticipatory and participatory governance and adaptive management approaches supported by structural and institutional reforms would support the effectiveness of the reforms (Abel et al., 2016; Alexandra, 2019; Hassenforder and Barone, 2019; Marshall and Lobry de Bruyn, 2021).
Box 11.4 | Changing Flood Risk
Pluvial (flash flood from high intensity rainfall) and fluvial (river) flooding are the most costly natural disasters in Australia, averaging AUD$8.8 billion per year (Deloitte, 2017b). In New Zealand, insured damages for the 12 costliest flood events from 2007 to 2017 exceeded NZD$472 million, of which NZD$140 million has been attributed to anthropogenic climate change (Frame et al., 2020). Extreme rainfall intensity in northern Australia and New Zealand has been increasing, particularly for shorter (sub-daily) duration and more extreme high rainfall (high confidence) (Westra and Sisson, 2011; Griffiths, 2013; Laz et al., 2014; Rosier et al., 2015) (Table 11.2b). Changes are also occurring in spatial and temporal patterns and seasonality (Wasko and Sharma, 2015; Zheng et al., 2015; Wasko et al., 2016).
Extreme rainfall is projected to become more intense (high confidence), but the magnitude of change is uncertain (Evans and McCabe, 2013; Bao et al., 2017) (Table 11.3). The insured damage in New Zealand from more intense extreme rainfall under RCP8.5 is projected to increase 25% by 2080–2100 (Pastor-Paz et al., 2020). In urban areas, extreme rainfall intensity is projected to increase pluvial flood risk (high confidence). In New Zealand, 20,000 km 2 of land, 675,000 people, and 411,000 buildings with a NZD$135 billion replacement value are exposed to flood risk (Paulik et al., 2019a).
In non-urban areas, where the flood response is also dependent on antecedent catchment conditions (Johnson et al., 2016; Sharma et al., 2018), there is no evidence of increasing flood magnitudes in Australia (Ishak et al., 2013; Zhang et al., 2016; Bennett et al., 2018), except for the most extreme events (Sharma et al., 2018; Wasko and Nathan, 2019). Modelling studies project increases in flood magnitudes in northern and eastern Australia and in western and northern New Zealand (high confidence) (Hirabayashi et al., 2013; Collins et al., 2018a; Do et al., 2020). The change in flood magnitude in southern Australia is uncertain because of the compensating effect of more intense extreme rainfall versus projected drier antecedent conditions (Johnson et al., 2016; Pedruco et al., 2018; Wasko and Nathan, 2019). Higher rainfall intensity and peak flows also increase erosion and sediment and nutrient loads in waterways (Lough et al., 2015) and exacerbate problems from ageing stormwater and wastewater infrastructure (Jollands et al., 2007; WSAA, 2016; Hughes et al., 2021).
There is some recognition of the need for flood management and planning to adapt to climate change (medium confidence) (COAG, 2011; CCATWG, 2018; CoA, 2020d). Australian flood estimation guidelines recommend a 5% increase in design rainfall intensity per degree global average warming (Bates et al., 2015). In New Zealand, the recommended increase ranges from 5% to more than 10% for shorter-duration and longer-return-period storms (MfE, 2010; Carey-Smith et al., 2018). Both guidelines also indicate the potential for higher increases in extreme rainfall intensity.
Adaptation to reduce flooding and its impacts have included improved flood forecasting (Vertessy, 2013; BoM, 2016) and risk management (AIDR, 2017), accommodating risk through raising floor levels and sealing external doors (Queensland Government, 2011; Wang et al., 2015), deploying temporary levee structures and reducing risk through spatial planning and relocation. Adaptation options in urban areas include improved stormwater management (Hettiarachchi et al., 2019; Matteo et al., 2019), ecosystem-based approaches such as maintaining floodplains, restoring wetlands and retrofitting existing flood control systems to attenuate flows, and water-sensitive urban design (WSAA, 2016; Radcliffe et al., 2017; Radhakrishnan et al., 2017; Rogers et al., 2020b).
Adaptation to changing flood risks is currently mostly reactive and incremental in response to flood and heavy rainfall events (high confidence). For example, the 2010–2011 flooding in eastern Australia resulted in changes to reservoir operations to mitigate floods (QFCI, 2012) and insurance practice to cover flood damages (Phelan, 2011; Phelan et al., 2011; QFCI, 2012; Schuster, 2013). Nevertheless, adaptation planning that is pre-emptive and incorporates uncertainties into flood projections is emerging (medium confidence) (Schumacher, 2020). Examples from New Zealand include the use of Dynamic Adaptive Pathways Planning (DAPP) (Lawrence and Haasnoot, 2017) with Real Options assessment (Infometrics and PSConsulting, 2015) and designing decision signals and triggers to monitor changes before physical and coping thresholds are reached (Stephens et al., 2018). Implementing adaptive flood risk management relies upon an understanding of how such risks change in uncertain and ambiguous ways necessitating adaptive and robust decision-making processes. These can enable learning through participatory adaptive pathways approaches (Lawrence and Haasnoot, 2017; Bosomworth and Gaillard, 2019) and through coordination across different levels of government and statutory mandates, adaptation funding and individual and community adaptations (Glavovic et al., 2010; Boston and Lawrence, 2018; McNicol, 2021).
Box 11.4
11.3.4 Food, Fibre, Ecosystem Products
The food, fibre and ecosystem product sectors are economically important in the region. Agriculture contributes around 4% of New Zealand GDP and 2% of Australian GDP and over 50% of New Zealand’s and 11% of Australia’s exports (NZ Treasury, 2016; Jackson et al., 2020). Forestry contributes 1% of New Zealand GDP and 0.5% Australian GDP (NZ Treasury, 2016; Whittle, 2019). With processing and indirect effects, the primary sector of New Zealand contributes 25% of GDP (Saunders et al., 2016). The region has the lowest level of agricultural subsidies across the OECD (OECD, 2017) and highly responsive producers to market drivers but limited strategic, longer-term approaches to environmental challenges and adaptation (Wreford et al., 2019). Both countries receive government financial drought assistance (Pomeroy, 2015; Downing et al., 2016).
Impacts resulting from climate change are observed across sectors and the region (high confidence). While more intense changes are observed in Australia, New Zealand is also experiencing impacts, including the economic impacts of drought attributable to climate change (Frame et al. 2020). Overall, modelling indicates that negative impacts will intensify with increased levels of warming in both countries, with declining crop yield and quality, and negative effects on livestock production and forestry. Although benefits are identified, particularly in the short term for New Zealand (MfE, 2020a), an absence of studies that consider the totality of climatic variables, including extremes, moderate the benefits identified from considering only selected variables and systems in isolation.
Incremental adaptation is occurring (Hochman et al., 2017; Hughes and Lawson, 2017; Hughes and Gooday, 2021). In the longer term, transformative adaptation, including land use change, will be required (Cradock-Henry et al., 2020a), both as a result of sectoral adaptations and mitigation (medium confidence) (Grundy et al., 2016). Specific changes are context specific and challenging to project (Bryan et al., 2016). Future adaptive capacity may be limited by declining institutional and community capacity resulting from high debt, unavailability of insurance, increasing regulatory requirements and funding mechanisms that lock in ongoing exposure to climate risk, creating mental health impacts (Rickards et al., 2014; Wiseman and Bardsley, 2016; McNamara and Buggy, 2017; McNamara et al., 2017; Moyle et al., 2017; Robinson et al., 2018; Ma et al., 2020; Yazd et al., 2020).
11.3.4.1 Field Crops and Horticulture
11.3.4.1.1 Observed impacts
Drought, heat and frost in recent decades have shown the vulnerability of Australian field crops and horticulture to climate change (Cai et al., 2014; Howden et al., 2014; CSIRO and BOM, 2015; Lobell et al., 2015; Hughes and Lawson, 2017; King et al., 2017; Webb et al., 2017; Harris et al., 2020) as recognised by policymakers (CoA, 2019a) (high confidence). Northern Australia’s agricultural output losses are on average 19% each year due to drought (Thi Tran et al., 2016). In southern Australia, the frequency of frost has been relatively unchanged since the 1980s (Dittus et al., 2014; Pepler et al., 2018; BoM and CSIRO, 2020 ). Drier winters have increased the irrigation requirement for wine grapes (Bonada et al., 2020), while smoke from the 2019/20 fires, which occurred early in the season, caused significant taint damage (Jiang et al., 2021). In New Zealand, reduced winter chill has a compounded impact on the kiwifruit industry, resulting in early harvest and increased energy demand for refrigeration and port access problems (Cradock-Henry et al., 2019) (11.5).
Across all types of agriculture, drought and its physical flow-on effects have caused financial and emotional disruption and stress in farm households and communities (Austin et al., 2018; Bryant and Garnham, 2018; Yazd et al., 2019) (11.3.6). Severe and uncertain climate conditions are statistically associated with increases in farmer suicide (Crnek-Georgeson et al., 2017; Perceval et al., 2019). Rural women often carry extra stress and responsibilities, including increased unpaid and paid work and emotional load (Whittenbury, 2013; Hanigan et al., 2018; Rich et al., 2018).
11.3.4.1.2 Projected impacts
Australian crop yields are projected to decline due to hotter and drier conditions, including intense heat spikes (high confidence) (Anwar et al., 2015; Lobell et al., 2015; Prokopy et al., 2015; Dreccer et al., 2018; Nuttall et al., 2018; Wang et al., 2018a). Interactions of heat and drought could lead to even greater losses than heat alone (Sadras and Dreccer, 2015; Hunt et al., 2018). Australian wheat yields are projected to decline by 2050, with a median yield decline of up to 30% in southwest Australia and up to 15% in southern Australia, with possible increases and decreases in the east (Taylor et al., 2018; Wang et al., 2018a). In temperate fruit, accumulated winter chill for horticulture is projected to further decline (Darbyshire et al., 2016). Winegrape maturity is projected to occur earlier due to warmer temperatures (high confidence) (Webb et al., 2014; van Leeuwen and Darriet, 2016; Jarvis et al., 2018; Ausseil et al., 2019b), leading to potential changes in wine style (Bonada et al., 2015). Rice is susceptible to heat stress, and average grain yield losses across rice varieties range from 83% to 53% in experimental trials when heat stress is applied during plant emergence and grain fill stages (Ali et al., 2019). In Tasmania, wheat yields are projected to increase, particularly at sites presently temperature-limited (Phelan et al., 2014).
New Zealand evidence on impacts across crops is very limited. Precipitation and temperature changes alone show minor effects on crop yield, and winter yields of some crops may increase (e.g., wheat, maize) (Ausseil et al., 2019b). For temperate fruit, loss of winter chill may reduce yields in some regions and trigger impacts across supply chains (Cradock-Henry et al., 2019) (11.5.1). Increased pathogens could damage the cut flower, guava and feijoa fruit growing and the honey and related industries (Lawrence et al., 2016). The combined effects of changes in seasonality, temperature, precipitation, water availability and extremes, such as drought, have the potential to escalate impacts, but understanding of these effects is limited.
Other climate-change-related factors complicate crop climate responses. When CO2 was elevated from present-day levels of 400 to 550 ppm in trials, yields of rainfed wheat, field pea and lentil increased approximately 25% (0–70%). However, there was a 6% reduction in wheat protein that could not be offset by additional nitrogen fertilizer (O’Leary et al., 2015; Fitzgerald et al., 2016; Tausz et al., 2017). Elevated CO2 will worsen some pest and disease pressures, for example, barley yellow dwarf virus impacts on wheat (Trębicki et al., 2015). Warmer temperatures are also expanding the potential range of the Queensland fruit fly, including into New Zealand (Aguilar et al., 2015a), threatening the horticulture industry (Sultana et al., 2017; Sultana et al., 2020). Some crop pests (e.g., the oat aphid) are projected to be negatively affected by climate change (Macfadyen et al., 2018), but so too are beneficial insects. There is large uncertainty in rainfall and crop projections for northern Australia (Table 11.3). For sugarcane, an impact assessment for CO2 at 734 ppm using the A2 emission scenario at Ayr in Queensland projected modest yield increases (Singels et al., 2014). Climate change is projected to adversely impact tropical fruit crops such as mangoes through higher minimum and maximum temperatures, reducing the number of inductive days for flowering (Clonan et al., 2020).
Climate change is projected to shift agro-ecological zones (high confidence) (Lenoir and Svenning, 2015; Scheffers et al., 2016). This includes the climatically determined cropping strip bounded by the inner arid rangelands and the wetter coast or mountain ranges in mainland Australia (Nidumolu et al., 2012; Eagles et al., 2014; Tozer et al., 2014). A narrowing of grain-growing regions is projected with a shift of the inner margin towards the coast under drier and warmer conditions (Nidumolu et al., 2012; Fletcher et al., 2020). The economic impact of the shift depends on adaptation (Sanderson et al., 2015; Hunt et al., 2019) and how resources, support industries, infrastructure and settlements adapt. Shifts in agro-ecological zones present some opportunities, for example warming is projected to be beneficial for wine production in Tasmania (Harris et al., 2020).
11.3.4.1.3 Adaptation
Some farmers are adapting to drier and warmer conditions through more effective capture of non-growing-season rainfall (e.g., stubble retention to store soil water), improved water use efficiency and matching sowing times and cultivars to the environment (high confidence) (Kirkegaard and Hunt, 2011; Fitzer et al., 2019; Haensch et al., 2021). Observed adaptations include new technologies that improve resource efficiencies, professional knowledge and skills development, new farmer and community networks and diversification of business and household income (Ghahramani et al., 2015; De et al., 2016). For Australian wheat, earlier sowing and longer-season cultivars may increase yield by 2–4% by 2050, with a range of −7 to +2% by 2090 (Wang et al., 2018a). In the wheat industry, breeding for improved reproductive frost tolerance remains a priority (Lobell et al., 2015). Modelling suggests that, since 1990, farm management has held Australian wheat yields constant, but declining rainfall and increasing temperature may have contributed to a 27% decline in simulated potential Australian wheat yield (Hochman et al., 2017).
Other observed incremental adaptations include later pruning in the grape industry to spread harvest period and partially restore wine balance, with neutral effects on yield and cost (Moran et al., 2019; Ausseil et al., 2021). The cotton sector increasingly requires shifts in sowing dates to avoid financial impacts (Luo et al., 2017). During years of low water availability, rice growers have been trading water and/or shifting to dry land farming (Mushtaq, 2016).
Growers in New Zealand are changing the timing of their operations, growing crops within covered enclosures and purchasing insurance (Cradock-Henry and McKusker, 2015) Teixeira et al. 2018). Investment of capital in irrigation infrastructure has increased (Cradock-Henry et al., 2018a), although its effectiveness as an adaptation depends on water availability (Box 11.5). In industries based on long-lived plants, such as the kiwifruit and grape industries, many of the adaptations (e.g., breeding and growing heat-adapted and disease-resistant varieties) have long lead times and require greater investment than in the cropping sector (Cradock-Henry et al., 2020a). While breeding programmes for traits with enhanced resilience to future climates are beginning, there is little evidence of strategic industry planning (Cradock-Henry et al., 2018a).
For drought management, balancing near-term needs with long-term adaptation to increasing aridity is essential (Downing et al., 2016). Insufficient and maladaptive decisions can have far-reaching effects, including changes to resources, infrastructure, services and supply chains to which others must adapt (Fleming et al., 2015; Graham et al., 2018). While there is potential for a greater proportion of agriculture to be located to northern Australia, there are significant and complex agronomic, environmental, institutional, financial and social challenges for successful transformation, including the risk of disruption (medium confidence) (Jakku et al., 2016).
11.3.4.2 Livestock
11.3.4.2.1 Observed impacts
Both the seasonality and annual production of pasture is changing (high confidence). In many regions, warming is increasing winter pasture growth (Lieffering, 2016); the effects on spring growth are more mixed, with some regions experiencing increased growth (Newton et al., 2014) and others experiencing reduced spring growth (Perera et al., 2020). Droughts are causing economic damage to livestock enterprises, with drought and market prices significantly affecting profit (Hughes et al., 2019a), in addition to the impacts on animal health and the livelihoods of pastoralists, periods of drought contribute to land degradation, particularly in the cattle regions of northern Australia (Marshall, 2015). Heat load in cattle leads to reduced growth rates and reproduction, and extreme heat waves can lead to death (Lees et al., 2019; Harrington, 2020). Temperatures over 32°C reduce ewe and ram fertility along with the birth weight of lambs (van Wettere et al., 2021).
11.3.4.2.2 Projected impacts
Some areas may experience increased pasture growth, but others may experience a decrease that cannot be fully offset by adaptation (high confidence) (Moore and Ghahramani, 2013; Lieffering, 2016; Kalaugher et al., 2017). Climate change may modify the seasonality of pasture growth rates more than annual yields in New Zealand (Lieffering, 2016). In eastern parts of Queensland, climate change impacts on pasture growth are equivocal, with simple empirical models suggesting a decrease in net primary productivity (Liu et al., 2017), while mechanistic models that include increases in length of the growing season and the beneficial effects of CO2 fertilisation indicate increases in pasture growth (Cobon et al., 2020). In Tasmania, annual pasture production is projected to increase by 13–16%, even with summer growth projected to decline with increased interannual variability, resulting in a projected increase in milk yields by 3–16% per annum (Phelan et al., 2015).
Extreme climatic events (droughts, floods and heatwaves) are projected to adversely impact productivity for livestock systems (medium confidence). This includes reduced pasture growth rates between 3–23% by 2070 from late spring to autumn and elevated growth in winter and early spring (Cullen et al., 2009; Hennessy et al., 2016; Chang-Fung-Martel et al., 2017). Heavy rainfall and storms are projected to lead to increased erosion, particularly in extensively grazed systems on steeper land, reducing productivity for decades, reducing soil carbon (Orwin et al., 2015) and increasing sedimentation. Increased heat stress in livestock is projected to decrease milk production and livestock reproduction rates (high confidence) (Nidumolu et al., 2014; Ausseil et al., 2019b; Lees et al., 2019). In Australia, the average number of moderate to severe heat stress days for livestock is projected to increase 12–15 d by 2025 and 31–42 d by 2050 compared to 1970–2000 (Nidumolu et al., 2014). In New Zealand, an extra 5 (RCP2.6) to 7 (RCP8.5) moderate heat stress days per year are projected for 2046–2060 (high confidence) (Ausseil et al., 2019b), which would especially affect animals transported long distances (Zhang and Phillips, 2019) and strain the cold chains needed to deliver meat and dairy products safely. The distribution of existing and new pests and diseases are projected to increase, for example, new tick- and mosquito-borne diseases such as bovine ephemeral fever (Kean et al., 2015).
11.3.4.2.3 Adaptation
Adaptations in both grazing and confined beef cattle systems require enhanced decision-making skills capable of integrating biophysical, social and economic considerations (high confidence). Social learning networks that support integration of lessons learned from early adopters and involvement with science-based organisations can help enhance decision-making and climate adaptation planning (Derner et al., 2018). Pasture management adaptations for livestock production include deeper rooted pasture species in higher rainfall regions (Cullen et al., 2014) and drought-tolerant species (Mathew et al., 2018). Soil and land management practices are important in ensuring soils maintain their supporting and regulating services (Orwin et al., 2015). Adaptations in the primary sector in New Zealand are now positioned within the requirements of the National Policy Statement on Freshwater (MfE, 2020b). Adaptations to manage heat stress in livestock include altering the breeding calendar, providing shade and sprinklers, altering nutrition and feeding times and more heat-tolerant animal breeds (Chang-Fung-Martel et al., 2017; Lees et al., 2019; van Wettere et al., 2021).
Beef rangeland systems in Queensland are projected to have benefits in the southeast through higher CO2 and temperatures extending the growing season and reducing frost, but a warmer and drier climate in the southwest may reduce pasture and livestock production (Cobon et al., 2020). Northern Queensland is most resilient to temperature and rainfall changes (production limited by soil fertility) while western/central west Queensland is most sensitive to rainfall changes, that is, low rainfall is associated with lower productivity (Cobon et al., 2020). The social context of climate change impacts and the processes shaping vulnerability and adaptation, especially at the scale of the individual, are critical to successful adaptation efforts (Marshall and Stokes, 2014).
11.3.4.3 Forestry
11.3.4.3.1 Observed impacts
Climate change may have increased tree mortality in Australia’s commercial Eucalyptus globulus and Pinus radiata plantation forests (Crous et al., 2013; Pinkard et al., 2014). Climate warming enhanced tree water use and vulnerability to heat (Crous et al., 2013). Increases in fire frequency and intensity in forests of southern Australia are leading to diminishing resources available for timber production (Pinkard et al., 2014) (Box 11.1).
11.3.4.3.2 Projected impacts
The projected declines in rainfall in far southwest and far southeast mainland Australia are projected to reduce plantation forest yields (high confidence). Warmer temperatures are projected to reduce forest growth in hotter regions (between 7 and 25%), especially where species are grown at the upper range of their temperature tolerances, and increase plantation forest growth (>15%) in cooler margins like Tasmania and the Victorian highlands (2030, A2); emission scenario A2 creates a warming trajectory slightly higher than the RCP6.0 warming scenario, but less than RCP8.5 (Rogelj et al., 2012; Battaglia and Bruce, 2017). Elevated CO2 is projected to increase forest growth if other biophysical factors are not limiting (medium confidence) (Quentin et al., 2015; Duan et al., 2018).
Forestry plantations are projected to be negatively impacted from increases in fire weather (Box 11.1), particularly in southern Australia (high confidence) (Pinkard et al., 2014). Increased pest damage due to temperature increases may reduce eucalyptus and pine plantation growth by as much as 40% in some Australian environments by 2050 (Pinkard et al., 2014). Increased heat and water stress may enhance insect pest defoliation for P. radiata in Australia (e.g., Sirex noctilio, Ips grandicollis and Essigella californica) (Mead, 2013; Pinkard et al., 2014).
Combined impacts from heavy rainfall, soil erosion, drought, fire and pest incursions are projected to increase risks to the permanence of carbon offset and removal strategies in New Zealand for meeting its climate change targets (PCE, 2019; Watt et al., 2019; Anderegg et al., 2020; Schenuit et al., 2021). Effective management of the interactions between mitigation and adaptation policies can be achieved through governance and institutions, including Māori tribal organisations and sectoral adaptation, to ensure effective and continued carbon sequestration and storage as the climate changes (medium confidence) (Lawrence et al., 2020b) (11.4.2) (Box 11.5). The productivity of radiata pine (P. radiata D. Don) in New Zealand due to higher CO2 is projected to increase by 19% by 2040 and 37% by 2090, but greater wind damage to trees is expected (Watt et al., 2019). Changes in the distribution of existing weeds, pests and diseases with potential establishment of new sub-tropical pests and seasonal invasions are projected (Kean et al., 2015; Watt et al., 2019; MfE, 2020a). Increased pathogens such as pitch canker, red needle cast and North American bark beetles could damage plantations (Hauraki Gulf Forum, 2017; Lantschner, 2017; Watt et al., 2019).
11.3.4.3.3 Adaptation
Adaptation options include increased investment in monitoring forest condition and functioning; early detection and management of insect pests, diseases and invasive species; improved selection of land with appropriate growing conditions for plantation timber production under current and future conditions; trialling new species and genetic varieties; changing the timing and frequency of planned fuel reduction fires; introducing more fire-tolerant tree species where appropriate; reducing ignition sources; and maintaining access and emergency response capacity (Boulter, 2012; Pinkard et al., 2014; Keenan, 2017).
11.3.4.4 Marine Food
11.3.4.4.1 Observed impacts
The ecological impacts of climate change on fisheries species have already emerged (high confidence) (Morrongiello and Thresher, 2015; Gervais et al., 2021). This includes loss of habitats for fisheries species (Vergés et al., 2016; Babcock et al., 2019) and poleward shifts in the distribution of barrens-forming urchins (Ling and Keane, 2018) impacting abalone and rock lobster fisheries. The percentage of reef as barrens across eastern Tasmania grew from 3.4% to 15.2% from 2001/2002 to 2016/2017, an approx. 10.5% increase per annum over the 15-year period (Ling and Keane, 2018). Oysters farmed from wild spat (Sydney rock oysters Saccostrea glomerata) are most at risk from climate change, primarily due to observed increases in summer temperatures and heatwave-related mortalities (Doubleday et al., 2013). The exceptional 2017/2018 summer heatwave caused significant losses of farmed salmon in New Zealand, with farm owners seeking consent to move operations to cooler water (Salinger et al., 2019b).
11.3.4.4.2 Projected impacts
Aquaculture is projected to be more easily adapted than wild fisheries to avoid excessive exposure to the physio-chemical stresses from acidification, warming and extreme events (Richards et al., 2015). In New Zealand, wild and cultured shellfish are identified as being most at risk from climate change (Capson and Guinotte, 2014). Changes in ocean temperature and acidification and the downstream impacts on species distribution, productivity and catch are projected concerns (medium confidence) (Law et al., 2016) that impact Māori harvesting of traditional seafood and the social, cultural and educational elements of food gathering (mahinga kai) (MfE, 2016). Warm temperate hatchery-based finfish species (yellowtail kingfish Seriola lalandi) are projected to be the least at risk, because of well-controlled environmental conditions in hatcheries and temperature increases, which are expected to increase growth rates and productivity during the grow-out stage (Doubleday et al., 2013). For wild fisheries, multi-model projections suggest temperate and demersal systems, especially invertebrate shallow-water species, would be more strongly affected by climate change than tropical and pelagic systems (medium confidence) (Pecl et al., 2014; Fulton et al., 2018; Pethybridge et al., 2020). In New Zealand waters, available habitat for both albacore tuna and oceanic tuna (Cummings et al., 2021) is expected to widen and shift.
11.3.4.4.3 Adaptation
Selective breeding in oysters is projected to be an important global adaptation strategy for sustainable shellfish aquaculture that can withstand future climate-driven change to habitat acidification (Fitzer et al., 2019). Less than a quarter of fisheries management plans for 99 of Australia’s most important fisheries considered climate change, and only to a limited degree (Fogarty et al., 2019; Fogarty et al., 2021). Implementation of management and policy responses to climate change have lagged in part because climate change has not been considered as the most pressing issue (Hobday and Cvitanovic, 2017; Fogarty et al., 2019; Fogarty et al., 2021) (Cross-Chapter Box MOVING SPECIES in Chapter 5).
11.3.5 Cities, Settlements and Infrastructure
Almost 90% of the population of Australia and New Zealand is urban (World Bank, 2019). Each country has vibrant and diverse urban, rural and remote settlements, with some highly disadvantaged areas isolated by distance and limited infrastructure and services (Argent et al., 2014; Charles-Edwards et al., 2018; Spector et al., 2019). Some areas in northern Australia and New Zealand, especially those with higher proportions of Indigenous inhabitants, face severe housing, health, education, employment and services issues (Kotey, 2015), which increases their vulnerability to climate change.
Infrastructure within and between cities and settlements is critical for activity across all sectors, with interdependencies increasing exposure to climate hazards (11.5.1). Previous planning horizons for existing infrastructure are compromised by now having to accommodate ongoing sea level rise (SLR), warming and increasing frequency of extreme rainfall and storm events (Climate Institute, 2012; MfE, 2017a). There is almost no information on the costs and benefits of adapting vulnerable and exposed infrastructure in Australia or New Zealand. Given the value of that infrastructure and the rising damage costs, this represents a large knowledge gap that has led to an adaptation investment deficit.
11.3.5.1 Observed Impacts
Critical infrastructure, cities and settlements are being increasingly affected by chronic and acute climate hazards, including heat, drought, fire, pluvial and fluvial flooding and sea level rise (SLR), with consequent effects on many sectors (high confidence) (Instone et al., 2014; Loughnan et al., 2015; Zografos et al., 2016; Hughes et al., 2021). Risks and impacts vary with physical characteristics, location, connectivity and socioeconomic status of settlements because of the ways these influence exposure and vulnerability (high confidence) (Loughnan et al., 2013; MfE, 2020a).
Weather-related disasters are causing significant disruption and damage (Paulik et al., 2019a; CSIRO, 2020; Paulik et al., 2020). In Australia, during 1987–2016, natural disasters caused an estimated 971 deaths and 4370 injuries, 24,120 people were made homeless and about 9 million people were affected (Deloitte, 2017a). More than 50% of these deaths and injuries came from heatwaves in cities and 22% from fires. During the 2007–2016 period, Australia natural disaster costs averaged AUD$18.2 billion yr −1, with the largest contributions from floods (AUD$8.8 billion), followed by cyclones (AUD$3.1 billion), hail (AUD$2.9 billion), storms (AUD$2.3 billion) and fires (AUD$1.1 billion) (Deloitte, 2017a). The Australian fires in 2019–2020 cost over AUD$8 billion, with devastating impacts on settlements and infrastructure (Box 11.1)
Sea level rise affects many interdependent systems in cities and settlements, which increases the potential for compounding and cascading impacts (11.5.1). Seaports, airports, water treatment plants, desalination plants, roads and railways are increasingly exposed to sea level rise (SLR) (very high confidence), impacting their longevity and levels of service and maintenance (high confidence) (McEvoy and Mullett, 2014; Woodroffe et al., 2014; PCE, 2015; Ranasinghe, 2016; Newton et al., 2018; Paulik et al., 2020) (Box 11.6). Compounding coastal hazards in New Zealand, such as elevated water tables associated with rising sea level and intense rainfall (Morgan and Werner, 2015; McBride et al., 2016; White et al., 2017; Hughes et al., 2021), are exerting pressure on stormwater and wastewater infrastructure and drinking water supply and quality (MfE, 2020a).
Extreme heat events exacerbate problems for vulnerable people and infrastructure in urban Australia, where urban heat is superimposed upon regional warming, and there are adverse impacts for population and vegetation health, particularly for socioeconomically disadvantaged groups (Tapper et al., 2014; Heaviside et al., 2017; Filho et al., 2018; Gebert et al., 2018; Rogers et al., 2018; Longden, 2019; Marchionni et al., 2019; Tapper, 2021) (11.3.6), energy demand, energy supply and infrastructure (very high confidence) (Newton et al., 2018) (11.3.10). Extreme heat is increasingly threatening liveability in some rural areas in Australia (Turton, 2017), particularly given their reliance on outside physical work and older populations. Settlement design and the level of greening interact with climate change to influence local heating levels (Tapper et al., 2014; Wong et al., 2020; Tapper, 2021).
Floods cause major damage. The floods of early 2019 in North Queensland cost AUD$5.68 billion (Deloitte, 2019), while Cyclone Yasi and the Queensland floods of 2011 cost A$6.9 billion (Deloitte, 2016). Floodplains in New Zealand have considerably higher overall national exposure of buildings and population than coasts (Paulik et al., 2019a) (Box 11.4). The insured losses from the 12 costliest floods in New Zealand from 2007 to 2017 totalled NZD$471.56 million, of which NZD$140.48 million could be attributed to climate change (Frame et al., 2020).
Climatic extremes are exacerbating existing vulnerabilities (high confidence). Long supply chains, poorly maintained infrastructure, social disadvantage and poor health and lack of skilled workers (Eldridge and Beecham, 2018; Mathew et al., 2018; Rolfe et al., 2020) are contributing to serious stress and disruption (Smith and Lawrence, 2014; Kiem et al., 2016). In many rural settlements, population ageing and reliance on an overstretched volunteer base for recovery from extreme events are increasing vulnerability to climate change (Astill and Miller, 2018; Davies et al., 2018). Recovery from long, intense, more frequent and compounding climatic events in rural areas has been disrupted by the erosion of natural, financial, built, human and social capital (De et al., 2016; Sheng and Xu, 2019). Delayed recovery from extreme climatic events has been compounded by long-term displacement, which in turn prolongs the impacts (Matthews et al., 2019). Severe droughts have contributed to poor health outcomes for rural communities, including extreme stress and suicide (Beautrais, 2018; Perceval et al., 2019). In Australia, competition among water users has left some rural communities experiencing extreme water shortage and insecurity with associated health impacts (Wheeler et al., 2018; Judd, 2019) (Box 11.3).
11.3.5.2 Projected Impacts
Changes in heat waves, droughts, fire weather, heavy rainfall, storms and sea level rise (SLR) are projected to increase negative impacts for cities, settlements and infrastructure (high confidence) (Table 11.3a, Table 11.3b; Box 11.1, Box 11.3, Box 11.4).
Increased floods, coastal inundation (assuming a sea level rise (SLR) of 1.6 m by 2100), wildfires, windstorms and heatwaves may cause property damage in Australia estimated at AUD$91 billion per year by 2050 and AUD$117 billion per year by 2100 for RCP8.5, while damage-related loss of property value is estimated at AUD$611 billion by 2050 and AUD$770 billion by 2100 for RCP8.5 (Steffen et al., 2019). For a 1.0-m sea level rise (SLR), the value of exposed assets in New Zealand would be NZD$25.5 billion (Box 11.6). For a 1.1-m sea level rise (SLR), the value of exposed assets in Australia would be AUD$164–226 billion (Box 11.6). These exposure estimates exclude impacts on personal livelihood, well-being and lifestyle.
Extreme heat risks are projected to exacerbate existing heat-related impacts on human health, vegetation and infrastructure (Tapper et al., 2014; Tapper, 2021) (11.3.6). In Australia, the annual frequency of days over 35°C is projected to increase 20–70% by 2030 (RCP4.5), and 25–85% (RCP2.6) to 80–350% (RCP8.5) by 2090 (Table 11.3a). For example, Perth may average 36 d over 35°C by 2030 (RCP4.5). In New Zealand, the annual frequency of days over 25°C may increase 20–60% (RCP2.6) to 50–100% (RCP8.5) by 2040 and 20–60% (RCP2.6) to 130–350% (RCP8.5) by 2090 (Table 11.3b). For example, Auckland may average 39 d over 25°C by 2040 (RCP8.5). Unprecedented extreme temperatures, as high as 50°C in Sydney or Melbourne, could occur with global warming of 2.0°C (Lewis et al., 2017). Heat-related costs for Melbourne during 2012–2051 are estimated at AUD$1.9 billion, of which AUD$1.6 billion is human health/mortality costs (AECOM, 2012). Extreme heat is threatening liveability in some rural areas in Australia (Turton, 2017), particularly given their reliance on outside physical work and older populations.
Key infrastructure and services face major challenges. Structural metal corrosion rates are projected to increase significantly at coastal locations but decrease inland (Trivedi et al., 2014). A drier climate may decrease the rate of deterioration of road pavements, but extreme rainfall events and heat pose a significant risk (Taylor and Philp, 2015), especially to unsealed roads in northern Australia (CoA, 2015). Critical infrastructure on coasts is at risk from sea level rise (SLR) and storm surges (Box 11.6). Facilities such as hospitals face weather-related hazards exacerbated by climate change and not originally anticipated in building and infrastructure design (Loosemore et al., 2011; Loosemore et al., 2014). By 2050, increased risks are projected for the availability and quality of potable water supplies, delivery of wastewater and stormwater services to communities, transport systems, electricity infrastructure, operating municipal landfills and contaminated sites located near rivers and the coast (Gilpin et al., 2020; MfE, 2020a; Hughes et al., 2021). These then create risks to social cohesion and community well-being from displacement of individuals, families and communities, with inequitable outcomes for vulnerable groups (Boston and Lawrence, 2018).
11.3.5.3 Adaptation
In cities and settlements, climate adaptation is under way and is being led and facilitated by state and local government leadership and facilitation, particularly in Australia (high confidence) (Hintz et al., 2018; Newton et al., 2018) (Table 11.7, Supplementary Material Table SM11.1a).
Effective adaptations to urban heat include spatial planning, expanding tree canopy and greenery, shading, sprays and heat-resistant and energy-efficient building design, including cool materials and reflective or green roofs (very high confidence) (Broadbent et al., 2018; Jacobs et al., 2018b; Haddad et al., 2019; Haddad et al., 2020a; Yenneti et al., 2020; Bartesaghi-Koc et al., 2021; Tapper, 2021). Reducing urban heat not only benefits human health but reduces the demand for, and cost of, air conditioning (Haddad et al., 2020b) and the risk of electricity blackouts (11.3.10).
Adaptation progress is being hampered by current urban redevelopment practice and statutory planning guidelines that are leading to the removal of critical urban green space (Newton and Rogers, 2020). Reform of approaches to urban redevelopment would facilitate adaptation (Newton and Rogers, 2020). Several cities in Australia and New Zealand are part of the 100 Resilient Cities global network, which helped facilitate the metropolitan Melbourne Urban Forest Strategy across councils (Fastenrath et al., 2019; Coenen et al., 2020), and in New Zealand, restoration of the urban forest in Hamilton is reducing heat stressors (Wallace and Clarkson, 2019). In peri-urban zones, adapting to fire risk is a contested issue, raising difficult trade-offs between heat management, ecological values and fuel reduction in treed landscapes (Robinson et al., 2018).
The resilience of Australia’s major cities to flooding and drought has been advanced through a range of economic and physical interventions. Water-sensitive urban design irrigates vegetation with harvested storm water that improves water security, flood risk, carbon sequestration, biodiversity and air and water quality and delivers cooling that can save human lives in heatwaves (Wong et al., 2020). Stormwater harvesting is supported by some councils in New Zealand and can deliver recycled water for households (Attwater and Derry, 2017), improving climate resilience and reducing water demand (White et al., 2017). Addressing infrastructure vulnerability is essential given the long lifetime of assets, criticality of services and high costs of maintenance (Chester et al., 2020; Hughes et al., 2021).
Climate risk management is evolving, but adaptive capacity, implementation, monitoring and evaluation are uneven across all scales of cities, settlements and infrastructure (very high confidence) (Table 11.15a and Table 11.15b; Supplementary Material Tables SM11.1a and SM11.1b) . There is increasing awareness of the need to move from incremental coping and defensive coastal strategies (Jongejan et al., 2016) to transformational adaptation, for example managed retreat (Torabi et al., 2018; Hanna, 2019), and to consider the flow-on effects (e.g., for housing and employment) (Fatorić et al., 2017; Torabi et al., 2018). Strategies limited to building household and community self-reliance (Astill and Miller, 2018) are increasingly inadequate given systemic and interconnected stressors and cascading impacts across interdependent systems (Lawrence et al., 2020b). Integrated approaches to climate change adaptation and emissions reduction have potential for addressing interdependent systems (e.g., nature-based approaches, climate-sensitive urban design, energy and transport systems) (Norman et al., 2021). Climate risk assessment and adaptation guidelines have been prepared for transport infrastructure authorities and organisations (Finlayson et al., 2017; Byett et al., 2019; Yenneti et al., 2020).
Infrastructure service vulnerability in New Zealand is supported by new institutional adaptations including the Infrastructure Commission to develop a 30-year national infrastructure strategy. The Climate Change Commission (Climate Change Commission, 2020) has issued six principles for climate-relevant infrastructure investments and is mandated to monitor the National Climate Change Adaptation Plan based on the first National Climate Change Risk Assessment (MfE, 2020a). A National Disaster Resilience Strategy addresses integrated planning for risk reduction and awareness-raising in New Zealand (Department of the Prime Minister and Cabinet, 2019).
Successive inquiries and reviews highlight potential synergies between disaster risk management and climate resilience (11.5.1) (Smith and Lawrence, 2018; Ruane, 2020). In Australia, there is a National Disaster Risk Reduction Framework (CoA, 2018b) and a National Recovery and Resilience Agency (CoA, 2021) that help underpin the development of national support systems for rural and regional emergency management and associated volunteer sectors (McLennan et al., 2016) and wildfire smoke impacts (CoA, 2020e). The National Heatwave Framework Working Group uses a Heatwave Forecast Service, and heatwave early-warning and adaptation systems that operate in Adelaide, Melbourne, Sydney and Brisbane have reduced potential death rates (Nitschke et al., 2016).
Infrastructure planning is lagging behind international standards for climate resilience evaluation and guidance for adaptation to climate risk (high confidence) (CSIRO, 2020; Kool et al., 2020; Hughes et al., 2021). Some companies have examined their exposure to climate risk and developed strategies to minimise their vulnerability (Climate Institute, 2012) (11.3.8). Climate risk assessments have been conducted for the electricity sector in both Australia and New Zealand (11.3.10). Climate change is considered in Australian infrastructure plans for national and regional water supply security, water for irrigated agriculture, a coastal hazards adaptation strategy and the Tanami Road upgrade (Infrastructure Australia, 2016; Infrastructure Australia, 2019; Infrastructure Australia, 2021)
Industry associations are beginning to facilitate climate adaptation for infrastructure, including the Australian Green Infrastructure Council (CoA, 2015), the Green Building Council of Australia Green Star Programme (GBCA, 2020), the Water Services Association of Australia, Climate Change Adaptation Guidelines (WSAA, 2016) and the Australian Sustainable Built Environment Council Built Environment Adaptation Framework (ASBEC, 2012). The Infrastructure Sustainability Rating Scheme measures the social, environmental, governance and cultural outcomes delivered by more than AUD$160 billion worth of infrastructure, and it is projected to deliver a cost-benefit ratio of 1:1.6 to 1:2.4 during the period 2020–2040 (RPS, 2020). There is scope for engagement of industry in transitioning to a low-carbon green economy that is adapted to climate change, but less certainty on how to develop appropriate business cases (Newton and Newman, 2015).
There are tensions between settlement-scale adaptation options, such as managed retreat, that focus on the long term and people’s values, place attachments, needs and capacities (Gorddard et al., 2016; Fatorić et al., 2017; Graham et al., 2018; O’Donnell, 2019; Norman et al., 2021). Tensions also exist between climate change adaptation and mitigation goals (e.g., current energy efficiency standards in Australian buildings can worsen their heat resistance and increase dependence on air-conditioning) (Hatvani-Kovacs et al., 2018). Where there is a lack of coordination between jurisdictions, there can be flow-on effects from failure to adapt, for example in coastal local government areas (Dedekorkut-Howes et al., 2020) (Box 11.6). There is limited information across the region on climate change impacts and adaptation options for telecommunications (NCCARF, 2013) (Table 11.7). There is an emerging recognition that implementing and evaluating the adaptation process (vulnerability and risk assessments, identification of options, planning, implementation, monitoring, evaluation and review) in local contexts can advance more effective adaptation (Moloney and McClaren, 2018). For example, the Victorian state government has built monitoring, evaluation and adaptation components into its adaptation plan (Table 11.15a).
Box 11.5 | New Zealand’s Land, Water and People Nexus under a changing climate
New Zealand’s economy, dominated by the primary sector and the tourist industry (pre-COVID), relies upon a ‘clean green’ image of water, natural ecosystems and pristine landscapes (Foote et al., 2015; Roche and Argent, 2015; Hayes and Lovelock, 2017). Water is highly valued by Māori for its mauri or life force and for its intrinsic values and multiple uses (Harmsworth et al., 2016). Increasingly, these diverse values are coming into conflict (Hopkins et al., 2015) due to increasing pressures from how land is used and managed and the effects on water availability and quality. Such tensions will be further challenged as temperatures rise and extreme events intensify beyond what has been experienced, thus stressing current adaptive capacities (high confidence) (Hughey and Becken, 2014; Cradock-Henry and McKusker, 2015; Hopkins et al., 2015; MfE and Stats NZ, 2021 ) (11.2.2; 11.3.4).
Irrigation has increasingly been used to enhance primary sector productivity and regional economic development (Srinivasan et al., 2017; Fielke and Srinivasan, 2018; MfE and Stats NZ, 2021 ) (Srinivasan et al., 2017; Fielke and Srinivasan, 2018; MfE and Stats NZ, 2021 ). Pressure for long-term access to groundwater or large-scale water storage is increasing to ensure the ongoing viability of the primary sector as the climate changes. While investment in irrigation infrastructure may reduce climate change impacts in the short term, maladaptive outcomes cannot be ruled out longer term, which means that focusing attention now on adaptive and transformational measures can help increase climate resilience in areas exposed to increasing drought and climate extremes that disrupt production (medium confidence) (Abel et al., 2016; Cradock-Henry et al., 2019) (Yletyinen et al., 2019).
Furthermore, overallocation raises further tensions from competing uses of water such as for horticulture and urban water supplies, as well as for ecological requirements. The deterioration of water quality and loss of places of social, economic, cultural and spiritual significance creates increasing tension for Māori in particular (Harmsworth et al., 2016; Salmon, 2019; MfE and Stats NZ, 2021 ). Public concern has increased over the deterioration of New Zealand’s waterways and the profiting of some land uses at the expense of environmental quality and human health—tensions that make adaptation to climate change more challenging (Duncan, 2014; Foote et al., 2015; Scarsbrook and Melland, 2015; McDowell et al., 2016; McKergow et al., 2016; Greenhalgh and Samarasinghe, 2018). A lack of precautionary governance of water resources linked to unsustainable land use practices degrading water quality (Scarsbrook and Melland, 2015; Salmon, 2019) highlights the role that foresight could play in managing the nexus between land, water and people in a changing climate (11.3.3). Adaptive planning holds potential for navigating these multi-dimensional challenges (Sharma-Wallace et al., 2018; Cradock-Henry and Fountain, 2019; Hurlbert et al., 2019) (11.7).
Furthermore, land and, in particular, plantation and native forests play a critical role in meeting New Zealand’s emissions reduction goals. However, the persistence of land and forests as a carbon sink is uncertain, and the sequestered carbon is at risk from future loss resulting from climate change impacts, including from increased fire, drought and pest incursions, storms and wind (IPCC, 2019a; PCE, 2019; Watt et al., 2019; Anderegg et al., 2020) (11.3.4.3), underlining the importance of interactions between mitigation and adaptation policy and implementation. Integrated climate change policies across biodiversity, water quality, water availability, land use and forestry for mitigation can support the management of land use, water and people conflicts, but there is little evidence of such coordinated policies (Cradock-Henry et al., 2018b; Wreford et al., 2019). Implementation of the National Policy Statement for Freshwater Management 2020 (MfE, 2020b) and the National Adaptation Plan (due out in August 2022) present opportunities for such interconnections and diverse values to be addressed, as well as enabling sector and community benefits to be realised across New Zealand (Awatere et al., 2018; Lawrence et al., 2020b).
Box 11.6 | Rising to the Sea Level Challenge
Many of the region’s cities and settlements, cultural sites and place attachments are situated around harbours, estuaries and lowland rivers (Black, 2010; PCE, 2015; Australia SoE, 2016; Rouse et al., 2017; Hanslow et al., 2018; Birkett-Rees et al., 2020) exposed to ongoing relative sea level rise (RSLR). RSLR includes regional variability in oceanic conditions (Zhang et al., 2017) and vertical land movement along New Zealand’s tectonically dynamic coasts (Levy et al., 2020) and some Australian hotspots for subsidence (Denys et al., 2020; King et al., 2020; Watson, 2020).
Table Box 11.6.1 | Observed and projected impacts from higher mean sea level
Impacts from increase in mean sea level | References |
Nuisance and extreme coastal flooding have increased from higher mean sea level in New Zealand. Projected SLR will cause more frequent flooding in Australia and New Zealand before mid-century (very high confidence) | (Hunter, 2012; McInnes et al., 2016; Stephens et al., 2017; Stephens et al., 2020); (Steffen et al., 2014; PCE, 2015; MfE, 2017a; Hague et al., 2019; Paulik et al., 2020) |
Squeeze in intertidal habitats (high confidence) | (Steffen et al., 2014; Peirson et al., 2015; Mills et al., 2016a; Mills et al., 2016b; Pettit et al., 2016; Rouse et al., 2017; Rayner et al., 2021) |
Significant property and infrastructure exposure (high confidence) | (Steffen et al., 2014; PCE, 2015; Harvey, 2019; LGNZ, 2019; Paulik et al., 2020) (Table Box 11.5.2 and Table Box 11.6.2) |
Loss of significant cultural and archaeological sites and projected to compound with several hazards over this century (medium confidence) | (Bickler et al., 2013; Birkett-Rees et al., 2020; NZ Archaeological Association, 2020) |
Increasing flood risk and water insecurity with health and well-being impacts on Torres Strait Islanders (high confidence) | (Steffen et al., 2014; McInnes et al., 2016; McNamara et al., 2017) |
Degradation and loss of freshwater wetlands (high confidence) | (Pettit et al., 2016; Bayliss and Ligtermoet, 2018; Tait and Pearce, 2019; Grieger et al., 2020; Swales et al., 2020) |
Coastal shoreline position is driven by a complex combination of natural drivers, past and present human interventions, climate variability (Bryan et al., 2008; Helman and Tomlinson, 2018; Allis and Hicks, 2019) and variation in sediment flux (Blue and Kench, 2017; Ford and Dickson, 2018). RSLR, to date, is a secondary factor influencing shoreline stability (medium confidence), and in Australia no definitive SLR signature is yet observed in shoreline recession, nor is one documented in New Zealand, due to variability in shoreline position responding to storms and seasonal, annual and decadal climate drivers (Australian Government, 2009; McInnes et al., 2016; Sharples et al., 2020).
The primary impacts of rising mean sea level (Table Box 11.6.1) are being compounded by climate-related changes in waves, storm surge, rising water tables, river flows and alterations in sediment delivery to the coast (medium confidence). The net effect is projected to increase erosion on sedimentary coastlines and flooding in low-lying coastal areas (McInnes et al., 2016; MfE, 2017a; Hanslow et al., 2018; Wu et al., 2018). Waves are projected to be higher in southern Australasia and lower elsewhere (Morim et al., 2019) and storm surge slightly higher in the south, slightly lower further north in New Zealand (Cagigal et al., 2019) and small robust declines in southern Australia, with potentially larger changes in the Gulf of Carpentaria (Colberg et al., 2019).
The cumulative direct and residual risk from RSLR and associated impacts are projected to continue for centuries, necessitating ongoing adaptive decisions for exposed coastal communities and assets (high confidence) (MfE, 2017c; Oppenheimer et al., 2019; Tonmoy et al., 2019).
Prevailing decision-making assumes shorelines can continue to be maintained and protected from extreme storms, flooding and erosion, even with RSLR (Lawrence et al., 2019a). Rapid coastal development has increased exposure of coastal communities and infrastructure (high confidence) (Helman and Tomlinson, 2018; Paulik et al., 2020), reinforcing perceptions of safety (Gibbs, 2015; Lawrence et al., 2015) and creating barriers to retreat and nature-based adaptations (very high confidence) (Schumacher, 2020). The efficacy and increasing costs of protection and accommodation risk reduction approaches and rebuilding after extreme events have been questioned and have limits (PCE, 2015; MfE, 2017a; Harvey, 2019; LGNZ, 2019; Paulik et al., 2020; Haasnoot et al., 2021). Future shoreline erosion is often signalled using defined coastal setback lines(s) and using probabilistic approaches to signal uncertainty (Ramsay et al., 2012; Ranasinghe, 2016).
Table Box 11.6.2 | Observed relative SLR (variance-weighted average) with uncertainty range (standard deviation) and projected impacts on infrastructure and population of 1.1 m in Australia and 1 m in New Zealand. SLR projections for 2050 and 2090 are given in Table 11.3a and Table 11.3b.
Country | Observed relative sea level rise | Projected impacts of SLR (1.1 m Australia, 1.0 m New Zealand) | |||
Value of coastal urban infrastructure | Number of buildings exposed | Number of residents exposed | Public council assets exposed | ||
Australia | 2.2±1.8 mm/year to 2018 for four >75-year records (or an average of 0.17 m over 75 years), 3.4 mm/year from 1993–2019 (Watson, 2020) | AUD$164 to >226 billion (DCCEE, 2011; Steffen et al., 2019) 111% rise in inundation cost from 2020 to 2100 (Mallon et al., 2019) | 187,000 to 274,000 residential buildings, 5800 to 8600 commercial buildings, 3700 to 6200 light industrial buildings (DCCEE, 2011) | N/A | 27,000 to 35,000 km roads and 1200 to 1500 km rail lines and tramways (DCCEE, 2011) |
New Zealand | 1.8 mm/year from 1900–2018, 1.2 mm/year from 1900–1960 and 2.4 mm/year from 1961–2018 (Bell and Hannah, 2019) | NZD$25.5 billion (Paulik et al., 2020) | 75,890 (Paulik et al., 2020) | 105,580 (Paulik et al., 2020) | 4000 km pipelines, 1440 km roads, 101 km rail, 72 km electricity transmission lines (Paulik et al., 2020) NZD$5 billion (2018) (reserves, buildings, utility networks, roads) (LGNZ, 2019) |
Flooding from high spring (‘king’) tides or storm tides during extreme weather events are raising public awareness of SLR (Green Cross Australia, 2012), including through media coverage (Priestley et al., 2021). The use of adaptive decision tools (11.7.3.1; Table 11.17) is increasing the understanding of changing coastal risk (Bendall, 2018; Lawrence et al., 2019b; Palutikof et al., 2019b) and how dynamic adaptive pathways and monitoring of them can aid implementation (Stephens et al., 2018; Lawrence et al., 2020b). Collaborative governance between local governments and their communities, including with Māori tribal organisations, is emerging in New Zealand (OECD, 2019b) assisted by national direction (DoC NZ, 2010) and guidance on adaptive planning (Table 11.15b). This shift from reactive to pre-emptive planning is better suited to ongoing RSLR (Lawrence et al., 2020b).
In Australia, adaptation to SLR remains uneven across jurisdictions in the absence of clear federal or state guidance, rendering Australia unprepared for flooding from SLR (Dedekorkut-Howes et al., 2020). Risk-averse coastal governance at the local level has led to shifts in liabilities to other actors and to future generations (Jozaei et al., 2020). Managed retreat has emerged as an adaptation option in New Zealand (Rouse et al., 2017; Hanna, 2019; Kool et al., 2020; Lawrence et al., 2020c), where protective measures are transitional (DoC NZ, 2010) and where managed retreat has arisen from collaborative governance (Owen et al., 2018). Remaining adaptation barriers are social or cultural (the absence of licence and legitimacy) and institutional (the absence of regulations, policies and processes that support changes to existing property rights and the funding of retreat) (high confidence) (O’Donnell and Gates, 2013; Tombs et al., 2018; Grace et al., 2019; O’Donnell et al., 2019).
Legacy development, competing public and private interests, trade-offs among development and conservation objectives, policy inconsistencies, short- and long-term objectives and the timing and scale of impacts compound to create contestation over implementation of coastal adaptation (high confidence) (Mills et al., 2016b; McClure and Baker, 2018; Dedekorkut-Howes et al., 2020; McDonald, 2020; Schneider et al., 2020). Legal barriers to coastal adaptation remain (Schumacher, 2020) with a risk that the courts will become decision makers (Iorns Magallanes et al., 2018) due to legislative fragmentation, status quo leadership, lack of coordination between governance levels and agreement about who pays for what adaptation (very high confidence) (Waters et al., 2014; Boston and Lawrence, 2018; Palutikof et al., 2019a; Noy, 2020). The nexus of climate, law, place and property rights continues to expose people and assets to ongoing SLR (Johnston and France-Hudson, 2019; O’Donnell, 2019), especially where the risks of SLR are not being reflected in property valuations (Cradduck et al., 2020). Risk signalling through land use planning, flooding events and changes in insurance availability and costs is projected to increase recognition of coastal risks (medium confidence) (Storey and Noy, 2017; CCATWG, 2018; Lawrence et al., 2018a; Harvey and Clarke, 2019; Steffen et al., 2019; Cradduck et al., 2020; ICNZ, 2021). Proactive local-led engagement and strategy are key to effective adaptation and incentivising and supporting communities to act (Gibbs, 2020; Schneider et al., 2020). Adopting ‘fit for purpose’ decision tools that are flexible as sea levels rise (11.7.3) can build adaptive capacity in communities and institutions (high confidence).
11.3.6 Health and Well-being
11.3.6.1 Observed Impacts
There is ample evidence of health loss due to extreme weather in Australia and New Zealand, and rising temperatures, changing rainfall patterns and increasing fire weather have been attributed to anthropogenic climate change (11.2.1). Extreme heat leads to excess deaths and increased rates of many illnesses (Hales et al., 2000; Nitschke et al., 2011; Lu et al., 2020). Between 1991 and 2011 it is estimated that 35–36% of heat-related mortality in Brisbane, Sydney and Melbourne was attributable to climate change, amounting to about 106 deaths a year on average over the study period (Vicedo-Cabrera et al., 2021). Exposure to high temperatures at work is common in Australia, and the health consequences may include more accidents, acute heat stroke and chronic disease (Kjellstrom et al., 2016). Long-term rise in temperatures is changing the balance of summer and winter mortality in Australia (Hanigan et al., 2021). The Black Summer wildfires in Australia in 2019/2020 (Box 11.1) caused 33 deaths directly (Davey and Sarre, 2020) and exposed millions of people to heavy particulate pollution (Vardoulakis et al., 2020). In the Australian states most heavily affected by the fires, 417 deaths, 3151 hospital admissions for cardiovascular or respiratory conditions and about 1300 emergency department presentations for asthma are attributed to wildfire smoke exposure (Borchers Arriagada et al., 2020). Immediate smoke-related health costs from the 2019–2020 fires are estimated at AUD$1.95 billion (Johnston et al., 2020).
Extreme heat is associated with decreased mental well-being, more marked in women than men (Ding et al., 2016). Changing climatic patterns in western Australia have undermined farmers’ sense of identity and place, heightened anxiety and increased self-perceived risks of depression and suicide (Ellis and Albrecht, 2017). Following the Black Saturday wildfires in Victoria in 2009, 10–15% of the population in the most severely affected areas reported persistent fire-related post-traumatic stress disorder, depression and psychological distress (Bryant et al., 2014). Repeated exposure to the threat of wildfires in Australia, either directly (Box 11.1) or through media coverage (Looi et al., 2020), may compound effects on mental health. In March 2017, 31,000 people in New South Wales and Queensland were displaced by Tropical Cyclone Debbie. Six months post-cyclone, adverse mental health outcomes were more common among those whose access to health and social care was disrupted (King et al., 2020).
Dengue fever remains a threat in northern Australia and variations in rainfall and temperature are related to disease outbreaks and patterns of spread, although most outbreaks are sparked by travellers bringing the virus into the country (Bannister-Tyrrell et al., 2013; Hall et al., 2021). Cases of dengue fever and other arboviral diseases have been increasing among recent arrivals to New Zealand from overseas, but to date there have been no reports of local transmission (Ammar et al., 2021).
In 2016 in New Zealand, it is estimated 6000 to 8000 people became ill due to contamination of the Havelock North water supply with the bacteria Campylobacter (Gilpin et al., 2020). The infection was traced to sheep faeces washed into the underground aquifer that feeds the town’s (untreated) water supply after an extraordinarily heavy rainfall event. This is not an isolated finding: increases in paediatric hospital admissions are seen across New Zealand two days after heavy rainfall events (Lai et al., 2020).
11.3.6.2 Projected impacts
Climate change is projected to have detrimental effects on human health due to heat stress, changing rainfall patterns including floods and drought climate-sensitive air pollution (including that caused by wildfires) (high confidence) and vector-borne diseases (medium confidence). Vulnerability to detrimental effects of climate change will vary with socioeconomic conditions (high confidence).
The greatest number of people affected by compounding effects of heat, wildfires and poor air quality will be in urban and peri-urban areas of Australia. By 2100 the proportion of all deaths attributable to heat in Melbourne, Sydney and Brisbane may rise from about 0.5% to 0.8% (under RCP 2.6), or 3.2% (under RCP 8.5) (Gasparrini et al., 2017). Heatwave related excess deaths in Melbourne, Sydney and Brisbane are projected to increase to 300/year (RCP2.6) or 600/year (RCP8.5) during 2031–2080 relative to 142/year during 1971–2020, assuming no adaptation and high population growth (Guo et al., 2018). High temperatures amplify the risks due to local air pollution: without adaptation, ozone-related deaths in Sydney may increase by 50–60/year by 2070 (Physick et al., 2014).
Unless there is more effective control of nutrient runoff, bacterial contamination of drinking water supplies is projected to increase due to more intense rainfall events, exacerbating risks to human health (Gilpin et al., 2020; Lai et al., 2020), and higher temperatures will increase freshwater toxic blooms (Hamilton et al., 2016).
In general, the area of Australia suitable for the transmission of dengue is projected to increase (Zhang and Beggs, 2018; Messina et al., 2019), but estimates of local disease risk vary considerably according to climate change scenario and socioeconomic pathways (Williams et al., 2016). The spread of Wolbachia among Aedes mosquitoes in northern Australia has already reduced dengue transmission and may decrease the influence of climate in the future (Ryan et al., 2019). In New Zealand, the risk of dengue remains low for the remainder of this century (Messina et al., 2019). Higher temperatures and more intense rainfall may also increase pollen production and the risk of allergic illness throughout the region (Haberle et al., 2014).
11.3.6.3 Adaptation
Strengthening basic public health services can rapidly reduce vulnerability to death and ill-health caused by climate change; however, this opportunity is often missed (very high confidence). The 2020 New Zealand Health and Disability System Review pointed to shortcomings in leadership and governance, structures that embed health inequity, lack of transparency in planning and reporting and underinvestment in public health personnel and systems (HDSR, 2020). An Australian study found that without deliberate planning the health system ‘would only be able to deal with climate change in an expensive, ad hoc crisis management manner’ (Burton, 2014). In both Australia and New Zealand the COVID-19 epidemic has highlighted weaknesses in information systems, primary care for marginalised groups and intersectoral planning (Salvador-Carulla et al., 2020; Skegg and Hill, 2021): all these deficiencies are relevant to climate adaptation.
Underlying health and economic trends affect the vulnerability of the population to extreme weather (high confidence). Poor housing quality is a risk factor for climate-related health threats (Alam et al., 2016). Homeless people lack access to temperature-controlled or structurally safe housing and often are excluded from disaster preparation and responses (Every, 2016). These inequalities are reversible. For example, a government partnership with social housing providers in Australia improved the thermal performance of housing for low-income tenants (Barnett et al., 2013). A postcode-level analysis of the vulnerability of urban populations to extreme heat in Australian capital cities (Loughnan et al., 2013) led to the development of an interactive website for purposes of planning and emergency preparedness (Figure 11.5) as well as subsequent work on green urban design for cooler, more liveable cities (Tapper, 2021).
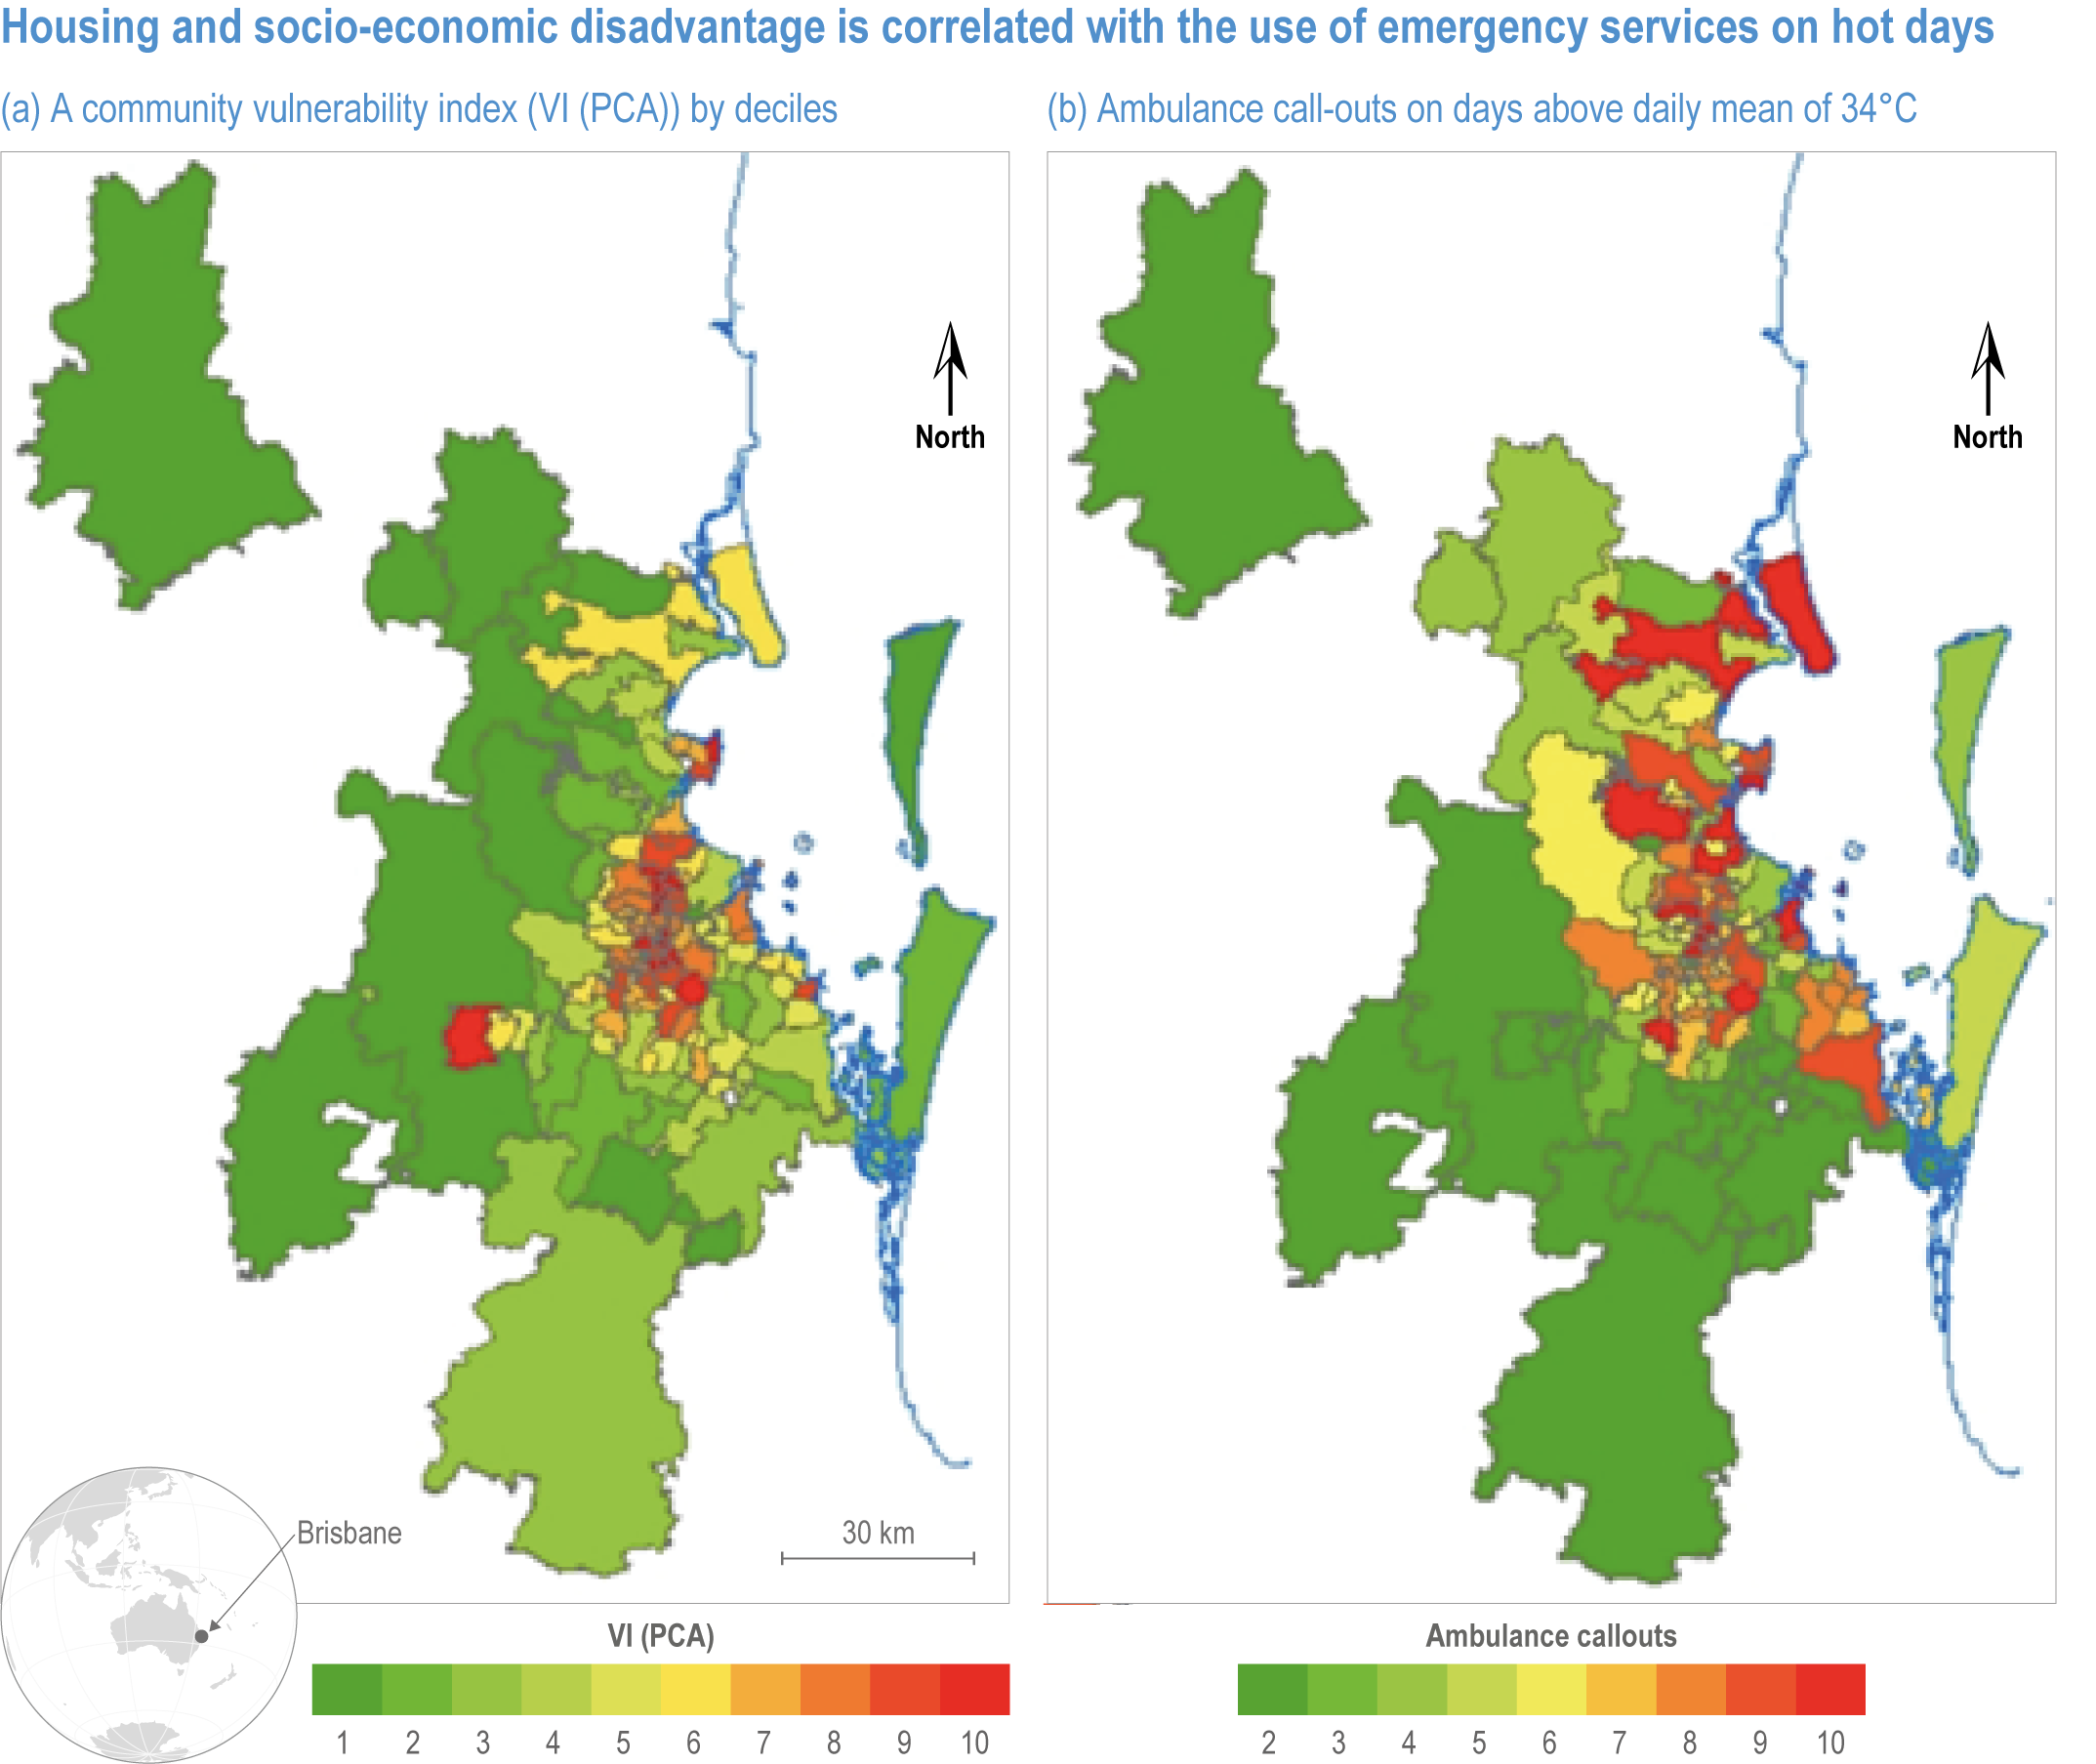
Figure 11.5 | Housing and socioeconomic disadvantage are correlated with the use of emergency services on hot days (rho = 0. 55, p<0.01). The spatial distribution of (A) a community vulnerability index (VI) (PCA) by deciles and (B) ambulance call-outs on days above the daily mean of 34°C, in Brisbane, Australia. Ambulance call-out data are expressed as deciles based on per-capita calls during 2003–2011 (Loughnan et al., 2013)
Heatwave responses, from public education to formal heat-warning systems, are the best-developed element of adaptation planning for health in Australia, but many metropolitan centres are still not covered (high confidence) (Nicholls et al., 2016; Nitschke et al., 2016). Air conditioning (AC) in Australian homes reduces mortality in heatwaves by up to 80% (Broome and Smith, 2012), but heavy reliance on AC carries risks. It is estimated that a power outage on the third day of extreme heatwaves would result in an additional 10–21 deaths in Adelaide, 24–47 in Melbourne and 7–13 in Brisbane (Nairn and Williams, 2019). Multiple interventions at the landscape, building and individual scale are available to reduce the negative health effects of extreme heat (Jay et al., 2021).
Heat extremes receive most policy attention, but the numbers of deaths are less than those resulting from more frequent exposures to moderately high temperatures (Longden, 2019). Melbourne, with its Urban Forest Strategy, provides a case study in long-term planning for cooler cities (Gulsrud et al., 2018). Australian workers’ perceptions of heat and responses to high temperatures show that heat policies on their own are insufficient for full protection; workers also require knowledge and agency to slow down or take breaks on their own initiative (Singh et al., 2015; Lao et al., 2016).
The first national climate change risk assessment in New Zealand (MfE, 2020a) highlighted the risk to potable water supplies. An inquiry into the Havelock North outbreak recommended that all registered drinking water supplies (which supply about 80% of the national population) in New Zealand should be disinfected and have stronger oversight by a national regulatory body (Government Inquiry into Havelock North Drinking Water, 2017). The use of local and Indigenous knowledge strengthens interventions to protect water supplies to remote settlements that may be affected by climatic changes (Henwood et al., 2019).
Adaptation requires better protection of health facilities and supply chains, but hospital managers seldom have capacity to invest in long-term improvements in infrastructure (Loosemore et al., 2014). However, health services in the region are required to prepare disaster plans: these could be expanded to explicitly cover health adaptation and local threats from climate change, including flooding events (Rychetnik et al., 2019).
11.3.7 Tourism
11.3.7.1 Observed Impacts
Tourism is a major economic driver in the region, accounting for 3% (Australia) and 6% (New Zealand) of GDP pre-COVID-19 (WTTC, 2018). Climate change is having significant impacts on tourism due to the heavy reliance of the sector on natural heritage and outdoor attractions (11.3.1; Box 11.2). Furthermore, because Australia and New Zealand are both long-haul destinations, a global increase in ‘flygskam’ (flight shame) will likely impact travel patterns (Becken et al., 2021).
Impacts of climate change are being observed across the tourism system (high confidence) (Scott et al., 2019a), most notably the GBR (Box 11.2) (Ma and Kirilenko, 2019). Australia’s ski industry is very sensitive to climatic change, due to reductions in snow depth and snow season length (Table 11.2) (Steiger et al., 2019; Knowles and Scott, 2020). The 2019–2020 summer wildfires (Box 11.1) impacted tourism and travel infrastructure, affecting air quality, vineyards and wineries (CoA, 2020e; Filkov et al., 2020). Global media coverage of the wildfires, alongside Australia’s climate change policy response, profoundly and negatively, affected Australia’s destination image (Schweinsberg et al., 2020; Wen et al., 2020). In New Zealand’s South Island, Fox and Franz Josef Glaciers have retreated approximately 700 m since 2008, with ice melt and retreat resulting in increased rock fall risks and negatively affecting the tourist experience (Purdie, 2013; Stewart et al., 2016; Wang and Zhou, 2019). The west coast of New Zealand is extremely prone to flooding events, impacting amenity values and access (Paulik et al., 2019a). Damage to tracks, huts and bridges have closed popular destinations, including the Hooker Glacier and the popular Routeburn and Heaphy Tracks during heavy rainfall events (Christie et al., 2020). Climate-driven damage is motivating ‘last chance’ tourism to see key natural heritage and outdoor attractions, for example, GBR (Piggott-McKellar and McNamara, 2016) and Franz Josef and Fox Glaciers (Stewart et al., 2016).
11.3.7.2 Projected Impacts
Widespread impacts from projected climate change are very likely across the tourism sector. The World Heritage listed Kakadu National Park in Australia is projected to experience increasing severity of cyclones (Turton, 2014), and sea level rise (SLR) is projected to affect freshwater wetlands (11.3.1.2; Table 11.5) (McInnes et al., 2015) and Indigenous rock art (Higham et al., 2016; Hughes et al., 2018a). The projected increase in the number of hot days in northern and inland Australia may impact the attractiveness of the region for tourists (Amelung and Nicholls, 2014; Webb and Hennessy, 2015). Coastal erosion and flooding of Australasian beaches due to sea level rise (SLR) and intensifying storm activity are estimated to increase by 60% on the Sunshine Coast by 2030, causing significant damage to tourist-related infrastructure (Hughes et al., 2018a). Urgent ‘hard’ and ‘soft’ adaptation strategies are projected to help reduce sea level rise (SLR) impacts (Becken and Wilson, 2016).
Glacier tourism, a multi-million-dollar industry in New Zealand, is potentially under threat because glacier volumes are projected to decrease (very high confidence) (Purdie, 2013). Glacier volume reductions of 50–92% by 2099 relative to the present reflect the large range of temperature projections between RCP2.6 and RCP8.5. Under RCP2.6 at 2099, the glaciers retain a similar configuration to present, although clean-ice glaciers will retreat significantly. For RCP4.5, RCP6.0 and RCP8.5, the clean-ice glaciers will retreat to become small remnants in the high mountains (Anderson et al. 2021).
Snow skiing faces significant challenges from climate change (high confidence). In Australia, the annual maximum snow depth is estimated to decrease from current levels by 15% (2030) and 60% by 2070 (SRES A2) (Di Luca et al., 2018). By 2070–2099, relative to 2000–2010, the length of the Victorian ski season is projected to contract by 65–90% under RCP8.5 (Harris et al., 2016). The New Zealand tourism destination of Queenstown is expected to experience declining snowfall, increased wind and more severe weather events (Becken and Wilson, 2016). Ski tourism stakeholders have been responding to longer-term climate risks with an increase in snow-making machines in New Zealand since 2013 (Hopkins, 2015) and in Australia (Harris et al., 2016).
11.3.7.3 Adaptation
Current snow-making technologies are expected to sustain the ski industry until mid-century. However, with warmer winter temperatures and declining water availability, snow-making is projected to decrease to half at most resorts by 2030 (Harris et al., 2016). New Zealand’s ski industry may benefit from Australian skiers visiting New Zealand due to lower relative vulnerability (Hopkins, 2015). However, tourists may substitute destinations or ski less in the absence of snow (medium agreement, limited evidence) (Cocolas et al., 2015; Walters and Ruhanen, 2015).
With the exception of the ski industry (Becken, 2013; Hopkins, 2015), tourism stakeholders generally focus on coping with short-term weather events, rather than longer-term climate risks, but they do exhibit high adaptive capacity by diversifying their activities (Stewart et al., 2016). Post-COVID-19 pandemic economics and recovery policies challenge this sector’s prospects, and the combination of COVID-19 and climate change (e.g., fires, floods) has also highlighted the need for the tourism sector to be able to respond to multiple, overlapping crises.
There is limited evidence that research into the impact of climate change on tourism in Australia and New Zealand is translating into policy or action (Moyle et al., 2017). New Zealand government tourism sector strategies acknowledge this and the need for greater understanding of climate change for the sector (TIA, 2019) but do not offer solutions (MBIE, 2019b; MfE, 2020a). The COVID-19 pandemic and the global pause of international travel offer an opportunity to potentially ‘reset’ tourism to account for the impacts of climate change (Prideaux et al., 2020).
11.3.8 Finance
11.3.8.1 Observed Impacts
The finance sector has significant exposure to climate variability and extreme events (high confidence).
Aggregated insured losses from weather-related hazard events from 2013 to 2020 were almost AUD$15 billion for Australia (1.2% of GDP) and almost NZD$1 billion for New Zealand (0.4% of GDP) (NIWA, 2020; ICA, 2021) (ICA, 2020a; NIWA, 2020). However, there is no trend in normalised losses because the rising insurance costs are being driven by more people living in vulnerable locations with more to lose (McAneney et al., 2019). In New Zealand, two major hailstorms during 2014–2020 and three major floods during 2019–2021 caused significant insurance losses (ICNZ, 2021). Insured losses exceeded NZD$472 million for the 12 costliest floods from 2007 to 2017, of which NZD$140 million could be attributed to anthropogenic climate change (Frame et al., 2020). In Australia, insured damage was almost AUD$1.0 billion for the Queensland hailstorm in 2020, AUD$1.7 billion for east coast flooding in 2020, AUD$2.3 billion for the 2019–2020 fires, AUD$2.3 billion for the Queensland hailstorm in 2019, AUD$1.2 billion for the North Queensland floods in 2019, AUD$1.4 billion for the NSW hailstorm in 2018, AUD$1.8 billion for Cyclone Debbie in 2017 and AUD$1.5 billion for the Brisbane hailstorm in 2014 (ICA, 2020b). The insured loss from the seven costliest hailstorms in Australia from 2014 to 2021 totalled AUD$7.6 billion (ICA, 2021).
Some homes in the highest-risk areas tend to be in lower socioeconomic groups that may not buy insurance (Actuaries Institute, 2020). For example, a quarter of residents that experienced loss or damage in the 2019 Townsville floods did not have insurance (ACCC, 2020). Underinsurance reduces people’s capacity to recover from adverse events, while over-reliance on private insurance undermines collective disaster recovery efforts (Lucas and Booth, 2020). In Australia, those in high-risk areas minimise house and contents insurance for financial reasons (Booth and Harwood, 2016; Osbaldison et al., 2019; Actuaries Institute, 2020). Insurance premiums in northern Australia are almost double those in the rest of Australia, and rising, mainly due to cyclone damage (ACCC, 2020).
11.3.8.2 Projected Impacts
Risks for the finance sector are projected to increase (medium confidence). The potential impact of increased coastal and inland flooding, soil desiccation and contraction, fire and wind could lead to higher insurance costs, reduced property values and difficulties for some customers to service loans (CBA, 2018). Under a high-emissions scenario (RCP8.5), estimated annual losses to home-lending customers may increase 27% by 2060, and the proportion of properties with high credit risk may rise from 0.01% in 2020 to 1% in 2060, assuming no portfolio changes (CBA, 2018). In New Zealand, weather-related insurance claims between 2000 and 2017 totalled NZD$450 million, 40% of which was due to extreme rainfall. Using six climate model projections of extreme rainfall, the insured damage is projected to increase by 7% (RCP2.6) to 8% (RCP8.5) by 2020–2040 and 9% (RCP2.6) to 25% (RCP8.5) by 2080–2100, relative to 2000–2017 (Pastor-Paz et al., 2020). By 2050–2070, tropical cyclone risk for properties not in flood plains or storm surge zones in south-east Queensland may increase by 33% under a 2°C scenario and by 317% under a 3°C scenario for properties in flood plains and storm surge zones (IAG, 2019).
11.3.8.3 Adaptation
Banks, insurers and investors increasingly recognise the risks posed by climate change to their businesses (high confidence) (Paddam and Wong, 2017). Collaborations between banks, insurers and superannuation funds in Australia and New Zealand are driving efforts aimed at achieving the Paris Agreement goals, including the New Zealand Centre for Sustainable Finance and Australian Sustainable Finance Initiative (AFSI, 2020; TAO, 2020; NZCFSF, 2021). Company directors, including superannuation fund directors, have legal obligations to disclose and appropriately manage material financial risks (Barker et al., 2016; Hutley and Davis, 2019). Financial regulators are aware of climate risks for financial stability and financial institutions (RBNZ, 2018; RBA, 2019) and are closely supervising climate risk disclosure practices (TCFD, 2017; RBNZ, 2018; APRA, 2019; CMSI, 2020; IGCC, 2021b). In Australia, regulatory action (APRA, 2021) includes issuing prudential guidelines for financial institutions on managing climate risk, aligned with guidelines developed by the Climate Measurement Standards Initiative (NESP ESCC, 2020). In New Zealand, the financial sector (climate-related disclosure and other matters) amendment bill aims to ensure that the effects of climate change are routinely considered in business, investment, lending and insurance underwriting decisions (NZ Government, 2021).
Banks and insurers are beginning to undertake climate risk analyses (CRO Forum, 2019; Bruyère et al., 2020) and disclose their risks (Paddam and Wong, 2017; ANZ, 2018; CBA, 2018). For example, the agricultural banking sector has analysed climate risk and embedded climate adaptation financing into its risk scoring and lending practices (CBA, 2019). However, the overall number of disclosures continues to lag expectations, suggesting the need for mandatory climate risk disclosure in Australia (IGCC, 2021a).
Climate adaptation finance is not evident (medium confidence). There is an adaptation finance gap (Mortimer et al. 2020). Private sector initiatives are beginning to emerge through large scale projects or public–private partnerships, such as the Queensland Betterment Fund (Banhalmi-Zakar et al., 2016; Ware and Banhalmi-Zakar, 2020). Addressing investor pressure (IGCC, 2017) could increase investment in adaptation. However, ongoing policy uncertainty in Australia continues to be the key barrier to allocating additional capital to invest in climate solutions for 70% of investors (IGCC, 2021a).
Current and future insurance affordability pressures could be addressed by increased mitigation, revisions to building codes and standards and better land use planning (ACCC, 2020; Actuaries Institute, 2020). In New Zealand, insurance signals are motivating the government to address adaptation funding mechanisms (Boston and Lawrence, 2018; CCATWG, 2018). Some insurers offer premium discounts to customers with reduced risk (Drill et al., 2016), with increasing premiums reflecting known risk and no cover for some hazards in risky locations (CCATWG, 2017). Special excess payments are available for flood hazard so customers take responsibility for part of the claim, with increasing premiums to reflect known and foreseeable risk and downgrading cover from replacement value to market value (Bruyère et al., 2020). Retreat by private insurers from risky locations could increase the unfunded fiscal risk to the government (Storey and Noy, 2017), creating moral hazard (Boston and Lawrence, 2018). The litigation risk from failing to take adaptation action (Hodder, 2019) could affect financial markets and government policy settings, creating cascading impacts across society (Lawrence et al., 2020b) CRO Forum, 2019). For some climate risks, national governments act as ‘last resort’ insurers (CCATWG, 2017), but this could become unsustainable (CRO Forum, 2019).
11.3.9 Mining
Many mines are exposed and sensitive to climate extremes (high confidence), but there is little available research on climate change impacts on them (Odell et al., 2018). Most Australian mines face higher temperatures, cyclones, erosion and landslides and hazards such as sea level rise (SLR) and storms across their supply chains, including ports (Cahoon et al., 2016). Impacts include operational disruptions such as acute drainage problems (Loechel and Hodgkinson, 2014) and heat-induced illness, irritation and absenteeism among workers (McTernan et al., 2016), lost revenue and increased costs (Pizarro et al., 2017).
Damage and disruption from climate impacts can cost operators billions of dollars (Cahoon et al., 2016). Climatic extremes increase the risk and impact of spillages along transportation routes (Grech et al., 2016), exacerbate mining’s effects on hydrology, ecosystems and air quality (Phillips, 2016; Ali et al., 2018), increase contamination risks (Metcalfe and Bui, 2016) and disrupt and slow mine site rehabilitation (Wardell-Johnson et al., 2015; Hancock et al., 2017). Adaptations such as improved water management are emerging slowly (Gasbarro et al., 2016; Becker et al., 2018). Some companies are spatially diversifying and relocating (Hodgkinson et al., 2014). Others are replacing workers with automation and remote operations (Halteh et al., 2018; Keenan et al., 2019).
11.3.10 Energy
Australia’s energy generation is a mix of coal (56%), gas (23%) and renewables (21%) (DISER, 2020), with ageing coal-fired infrastructure being replaced by a growing proportion of renewable and distributed energy resources (AEMO, 2018). In New Zealand, 60% of energy generation comes from hydro-electricity and 15% from geothermal (MBIE, 2021), with coal (2%) and gas (13%) generation capacity to be retired, and total renewable energy to increase from 82% in 2017 to around 95% by 2050, mostly through wind generation (MBIE, 2019a).
11.3.10.1 Observed Impacts
The energy sector is highly vulnerable to climate change (high confidence). Oil and gas systems are vulnerable to storms, fires, drought, floods, sea level rise (SLR), extreme heat and fires, which can damage infrastructure, slow production and add to operational costs (Smith, 2013). The electricity system is vulnerable to high temperatures reducing generator and network capacity and increasing failure rates and maintenance costs (AEMO, 2020a). Fires (including those sparked by electrical distribution lines) pose risks to assets. Smoke can cause electricity transmission to trip, and high winds reduce wind-energy capacity and threaten the integrity of transmission lines. Low rainfall reduces hydro-energy capacity and increases the demand for desalination energy. Higher sea level may affect some low-lying generation, distribution and transmission assets, and compound extreme weather events can cause outages (Vose and Applequist, 2014; Lawrence et al., 2016; AEMO, 2020b; AEMO, 2020a; ESCI, 2021). For example, in September 2016, a major windstorm in South Australia damaged 23 transmission towers and cut power to over 900,000 households. In February 2017, the South Australian energy system failed to cope with a heatwave-related jump in demand, causing power cuts to 40,000 homes (Steffen et al., 2017). In April 2018, a storm over Auckland, New Zealand left 182,000 properties without power (Bell, 2018). The 2019/2020 Australian heatwaves and fires caused widespread blackouts that disrupted communications, transport and emergency response capacity (Box 11.1).
11.3.10.2 Projected Impacts
Risks for the energy sector are projected to increase with climate change (medium confidence). Projected increases in the frequency and intensity of heatwaves, fires, droughts and wind-storms would increase risks for energy supply and demand (AEMO, 2020b; ESCI, 2021). Households are unevenly vulnerable to energy sector risks due to varying housing quality and health dependencies (11.3.6). In New Zealand, a warmer climate and increasing energy efficiency is projected to marginally reduce annual average peak electricity heating demand (Stroombergen et al., 2006; MBIE, 2019a). Winter and spring inflows to main hydro lakes are projected to increase 5–10% and may reduce hydroelectric energy vulnerability (McKerchar and Mullan, 2004; Poyck et al., 2011; Stevenson et al., 2018). However, major electricity supply disruptions are projected to increase as dependence on electricity grows from 25% of total energy in 2016 to 58% in 2050 (Transpower, 2020).
In Australia, the total heating and cooling energy demand of 5-star energy-rated houses is projected to change by 2100 (Wang et al., 2010). At 2°C global warming, the estimated change in demand is −27% in Hobart, −21% in Melbourne, +61% in Darwin, +67% in Alice Springs and +112% in Sydney. For a 4°C global warming, the changes are −48%, −14%, +135%, +213% and +350% respectively.
11.3.10.3 Adaptation
Options to manage risks include adaptation of energy markets, integrated planning, improved asset design standards, smart-grid technologies, energy generation diversification, distributed generation (e.g., roof-top solar, microgrids), energy efficiency, demand management, pumped hydro storage, battery storage and improved capacity to respond to supply deficits and balance variable energy resources across the network (Table 11.8) (high confidence). With increasing electrification, diversification and resilience can contribute to security of supply as fossil fuels are retired from the energy mix (AEMO, 2020b). In Australia, the AEMO (2020) Integrated System Plan has evaluated various options, costs and benefits. Risks associated with an increasing reliance on weather-dependent renewable energy (e.g., solar, wind, hydro) (ESCI, 2021) can be managed through strong long-distance interconnection via high-voltage powerlines and storage (Blakers et al., 2017; Blakers et al., 2021; Lu et al., 2021). However, implementation of adaptation options remains inadequate (Gasbarro et al., 2016).
Table 11.8 | Adaptation options for energy sector.
Adaptation options | References |
Diversification of electricity supplies geographically and technically, including distributed energy resources and variable renewable energy | |
Integrated planning, improved asset design and management and disaster recovery to build resilience to more extreme weather | |
Augmentation of transmission grid to support change in generation mix using interconnectors and renewable energy zones, coupled with energy storage, adds capacity and helps balance variable resources across the network | |
Climate change risks included in the design, location and rating of future infrastructure and consideration of the implications for future transmission developments | |
Increased design and construction standards, flood defence measures, insurance, improved water efficiency, improved insulation of supercooled LNG processes, more efficient air conditioning and creating fire breaks for the oil and gas sector | |
Technological developments to strengthen existing resilience under climate change that reinforce the relative advantage of western Australia and Tasmania for new wind energy installations | |
Energy generation diversity, demand management, pumped hydro storage and battery storage | |
Tools and strategies to manage winter energy deficits and dry years alongside renewable electricity generation deployment | |
Improved insulation and heating of buildings and flexible electricity consumption to reduce significance of winter electricity demand peak |
11.3.11 Detection and Attribution of Observed Climate Impacts
Detection and attribution of observed climate trends and events is called ‘climate attribution’. This has been assessed by IPCC WGI (Gutiérrez et al., 2021; Ranasinghe et al., 2021; Seneviratne et al., 2021) and summarised in Chapter 16. Trends that have been formally attributed in part to anthropogenic climate change include regional warming trends and sea level rise (SLR), decreasing rainfall and increasing fire risk in southern Australia. Events include extreme rainfall in New Zealand during 2007–2017, the 2007/2008 and 2012/2013 droughts in New Zealand, high temperatures in Australia during 2013–2020, the 2016 northern Australian marine heatwave, the 2016/2017 and 2017/18 Tasman Sea marine heatwaves and 2019/2020 fires in Australia.
Detection and attribution of climate impacts on natural and human systems is called ‘impact attribution’. This often involves a two-step approach (joint attribution) that links climate attribution to observed impacts. Impact attribution is complicated by confounding factors, for example, changes in exposure arising from population growth, urban development and underlying vulnerabilities.
Impact attribution is considered in Sections 11.3.1–11.3.10 and summarised in Table 11.9. More literature is available for natural systems than human systems, which represents a knowledge gap rather than an absence of impacts that are attributable to anthropogenic climate change. Fundamental shifts in the structure and composition of some ecosystems are partly due to anthropogenic climate change (high confidence). In human systems, the costs of droughts and floods in New Zealand, and heat-related mortality and fire damage in Australia, are partly attributed to anthropogenic climate change (medium confidence).
Table 11.9 | Examples of observed impacts that can be partly attributed to climate change.
Impact | Source |
Mass bleaching of GBR in 2016/2017 due to a marine heatwave | Box 11.2 |
In the New Zealand southern Alps, extreme glacier mass loss, which was at least 6 times more likely in 2011 and 10 times more likely in 2018, due to warming | 11.2.1, 11.3.3 |
In the Australian Alps bioregion, loss of habitat for endemic and obligate species due to snow loss and increases in fire, drought and temperature | Table 11.4 |
In the Australian wet tropics world heritage area, some vertebrate species have declined in distribution area and population size due to increasing temperatures and length of dry season | Table 11.4 |
Extinction of Bramble Cay melomys due to loss of habitat caused by storm surges and SLR in Torres Strait | Table 11.4 |
In New Zealand, increasing invasive predation pressure on endemic forest birds surviving in cool forest refugia due to anthropogenic warming | Table 11.4 |
In New Zealand, erosion of coastal habitats due to more severe storms and SLR | Table 11.4, Box 11.6 |
In Australia, estuaries warming and freshening with decreasing pH | Table 11.6 |
Changes in life-history traits, behaviour or recruitment of fish and invertebrates due to ocean acidification or warming, severe decline in recruitment of coral on GBR due to ocean warming, aquaculture stock deaths due to heat stress | Table 11.6 |
New diseases and toxins due to warming and extension of East Australian Current | Table 11.6 |
Changes in almost 200 marine species’ distributions and abundance due to ocean warming | Table 11.6 |
Temperate marine species replaced by seaweeds, invertebrates, corals and fishes characteristic of sub-tropical and tropical waters | Table 11.6 |
River flow decline in southern Australia is largely due to the decline in cool-season rainfall partly attributed to anthropogenic climate change | 11.3.3 |
In New Zealand, the 2007/2008 drought and 2012/2013 drought were 20% attributed to anthropogenic climate change | 11.3.3 |
In New Zealand, about 30% of the insured damage for the 12 costliest flood events from 2007 to 2017 can be attributed to anthropogenic climate change | 11.3.8 |
In Australia, 35–36% of heat-related excess mortality in Melbourne, Sydney and Brisbane from 1991–2018 can be attributed to anthropogenic climate change | 11.3.6 |
11.4 Indigenous Peoples
Indigenous perspectives of well-being embrace physical, social, emotional and cultural domains, collectiveness and reciprocity and, more fundamentally, connections between all elements across past, present and future generations (Australia. NAHS Working Party, 1989; MfE, 2020a). Changing climate conditions are expected to exacerbate many of the social, economic and health inequalities faced by Aboriginal and Torres Strait Islander Peoples in Australia and Māori in New Zealand (high confidence) (Bennett et al., 2014; Hopkins et al., 2015; AIHW, 2016; Lyons et al., 2019). As a consequence, effective policy responses are those that take advantage of the interlinkages and dependencies between mitigation, adaptation and Indigenous Peoples’ well-being (Jones, 2019) and those that address the transformative change needed from colonial legacies (high confidence) (Hill et al., 2020). There is a central role for Indigenous Peoples in climate change decision-making that helps address the enduring legacy of colonisation through building opportunities based on Indigenous governance regimes, cultural practices to care for land and water and intergenerational perspectives (very high confidence) (Nursey-Bray et al., 2019; Petzold et al., 2020) (Cross-Chapter Box INDIG in Chapter 18).
11.4.1 Aboriginal and Torres Strait Islander Peoples of Australia
The highly diverse Aboriginal and Torres Strait Islander Peoples of Australia have survived and adapted to climate changes such as sea level rise (SLR) and extreme rainfall variability during the late Pleistocene era, through intimate place-based Indigenous knowledge in practice and while losing traditional land and sea country ownership (Liedloff et al., 2013) (Cross-Chapter Box INDIG in Chapter 18) including during the Late Pleistocene era (Golding and Campbell, 2009; Nunn and Reid, 2016). They belong to the world’s oldest living cultures, continually resident in their own ancestral lands, or ‘country’, for over 65,000 years (Kingsley et al., 2013; Marmion et al., 2014; Nagle et al., 2017; Tobler et al., 2017; Nursey-Bray and Palmer, 2018). The majority of the Australian Indigenous Peoples live in urban areas in southern and eastern Australia, but are the predominant population in remote areas.
Climate-related impacts on Aboriginal and Torres Strait Islander Peoples, countries (traditional estates) and cultures have been observed across Australia and are pervasive, complex and compounding (high confidence) (Green et al., 2009) (11.5.1), for example, the loss of biocultural diversity, nutritional changes through the availability of traditional foods and forced diet change, water security and loss of land and cultural resources through erosion and SLR (Table 11.10) (TSRA, 2018). Moreover, these impacts are being experienced now particularly in low-lying geographical areas—especially in the Torres Strait Islands (Mosby, 2012; Kelly, 2014; Murphy, 2019; Hall et al., 2021). Estimates of the loss from fire impacts on ecosystem services that contribute to the well-being of remotely located Indigenous Australians were found to be higher than the financial impacts from the same fires on pastoral and conservation lands (Sangha et al., 2020) and could increase with both financial and non-financial impacts (Box 11.1).
Table 11.10 | Climate-related impacts on Aboriginal and Torres Strait Islander Peoples, country and cultures.
Impacts | Implications |
Loss of biocultural diversity (land, water and sky) (medium confidence) | Healthy country is critical to Indigenous Australians’ livelihoods, caring for country responsibilities, health and well-being. Damage to land can magnify the loss of spiritual connection to land from dispossession from traditional country and leads to disruption of cultural structures. Climate change impacts can exacerbate and/or accelerate existing threats of habitat degradation and biodiversity loss and create challenges for traditional stewardship of landscapes (Mackey and Claudie, 2015) |
Climate-driven loss of native title and other customary lands (medium confidence) | Traditional coastal lands lost through erosion and rising sea level, with associated mental health implications from loss of cultural and traditional artefacts and landscapes, including the destruction and exhumation of ancestral graves and burial grounds. This is also occurring and predicted to intensify in the low-lying islands of the Torres Strait (TSRA, 2018; Hall et al., 2021) and was also noted during the extreme bushfires in Eastern Australia in late 2019 and early 2020. |
Changing availability of traditional foods and forced diet change (medium confidence) | Human health impacts can be exacerbated by climate change through the changing availability of traditional foods and medicines, while outages and the high costs of electricity can limit the storage of fresh food and medication (Kingsley et al., 2013; Spurway and Soldatic, 2016; Hall and Crosby, 2020) |
Changing climatic conditions for subsistence food harvesting (medium confidence) | Climate-change-induced SLR and saltwater intrusion can limit the capacity for traditional Indigenous floodplain pastoralism and affect food security, access to and affordability of healthy, nutritional food (Ligtermoet, 2016; Spurway and Soldatic, 2016) |
Extreme weather events triggering disasters (high confidence) | Increasing frequency or intensity of extreme weather events (floods, droughts, cyclones, heatwaves) can cause disaster responses in remote communities, including infrastructure damage of essential water and energy systems and health facilities (TSRA, 2018; Hall and Crosby, 2020) |
Heatwave impacts on human health (high confidence) | Heatwaves can occur in many regions of Australia. Tropical regions can experience prolonged seasons of high temperatures and humidity levels, resulting in extreme heat stress risks. For example, the Torres Strait Islands are already categorised under the U.S. National Oceanic and Atmospheric Administration (NOAA) Heat Index as a danger zone for extreme human health risk during summer (TSRA, 2018) |
Health impacts from changing conditions for vector-borne diseases (high confidence) | Climate change can alter exposure and increase risk for remote Indigenous Peoples to infection from waterborne and insect-borne diseases, especially if medical services are limited or damaged by extreme weather events. For example, in the Torres Strait Islands the changing climate is affecting the range and extension of the Aedes albopictus and Aedes aegypti mosquitoes that can carry and transmit dengue and other viruses (Horwood et al., 2018; TSRA, 2018) |
Unadaptable infrastructure for changing environmental conditions (high confidence) | Poorly designed, inferior quality and unmaintained housing can create health challenges for tenants in extreme heat (Race et al., 2016). Essential community-scale water and energy service infrastructure, unpaved roads, sea walls and stormwater drains can fail in extreme weather events (McNamara et al., 2017) |
Drinking water security (medium confidence) | Predicted continued increases in arid conditions in Australia are expected to reduce the recharge rate of finite groundwater supplies (Barron et al., 2011). For remote communities reliant on groundwater for drinking supplies, this water insecurity creates vulnerabilities from over-extraction and lack of access (Jackson et al., 2019; Hall and Crosby, 2020). This groundwater can also have microbial contamination from sewage and chemicals supporting bacterial growth, such as high iron levels supporting the growth of Burkholderia pseudomallei that causes melioidosis in humans and animals (Kaestli et al., 2019). In the Torres Strait, increasing reliance on desalination for drinking water raises costs for fuel and its associated transport (Beal et al., 2018) |
Due to ongoing impacts of colonisation, Aboriginal and Torres Strait Islander Peoples have, on average, lower income, poorer nutrition, lower school outcomes and employment opportunities, higher incarceration and higher levels of removal of children than non-Indigenous Australians, represented in high comorbidities of chronic diseases and mental health impacts (Marmot, 2011; Green and Minchin, 2014; AIHW, 2015). This relative poverty can reduce climate-adaptive capacities while exacerbating climate change vulnerabilities (Nursey-Bray and Palmer, 2018). In remote country, this can combine with lack of security for food and water, non-resilient housing and extreme weather events, contributing to migration off traditional country and into towns and cities—with flow-on social impacts such as homelessness, dislocation from community and family and disconnection from country and spirituality (Mosby, 2012; Brand et al., 2016).
Recognition of the role of Aboriginal and Torres Strait Islander Peoples in identifying solutions to the impacts of climate change is slowly emerging (UN, 2018 ), having been largely excluded from meaningful representation from the conception of climate change dialogue through to debate and decision-making (Nursey-Bray et al., 2019). Honouring the United Nations Declaration on the Rights of Indigenous Peoples and social justice values would support self-determination and the associated opportunity for Indigenous Australians to develop adaptation responses to climate change (Langton et al., 2012; Nursey-Bray and Palmer, 2018; Nursey-Bray et al., 2019), including the adaptive capacity opportunities available through Indigenous knowledge (Liedloff et al., 2013; Petheram et al., 2015; Stewart et al., 2019) (Cross-Chapter Box INDIG in Chapter 18). The Uluru Statement from the Heart proposes a pathway and roadmap forward for enhanced representation of Aboriginal and Torres Strait Islander Peoples in decision-making in Australia (Ululru Statement, 2017). Table 11.11 provides examples of traditional Indigenous practices of adaptation to a changing climate. However, due to Indigenous methods of knowledge sharing and knowledge holding, such knowledge relies disproportionately on elders and seniors, who form a very small portion of the total Aboriginal and Torres Strait Islander Peoples of Australia, and is limited in the formal literature (ABS, 2016).
Table 11.11 | Examples of Aboriginal and Torres Strait Islander Peoples’ practices of adaptation to a changing climate
‘Caring for Country’: Traditional Practices for Holistic Land and Cultural Protection and Adaptation in a Changing Climate | Source |
Indigenous Protected Area (IPA) management plans enable culturally and ecologically compatible development that contribute to local Indigenous economies | |
IPAs can avoid the potential for ‘nature–culture dualism’ that locks out Indigenous access in some protected area legislation because they are based on relational values informed by local Indigenous knowledge | |
Fire management using cultural practices can achieve greenhouse gas emission targets while maintaining Indigenous cultural heritage. | |
Indigenous Ranger programmes provide a means for Indigenous-guided land management, including for fire management and carbon abatement, fauna studies, medicinal plant products, weed management and recovery of threatened species | |
Faunal field surveys can engage local, bounded and fine-scale intuitive species location by Indigenous knowledge holders and their knowledge used for conservation planning | |
Cultural flows in waterways are a demonstration of cultural knowledge, values and practice in action as they are informed by Indigenous knowledge, bound by water-dependent values, and define when and where water is to be delivered, particularly in a changing climate |
11.4.2 Tangata Whenua—New Zealand Māori
Māori society faces diverse impacts, risks and opportunities from climate change (Table 11.12). Studies exploring climate change impacts, scenarios, policy implications, adaptation options and tools for Māori society have increased substantially (e.g., (King et al., 2012; Bargh et al., 2014; Jones et al., 2014; Bryant et al., 2017; Awatere et al., 2018; Colliar and Blackett, 2018). Māori priorities surrounding climate change risks and natural resource management have been articulated in planning documents by many Māori kin groups (e.g., (Ngāti Tahu- Ngāti Whaoa Rūnanga Trust, 2013; Raukawa Settlement Trust, 2015; Ngai-Tahu, 2018; Te Urunga Kea - Te Arawa Climate Change Working Group, 2021), reflecting the importance of reducing vulnerability and enhancing resilience to climate impacts and risks through adaptation and mitigation.
Table 11.12 | Climate-related impacts and risks for Tangata Whenua New Zealand Māori
Impact | Risks |
Changes in drought occurrence and extreme weather events | Risks to Māori tribal investment in forestry, agriculture and horticulture sector operations and production, particularly across eastern and northern New Zealand (medium confidence) (King et al., 2010; Awatere et al., 2018; Hardy et al., 2019) |
Changes in rainfall, temperature, drought, extreme weather events and ongoing SLR | Risks to potable water supplies (availability and quality) for remote Māori populations (medium confidence) (RSNZ, 2016; Henwood et al., 2019) |
Changes in rainfall, temperature, drought, extreme weather events and ongoing SLR | Risks of exacerbating existing inequities (e.g., health, economic, education and social services), social cohesion and well-being (medium confidence) (Bennett et al., 2014; Jones et al., 2014) |
Changes in rainfall regimes and more intense drought combined with degradation of lands and water | Risks to the distribution and survival of cultural keystone flora and fauna, as well as cascading risks for Māori customary practice, cultural identity and well-being (high confidence) (King et al., 2010; RSNZ, 2016; Bond et al., 2019) |
Changes in ocean temperature and acidification | Risks to nearshore and ocean species productivity and distribution, as well as cascading risks for Māori tribal investment in the fisheries and aquaculture sectors (medium confidence) (King et al., 2010; Law et al., 2016) |
Sea-level-rise-induced erosion, flooding and saltwater intrusion | Risks to Māori-owned coastal lands and economic investment as well as risks to community well-being from displacement of individuals, families and communities (high confidence) (Manning et al., 2014; Smith et al., 2017; Hardy et al., 2019) |
Sea-level-rise-induced erosion, inundation and saltwater intrusion | Risks to Māori cultural heritage as well as cascading risks for tribal identity and spiritual well-being (medium confidence) (King et al., 2010; Manning et al., 2014; RSNZ, 2016) |
Impacts of climate change, adaptation and mitigation actions | Risks that governments are unable to uphold Māori interests, values and practices under the Treaty of Waitangi, creating new, modern-day breaches of the Treaty of Waitangi (high confidence) (Iorns Magallanes, 2019; MfE, 2020a) |
Māori have long-term interests in land and water and are heavily invested in climate-sensitive sectors (agriculture, forestry, fishing, tourism and renewable energy) (King et al., 2010). Large proportions of collectively owned land already suffer from high rates of erosion (Warmenhoven et al., 2014; Awatere et al., 2018), which are projected to be exacerbated by climate-change-induced extreme rainfalls (high confidence) (RSNZ, 2016; Awatere et al., 2018). Changing drought occurrence, particularly across eastern and northern New Zealand, is also projected to affect primary sector operations and production (medium confidence) (King et al., 2010; Smith et al., 2017; Awatere et al., 2018). Further, many Māori-owned lands and cultural assets, such as marae and urupa, are located on coastal lowlands vulnerable to sea level rise (SLR) impacts (high confidence) (Manning et al., 2014; Hardy et al., 2019). Māori tribal investment in fisheries and aquaculture faces substantial risks from changes in ocean temperature and acidification and the downstream impacts on species distribution, productivity and yields (medium confidence) (Law et al., 2016). A clearer understanding of climate change risks and the implications for sustainable outcomes can enable more informed decisions by tribal organisations and governance groups.
Changing climate conditions are projected to exacerbate health inequities faced by Māori (medium confidence) (Bennett et al., 2014; Jones et al., 2014; Hopkins, 2015). The production and ecology of some keystone cultural flora and fauna may be impacted by projected warming temperatures and reductions in rainfall (medium confidence) (RSNZ, 2016; Bond et al., 2019; Egan et al., 2020). Obstruction of access to keystone species is expected to adversely impact customary practice, cultural identity and well-being (medium confidence) (Jones et al., 2014; Bond et al., 2019). Social-cultural networks and conventions that promote collective action and mutual support are central features of many Māori communities, and these practices are invaluable for initiating responses to, and facilitating recovery from, climate stresses and extreme events (King et al., 2011; Hopkins et al., 2015). Māori tribal organisations have a critical role in defining climate risks and policy responses (Bargh et al., 2014; Parsons et al., 2019), as well as entering into strategic partnerships with business, science, research and government to address these risks (high confidence) (Manning et al., 2014; Beall and Brocklesby, 2017; CCATWG, 2017).
More integrated assessments of climate change impacts, adaptation and socioeconomic risk for different Māori groups and communities, in the context of multiple stresses, inequities and different ways of knowing and being (King et al., 2013; Schneider et al., 2017; Henwood et al., 2019), would assist those striving to evaluate impacts and risks and how to integrate these assessments into adaptation plans (high confidence). Better understanding of the social, cultural and fiscal implications of sea level rise (SLR) is urgent (PCE, 2015; Rouse et al., 2017; Colliar and Blackett, 2018), including what duties local and central government might have with respect to actively upholding Māori interests under the Treaty of Waitangi (high confidence) (Iorns Magallanes, 2019). Intergenerational approaches to climate change planning will become increasingly important, elevating political discussions about conceptions of rationality, diversity and the rights of non-human entities (high confidence) (Ritchie, 2013; Carter et al., 2018; Ruru, 2018; Munshi et al., 2020).
11.5 Cross-Sectoral and Cross-Regional Implications
The impacts and adaptation processes described in Sections 11.3 and 11.4 are focused on specific sectors, systems and Indigenous Peoples. Added complexity, risk and adaptation potential stem from cross-sectoral and cross-regional interdependencies.
11.5.1 Cascading, Compounding and Aggregate Impacts
11.5.1.1 Observed Impacts
Climate impacts are cascading, compounding and aggregating across sectors and systems due to complex interactions (high confidence) (Pescaroli and Alexander, 2016; Challinor et al., 2018; Zscheischler et al., 2018; Steffen et al., 2019; AghaKouchak et al., 2020; CoA, 2020e; Lawrence et al., 2020b; Simpson et al., 2021) (Boxes 11.1, 11.3, 11.4, 11.5 and 11.6). Cascading impacts propagate via interconnections and systemic factors, including supply chains, shared reliance on connected biophysical systems (e.g., water catchments and ecosystems), infrastructure, essential goods and services and the exercise of governance, leadership, regulation, resources and standard practices (e.g., in planning and building codes), including lock-in of past decisions and experience (CSIRO, 2018; Lawrence et al., 2020b). The capacity of critical systems such as information, communication and technology, water infrastructure, health care, electricity and transport networks, is being stretched, with impacts cascading to other systems and places, exacerbating existing hazards and generating new risks (Cradock-Henry, 2017) (11.3.6; 11.3.10; Box 11.1). Temporal or spatial overlap of hazards (e.g., drought, extreme heat and fire; drought followed by extreme rainfall) are compounding impacts (Zscheischler et al., 2018) and affecting multiple sectors.
Extreme events such as heatwaves, droughts, floods, storms and fires have caused deaths and injuries (Deloitte, 2017a) (11.3.5.1), and affected many households, communities and businesses via impacts on ecosystems, critical infrastructure, essential services, food production, the national economy, valued places and employment. This has created long-lasting impacts (e.g., mental health, homelessness, health incidents and reduced health services) (Brown et al., 2017; Brookfield and Fitzgerald, 2018; Rychetnik et al., 2019) and reduced adaptive capacity (Friel et al., 2014; O’Brien et al., 2014; Ding et al., 2015; CoA, 2020e) (Box 11.1, Box 11.3, 11.3.1–11.3.10).
In New Zealand, extreme snow, rainfall and wind events have combined to impact road networks, power and water supplies and have impeded interdependent wastewater and stormwater services and business activities (Deloitte, 2019; Lawrence et al., 2020b; MfE, 2020a) (Box 11.4). Community and infrastructure services are periodically disrupted during extreme weather events, triggering impacts from the interdependencies across enterprises and individuals (Glavovic, 2014; Paulik et al., 2021).
Slow-onset climate change impacts have also had cascading and compounding effects. For example, degradation of the GBR by ocean heating, acidification and non-climatic pressures (Marshall et al., 2019), repeated pluvial, fluvial and coastal flooding of some settlements (Paulik et al., 2019a; Paulik et al., 2020), long droughts and water insecurity in rural communities (Tschakert et al., 2017) and the gradual loss of species and ecological communities have caused substantial ecological, social and economic losses. Indigenous Peoples have especially been impacted by multiple and complex losses (Johnson et al., 2021) (11.4).
11.5.1.2 Projected Impacts
Cascading, compounding and aggregate impacts are projected to grow due to a concurrent increase in heatwaves, droughts, fires, storms, floods and sea level (high confidence) (CSIRO, 2020; Lawrence et al., 2020b). Urban wastewater, stormwater and water supply systems are particularly vulnerable in New Zealand (Paulik et al., 2019a; Hughes et al., 2021) to pluvial flooding (Box 11.4) and to sea level rise (SLR) (Box 11.6), with flow-on effects to settlements, insurance and finance sectors, and governments (Lawrence et al., 2020b). Furthermore, consecutive heavy rainfall events in late summer and autumn, following drought conditions in low-lying modified wetland areas, have implications for the operation of flood control infrastructure as increased rainfall intensity, land subsidence and sea level rise (SLR) compound and result in the retention of floodwaters (Pingram et al., 2021).
In Australia, the aggregate loss of wealth due to climate-induced reductions in productivity across agriculture, manufacturing and service sectors is projected to exceed AUD$19 billion by 2030, AUD$211 billion by 2050 and AUD$4 trillion by 2100 for RCP8.5 (Steffen et al., 2019) (Table 11.13). Projected impacts also cascade across national boundaries via value chains, markets, movement of humans and other organisms and geopolitics (e.g., migration from near-neighbours as a pathway for adaptation, mobile climate-sensitive diseases and changes in production and trade patterns) (Lee et al., 2018; Nalau and Handmer, 2018; Schwerdtle et al., 2018; Dellink et al., 2019). The scale of impacts is projected to challenge the adaptive capacity of sectors, governments and institutions (Steffen et al., 2019), including the insurability of assets and risks to lenders (Storey and Noy, 2017).
Table 11.13 | Economy-wide projected costs (AUD$) of climate change in Australia. (Estimates are not comparable across studies because different methods have been used. Estimates for later in the century are speculative because both impacts and adaptation are uncertain.)
Impact | 2030 | 2050 | 2090 | Reference |
Damage-related loss of property value in Australia | $571 billion | $611 billion | $770 billion | |
Property damage in Australia | $91 billion/year | $117 billion/year | ||
Loss of asset value of road infrastructure (including freeways, main roads and unsealed roads) in Australia at risk of a SLR of 1.1 m by 2100 | $46–60 billion | |||
Loss of asset value of rail and tramway infrastructure in Australia at risk of a SLR of 1.1 m by 2100 | $4.9–6.4 billion | |||
Loss of asset value of residential buildings in Australia at risk of a SLR of 1.1 m by 2100 (2008 replacement value) | $51–72 billion | |||
Loss of asset value of light industrial buildings (used for warehousing, manufacturing and assembly activities and services) in Australia at risk of a SLR of 1.1 m by 2100 | $4.2–6.7 billion | |||
Loss of asset value of commercial buildings (used for wholesale, retail, office and transport activities) in Australia at risk of a SLR of 1.1 m by 2100 (2008 replacement value) | $58–81 billion | |||
Accumulated loss of wealth due to reduced agricultural productivity and labour productivity | $19 billion | $211 billion | $4.2 trillion | |
Wind damage to dwellings in Cairns, Townsville, Rockhampton and south-east Queensland (assuming a 4% discount rate) | $3.8 billion | $9.7 billion | $20 billion | |
Damage to Australian coastal residential buildings due to SLR (A1B scenario, 3.5°C global warming) | $8 billion |
11.5.1.3 Adaptation
Coordinating adaptation strategies and addressing underlying exposure and vulnerability can increase resilience to cascading, compounding and aggregate impacts (high confidence) (Table 11.17; 11.7.3). Systems understanding, network analysis, stress testing, spatial mapping, collaboration, information sharing and interoperability across states, sectors, agencies and value chains, as well as national-scale facilitation, can increase adaptive capacity (Espada et al., 2015; CoA, 2020e; Cradock-Henry et al., 2020b; Jozaei et al., 2020). Greater system diversity, modularity, redundancy, adaptability and decentralised control can reduce the risk of cascading failures and system breakdown (Sinclair et al., 2017; Sellberg et al., 2018). Addressing existing vulnerabilities in systems can reduce susceptibility and improve the resilience of interdependent systems (11.7.3). Multi-level leadership, including national and sub-national policies, laws and finance can reduce and manage aggregate risks supported by the enablers in Table 11.17.
Anticipatory governance and agile decision-making can build resilience to cascading, compounding and aggregate impacts (high confidence) (Boston, 2016; Deloitte, 2016; Steffen et al., 2019; CoA, 2020e; CSIRO, 2020; Lawrence et al., 2020b; MfE, 2020c). There is uncertainty about whether standard integrated assessment models can estimate cascading and compounding impacts across systems and sectors, but systems methodologies and social network analysis hold promise (Stoerk et al., 2018; Cradock-Henry et al., 2020b). Interventions at the landscape, building and individual scales can reduce the negative health effects of current and future extreme heat, if integrated in well-communicated heat action plans with robust surveillance and monitoring (Jay et al., 2021).
In Australia, the National Disaster Risk Reduction Framework (CoA, 2018b), National Recovery and Resilience Agency and Australian Climate Service (CoA, 2021) can provide some support for adaptation across multiple sectors. New Zealand has effective partnerships across critical infrastructure through lifelines groups, but organisational silos and lack of stress testing of plans hamper coordinated decision-making during crises and for adaptation (Brown et al., 2017; Lawrence et al., 2020b). The New Zealand national risk assessment, national adaptation plan, forthcoming Climate Change Adaptation Act and monitoring of adaptation progress by the Climate Change Commission provide a framework for anticipating climate change risks (MfE, 2020a).
11.5.2 Implications for National Economies
The implications of climate change for national economies are significant (high confidence). The costs associated with lost productivity, disaster relief expenditure and unfunded contingent liabilities represent a major risk to financial system stability (MfE, 2020a). Costs include significant and often long-term social impacts, temporary dislocation, business disruption and impacts on employment, education, community networks, health and well-being (Deloitte, 2017a). Climate change disrupts international patterns of agricultural production and trade in ways that may be negative but that also may lead to new opportunities for agriculture (Mosnier et al., 2014; Nelson et al., 2014; Lee et al., 2018). Net exports may increase following global climate shocks (Lee et al., 2018), but the longer-term effects on GDP are likely to be negative (Dellink et al., 2019).
11.5.2.1 Observed Impacts
In Australia, during 2007–2016, total economic costs from natural disasters averaged AUD$18.2 billion per year (Deloitte, 2017a). Individual weather-related disaster costs across multiple sectors have exceeded AUD$4 billion, such as the 2009 fires in Victoria (Parliament of Victoria, 2010), the 2010–2011 floods in south-east Queensland (Deloitte, 2017b), the 2019 floods in northern Queensland (Deloitte, 2019) and the 2019–2020 fires in southern and eastern Australia (Box 11.1).
In New Zealand, the annual cost of rural fire to the economy has been estimated at NZD$67 million, with indirect ‘costs’ potentially two to three times the direct costs (Scion, 2018). Insured losses from weather-related disasters cost almost NZD$1 billion during 2015–2021 (ICNZ, 2021). Floods cost the New Zealand economy at least NZD$120 million for privately insured damages between 2007 and 2017 (D. Frame et al., 2018). The 2007/2008 drought cost NZD$3.2 billion and the 2012/13 drought cost NZD$1.6 billion, of which about 20% could be attributed to anthropogenic climate change (Frame et al., 2020) (11.3.11).
The intangible costs of climate impacts, including death and injury, impacts on health and well-being, education and employment, community connectedness and the loss of ancestral lands, cultural sites and ecosystems (Barnett et al., 2016; Warner et al., 2019), affect multiple sectors and systems and exacerbate existing vulnerabilities. While often incommensurable, intangible costs may be far higher than the tangible costs. For example, following the Victorian fires in 2009, the tangible costs were AUD$3.1 billion while the intangible costs were AUD$3.4 billion; following the Queensland floods in 2010/2011, the tangible costs were AUD$6.7 billion while the intangible costs were AUD$7.4 billion (Deloitte, 2016).
11.5.2.2 Projected Impacts
The economic long-run impact increases with higher levels of warming (high confidence), but there is a wide range in projections. Conservative estimates for the long-run impacts of a 1°C, 2°C or 3°C global warming (relative to 1986–2005) on Australian GDP are −0.3, −0.6 and −1.1%/year, respectively, while for New Zealand the estimates are −0.1, −0.4 and −0.8%/year respectively (Kompas et al., 2018). More detailed modelling indicates a loss in Australia’s GDP of 6% by 2070 for 3°C global warming, while a 2.6% GDP rise by 2070 is possible for 1.5°C global warming (Deloitte, 2020). The potential for much more severe effects on GDP is shown in recent estimates, which attempt to account for the increased severity of uncertain effects (e.g., up to 18.5% reduction in Australia’s GDP by mid-century) (Swiss Re, 2021).
In Australia, the total annual cost of damage due to floods, coastal inundation, forest fires, subsidence and wind (excluding cyclones) is estimated to increase 55% between 2020 and 2100 for RCP8.5 (Mallon et al., 2019). National damage costs and impacts on asset values could be significant (Table 11.13). The macroeconomic shocks induced from climate change, including reduced agricultural yields, damage to property and infrastructure and commodity price increases, could lead to significant market corrections and potential financial instability (Steffen et al., 2019). Under a ‘slow decline’ scenario by 2060 where Australia fails to adequately address climate change and sustainability challenges, GDP is projected to grow at 0.7% less per year and real wages would be 50% lower than under an ‘outlook scenario’ where Australia meets climate change and sustainability challenges (CSIRO, 2019).
In New Zealand, the value of buildings exposed to coastal inundation could increase by NZD$2.55 billion for every 0.1-m increment in sea level, that is, NZD$25.5 billion for a 1.0-m sea level rise (SLR) (Paulik et al., 2020). Greater understanding is required of the distributional impacts, the rate of change of costs over time and the economic implications of delayed action (Warner et al., 2020).
11.5.2.3 Adaptation
Investments in mitigation and adaptation can help reduce or prevent economic losses now and in the coming decades (IPCC, 2018; Steffen et al., 2019); however, the costs and benefits of mitigation and adaptation are not well understood in the region (high confidence) (CSIRO, 2019; MfE, 2020a).
In New Zealand, the emphasis has been on rebuilding after climate disasters, rather than anticipatory adaptation (Boston and Lawrence, 2018). Australia is similarly focused on disaster response and recovery, even though investment in disaster resilience can provide a cost:benefit ratio of 1:2 to 1:11 through reduced post-disaster recovery and reconstruction (GCA, 2019). Recent Australian and state government spending on direct recovery from disasters was around AUD$2.75 billion per year, compared to funding for natural disaster resilience of approximately AUD$0.1 billion per year (Deloitte, 2017b). The Australian government is supporting most of the 80 recommendations from the Royal Commission into National Natural Disaster Arrangements, including establishing a disaster advisory body and a resilience and recovery agency (CoA, 2020e; CoA, 2020b). Australia and New Zealand provide humanitarian and disaster assistance across the Pacific, which is increasingly focused on climate adaptation and the SDGs (Brolan et al., 2019) as cyclones and floods become amplified by climate change (Fletcher et al., 2013) (Table 11.3). Climate change may increase current migration flows to and impacts on diaspora in Australia and New Zealand from near-neighbour island nations as they become increasingly stressed by rising seas, higher temperatures, more droughts and stronger storms (Nalau and Handmer, 2018).
Delaying adaptation to climate risks may result in higher overall costs in future when adaptation is more urgent and impacts more extreme (medium confidence) (Boston and Lawrence, 2018; IPCC, 2018). Estimates of the magnitude of adaptation costs and benefits in the region are localised and sectoral (e.g., (Thamo et al., 2017) or regionally aggregated (Joshi et al., 2016). Adaptation costs are expected to increase markedly for higher RCPs, for example, a tripling of expected costs between RCP2.6 and RCP8.5 for sea level rise (SLR) protection in Australia (Ware et al., 2020). Existing governance arrangements for funding adaptation are inadequate for the scope and scale of climate change impacts anticipated; dedicated funding mechanisms that can be sustained over generations can enable more timely adaptation (Boston and Lawrence, 2018).
11.6 Key Risks and Benefits
Nine key risks have been identified (Table 11.14) based on four criteria: magnitude, likelihood, timing and adaptive capacity (Chapter 16). Most of the key risks are similar to those in the IPCC AR5 Australasia chapter (Reisinger et al., 2014), but the emphasis here is on specific systems affected by multiple hazards rather than specific hazards affecting multiple systems. The selection of key risks reflects what has been observed, projected and documented, noting that there are gaps in knowledge, and a lack of knowledge does not imply a lack of risk (11.7.3.3). Key risks are grouped into four categories:
Ecosystems at critical thresholds where recent climate change has caused significant damage and further climate change may cause irreversible damage, with limited scope for adaptation
- 1. Loss and degradation of coral reefs in Australia and associated biodiversity and ecosystem service values due to ocean warming and marine heatwaves (11.3.2.1, 11.3.2.2, Box 11.2).
- 2. Loss of alpine biodiversity in Australia due to less snow (11.3.1.1, 11.3.1.2).
Key risks that have potential to be severe but can be reduced substantially by rapid, large-scale and effective mitigation and adaptation
- 3. Transition or collapse of alpine ash, snow gum woodland, pencil pine and northern jarrah forests in southern Australia due to hotter and drier conditions with more fires (11.3.1.1, 11.3.1.2)
- 4. Loss of kelp forests in southern Australia and southeast New Zealand due to ocean warming, marine heatwaves and overgrazing by climate-driven range extensions of herbivore fish and urchins (11.3.2.1, 11.3.2.2).
- 5. Loss of natural and human systems in low-lying coastal areas due to sea level rise (SLR) (11.3.5, Box 11.6).
- 6. Disruption and decline in agricultural production and increased stress in rural communities in southwestern, southern and eastern mainland Australia due to hotter and drier conditions (11.3.4, 11.3.5, Box 11.3).
- 7. Increase in heat-related mortality and morbidity for people and wildlife in Australia due to heatwaves (11.3.5.1, 11.3.5.2, 11.3.6.1, 11.3.6.2).
Key cross-sectoral and system-wide risk
- 8. Cascading, compounding and aggregate impacts on cities, settlements, infrastructure, supply chains and services due to wildfires, floods, droughts, heatwaves, storms and sea level rise (SLR) (11.5.1.1, 11.5.1.2, Box 11.1, Box 11.4, Box 11.6).
Key implementation risk
- 9. Inability of institutions and governance systems to manage climate risks (11.5; 11.7.1, 11.7.2, 11.7.3).
At higher levels of global warming, adaptation costs increase, options become limited and risks grow. The ‘burning embers’ diagram in Figure 11.6 has four IPCC risk categories: undetectable, moderate, high and very high, with transition points defined by different global warming ranges. The embers are indicative, based on an assessment of available literature and expert judgement (Supplementary Material SM 11.2). Outcomes for low and moderate adaptation have been compared, with the latter including both incremental and transformative options. Illustrative examples of adaptation pathways are shown in Figure 11.7 for low-lying coastal areas and Figure 11.8 for heat-related mortality. These figures highlight thresholds at which adaptation options become ineffective and possible combinations of strategies and options implemented at different times to manage emerging risks and changing risk profiles.
Caveats: (a) key risks are assessed at regional scales, so they do not include other risks for finer scales or specific groups; (b) non-climatic vulnerabilities are held constant for simplicity; (c) the assessment of risk ratings at different levels of global warming is limited by available literature; (d) risks increase with global warming, despite the lack of an IPCC risk rating beyond very high; and (e) the feasibility and effectiveness of adaptations options were not assessed due to limited literature (11.7.3.3).

Figure 11.7 | Illustrative adaptation pathway for risk to natural and human systems in low-lying coastal areas due to sea level rise.

Figure 11.8 | Illustrative adaptation pathway for risk of heat-related mortality and morbidity for people and wildlife in Australia due to heatwaves.
The New Zealand National Climate Change Risk Assessment (MfE, 2020a) identified the priority risks from climate change for New Zealand based on a literature review and expert elicitation. The top two risks in each of five domains are as follows:
- Natural environment
- risks to coastal ecosystems due to ongoing sea level rise (SLR) and extreme weather events
- risks to indigenous ecosystems and species from invasive species
- Human environment
- risks to social cohesion and community well-being from displacement of people
- risks of exacerbating existing inequities and creating new and additional inequities from distribution impacts
- Economy
- risks to governments from economic costs associated with lost productivity, disaster relief expenditure and unfunded contingent liabilities
- risks to the financial system from instability
- Built environment
- risk to potable water supplies due to changes in rainfall, temperature, drought, extreme weather events and ongoing sea level rise (SLR)
- risks to buildings due to extreme weather events, drought, increased fire weather and ongoing sea level rise (SLR)
- Governance
- risk of maladaptation due to practices, processes and tools that do not account for uncertainty and change over long time frames
- risk that climate change impacts across all domains will be exacerbated, because current institutional arrangements are not fit for adaptation
Not all of these risks feature as key risks for the wider Australasia region; nonetheless, they are reflected across Chapter 11 and remain priorities for New Zealand to address through the National Adaptation Plan, its implementation and monitoring.
Short-term benefits from climate change may include reduced winter mortality, reduced energy demand for winter heating, increased agriculture productivity and forest growth in south and west New Zealand and increased forest and pasture growth in southern Australia, except where rainfall and soil nutrients are limiting (11.3.4, 11.3.6, 11.3.10) (medium confidence).
Table 11.14 | Key risks from climate change based on assessment of the literature and expert judgement (Supplementary Material SM 11.2). Assessment criteria are magnitude, timing, likelihood and adaptive capacity. Risk drivers are hazards, exposure and vulnerability. Adaptation options describe ways in which risks can be reduced. Confidence ratings are based on the amount of evidence and agreement between lines of evidence.
Key risk (confidence rating) (Chapter reference) | Consequences influenced by hazards, exposure, vulnerability and adaptation options |
1. Loss and degradation of tropical shallow coral reefs and associated biodiversity and ecosystem service values in Australia due to ocean warming and marine heatwaves (very high confidence) (11.3.2, Box 11.2) | Consequences: Widespread destruction of coral reef ecosystems and dependent socio-ecological systems. Three mass bleaching events from 2016 to 2020 have already caused significant loss of corals in shallow-water habitats across the GBR. Globally, bleaching is projected to occur twice each decade from 2035 and annually after 2044 under RCP 8.5 and annually after 2051 under RCP4.5. A 3°C global warming could cause over six times the 2016 level of thermal stress. Hazards: Increase in background warming and marine heatwave events degrade reef-building corals by triggering coral bleaching events at a frequency greater than the recovery time. Fish populations also decline during and following heatwave events. Exposure: Increasing geographic area affected by rate and severity of ocean warming Vulnerability: Vulnerability to increases in sea temperature is already very high because of other stressors on the ecosystem, including sediment, pollutants and overfishing. Adaptation options: Minimising other stressors. Efforts on the GBR may slow the impacts of climate change in small sections or reduce short-term socioeconomic ramifications, but they will not prevent widespread bleaching. |
2. Loss of alpine biodiversity in Australia due to less snow (high confidence) (11.3.1, Table 11.2, Table 11.3, Table 11.4, Table 11.5) | Consequences: Loss of endemic and obligate alpine wildlife species and plant communities (feldmark and short alpine herb fields) as well as increased stress on snow-dependent plant and animal species. Hazards: Projected decline in annual maximum snow depth by 2050 is 30–70% (low emissions) and 45–90% (high emissions); projected increases in temperature and decreases in precipitation. Exposure: Alpine species face elevation squeeze due to lack of nival zone, and alpine environments have restricted geographic extent. Vulnerability: Narrow ecological niche of species including snow-related habitat requirements; encroachment from sub-Alpine woody shrubs; vulnerability generated by non-climatic stressors including weeds and feral animals, especially horses Adaptation options: Reducing pressure on alpine biodiversity from land uses that degrade vegetation and ecological condition, along with weed and pest management. |
3. Transition or collapse of alpine ash, snow gum woodland, pencil pine and northern jarrah forests in southern Australia due to hotter and drier conditions with more fires (high confidence) (11.2, 11.3.1, 11.3.2, Box 11.1) | Consequences: If regenerative capacities of the dominant (framework) canopy tree species are exceeded, a long-lasting or irreversible transition to a new ecosystem state is projected with loss of characteristic and framework species, including loss of some narrow-range endemics. Hazards: Hotter and drier conditions have increased extreme fire weather risk since 1950, especially in southern and eastern Australia. The number of severe fire weather days is projected to increase 5–35% (RCP2.6) and 10–70% (RCP8.5) by 2050 Exposure: Shift in landscape fire regimes to larger, more intense and frequent wildfires over extensive areas (~10 million hectares) of forests and woodlands from longer fire seasons and more hazardous fire conditions and increasing human-sourced ignitions from urbanisation and projected increase in frequency of lightning strikes Vulnerability: The resilience and adaptive capacity of the forests is being reduced by ongoing land clearing and degrading land management practices Adaptation options: Increased capacity to extinguish wildfires during extreme fire weather conditions; avoiding and reducing forest degradation from inappropriate forest management practices and land use. |
4. Loss of kelp forests in southern Australia and southeast New Zealand due to ocean warming, marine heatwaves and overgrazing by climate-driven range extensions of herbivore fish and urchins (high confidence) (11.3.2) | Consequences: Observed decline in giant kelp in Tasmania since 1990, with less than 10% remaining by 2011 due to ocean warming. Extensive loss of kelp, −140,187 hectares across Australia, loss of bull kelp in southern New Zealand, replaced by the introduced kelp following the 2017/2018 marine heatwave. Further loss of native kelp is projected with warming oceans. Hazards: Ocean warming and marine heatwave events Exposure: Coastal waters around Australia and New Zealand Vulnerability: Giant kelp are already federally listed in Australia as an endangered marine community type. In Australia, kelp forests are vulnerable to nutrient-poor East Australian Current waters pushing further south, warming waters and increased herbivory from range-extending species. Adaptation options: Minimising other stressors, local restoration and transplantation of heat-tolerant phenotypes. |
5. Loss of human and natural systems in low-lying coastal areas from ongoing SLR (high confidence) (11.2, 11.3.2, 11.3.5, 11.3.10, 11.4, Table 11.3; Box 11.6) | Consequences: Nuisance and extreme coastal flooding are already occurring due to SLR. For 0.2- to 0.3-m SLR, coastal flooding is projected to become more frequent, for example, the current 1-in-100-year flood would occur every year in Wellington and Christchurch. For 0.5-m SLR, the value of buildings in New Zealand exposed to coastal inundation could increase by NZD$12.75 billion and the current 1-in-100-year flood in Australia could occur several times a year. For 1.0-m SLR, the value of exposed assets in New Zealand would be NZD$25.5 billion. For 1.1-m SLR, the value of exposed assets in Australia would be AUD$164–226 billion. This would be associated with the displacement of people, disruption and reduced social cohesion, degraded ecosystems, loss of cultural heritage and livelihoods and loss of traditional lands and sacred sites. Hazards: Rising sea level (0.2–0.3 m by 2050, 0.4–0.7 m by 2090), storm surges, rising groundwater tables. Exposure: Population growth, new and infill urbanisation, tourism developments in low-lying coastal areas. Buildings, roads, railways, electricity and water infrastructure. Torres Strait Island and remote Māori communities are particularly exposed and sensitive. Vulnerability: Ineffective planning regulations, reduced availability and increased cost of insurance and costs to governments as insurers of last resort. Inadequate investment in avoidance and preparedness exacerbating underlying social vulnerabilities. Financial and physical capacities to cope and adapt are uneven across populations, creating equity issues. Adaptation options: Risk reduction coordinated across all levels of government with communities. Statutory planning frameworks, decision tools and funding mechanisms that can address the changing risk. Planning and land use decisions, including managed retreat where it is inevitable. Improved capacity of emergency services, early-warning systems, improved planning and regulatory practice and building and infrastructure design standards. Options that anticipate risk and adjust as conditions change. |
6. Disruption and decline in agricultural production and increased stress in rural communities across south western, southern and eastern mainland Australia due to hotter and drier conditions. (high confidence) (11.2, 11.3.4, 11.3.6.3, 11.4.1, Table 11.11, Boxes 11.1, 11.3) | Consequences: Projected decline in crop, horticulture and dairy production, for example, decline in median wheat yields by 2050 of up to 30% in southwest Australia and up to 15% in southern Australia. Increased heat stress in livestock by 31–42 days per year by 2050. Reduced winter chilling for horticulture. Increased smoke impacts for viticulture. Flow-on effects for agricultural supply chains, farming families and rural communities across southwestern, southern and southeastern Australia, including the MDB. Hazards: Hotter and drier conditions with constraints on water resources and more frequent and severe droughts in southwestern, southern and eastern Australia. Exposure: Across southwestern, southern and eastern Australia, many production regions are exposed, including the MDB, which supports agriculture worth AUD$24 billion/year, 2.6 million people in diverse rural communities and important environmental assets containing 16 Ramsar Convention-listed wetlands. Vulnerability: Existing financial, social, health and environmental pressures on rural, regional and remote communities. Existing competition for water resources among communities, industries and environment and uncertainty about sharing of water under a drying climate. Adaptation options: Improved governance and collaboration to build rural resilience, including regional and basin-scale initiatives. Improved water policies and initiatives (e.g., MDB plan) and changes in management and technologies. Resilience-focused planning for rural settlements, land use, industry, infrastructure and value chains. Adoption of information, tools and methods to better manage uncertainty, variability and change. Incremental changes in farm management practices (e.g., stubble retention, weed control, water-use efficiency, sowing dates, cultivars). In some regions, major changes may be necessary, for example, diversification in agricultural enterprises, transition to different land uses (e.g., carbon sequestration, renewable energy production, biodiversity conservation) or migration to another area. Flows in waterways based on Indigenous knowledge to protect cultural assets. |
7. Increase in heat-related mortality and morbidity for people and wildlife in Australia (high confidence) (11.2, 11.3.1, 11.3.5, 11.3.6, 11.4) | Consequences: During 1987–2016, natural disasters caused 971 deaths and 4370 injuries, with more than 50% due to heatwaves. Annual increases are projected for excess deaths, additional hospitalisations and ambulance callouts. Heatwave-related excess deaths in Melbourne, Sydney and Brisbane are projected to increase by about 300/year (RCP2.6) to 600/year (RCP8.5) during 2031–2080 relative to 142/year during 1971–2020, assuming no adaptation. Significant heat-related mortality of wildlife species (flying foxes, freshwater fish) has been observed and is projected to increase. Hazards: Increased frequency, intensity and duration of extreme heat events Exposure: Pervasive but differentially affecting some wildlife species depending on their thermal tolerances and occupational groups (e.g., outdoor workers) and those living in high exposure areas (e.g., urban heat islands). Health risks multiply with other harmful exposures, for example, to wildfire smoke. Vulnerability: Lower adaptive capacity for young/old/sick people, those in low-quality housing and of lower socioeconomic status, and areas served by fragile utilities (power, water). Remote locations with extreme heat and inadequate cooling in housing infrastructure (such as remote indigenous communities). For wildlife, impacts of extreme heat events are being amplified by habitat loss and degradation. Adaptation options: Urban cooling interventions including irrigated green infrastructure and increased albedo, education to reduce heat stress, heatwave/fire early-warning systems, battery/generator systems for energy system security, building standards that improve insulation/cooling, accessible / well-resourced primary health care. For wildlife, removing human stressors, reducing pressures from ferals and weeds, and ensuring suitable habitat. |
8. Cascading, compounding and aggregate impacts on cities, settlements, infrastructure, supply chains and services due to extreme events (high confidence) (11.2, 11.3.4, 11.3.5, 11.3.6, 11.3.7, 11.3.8, 11.3.9, 11.3.10, 11.4, 11.5.1, Boxes 11.1, 11.4, 11.6) | Consequences: Widespread and pervasive damage and disruption to human activities generated by the interdependencies and interconnectedness of physical, social and natural systems. Examples include failure of transport, energy and communication infrastructure and services, heat stress, injuries and deaths, air pollution, stress on hospital services, damage to agriculture and tourism, insurance loss from heatwaves and fires; failure of transport, stormwater and flood-control infrastructure and services from floods and storms; water restrictions, reduced agricultural production, stress for rural communities, mental health issues, lack of potable water from droughts; damage to buildings, roads, railways, electricity and water infrastructure, loss of assets and lives, displacement of people, reduced social cohesion, degraded ecosystems from extreme SLR. Large aggregate costs due to lost productivity and major disaster relief expenditures, creating unfunded liabilities and supply chain disruption, e.g., 2019–2020 Australian fires cost AUD$8 billion. The long-run impact of a 1°C, 2°C or 3°C global warming (relative to 1986–2005) on Australian GDP is estimated at −0.3%/year, −0.6%/year and −1.1%/year respectively, while for New Zealand estimates are −0.1%/year, −0.4%/year and −0.8%/year respectively. Impacts on Māori tribal investments in forestry, agriculture, horticulture, fisheries and aquaculture. Hazards: Heatwaves, droughts, fires, floods, storms and SLR. This includes cascading and compound events such as heatwaves with fires, storms with floods or droughts followed by heavy rainfall and extreme sea levels. Exposure: Highly populated areas, rural and remote settlements, traditional lands and sacred sites. Greater urban density and population growth increases exposure in high-risk areas. Different exposure for different hazards, for example, heatwaves: urban and peri-urban areas; fire: peri-urban areas and settlements near forests; floods: people, property and infrastructure from pluvial floods in cities and settlements and fluvial floods on floodplains; storms: buildings and infrastructure in cities and settlements. Vulnerability: Existing social and economic challenges (e.g., those caused by COVID-19) and socioeconomic and cultural inequalities; competing resource and land use demands across sectors; inadequate planning, policy, governance, decision-making and disaster resilience capacity; and non-climatic stresses on ecosystems. Vulnerabilities generated by interdependencies and interconnectedness of physical, social and natural systems. Adaptation options: Flexible and timely adaptation strategies that prepare socioeconomic and natural systems for surprises and unexpected threats. Multi-sector coordinated actions that address widespread impacts, redress existing vulnerabilities and building adaptive capacity and systemic resilience. Improved coordination between and within levels of governments, communities and private sector. Greater use of dynamic decision frameworks and suitable economic and social assessment tools. Improved emergency services and early-warning systems; use of climate-resilient standards for buildings and infrastructure. Transformational adaptations (e.g., managed retreat) that can be planned in stages. |
9. Inability of institutions and governance systems to manage climate risks (high confidence) (11.2, 11.3.5, 11.3.6, 11.3.7, 11.3.8, 11.3.10, 11.4, 11.5.1, 11.7.2, Boxes 11.1–11.6) | Consequences: Climate hazards overwhelm the capacity of institutions, organisations, systems and leaders to provide necessary policies, services, resources, coordination and leadership. Failed adaptation at the institutional and governance levels has widespread, pervasive impacts on all areas of society. This includes a reliance on reactive, short-term decision-making that locks in existing exposures, leaves perverse incentives and interconnected and systemic impacts unaddressed and generates high costs and fiscal impacts. This worsens vulnerability and leads to maladaptation, inequities and injustices within and across generations, as well as actions that do not uphold the rights, interests, values and practices of Indigenous Peoples. Resultant failure to take adaptation action generates litigation risk. Hazards: Increasing frequency, duration, severity and complexity of extreme weather events, droughts and SLR Exposure: All sectors, communities, organisations and governments Vulnerability: Fragmented institutional and legal arrangements, under-resourcing of services, lack of dedicated adaptation funding instruments and resources to support communities and local government, uneven capability to manage uncertainty and conflicting values and competing policy and political interests. Adaptation options: Pre-emptive options that avoid and reduce risks. Redesign of policy and statutory frameworks and funding instruments for addressing changing risks and uncertainties that enable just and collaborative governance across scales and domains. Addressing existing vulnerabilities and capacity, capability and leadership deficits within and across all levels of government, all sectors, Indigenous Peoples and communities. Risk and vulnerability assessment methodologies and decision-making tools that build resilience and address changing risks and vulnerabilities. Co-designed adaptation approaches implemented with communities, including Māori tribal organisations and Australian Aboriginal and Torres Strait Island peoples. |
11.7 Enabling Adaptation Decision-Making
11.7.1 Observed Adaptation Decision-Making
The ambition, scope and progress on adaptation by governments have risen but are uneven, with a focus on high-level strategies at the national level, adaptation planning at sub-national levels and new enabling legislation (very high confidence) (Table 11.15a, Table 11.15b) (Lawrence et al., 2015; Macintosh et al., 2015; MfE, 2020a). The adaptation process comprises vulnerability and risk assessments, identification of options, planning, implementation, monitoring, evaluation and review. Large gaps remain, especially in effective implementation, monitoring and evaluation (Supplementary Material SM 11.1) (CCATWG, 2017; Warnken and Mosadeghi, 2018), and current adaptation is largely incremental and reactive (very high confidence) (Box 11.4, Box 11.6, Table 11.14).
Table 11.15a | Examples of Australian adaptation strategies, plans and initiatives by government agencies at national, sub-national and regional or local levels. These examples have not been assessed for their effectiveness (see Supplementary Material Table SM11.1a).
Jurisdiction | Strategies/Plans/Actions |
National Level | |
Australia | National Climate Resilience and Adaptation Strategy 2015 (CoA, 2015) National Disaster Risk Reduction Framework (2018) (CoA, 2018b) National Recovery and Resilience Agency and Australian Climate Service (CoA, 2021) |
Sub-national | |
Australian Capital Territory (ACT) | ACT Climate Change Strategy 2019–2025 (ACT Government, 2019) Canberra’s Living Infrastructure Plan: Cooling the City (ACT Government, 2020b); ACT Well-being Framework (ACT Government, 2020a) |
New South Wales | NSW Climate Change Policy Framework (NSW Government, 2016) |
Coastal Management Framework (OEH, 2018b) including Coastal Management Act 2016, State Environmental Planning Policy (Coastal Management) 2018, NSW Coastal Management Manual (OEH, 2018c; OEH, 2018a) | |
Northern Territory | Northern Territory Climate Change Response: Towards 2050 (DENR, 2020b) three-year action plan (DENR, 2020a) |
Queensland | Pathways to climate-resilient Queensland: Queensland Climate Adaptation Strategy 2017–2030 (DEHP, 2013) |
Sector adaptation plans: https://www.qld.gov.au/environment/climate/climate-change/adapting/sectors-systems | |
State heatwave risk assessment, 2019 (QFES, 2019) | |
Planning Act 2016 (Queensland Government, 2020) and the Coastal Protection and Management Act 1995 (Queensland Government, 1995), plus supporting initiatives: Coastal Management Plan (DEHP, 2013) and Shoreline Erosion Management Plans (DES, 2018) Queensland’s QCoast2100 program | |
South Australia | Directions for a Climate Smart South Australia (SA Government, 2019a) |
Tasmania | Climate Action 21: Tasmania’s Climate Change Action Plan 2017–2021 (State of Tasmania, 2017a) |
Tasmania’s 2016 State Natural Disaster Risk Assessment (White et al., 2016a) | |
Tasmanian Planning Scheme—State Planning Provisions 2017, Coastal Inundation Hazard Code and a Coastal Erosion Hazard Code (Government of Tasmania, 2017). | |
Victoria | In accordance with the Climate Change Act 2017, Victoria has a Climate Change Adaptation Plan 2017–2020 (Victoria State Government DELWP, 2016) including a Monitoring, Evaluation, Reporting and Improvement (MERI) framework for Climate Change Adaptation in Victoria (DELWP, 2018), Victorian Climate Projections (2019) and multiple resources for regions and local government (Victoria DELWP 2020). |
Heatwaves in Victoria. A 2018 vulnerability assessment of the state to heatwaves using a Damage and Loss Assessment methodology (Natural Capital Economics, 2018) | |
Western Australia | Western Australian Government Adapting to our changing climate 2012 (WA Government, 2016) |
State Planning Policy 2.6 – Coastal Planning (SPP2.6) | |
Regional and local (examples only) | |
104 have declared climate emergencies to leverage climate action as of September 2021 covering 36.6% of the Australian population (Climate Emergency Declaration, 2022) | |
Tasmania | 2017: Tasmanian Planning Scheme – State Planning Provisions. State of Tasmania, 514. |
South Australia | Regional integrated vulnerability assessments (IVAs) and adaptation plans (SA Government, 2019a) |
NSW | Enabling Regional Adaptation (Jacobs et al., 2016) |
Victoria | Every region and catchment management authority in Victoria has an adaptation plan, as does virtually every local government. There are also three alliances of multiple local governments working on climate change and new initiatives such as the Climate Change Exchange: https://www.parliament.vic.gov.au/967-epc-la/inquiry-into-tackling-climate-change-in-victorian-communities |
NSW | Coastal Zone Management Plan for Bilgola Beach (Bilgola) and Basin Beach (Mona Vale) (Haskoning Australia, 2016) |
Queensland | Torres Strait Climate Change Strategy (TSRA, 2014), Torres Strait Regional Adaptation and Resilience Plan 2016–2021 (TSRA, 2016) |
Climate Risk Management Framework for Queensland Local Government (Erhart et al., 2020) | |
Douglas Shire Coast Strategic Plan 2019 (Douglas Shire Council, 2019) | |
Northern Territory | Climate Change Action Plan (2011–2020) (Darwin City Council, 2011) |
Table 11.15b | Examples of New Zealand’s adaptation strategies, plans and initiatives by government agencies at national, sub-national and regional or local levels. NB: These examples have not been assessed for their effectiveness (see Supplementary Material Table SM11.1b)
Jurisdiction | Strategies/Plans/Actions |
New Zealand central Government | The New Zealand Government’s adaptation policy framework is based on the following legislation: Resource Management Act 1991, Local Government Act 2002, National Disaster Resilience Strategy 2019 (CDEM, 2019) and the Climate Change Response (Zero Carbon Amendment) Act 2002 (CCRA 2002) Adaptation preparedness report 2020/2021 baseline is the reporting organisation responses from the first information request under the CCRA 2002 (MfE, 2021) to assist the monitoring of progress and effectiveness of adaptation by the Climate Change Commission The Department of Conservation’s Climate Change Adaptation Action plan sets out a long-term strategy for climate research, monitoring and action; DOC climate adaptation plan |
Local Government | In July 2017, a group of 66 local government mayors and council chairs (of 78 in total) endorsed a 2015 local government declaration calling for urgent responsive leadership and a holistic approach on climate change, with the government needing to play a vital enabling leadership role (LGNZ, 2017; Schneider et al., 2017). Seventeen councils have declared climate emergencies to leverage climate action plans as of September 2021, covering 75.3% of the New Zealand population. The MfE adaptation preparedness report states that 18% of councils (11 of 61 surveyed in 2021) have some sort of plan or strategy to increase resilience to climate impacts (MfE, 2021). Out of New Zealand’s 15 regional and unitary councils, 2 have climate adaptation strategies in place. One council has conducted a climate risk assessment, and four have one in development. Five councils have climate action plans, and three are in development. |
Regional Councils ( examples only) | |
Bay of Plenty Regional Council | Climate Action Plan July 2019 (non-statutory) Climate Action Plan |
Waikato Regional Council | Long-Term Plan 2018–2028 (LTP) |
Greater Wellington Regional Council | GWRC’s Climate Change Strategy (October 2015) Climate change strategy implementation Hutt River Flood Risk Management Plan |
Unitary Authorities (examples only) | |
Auckland Council | Auckland Unitary Plan AUP RPS B10 Table B11.9 (bottom of doc) E36. Natural hazards and flooding |
Marlborough District Council | Marlborough Environment Plan first to integrate DAPP into plan policies. |
Gisborne District Council | Tairāwhiti Resource Management Plan (District Plan) March 2020 |
District Council (example only) | |
Waimakariri District Council | Infrastructure Strategy in the Long Term Plan 2017. Long-Term-Plan-Further-Information-Document-WEB.pdf Page 113/31 |
Australia has a National Climate Resilience and Adaptation Strategy, a National Recovery and Resilience Agency (11.5.2.3), and the First National Action Plan to implement the National Disaster Risk Reduction Framework which acknowledges climate change as a disaster risk driver (Home Affairs, 2020). States and territories have climate change adaptation strategies with plans to address them (Table 11.15a), with some adaptation implementation at the state level and, increasingly, at the local government level (Jacobs et al., 2016; Warnken and Mosadeghi, 2018) (Table 11.15a). In coastal zones, however, few local government planning instruments are being applied (Warnken and Mosadeghi, 2018; Harvey, 2019; Robb et al., 2019; Elrick-Barr and Smith, 2021). Some businesses and industry sectors are recognising climate-related risks and adaptation planning (11.3.4; 11.3.7; 11.3.10) (Harris et al., 2016; Hennessy et al., 2016; CBA, 2019). There is an opportunity for Australia to undertake a national risk assessment and to develop a national climate adaptation implementation plan that is aligned with Paris Agreement expectations of a national-level system for adaptation planning, monitoring and reporting (Morgan et al., 2019).
New Zealand’s Climate Change Response Act 2019 creates a legal mandate for national climate change risk assessments (first one completed) (MfE, 2020a) and national adaptation plans (first in preparation), as well as a Climate Change Commission to monitor and report on adaptation implementation. Preparation of natural and built environment, strategic planning and climate change adaptation acts is under way, including provision for funding and managed retreat (MfE, 2020c). National coastal guidance is available for adaptation planning to address changing climate risks (MfE, 2017a) (Table 11.15b). Meanwhile, several local authorities have developed integrated climate change strategies and plans and revised policies and rules to enable adaptation (Table 11.15b). Different adaptation approaches continue to create confusion and inertia while development pressures continue (Schneider et al., 2017). Opportunities for integrated adaptation and mitigation planning in regional policies and plans have arisen through the Resource Management Amendment Act 2020 (Dickie, 2020), the National Policy Statement on Freshwater Management (MfE, 2020b) and the revised national coastal guidance (MfE, 2017a), but rely on funding instruments to be in place and statutes are aligned for their effectiveness (very high confidence) (Boston and Lawrence, 2018; CCATWG, 2018).
There is growing awareness of the need for more proactive adaptation planning at multiple scales and across sectors, and a better understanding of future risks and limits to adaptation is emerging (medium confidence) (Evans et al., 2014; Archie et al., 2018; Christie et al., 2020; MfE, 2020a). Disaster risk reduction is being positioned as part of climate change adaptation (Forino et al., 2017; CDEM, 2019; Forino et al., 2019; CoA, 2020e; CSIRO, 2020). Public and private climate adaptation services are informing climate risk assessments, but they are characterised by fragmentation, duplication, inconsistencies, poor governance and inadequate funding; addressing these gaps presents adaptation opportunities (CCATWG, 2018; Webb et al., 2019; NESP ESCC, 2021) (Table 11.15a, Table 11.15b). Large infrastructure asset planning is starting to factor in climate risks, but implementation is uneven (Gibbs, 2020). Local governments in Australia are increasingly implementing adaptation plans, but few monitor or evaluate actual outcomes or know how to (Scott and Moloney, 2021).
Observed and projected rates of sea level rise (SLR) (Box 11.6) and increased flood frequency (11.3.3) are challenging established uses of modelling, risk assessment and cost-benefit analysis, where climate change damage functions cannot be projected or are unknown (deep uncertainty) or impacts on communities are ambiguous (Infometrics and PSConsulting, 2015; Lawrence et al., 2019a; MfE, 2020a). New tools are available in the region (Table 11.17), but uptake cannot be assumed (high confidence) (Lawrence and Haasnoot, 2017; Palutikof et al., 2019c).
Resilience and adaptation approaches are beginning to converge (White and O’Hare, 2014; Aldunce et al., 2015) (Supplementary Material SM 11.1) but widespread ‘bounce-back’ resilience-driven responses that lock in risk by discounting ongoing and changing climate risk (Leitch and Bohensky, 2014; O’Hare et al., 2016; Wenger, 2017; Torabi et al., 2018) can create maladaptation and impede long-term adaptation goals (high confidence) (Glavovic and Smith, 2014; Dudney et al., 2018).
Local government engagement with communities on adaptation is starting to motivate a change towards more collaborative engagement practices (Archie et al., 2018; Bendall, 2018; MfE, 2019; Schneider et al., 2020). Nature-based adaptations (Colloff et al., 2016; Lavorel et al., 2019; Della Bosca and Gillespie, 2020) and ‘green infrastructure’ (medium confidence) (Lin et al., 2016; Alexandra and Norman, 2020) are increasingly being adopted (Rogers et al., 2020a).
Some businesses have initiated active adaptation (Aldum et al., 2014; Linnenluecke et al., 2015; Bremer and Linnenluecke, 2017; CCATWG, 2017; MfE, 2018), with most focused on identifying climate risks (Aldum et al., 2014; Gasbarro et al., 2016; Cradock-Henry, 2017). Businesses are more likely to engage in anticipatory adaptation when the frequency of climate events is known (McKnight and Linnenluecke, 2019). Effective cooperation and a positive innovation culture can contribute to the collaborative development of climate change adaptation pathways (medium confidence) (Bardsley et al., 2018).
Some areas in northern Australia and New Zealand, especially those with higher proportions of Indigenous populations, face severe housing, health, education, employment and services deficits that exacerbate the impacts of climate change (Kotey, 2015) (11.3.5; 11.4; 11.6).
Where adaptation relies upon an ageing population and an overstretched volunteer base, vulnerability to climate change impacts is being exacerbated (Astill and Miller, 2018; Davies et al., 2018). Adaptation options that succeed within remote Indigenous communities are founded on connections to traditional lands, alignment with cultural values and contribute to social, cultural and economic goals (Nursey-Bray and Palmer, 2018). Knowledge co-production for Indigenous adaptation pathways can enable transformative change from colonial legacies (Hill et al., 2020). Learning and experimentation across governance boundaries and between agencies and local communities enable adaptation to be better aligned with changing climate risks and community (high confidenc e) (Fünfgeld, 2015; Howes et al., 2015; Bardsley and Wiseman, 2016; Lawrence et al., 2019b).
There is increasing focus on improving adaptive capacity for transitional and transformational responses, but reactive responses dominate (very high confidence) (Smith et al., 2015; Schlosberg et al., 2017; Boston and Lawrence, 2018). While extreme events can provide opportunities for positive transitions within communities (Cradock-Henry et al., 2018b) (e.g., Queensland Reconstruction Authority Building Back Better scheme), often rebuilding occurs in at-risk places to aid quick recovery (Lawrence and Saunders, 2017). Community-based adaptation innovations (Bendall, 2018; Kench et al., 2018; Forino et al., 2019) include relationship building; use of new decision tools, pathways planning with communities, visualisation and serious games (Lawrence and Haasnoot, 2017; Schlosberg et al., 2017; Flood et al., 2018; Reiter et al., 2018; Serrao-Neumann and Choy, 2018); communities of practice; and climate information sharing (Astill et al., 2019; Stone et al., 2019).
11.7.2 Barriers and Limits to Adaptation
Major gaps in the adaptation process remain across all sectors and at all levels of decision-making (very high confidence) (11.3; Table 11.115a, Table 15b). Efforts to build, resource and deploy adaptive capacity are slow compared to escalating impacts and risks (Stephenson et al., 2018; CoA, 2020e). Barriers to effective adaptation include governance inertia at all levels, hindering the development of careful and comprehensive adaptation plans and their implementation (Boston and Lawrence, 2018; MfE and Hawke’s Bay Regional Council, 2020; White and Lawrence, 2020). Lack of clarity about mandate, roles and leadership and inadequate funding for adaptation by national and state governments and sectors, are slowing adaptation (Lukasiewicz et al., 2017; Waters and Barnett, 2018; LGNZ, 2019; MfE, 2020c) (11.3; 11.7.1). Established planning tools and measures were designed for static risk profiles, and practitioners are slow to take up tools better suited to changing climate risks (CoA, 2020e; Schneider et al., 2020) (11.5; Box 11.5). The communication of relevant climate change information remains ad hoc (Stevens and O’Connor, 2015; CCATWG, 2017; Palutikof et al., 2019c; Salmon, 2019). In Australia, the lack of national guidance or adaptation laws creates barriers to adaptation, reflected in uneven coastal adaptation based on a wait-and-see approach (Dedekorkut-Howes et al., 2020).
There are many barriers to starting adaptation pre-emptively (very high confidence) (CCATWG, 2018) (Table 11.16). Recent institutional changes in New Zealand indicate that this is changing (11.7.1; Table 15b). Many groups are yet to engage deeply with climate change adaptation (Kench et al., 2018), and some adaptation processes are being blocked (Pearce et al., 2018; Garmestani et al., 2019; Alexandra, 2020) or exploited to deflect from mitigation responsibilities (Smith and Lawrence, 2018; Nyberg and Wright, 2020). Some actors are resistant to using climate change information (Tangney and Howes, 2016; Alexandra, 2020). Fear of litigation and demands for compensation can contribute to this reluctance (Tombs et al., 2018; O’Donnell et al., 2019)and is increasingly inviting litigation and other costs (Hodder, 2019; Bell-James and Collins, 2020 ). Jurisprudence is evolving from cases on projects to cases about decision-making accountability in the public and private sectors (Bell-James and Collins, 2020 ; Peel et al., 2020) and rights-based cases (Peel and Osofsky, 2018). National and sub-national governments may become exposed to unsustainable fiscal risk as insurers of last resort, which can lead to inequitable outcomes for vulnerable groups and future generations (11.3.8), path dependencies and negative effects on physical, social, economic and cultural systems (Hamin and Gurran, 2015; Boston and Lawrence, 2018). Cross-scale governance tensions can prevent local adaptation initiatives from performing as intended (Tschakert et al., 2016; Piggott-McKellar et al., 2019). Adaptation that draws on Māori cultural understanding in partnership with local government in New Zealand can lead to more effective and equitable adaptation outcomes (MfE, 2020a).
Table 11.16 | Examples of barriers to adaptation action in the region
Barrier | Source |
Governments | |
Lack of consistent policy direction from higher levels and frequent policy reversals | |
Conflicts between community-based initiatives, city councils and business interests | |
Different framings of adaptation between local governments (risk) and community groups (vulnerability, transformation) | (Smith et al., 2015; Schlosberg et al., 2017; McClure and Baker, 2018) |
Competing planning objectives | |
Divergent perceptions of risk concepts | (Button and Harvey, 2015; Mills et al., 2016b; Tonmoy et al., 2018) |
Focus on climate variability rather than climate change | |
Low prioritisation of climate change adaptation among competing institutional objectives | (Glavovic and Smith, 2014; Lawrence et al., 2015; McClure and Baker, 2018) |
Constraints in using new knowledge | |
Lack of institutional and professional capabilities and capacity (e.g., to monitor and evaluate adaptation outcomes) | |
Lack of understanding of Indigenous knowledge and practices | |
Lack of authority and political legitimacy | (Hayward, 2008; Boston and Lawrence, 2018; CCATWG, 2018; Parsons et al., 2019) |
Fear of litigation | (Tombs et al., 2018; Iorns Magallanes and Watts, 2019; O’Donnell et al., 2019) |
Upfront costs of adaptation relative to competing demands on government expenditure | |
Private sector | |
Governance and policy uncertainty, lack of cross-sector coordination, lack of capital investment in climate solutions | |
Inconsistent hazard information and incomplete understanding of adaptation | |
Mismatch in duration of insurance cover (annual) lending (decades) and infrastructure and housing investment (50–100 years) | |
Perceived unaffordability of adaptation, lack of client demand and awareness of climate change risks and limited and inconsistent climate risk regulation in the construction industry | |
Translating information into organisations to address disinterest among clients in the property industry | |
Erosion of adaptive capacity and challenges of transformational adaptation in agriculture and rural communities | |
Communities | |
Nature of government engagement with communities | (Public Participation, 2014; MfE, 2017a; Archie et al., 2018; OECD, 2019b) |
Lack of clarity regarding roles and responsibilities | (Gorddard et al., 2016; Elrick-Barr et al., 2017; Goode et al., 2017; Waters and Barnett, 2018) |
Lack of resourcing of adaptation | (Singh-Peterson et al., 2015; Lukasiewicz et al., 2017; Brookfield and Fitzgerald, 2018) |
Lack of deep engagement with climate change | |
Diverging perceptions, values and goals within communities | (Austin et al., 2018; Fitzgerald et al., 2019; Marshall et al., 2019) |
Inequities within and between communities | |
Lack of sustained engagement, learning and trust between community, scientists and policy makers |
Communities’ vulnerabilities are dynamic and uneven (high confidence). In Australia, 435,000 people in remote areas face particular challenges (CoA, 2020e). Some groups do not have the time, resources or opportunity to participate in formal adaptation planning as it is currently organised (Victorian Council of Social Service, 2016; Tschakert et al., 2017; Mathew et al., 2018). Linguistically diverse groups can be disadvantaged by social isolation, language barriers and others’ ignorance of the knowledge and skills they can bring to adaptation (Shepherd and van Vuuren, 2014; Dun et al., 2018) (11.1.2). Social, cultural and economic vulnerabilities, biases and injustices, such as those faced by many women (Eriksen, 2014; Parkinson, 2019) and non-heterosexual groups and gender minorities (Dominey-Howes et al., 2016; Gorman-Murray et al., 2017), can deepen impacts and impede adaptation; (Fitzgerald et al., 2019; Marshall et al., 2019) (Cross-Chapter Box GENDER in Chapter 18).
Potential biophysical limits to adaptation for non-human species and ecosystems where impacts are projected to be irreversible, with limited scope for adaptation, are signalled in key risks 1–4 (11.6). In some human systems, fundamental limits to adaptation include thermal thresholds and safe freshwater (Alston et al., 2018) (Table 11.14) and the inability of some low-lying coastal communities to adapt in place (Box 11.6) (very high confidence). Some individuals and communities are already reaching their psycho-social adaptation limits (Evans et al., 2016). A lack of robust and timely adaptation means key risks will increasingly manifest as impacts, and numerous systems, communities and institutions are projected to reach limits (Table 11.14, Figure 11.6), compounding current adaptation deficits and undermining society’s capacity to adapt to future impacts (very high confidence).
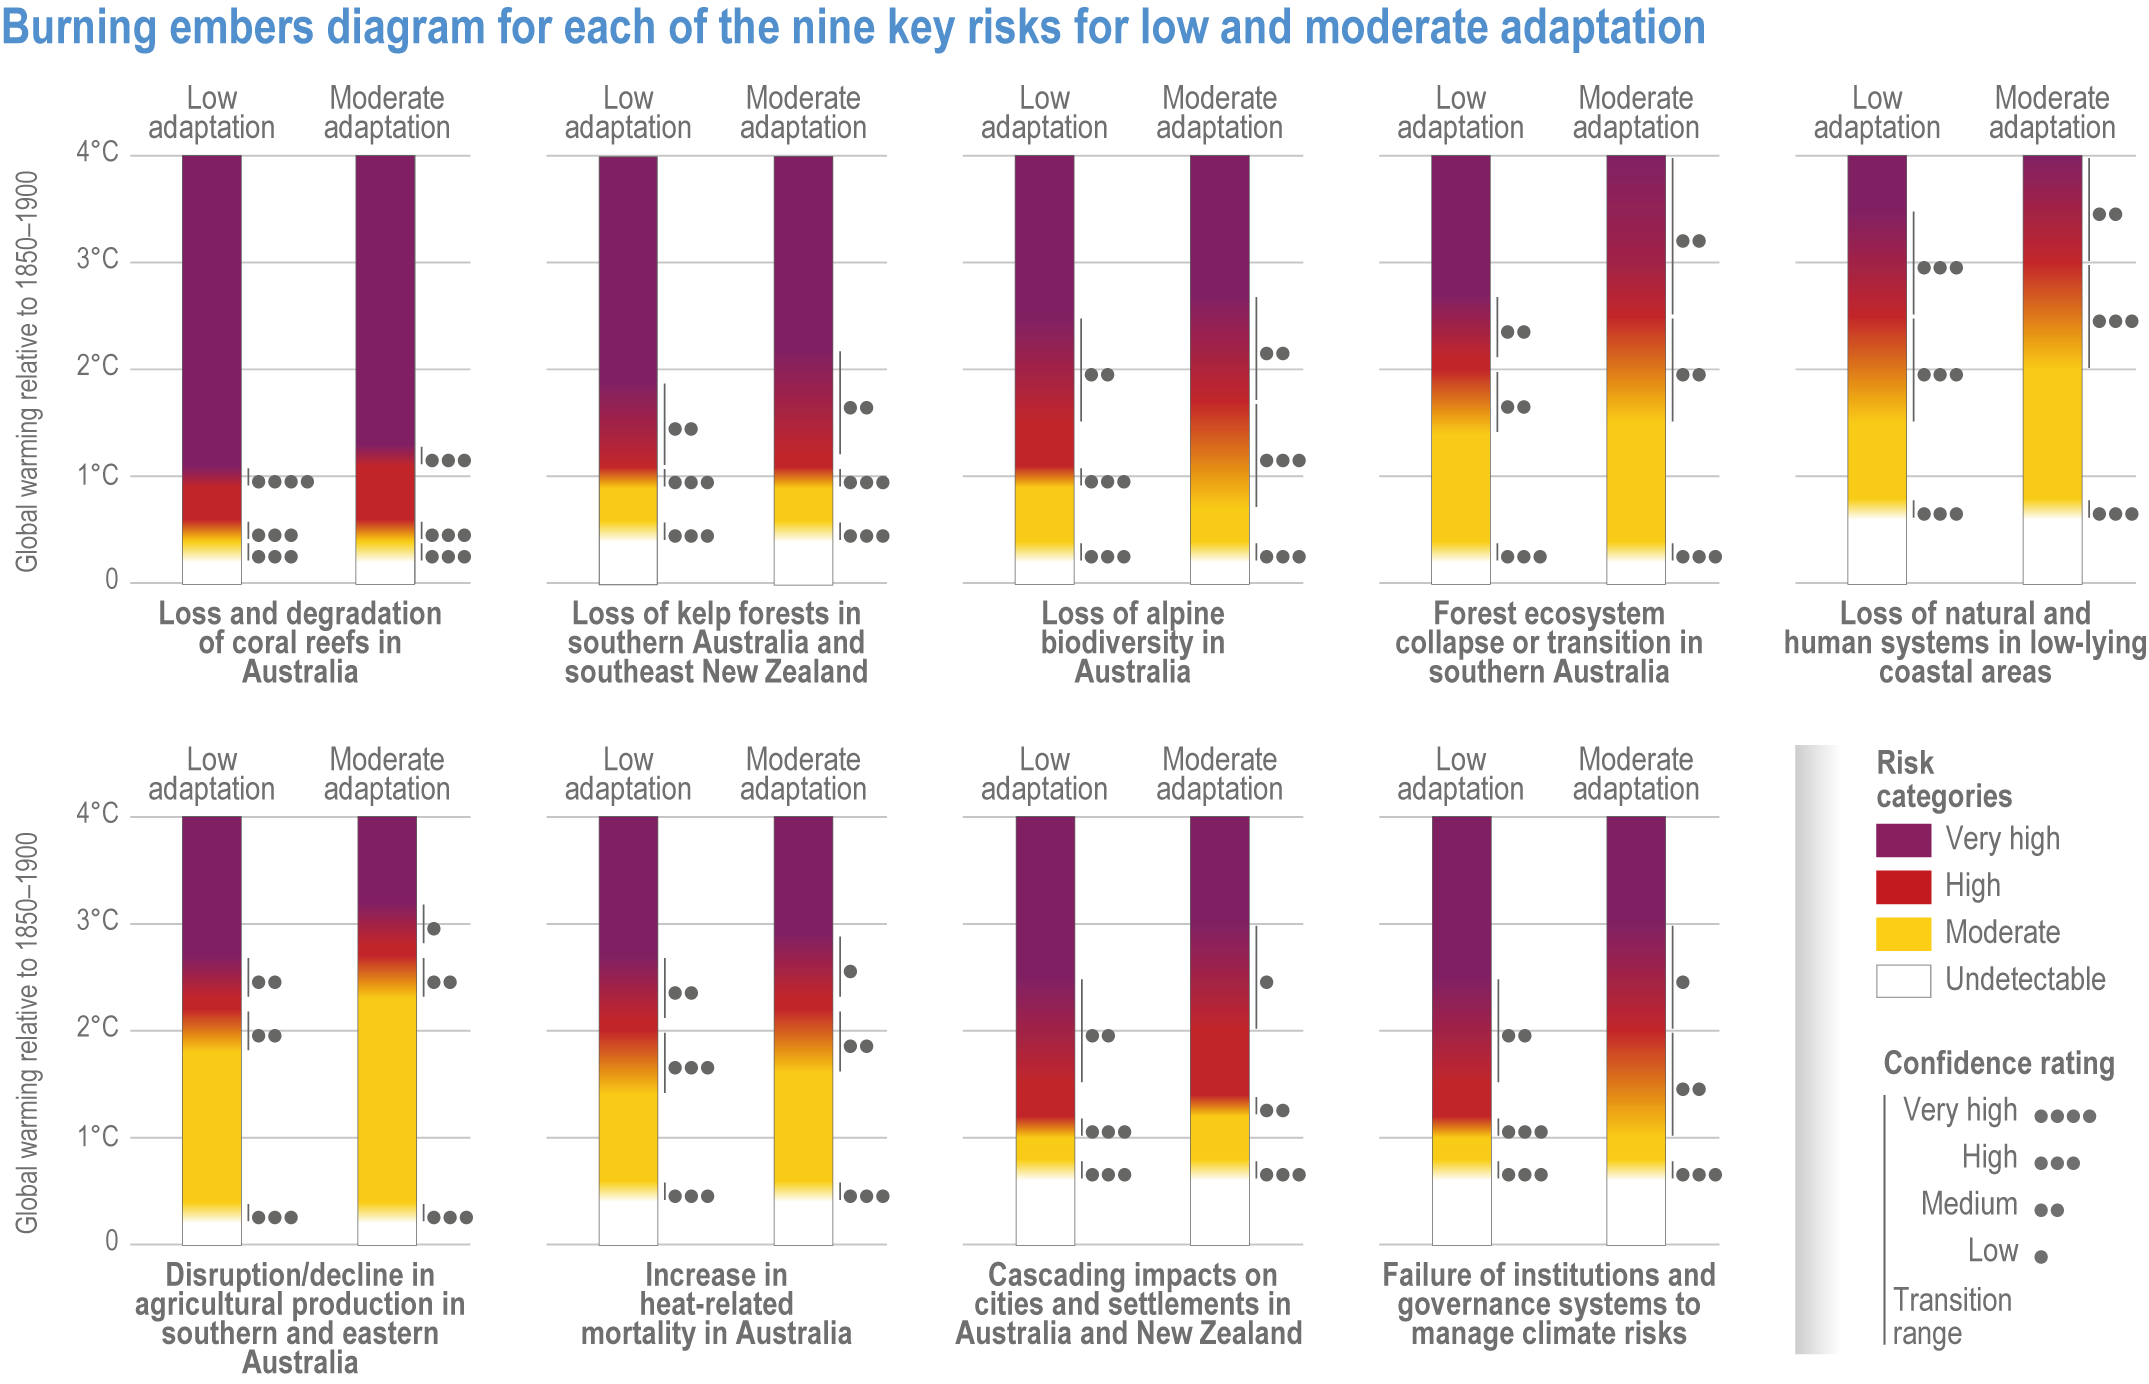
Figure 11.6 | Burning embers diagram for each of the nine key risks for low and moderate adaptation. The risk categories are undetectable, moderate, high and very high. While there is no risk category beyond very high, risks obviously get worse with further global warming, and the risk for coral reefs is already very high. The assessment is based on available literature and expert judgement, summarised in Table 11.14 and described in Supplementary Material SM 11.2. The global warming range associated with each risk transition has a confidence rating (**** very high, *** high, ** moderate, * low) based on the amount of evidence and level of agreement between lines of evidence
11.7.3 Adaptation Enablers
Adaptation enablers include understanding relevant knowledge, diverse values and governance, institutions and resources (very high confidence) (Gorddard et al., 2016). Skills and learning, community networks, people–place connections, trust-building, community resources and support and engaged governance build social resilience that support adaptation (Maclean et al., 2014; Eriksen, 2019; Phelps and Kelly, 2019). A multi-faceted focus on the role societal inequalities and environmental degradation play in generating climate change vulnerability can enable fairer adaptation outcomes (McManus et al., 2014; Ambrey et al., 2017; Schlosberg et al., 2017; Graham et al., 2018).
The feasibility and effectiveness of adaptation options will change over time depending on place, values, cultural appropriateness, social acceptability, ongoing cost-effectiveness, leadership and the ability to implement them through the prevailing governance regime (Singh et al., 2020). The capacity and commitment of the political system can drive early action that can reduce risks (Boston, 2017).
Decision makers face the challenge of how to adapt when there are ongoing knowledge gaps and uncertainties about when some climate change impacts will occur and their scale, for example coastal flooding (Box 11.6) or extreme rainfall events and their cascading effects (Box 11.4) (very high confidence). No-regrets decisions are likely to be insufficient (Hallegatte et al., 2012). A perception exists in some sectors that all climate risks are manageable based on past experience (CCATWG, 2017). Projected impacts, however, are outside the range experienced, meaning that decisions must be made now for long-lived assets, land uses and communities exposed to the key risks (Paulik et al., 2019a; Paulik et al., 2020) often under contested conditions where adaptation competes with other public expenditures (Kwakkel et al., 2016). New planning approaches being used across the region can enable more effective adaptation, for example continual iterative adaptation (Khan et al., 2015), rapid deployment of decision tools appropriate for addressing uncertainties (Marchau et al., 2019) and transformation of governance and institutional arrangements (Boston and Lawrence, 2018) (Table 11.17). Recognising co-benefits for mitigation and sustainable development can help incentivise adaptation (11.3.5.3, 11.8.2).
Table 11.17 | Key enablers for adaptation
Enabler | Example |
Governance frameworks | Clear climate change adaptation mandate Measures that inform a shift from reactive to anticipatory decision-making (e.g., decision tools that have long time frames) Institutional frameworks integrated across all levels of government for better coordination Revised design standards for buildings, infrastructure, landscape such as common land use planning guidance and codes of practice that integrate consideration of climate risks to address existing and future exposures and vulnerability of people and physical and cultural assets (11.3.1, 11.3.2, 11.3.3, 11.3.4.3, 11.3.5, 1.3.6, 11.4.1, 11.4.2, 11.5.1, 11.5.2, 11.6, 11.7.1, 11.7.2, 11.8.1, 11.8.2, Table 11.7, Table 11.14, Box 11.1, Box 11.3, Box 11.5, Box 11.6) |
Building capacity for adaptation | Provision of nationally consistent risk information through agreed methodologies for risk assessment that address non-stationarity Targeted research including understanding the projected scope and scale of cascading and compounding risks Education, training and professional development for adaptation under changing risk conditions Accessible adaptation tools and information (11.1.2, 11.3.4, 11.3.5, 11.4.1, 11.5.1, 11.6, 11.7.1, 11.7.2, Table 11.14, Table 11.16, Table 11.18, Box 11.6) |
Community partnership and collaborative engagement | Community engagement based on principles that consider social and cultural and Indigenous Peoples’ contexts and an understanding of what people value and wish to protect (e.g., International Association of Public Participation) (Public Participation, 2014) Use of collaborative and learning-oriented engagement approaches tailored for the social and informed by the cultural context Community awareness and network building Building on Indigenous Australian and Māori communities’ social-cultural networks and conventions that promote collective action and mutual support (11.3.5, 11.4, 11.7.1, 11.7.3.2, Table Box 11.1.1, Table 11.14, Box 11.6) |
Dynamic adaptive decision-making | Increased understanding and use of decision-making tools to address uncertainties and changing risks, such as scenario planning and DAPP to enable effective adaptation as climate risk profiles worsen (11.7.3.1, 11.7.3.2, Table 11.14, Table 15b, Table 11.18, Box 11.4, Box 11.6) |
Funding mechanisms | Adaptation funding framework to increase investment in adaptation actions New private-sector financial instruments to support adaptation (11.7.1, 11.7.2, Table 11.16) |
Reducing systemic vulnerabilities | Economic and social policies that reduce income and wealth inequalities Strengthening social capital and cohesion Identifying and redressing rigid or fragmented administrative and service delivery systems Reviewing land use and spatial planning to reduce exposure to climate risks Restoring degraded ecosystems and avoiding further environmental degradation and loss. (11.1.1, 11.1.2, 11.3.5, 11.3.11, 11.4.1, 11.5.1.3, 11.7.2, 11.8.1; Table 11.10, Table 11.13) |
11.7.3.1 Planning and Tools
Adaptation decision support tools enable a shift from reactive to anticipatory planning for changing climate risks (high confidence). The available tools are diversifying with futures and systems methodologies and dynamic adaptive policy pathways being increasingly used (Bosomworth et al., 2017; Prober et al., 2017; Lawrence et al., 2018a; CoA, 2020e; Rogers et al., 2020a; Schneider et al., 2020) (11.5; Box 11.6) to facilitate the shift from static to dynamic adaptation by highlighting path dependencies and potential lock-in of decisions, system dependencies and the potential for cascading impacts (Table 11.17) (Wilson et al., 2013; Clarvis et al., 2015; Pearson et al., 2018; Cradock-Henry et al., 2020b; Lawrence et al., 2020b). Modelling and tools to test the robustness and cost-effectiveness of options (Infometrics and PSConsulting, 2015; Qin and Stewart, 2020) can be used alongside adaptation strategies with decision-relevant and usable information (Smith et al., 2016; Tangney, 2019; Serrao-Neumann et al., 2020), particularly when supported by effective governance and national and sub-national guidance (Box 11.6).
More inclusive, collaborative and learning-oriented community engagement processes are fundamental to effective adaptation outcomes (11.7.3.2) (very high confidence) (Boston, 2016; Lawrence and Haasnoot, 2017; Sellberg et al., 2018; Serrao-Neumann et al., 2019a; Simon et al., 2020). More participatory vulnerability and risk assessments can better reflect different knowledge systems, values, perspectives, trade-offs, dilemmas, synergies, costs and risks (Jacobs et al., 2019; Ogier et al., 2020; Tonmoy et al., 2020). A shift from hierarchical to more cooperative governance modalities can assist effective adaptation (Vermeulen et al., 2018; Steffen et al., 2019; CoA, 2020e; Lawrence et al., 2020b; MfE, 2020a; Hanna et al., 2021).
Regular monitoring, evaluation, communication and coordination of adaptation are essential for accelerating learning and adjusting to dynamic climate impacts and changes in socioeconomic and cultural conditions (high confidence) (Moloney and McClaren, 2018; Palutikof et al., 2019a; Cradock-Henry et al., 2020a). Training to improve decision makers’ ‘evaluative capacity’ can play a role (Scott and Moloney, 2021). Climate action benchmarking, diagnostic tools and networking can enhance the adaptation process across diverse decision settings (e.g., water, coasts, protected areas and Indigenous Peoples) (Ayre and Nettle, 2017; Davidson and Gleeson, 2018; Coenen et al., 2019; Gibbs, 2020). Effective adaptation requires cross-jurisdictional and cross-sectoral policy coherence and national coordination (Delany-Crowe et al., 2019; Rychetnik et al., 2019; MfE, 2020c).
11.7.3.2 Attitudes, Engagement and Accessible Information as Enablers
Concern for climate change has become widespread (Hopkins, 2015; Borchers Arriagada et al., 2020), giving climate adaptation social legitimacy (high confidence). Over three quarters of Australians (77%) agree that climate change is occurring, and 61% believe climate change is caused by humans (Merzian et al., 2019). A growing proportion of Australians perceive links between climate change and high temperatures experienced during heatwaves and extremely hot days (Summer 2018/2019) (48%), droughts and flooding (42%) and urban water shortages (30%) (Merzian et al., 2019). Rural populations in NSW perceive climate change impacts as stressing their well-being and mental health and requiring leadership and action (Austin et al., 2020). In New Zealand, between 2009 and 2018, the proportion of New Zealanders who agreed or strongly agreed that climate change is real increased from 58% to 78% (a 34.5% increase), while those agreeing or strongly agreeing that it was caused by humans increased from 41% to 64% (a 56.1% increase) (Milfont et al., 2021). Nevertheless, New Zealanders have a tendency to overestimate the amount of sea level rise (SLR), especially among those most concerned about climate change and incorrectly associate it with melting sea ice, which has implications for engagement and communication strategies (Priestley et al., 2021).
The use of more systemic, collaborative and future-oriented engagement approaches is facilitating adaptation in local contexts (high confidence) (Rouse et al., 2013; MfE, 2017a; Leitch et al., 2019). Local ‘adaptation champions’ and experimental and tailored engagement processes can enhance learning (McFadgen and Huitema, 2017; Lindsay et al., 2019). Dynamic adaptive pathways planning (Lawrence et al., 2019a) and inclusive community governance (Schneider et al., 2020) can help progress difficult decisions such as the relocation of cultural assets and managed retreat, and contestation about which public goods to prioritise and how adaptation should be implemented (Kwakkel et al., 2016) (Colliar and Blackett, 2018). Participatory climate change scenario planning can test assumptions about the present and the future (Mitchell et al., 2017; Serrao-Neumann and Choy, 2018; Chambers et al., 2019; Serrao-Neumann et al., 2019c) and help envision people-centred, place-based adaptation (Barnett et al., 2014; Lindsay et al., 2019). Social network analysis can inform engagement and communication of adaptation (Cunningham et al., 2017). Knowledge brokers, information portals and alliances can help communities, governments and sector groups to better access and use climate change information (Shaw et al., 2013; Fünfgeld, 2015; Lawrence and Haasnoot, 2017). Novel approaches to building climate change literacy and adaptation capability go hand in hand with dedicated expert organisational support (Stevens and O’Connor, 2015; CCATWG, 2018; Palutikof et al., 2019c; Salmon, 2019). All of these approaches depend on adequate resourcing (very high confidence).
11.7.3.3 Knowledge Gaps and Implementation Enablers
There are two priority areas where new knowledge is critical for accelerating adaptation implementation.
- System complexity and uncertainty in observed and projected impacts
- Regionally relevant projections of rainfall, runoff, compound and extreme weather (11.2.1, 11.3.3; Box 11.4)
- Inclusion of cascading and compounding impacts in integrated assessments (11.5.1), including for infrastructure (11.3.5), tourism (11.3.7) and health (11.3.6) and for different groups, including Aboriginal and Torres Strait Islander Peoples and Tangata Whenua Māori communities (11.4)
- Impacts on terrestrial and freshwater ecosystems, including in situ monitoring to detect ongoing changes especially in New Zealand (11.3.1), and marine biodiversity, including environmental tolerances of key life stages (11.3.2)
- Repository of indigenous species distribution data for monitoring responses to climate change and climate advisory services for New Zealand (11.3.1.3)
- National risk assessment for Australia (11.7.1)
- The interactions between adaptation and mitigation, particularly where land carbon mitigation is impacted by climate change (11.3.4.3; Box 11.5)
- Supporting adaptation decision making
- Better understanding of who and what is exposed and where and their vulnerability to climate hazards (11.3, 11.4)
- National assessments of the costs and benefits of climate change, with and without different levels and timings of adaptation and mitigation (11.5.2.3) (11.7.1)
- Understanding available adaptation strategies and options, their feasibility and effectiveness as the climate changes, including their intended and unintended outcomes (11.7, 11.8)
- Understanding how to embed robust planning approaches into decision making that retain flexibility to change course in the future (11.7.1).
- Mechanisms for sharing knowledge and practice of adaptation (11.7).
- The role of development paradigms, values and political economy in adaptation framing and effective implementation (11.8).
- Understanding social transitions and social licence, for timely, robust and transformational adaptation (11.8.2).
11.8 Climate Resilient Development Pathways
Adaptation to climate risks and global mitigation of greenhouse emissions determine whether development pathways are climate-resilient (Chapter 18). In the near term, progress towards climate resilient development can be monitored by progress on the SDGs. According to government reports (Figure 11.6) (OECD, 2019a), current and projected trajectories fall short of meeting all targets (Allen et al., 2019). Key climate risks for the region (11.6, Table 11.14) affect all of the SDGs, and pre-existing societal inequalities exacerbate climate risks (11.3.5). Projected climate risks combined with underlying SDG indicators will increasingly impede the region’s capacity to achieve and maintain a number of SDGs, including sustainable agriculture, affordable and clean energy, sustainable cities and communities, life below water and life on land (OECD, 2019a). Reducing these risks would require significant and rapid emission reductions to keep global warming to 1.5°C–2.0°C and robust and timely adaptation (IPCC, 2018).
11.8.1 System Adaptations and Transitions
A step change in adaptation action is needed to address climate risks and to be consistent with climate resilient development (very high confidence). Current adaptation falls short on the assessment of complex risks, implementation, monitoring and evaluation. It is largely incremental and temporary given the scale of projected impacts; it has limits and is mainly reactive rather than anticipatory. Furthermore, risks are projected to cascade and compound, with impacts and costs that challenge adaptive capacities (11.5) and call for transformational responses (11.6, Table 11.15a, Table 11.15b; Supplementary Tables SM11.1a and SM11.1b).
Current global emissions reduction policies are projected to lead to a global warming of 2.1°C–3.9°C by 2100 (Liu and Raftery, 2021), leaving many of the region’s human and natural systems at very high risk and beyond adaptation limits (high confidence). With higher levels of warming, adaptation costs increase, loss and damages grow, and governance and institutional responses reduce adaptive capacity. Underlying social and economic vulnerabilities and injustices further reduce adaptive capacity, exacerbating disadvantage in particular groups in society. Sustainable development across and beyond the region will help reduce shared adaptation challenges (11.5.1.2). Effective adaptation avoids lock-in and path dependency, reduces vulnerabilities, increases flexibility to change, builds adaptive capacity and advances SDGs, thereby improving intra- and intergenerational justice (11.5, 11.6, 11.7). Reducing greenhouse gas emissions and structural inequalities is key to achieving the SDGs and contributing to climate resilient development.
Integrated and inclusive adaptation decision-making can contribute to climate resilient development by better mediating competing values, interests and priorities and helping to reconcile short- and long-term objectives, as well as public and private costs and benefits, in the face of rapidly and continuously changing risk profiles (very high confidence) (Gorddard et al., 2016; MfE, 2017a; Schlosberg et al., 2017) (11.5.2). Use of new tools and approaches (Table 11.18) to address system interactions that match the scale and scope of the problem can result in more effective adaptation, including proactive and anticipatory governance and institutional enablers (11.7, Table 11.17) (Schlosberg et al., 2017; Boston and Lawrence, 2018). Building cities and settlements that are resilient to the impacts of climate change requires the simultaneous consideration of infrastructural, ecological, social, economic, institutional and political dimensions of resilience, including political will, leadership, commitment, community support, multi-level governance and policy continuity (Torabi et al., 2021).
Table 11.18 | Examples of adaptation decision tools
Tools | Application | Source |
Scenario analysis, modelling, futures narratives | For futures planning in coastal, urban, agriculture and health sectors | (Randall et al., 2012; Jones et al., 2013; CSIRO, 2014; Bosomworth et al., 2015; Infometrics and PSConsulting, 2015; Knight-Lenihan, 2016; Maier et al., 2016; Stephens et al., 2017; B. Frame et al., 2018; Stephens et al., 2018; Ausseil et al., 2019a; Coulter et al., 2019; Serrao-Neumann et al., 2019b) |
Dynamic Adaptive Pathways Planning (DAPP) | For conditions of deep uncertainty for short-term and long-term options and flexibility, and with communities | (Cradock-Henry et al., 2018b; Cradock-Henry et al., 2020a) (agriculture); (Lawrence et al., 2019b) (flood risk management) (Lawrence and Haasnoot, 2017; Colliar and Blackett, 2018) (coastal communities) (Tasmanian Climate Change Office, 2012; Lin et al., 2017; Ramm et al., 2018) (capacity building) (Moran et al., 2014; Colloff et al., 2016; Dunlop et al., 2016; Bosomworth et al., 2017) (natural resource, management) (Hadwen et al., 2012; Barnett et al., 2014; Fazey et al., 2015; Lazarow, 2017; Ramm et al., 2018) (coastal) (Siebentritt et al., 2014; Zografos et al., 2016) (regional development) (Maru et al., 2014) (disadvantaged communities) (Hertzler et al., 2013; Sanderson et al., 2015) (agriculture) (Ren et al., 2011) (infrastructure and resilient cities) (Cunningham et al., 2017) (social network analysis with communities) |
Serious Games | To catalyse learning, raise awareness and explore attitudes and values | (Lawrence and Haasnoot, 2017; Colliar and Blackett, 2018; Flood et al., 2018; Edwards et al., 2019) |
Signals and Triggers for monitoring DAPP | For where there is near-term certainty and longer-term deep uncertainty (e.g., SLR) | |
Shared Socioeconomic Pathways | For where there is deep uncertainty and scenarios are used | (B. Frame et al., 2018) |
Hybrid Multi-criteria analysis and DAPP (deep uncertainty) | For conditions of deep uncertainty for short-term and long-term options and flexibility desired | |
Real Options Analysis (ROA) | For conditions of deep uncertainty | (Infometrics and PSConsulting, 2015; Infometrics, 2017; Lawrence et al., 2019a; Wreford et al., 2020) |
Scenario-based cost-benefit analysis | For conditions of deep uncertainty | |
Portfolio analysis | For uncertainties in the land use sector | (Monge et al., 2016; Awatere et al., 2018; West et al., 2021) |
Cost Benefit Analysis | Where decisions can be easily reversed | (Hadwen et al., 2012; Little and Lin, 2015; Stewart, 2015; Luo et al., 2017; Thamo et al., 2017) |
Vulnerability assessment | For assessing and prioritising physical and social place-based risks, using indices, modelling and participatory approaches | (Ramm et al., 2017; Moglia et al., 2018; Pearce et al., 2018; Tonmoy and El-Zein, 2018) |
Statutory tools | For planning direction For planning and design of adaptation | (DoC NZ, 2010; DoC NZ, 2017a; DoC NZ, 2017b; NSW Government, 2018) |
Standards | For adaptation best practice | (ISO, 2019) |
Jurisprudence | For adaptation implementation and legal interpretation | (O’Donnell and Gates, 2013; McAdam, 2015; Iorns Magallanes and Watts, 2019; Peel et al., 2020) |
Guidance | For adaptation and use of uncertainty tools | (CSIRO and BOM, 2015; MfE, 2017a; Lawrence et al., 2018b; Palutikof et al., 2019b) |
Information delivery and decision support portal | For adaptation decision making | |
Monitoring, evaluation and reporting on adaptation progress (incl. adaptation indices and web-based tools) | For local government, private sector and finance sector to benchmark, track progress | (Goodhue et al., 2012; Little et al., 2015; IGCC, 2017; Lawrence et al., 2020a; LGAQ and DES, 2020; Rogers et al., 2020b; WAGA, 2020) |
11.8.2 Challenges for Climate Resilient Development Pathways
Implementing enablers can help drive adaptation ambition and action consistent with climate resilient development (very high confidence) (11.7.3, Table 11.17). However, the scale and scope of cascading, compounding and aggregate impacts (11.5.1) calls for new and timely adaptation, including more effective ongoing monitoring, evaluation, review and continual adjustment (11.7.3) towards the transformations that can break through the path dependencies that define the way things are done now (Cradock-Henry et al., 2018b; UN et al., 2018; Head, 2020). However, complex interactions between objectives can create social and economic trade-offs (Table 11.1, 11.3.5.3, 11.7.3.1, Box 11.6).
Delay in implementing climate change adaptation and emissions reductions will impede climate resilient development, resulting in more costly climate impacts and greater scale of adjustments in the future (IPCC, 2018) (11.5.1, 11.5.2, Box 11.6) and legal risks for those with adaptation mandates and for financial institutions (11.5.1) (very high confidence). The scale and scope of societal change needed for the region to transition to more climate resilient development pathways requires close attention to governance, ethical questions, the role of civil society and the place of Aboriginal and Torres Strait Islander Peoples and Tangata Whenua Māori in the co-production of ongoing adaptation at multiple scales (Loorbach et al., 2017; Koehler et al., 2019; Hill et al., 2020).
The region faces an extremely challenging future that will be highly disruptive for many human and natural systems (IPCC, 2018) (UNEP, 2020; AAS, 2021; IPCC, 2021) (11.5.1, 11.6, 11.7; Boxes 11.1–11.6; Table 11.14). The extent to which the limits to adaptation are reached depends on whether global warming peaks this century at 1.5°C, 2°C or 3+°C above pre-industrial levels. Whatever the outcome, adaptation and mitigation are essential and urgent (very high confidence).
Frequently Asked Questions
FAQ 11.1 | How is climate change affecting Australia and New Zealand?
Climate change is affecting Australia and New Zealand in profound ways. Some natural systems of cultural, environmental, social and economic significance are at risk of irreversible change. The socioeconomic costs of climate change are substantial, with impacts that cascade and compound across sectors and regions, as demonstrated by heatwaves, wildfire, cyclone, drought and flood events.
Temperature has increased by 1.4°C in Australia and 1.1°C in New Zealand over the last 110 years, with more extreme hot days. The oceans in the region have warmed significantly, resulting in longer and more frequent marine heatwaves. Sea levels have risen and the oceans have become more acidic. Snow depths have declined and glaciers have receded. Northwestern Australia and most of southern New Zealand have become wetter, while southern Australia and most of northern New Zealand have become drier. The frequency, severity and duration of extreme wildfire weather conditions have increased in southern and eastern Australia and northeastern New Zealand.
The impacts of climate change on marine, terrestrial and freshwater ecosystems and species are evident. The mass mortality of corals throughout the Great Barrier Reef during marine heatwaves in 2016–2020 is a striking example. Climate change has contributed to the unprecedented south-eastern Australia wildfires in the spring and summer of 2019–2020, loss of alpine habitats in Australia, extensive loss of kelp forests, shifts further south in the distribution of almost 200 marine species, decline and extinction in some vertebrate species in the Australian wet tropics, expansion of invasive plants, animals and pathogens in New Zealand, erosion and flooding of coastal habitats in New Zealand, river flow decline in southern Australia, increased stress in rural communities, insurance losses for floods in New Zealand, increase in heatwave mortalities in Australian capital cities and fish deaths in the Murray-Darling River in the summer of 2018–2019.
FAQ 11.2 | What systems in Australia and New Zealand are most at risk from ongoing climate change?
The nine key risks to human systems and ecosystems in Australia and New Zealand from ongoing climate change are shown in Figure FAQ 11.2.1. Some risks, especially on ecosystems, are now difficult to avoid. Other risks can be reduced by adaptation if global mitigation is effective.
Risk is the combination of hazard, exposure and vulnerability. For a given hazard (e.g., fire), the risk will be greater in areas with high exposure (e.g., many houses) and/or high vulnerability (e.g., remote communities with limited escape routes). The severity and type of climate risk varies geographically (Figure FAQ11.2.1). Everyone will be affected by climate change, with disadvantaged and remote people and communities the most vulnerable.
The risks to natural and human systems are often compounded by impacts across multiple spatial and temporal scales. For example, fires damage property, farms, forests and nature with short- and long-term effects on biodiversity, natural resources, human health, communities and the economy. Major impacts across multiple sectors can disrupt supply chains to industries and communities and constrain delivery of health, energy, water and food services. These impacts create challenges for the adaptation and governance of climate risks. When combined, they have far-reaching socioeconomic and environmental impacts.
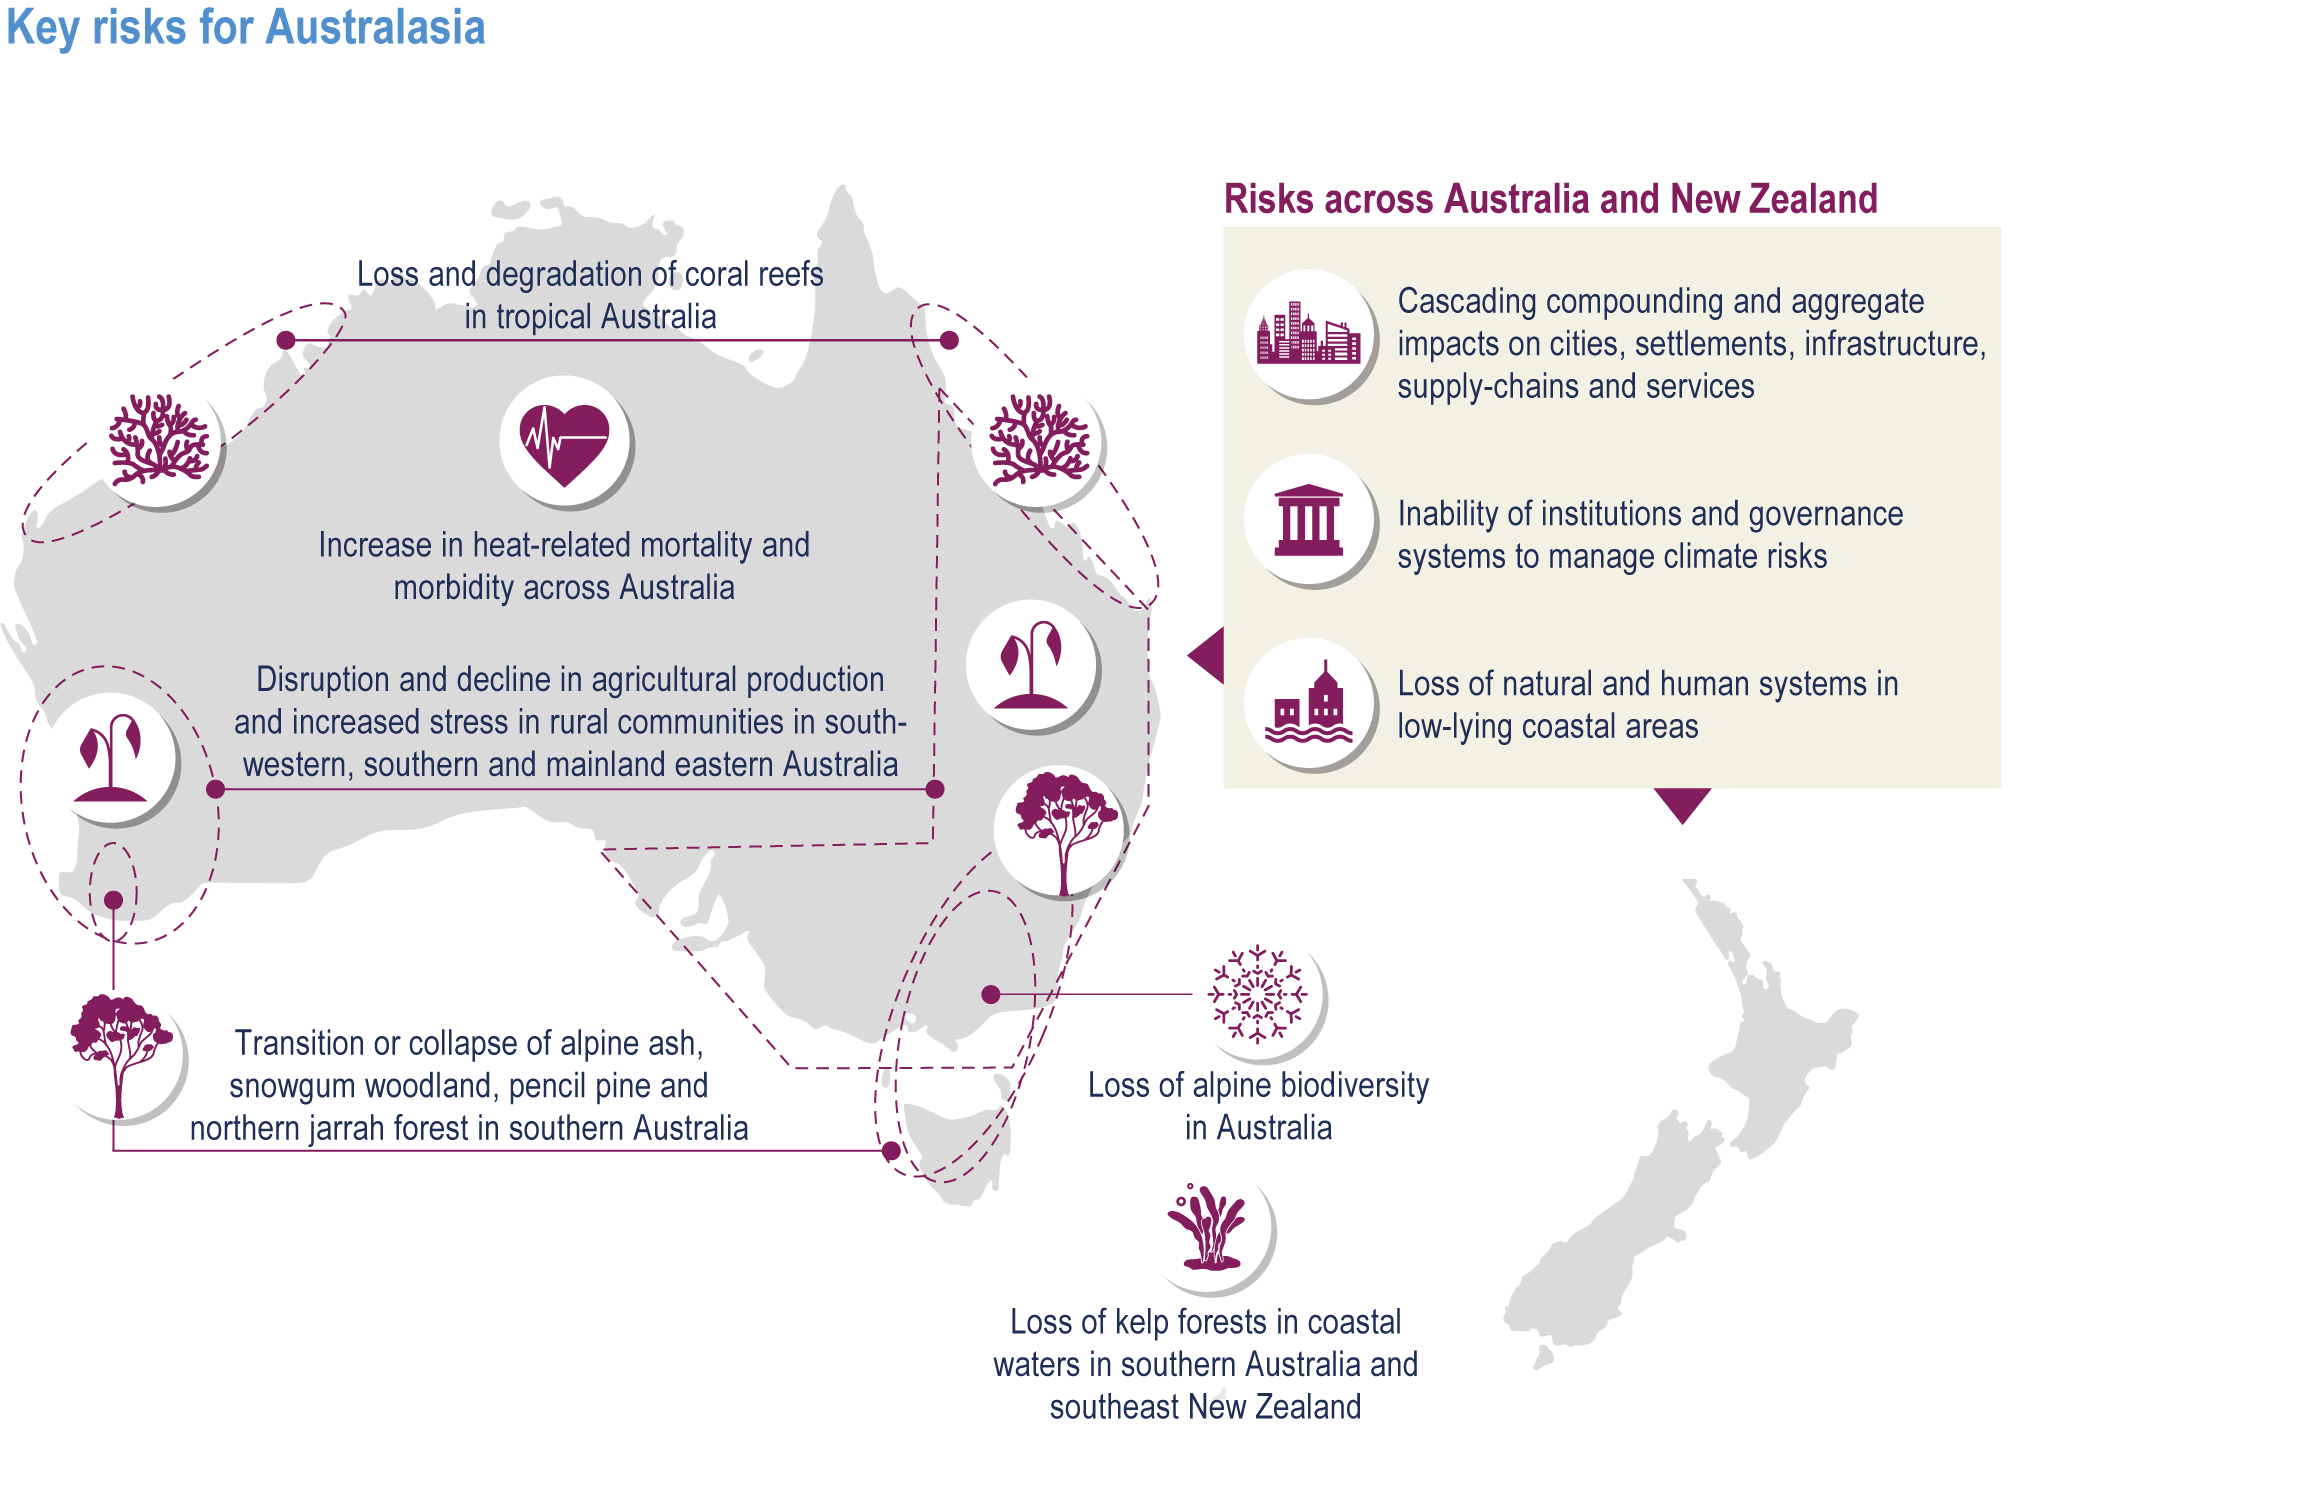
Figure FAQ11.2.1 | Key risks from climate change
FAQ 11.3 | How can Indigenous Peoples’ knowledge and practice help us understand contemporary climate impacts and inform adaptation in Australia and New Zealand?
In Australia and New Zealand, as with many places around the world, Indigenous Peoples with connections to their traditional country and extensive histories hold deep knowledge from observing and living in a changing climate. This provides insights that inform adaptation to climate change.
Indigenous Australians—Aboriginal and Torres Strait Islanders—maintain knowledge regarding previous sea level rise, climate patterns and shifts in seasonal change associated with the flowering of trees and emergence of food sources, developed over thousands of generations of observation of their traditional country. Knowledge of localised contemporary adaptation is also held by many Indigenous Australians with connections to traditional lands. With assured free and prior informed consent, this provides a means for Indigenous-guided land management, including for fire management and carbon abatement, fauna studies, medicinal plant products, threatened species recovery, water management and weed management.
Tangata Whenua Māori in New Zealand are grounded in Mātauranga Māori knowledge, which is based on human–nature relationships and ecological integrity and incorporates practices used to detect and anticipate changes taking place in the environment. Social-cultural networks and conventions that promote collective action and mutual support are central features of many Māori communities and these customary approaches are critical to responding to, and recovering from, adverse environmental conditions. Intergenerational approaches to planning for the future are also intrinsic to Māori social-cultural organisation and are expected to become increasingly important, elevating political discussions about conceptions of rationality, diversity and the rights of non-human entities in climate change policy and adaptation.
FAQ 11.4 | How can Australia and New Zealand adapt to climate change?
There is already work under way by governments, businesses, communities and Indigenous Peoples to help us adapt to climate change. However, much more adaptation is needed in light of the ongoing and intensifying climate risks. This includes coordinated laws, plans, guidance and funding that enable society to adapt and the information, education and training that can support it. Everyone has a part to play working together
We currently mainly react to climate events such as wildfires, heatwaves, floods and droughts and generally rebuild in the same places. However, climate change is making these events more frequent and intense, and ongoing sea level rise and changes in natural ecosystems are advancing. Better coordination and collaboration between government agencies, communities, Aboriginal and Torres Strait Islanders and Tangata Whenua Indigenous Peoples, not-for-profit organisations and businesses will help prepare for these climate impacts more proactively, in combination with future climate risks integrated into their decisions and planning. This will reduce the impacts we experience now and the risks that will affect future generations.
Some of the risks for natural systems are close to critical thresholds and adaptation may be unable to prevent ecosystem collapse. Other risks will be severe, but we can reduce their impact by acting now, for example coastal flooding from sea level rise, heat-related mortality and managing water stresses. Many of the risks have the potential to cascade across social and economic sectors with widespread societal impacts. In such cases, really significant system-wide changes will be needed in the way we currently live and govern. To facilitate such changes, new governance frameworks, nationally consistent and accessible information, collaborative engagement and partnerships with all sectors, communities and Indigenous Peoples and the resources to address the risks are needed (Figure FAQ11.4.1).
However, our ability to adapt to climate change impacts also rests on every region in the world playing its part in reducing greenhouse gas emissions. If mitigation is ineffective, global warming will be rapid and adaptation costs will increase, with worsening losses and damages.

Figure FAQ11.4.1 | Developing adaptation plans in the solutions space showing system tipping points, thresholds and limits to adaptation, unsustainable pathways, critical systems and enablers to climate resilient development
References
AAS, 2019: Investigation into the Causes of Mass Fish Kills in the Menindee Region NSW over Summer of 2018–2019. Australian Academy of Science Secretariat, 162 [Available at: https://www.science.org.au/files/userfiles/support/reports-and-plans/2019/academy-science-report-mass-fish-kills-digital.pdf ].
AAS, 2021: The risks to Australia of a 3°C warmer world. Australian Academy of Science, 97 [Available at: https://www.science.org.au/files/userfiles/support/reports-and-plans/2021/risks-australia-three-deg-warmer-world-report.pdf ].
Abel, N. et al., 2016: Building resilient pathways to transformation when “no one is in charge”: insights from Australia’s Murray-Darling Basin. Ecology and Society, 21 (2), doi:10.5751/es-08422-210223.
Abram, N. J. et al., 2021: Connections of climate change and variability to large and extreme forest fires in southeast Australia. Communications Earth & Environment , 2 (1), doi:10.1038/s43247-020-00065-8.
ABS, 2017: Regional Population Growth, Australia, 2016. Australian Bureau of Statistics, Canberra, ACT, Australia [Available at: http://www.abs.gov.au/ausstats/abs@.nsf/mf/3218.0 ].
ABS. 2022: 8155.0 Australian Industry, 2016–17, Mining—Key Points. [Available at: http://www.abs.gov.au/ausstats/abs@.nsf/mf/8155.0, accessed March 16, 2022]
ABS. 2022: 8155.0—Australian Industry, 2017–18, Mining—Key Points. [Available at: https://www.abs.gov.au/ausstats/abs@.nsf/mf/8155.0, accessed March 16, 2022]
ACCC, 2020: Northern Australia Insurance Inquiry. Australian Competition and Consumer Commission, 592 [Available at: https://www.accc.gov.au/focus-areas/inquiries-finalised/northern-australia-insurance-inquiry ].
ACE CRC, 2010: Climate Futures for Tasmania. Climate Modelling—the Summary. 9 [Available at: https://web.archive.org/web/20150406013036if_/http://www.dpac.tas.gov.au/__data/assets/pdf_file/0016/151126/CFT_-_Climate_Modelling_Summary.pdf ].
ACT Government, 2019: ACT Climate Change Strategy 2019–25. Australian Capital Territory Government, 100 [Available at: https://www.environment.act.gov.au/__data/assets/pdf_file/0003/1414641/ACT-Climate-Change-Strategy-2019-2025.pdf/_recache ].
ACT Government, 2020a: ACT Wellbeing Framework. Australian Capital Territory Government, 32 [Available at: https://www.act.gov.au/__data/assets/pdf_file/0004/1498198/ACT-wellbeing-framework.pdf ].
ACT Government, 2020b: Canberra’s Living Infrastructure Plan: Cooling the City. Australian Capital Territory, Canberra,34 pp.
Actuaries Institute, 2020: Property insurance affordability. Challenges and solutions. Actuaries Institute, 52 [Available at: https://actuaries.asn.au/Library/Miscellaneous/2020/GIRESEARCHPAPER.pdf ].
AECOM, 2012: Economic assessment of the urban heat island effect . City of Melbourne, 71.
AEMO, 2018: Integrated System Plan 2018. Australian Energy Market Operator [Available at: http://www.aemo.com.au/Electricity/National-Electricity-Market-NEM/Planning-and-forecasting/Integrated-System-Plan ].
AEMO, 2020a: 2019–20 NEM summer operations review report . Australian Energy Market Operator [Available at: https://www.aemo.com.au/-/media/files/electricity/nem/system-operations/summer-operations/2019-20/summer-2019-20-nem-operations-review.pdf ].
AEMO, 2020b: 2020 ISP Appendix 8. Resilience and Climate Change. Australian Energy Market Operator, 35 [Available at: https://aemo.com.au/-/media/files/major-publications/isp/2020/appendix--8.pdf?la=en ].
AFSI, 2020: Australian Sustainable Finance Roadmap. Australian Sustainable Finance Initiative, 95 [Available at: https://static1.squarespace.com/static/5c982bfaa5682794a1f08aa3/t/5fcdb70bfe657040d5b08594/1607317288512/Australian+Sustainable+Finance+Roadmap.pdf ].
AghaKouchak, A. et al., 2020: Climate Extremes and Compound Hazards in a Warming World. Annual Review of Earth and Planetary Sciences, 48 (1), 519–548, doi:10.1146/annurev-earth-071719-055228.
Aguilar, G. et al., 2015a: Queensland fruit fly invasion of New Zealand : predicting area suitability under future climate change scenarios. Unitec ePress Perspectives in Biosecurity Research Series, Unitec Institute of Technology, Auckland, New Zealand [Available at: https://www.unitec.ac.nz/epress/ ].
Aguilar, G. D. et al., 2017: A performance based consensus approach for predicting spatial extent of the Chinese windmill palm (Trachycarpus fortunei) in New Zealand under climate change. Ecological informatics, 39, 130–139.
Aguilar, G. D., M. J. Farnworth and L. Winder, 2015b: Mapping the stray domestic cat (Felis catus) population in New Zealand: Species distribution modelling with a climate change scenario and implications for protected areas. Applied Geography, 63, 146–154, doi:10.1016/j.apgeog.2015.06.019.
AIDR, 2017: Managing the Floodplain: A Guide to Best Practice in Flood Risk Management in Australia (Handbook 7). Commonwealth of Australia, Commonwealth of Australia, 92 [Available at: https://knowledge.aidr.org.au/media/3521/adr-handbook-7.pdf ].
AIHW, 2015: The health and welfare of Australia’s Aboriginal and Torres Strait Islander peoples. Australian Institute of Health and Welfare, Canberra.
AIHW, 2016: Australian Burden of Disease Study: Impact and causes of illness and death in Aboriginal and Torres Strait Islander people 2011. Australian Burden of Disease Study series no. 6. Cat. no. BOD 7, Australian Institute of Health and Welfare, Canberra.
Alam, M. et al., 2016: Modelling the correlation between building energy ratings and heat-related mortality and morbidity. Sustainable Cities and Society, 22, 29–39, doi:10.1016/j.scs.2016.01.006.
Aldum, N., J. Duggie and B. J. Robson, 2014: Climate change adaptation support tools in Australia. Regional Environmental Change, 14, 401–411.
Aldunce, P., R. Beilin, M. Howden and J. Handmer, 2015: Resilience for disaster risk management in a changing climate: Practitioners’ frames and practices. Global Environmental Change, 30, 1–11.
Alexander, L. V. and J. M. Arblaster, 2017: Historical and projected trends in temperature and precipitation extremes in Australia in observations and CMIP5. Weather and Climate Extremes, 15, 34–56, doi:10.1016/j.wace.2017.02.001.
Alexandra, J., 2018: Evolving Governance and Contested Water Reforms in Australia’s Murray Darling Basin. Water, 10 (2), 18, doi:10.3390/w10020113.
Alexandra, J., 2019: Losing the authority – what institutional architecture for cooperative governance in the Murray Darling Basin?Australasian Journal of Water Resources, 23 (2), 99–115, doi:10.1080/13241583.2019.1586066.
Alexandra, J., 2020: The science and politics of climate risk assessment in Australia’s Murray Darling Basin. Environmental Science & Policy, 112, 17–27, doi:10.1016/j.envsci.2020.05.022.
Alexandra, J. and C. Max Finlayson, 2020: Floods after bushfires: rapid responses for reducing impacts of sediment, ash, and nutrient slugs. Australasian Journal of Water Resources, 1–3, doi:10.1080/13241583.2020.1717694.
Alexandra, J. and B. Norman, 2020: The city as forest—integrating living infrastructure, climate conditioning and urban forestry in Canberra, Australia. Sustainable Earth, 3 (1), doi:10.1186/s42055-020-00032-3.
Ali, A., V. Strezov, P. J. Davies and I. Wright, 2018: River sediment quality assessment using sediment quality indices for the Sydney basin, Australia affected by coal and coal seam gas mining. Science of The Total Environment , 616–617, 695–702.
Ali, F. et al., 2019: Australian rice varieties vary in grain yield response to heat stress during reproductive and grain filling stages. Journal of Agronomy and Crop Science, 205 (2), 179–187, doi:10.1111/jac.12312.
Allen, C., G. Metternicht, T. Wiedmann and M. Pedercini, 2019: Greater gains for Australia by tackling all SDGs but the last steps will be the most challenging. Nature Sustainability, 2 (11), 1041–1050, doi:10.1038/s41893-019-0409-9.
Allis, M. J. and D. M Hicks, 2019: Adaptating to Coastal Change at Carters Beach, New Zealand. In: International Conference on Coastal Sediments 2019, 2019, Tampa/St. Petersburg, Florida, USA, [Ping, W., R. Julie D. and V. Mathieu (eds.)], World Scientific,, Tampa/St. Petersburg, Florida, USA, 1550–1561, doi:10.1142/9789811204487_0134.
Alston, M., J. Clarke and K. Whittenbury, 2018: Limits to adaptation: Reducing irrigation water in the Murray-Darling Basin dairy communities. Journal of Rural Studies, 58, 93–102, doi:10.1016/j.jrurstud.2017.12.026.
Ambrey, C. et al., 2017: Cultivating climate justice: Green infrastructure and suburban disadvantage in Australia. Appl. Geogr. , 89, 52–60.
Amelung, B. and S. Nicholls, 2014: Implications of climate change for tourism in Australia. Tourism Manage. , 41, 228–244, doi:10.1016/j.tourman.2013.10.002.
Ammar, S. E., M. McLntyre, M. G. Baker and S. Hales, 2021: Imported arboviral infections in New Zealand, 2001 to 2017: A risk factor for local transmission. Travel Med. Infect. Dis. , 41, 102047, doi:10.1016/j.tmaid.2021.102047.
AMS, 2019: Explaining extreme events of 2017 from a climate perspective[Herring, S. C., N. Christidis, A. Hoell, M. P. Hoerling and P. A. Stott (eds.)]. 100, Bulletin of the American Meteorological Society, S1-S117 [Available at: http://dx.doi.org/10.1175/BAMS-ExplainingExtremeEvents2017.1.].
Anderegg, W. R. L. et al., 2020: Climate-driven risks to the climate mitigation potential of forests. Science, 368 (6497), doi:10.1126/science.aaz7005.
Anderson, B. et al., 2021: Modelled response of debris-covered and lake-calving glaciers to climate change, Kā Tiritiri o te Moana/Southern Alps, New Zealand. Global and Planetary Change, 205, 103593, doi:10.1016/j.gloplacha.2021.103593.
Anderson, O., S. Mikaloff Fletcher and H. Bostock, 2015: Development of models for predicting future distributions of protected coral species in the New Zealand Region. Prepared for Marine Species and Threats, Department of Conservation, National Institute of Water & Atmospheric Research Ltd, National Institute of Water & Atmospheric Research Ltd., WEllington, NZ [Available at: https://www.doc.govt.nz/globalassets/documents/conservation/marine-and-coastal/marine-conservation-services/reports/models-predicting-future-distributions-corals-nz-niwa-dec-2015.pdf ].
Andrew, M. E. and H. Warrener, 2017: Detecting microrefugia in semi-arid landscapes from remotely sensed vegetation dynamics. Remote Sens. Environ. , 200, 114–124, doi:10.1016/j.rse.2017.08.005.
Anwar, M. R. et al., 2015: Climate change impacts on phenology and yields of five broadacre crops at four climatologically distinct locations in Australia. Agricultural Systems, 132, 133–144, doi:10.1016/j.agsy.2014.09.010.
ANZ, 2018: 2018 Annual Review. ANZ Bank, Australia and New Zealand Banking Group Limited, 32–34 [Available at: https://www.anz.com.au/content/dam/anzcom/shareholder/anz_2018_annual_review_final.pdf ].
APRA, 2019: Climate Change: Awareness to Action. Australian Prudential Regulation Authority, 29 [Available at: https://www.apra.gov.au/sites/default/files/climate_change_awareness_to_action_march_2019.pdf ].
APRA, 2021: Prudential Practice Guide on Climate Change Financial Risks. Australian Prudential Regulation Authority, 2 [Available at: https://www.apra.gov.au/sites/default/files/2021-04/Consultation%20on%20draft%20Prudential%20Practice%20Guide%20on%20Climate%20Change%20Financial%20Risks_1.pdf ].
Archie, K. M., R. Chapman and S. Flood, 2018: Climate change response in New Zealand communities: Local scale adaptation and mitigation planning. Environmental Development , 28, 19–31, doi:10.1016/j.envdev.2018.09.003.
Argent, N., M. Tonts, R. Jones and J. Holmes, 2014: The Amenity Principle, Internal Migration, and Rural Development in Australia. Ann. Assoc. Am. Geogr. , 104 (2), 305–318.
ASBEC, 2012: Built Environment Adaptation Framework. Australian Sustainable Built Environment Council, 2 [Available at: https://www.asbec.asn.au/research-items/a-climate-change-adaptation-framework-for-the-built-environment/ ].
Astill, S. et al., 2019: Reconceptualising’community’to identify place-based disaster management needs in Tasmania. Australian Journal of Emergency Management, The, 34 (1), 48.
Astill, S. and E. Miller, 2018: ‘The trauma of the cyclone has changed us forever’: self-reliance, vulnerability and resilience among older Australians in cyclone-prone areas. Ageing and Society, 38 (2), 403–429, doi:10.1017/s0144686x1600115x.
Attwater, R. and C. Derry, 2017: Achieving Resilience through Water Recycling in Peri-Urban Agriculture. Water, 9 (3), 223, doi:10.3390/w9030223.
Audzijonyte, A. et al., 2020: Fish body sizes change with temperature but not all species shrink with warming. Nat Ecol Evol, 4 (6), 809–814, doi:10.1038/s41559-020-1171-0.
Ausseil, A.-G. E. et al., 2021: Projected Wine Grape Cultivar Shifts Due to Climate Change in New Zealand. Front. Plant Sci. , 12, 618039, doi:10.3389/fpls.2021.618039.
Ausseil, A. G. E., A. J. Daigneault, B. Frame and E. I. Teixeira, 2019a: Towards an integrated assessment of climate and socio-economic change impacts and implications in New Zealand. Environmental Modelling & Software, 119, 1–20, doi:10.1016/j.envsoft.2019.05.009.
Ausseil, A. G. E. et al., 2019b: Climate impacts on land use suitability. Deep South National Science Challenge Manaaki Whenua—Landcare Research [Available at: https://ourlandandwater.nz/wp-content/uploads/2019/11/LUS_Ausseil_Land-Use_Final-Report_FINAL-30-June-2019-1.pdf ].
Austin, E. K. et al., 2018: Drought-related stress among farmers: findings from the Australian Rural Mental Health Study. Med. J. Aust. , 209 (4), 159–165.
Austin, E. K. et al., 2020: Concerns about climate change among rural residents in Australia. Journal of Rural Studies, 75, 98–109, doi:10.1016/j.jrurstud.2020.01.010.
Australia SoE, 2016: Marine environment . Commonwealth of Australia [Available at: https://soe.environment.gov.au/theme/marine-environment ].
Australia. NAHS Working Party, 1989: A national Aboriginal health strategy / prepared by the National Aboriginal Health Strategy Working Party. [National Aboriginal Health Strategy Working Party], [Canberra].
Australian Government, 2009: Climate Change Risks to Australia’s Coast. A First Pass National Assessment . Department of Climate Change,, Canberra, Australia.
Australian Government, 2019: Future Drought Fund (Drought Resilience Funding Plan 2020 to 2024) Determination 2020. Department of Agriculture Water and the Environment, 14 [Available at: https://haveyoursay.awe.gov.au/48071/widgets/284939/documents/144176 ].
Awatere, S. et al., 2018: Climate Resilient Māori Land. Deep South National Science Challenge, Manaaki Whenua Landcare Research,, Wellington, NZ.
Ayre, M. L. and R. A. Nettle, 2017: Enacting resilience for adaptive water governance: a case study of irrigation modernization in an Australian catchment. Ecology and Society, 22 (3), doi:10.5751/es-09256-220301.
Azorin-Molina, C. et al., 2021: A decline of observed daily peak wind gusts with distinct seasonality in Australia, 1941–2016. Journal of Climate, 1–63, doi:10.1175/jcli-d-20-0590.1.
B. Frame et al., 2018: Adapting global shared socio-economic pathways for national and local scenarios. Climate Risk Management , 21, 39–51, doi:10.1016/j.crm.2018.05.001.
Babcock, R. C. et al., 2019: Severe Continental-Scale Impacts of Climate Change Are Happening Now: Extreme Climate Events Impact Marine Habitat Forming Communities Along 45% of Australia’s Coast. Frontiers in Marine Science, 6, 411, doi:10.3389/fmars.2019.00411.
Baird, A. H., B. Sommer and J. S. Madin, 2012: Pole-ward range expansion of Acropora spp. along the east coast of Australia. Coral Reefs, 31 (4), 1063–1063, doi:10.1007/s00338-012-0928-6.
Banhalmi-Zakar, Z. et al., 2016: Mechanisms to finance climate change adaptation in Australia. National Climate Change Adaptation Research Facility, Gold Coast, Australia [Available at: http://dx.doi.org/
Bannister-Tyrrell, M. et al., 2013: Weather-driven variation in dengue activity in Australia examined using a process-based modeling approach. Am. J. Trop. Med. Hyg. , 88 (1), 65–72, doi:10.4269/ajtmh.2012.11-0451.
Bao, J., S. C. Sherwood, L. V. Alexander and J. P. Evans, 2017: Future increases in extreme precipitation exceed observed scaling rates. Nature Climate Change, 7 (2), 128–132, doi:10.1038/nclimate3201.
Bardsley, D. K., E. Palazzo and M. Pütz, 2018: Regional path dependence and climate change adaptation: A case study from the McLaren Vale, South Australia. Journal of Rural Studies, 63, 24–33, doi:10.1016/j.jrurstud.2018.08.015.
Bardsley, D. K. and N. D. Wiseman, 2016: Socio-ecological lessons for the Anthropocene: Learning from the remote Indigenous communities of Central Australia. Anthropocene, 14, 58–70.
Bargh, M., S.-L. Douglas and A. Te One, 2014: Fostering sustainable tribal economies in a time of climate change. New Zealand Geographer, 70 (2), 103–115, doi:10.1111/nzg.12042.
Bark, R., M. Kirby, J. D. Connor and N. D. Crossman, 2014: Water allocation reform to meet environmental uses while sustaining irrigation: a case study of the Murray–Darling Basin, Australia. Water Policy, 16 (4), 739–754, doi:10.2166/wp.2014.128.
Bark, R. H. et al., 2015: Operationalising the ecosystem services approach in water planning: a case study of indigenous cultural values from the Murray–Darling Basin, Australia. International Journal of Biodiversity Science, Ecosystem Services & Management , 11 (3), 239–249, doi:10.1080/21513732.2014.983549.
Barker, S., M. Baker-Jones, E. Barton and E. Fagan, 2016: Climate change and the fiduciary duties of pension fund trustees – lessons from the Australian law. Journal of Sustainable Finance & Investment , 6 (3), 211–244, doi:10.1080/20430795.2016.1204687.
Barnes, M., J. K. Szabo, W. K. Morris and H. Possingham, 2015: Evaluating protected area effectiveness using bird lists in the Australian Wet Tropics. Diversity and Distributions, 21 (4), 368–378, doi:10.1111/ddi.12274.
Barnett, G. et al., 2013: Pathways to climate adapted and healthy low income housing. National Climate Adaptation Research Facility,, Gold Coast, 364–371 pp.
Barnett, J. et al., 2015: From barriers to limits to climate change adaptation: path dependency and the speed of change. Ecol. Soc. , 20 (3), 1–11, doi:10.5751/es-07698-200305.
Barnett, J. et al., 2014: A local coastal adaptation pathway. Nature Climate Change, 4 (12), 1103–1108, doi:10.1038/nclimate2383.
Barnett, J. and C. McMichael, 2018: The effects of climate change on the geography and timing of human mobility. Population and Environment , 39 (4), 339–356, doi:10.1007/s11111-018-0295-5.
Barnett, J., P. Tschakert, L. Head and W. N. Adger, 2016: A science of loss. Nat. Clim. Chang. , 6 (11), 976–978, doi:10.1038/nclimate3140.
Barron, O. V. et al., 2011: Climate Change Impact on Groundwater Resources in Australia. Commonwealth Scientific and Industrial Research Organisation,, 25 [Available at: https://publications.csiro.au/rpr/download?pid=csiro:EP121194&dsid=DS1 ].
Bartesaghi-Koc, C. et al., 2021: Can urban heat be mitigated in a single urban street? Monitoring, strategies, and performance results from a real scale redevelopment project. Solar Energy, 216, 564–588, doi:10.1016/j.solener.2020.12.043.
Bates, B. C. et al., 2015: Revision of Australian Rainfall and Runoff—the interim climate change guideline. In: Floodplain Management Association National Conference, 2015, Brisbane, Australia, 14.
Battaglia, M. and J. Bruce, 2017: Direct climate change impacts on growth and drought risk in blue gum (eucalyptus globulus) plantations in Australia. Australian Forestry, 80, 216–227.
Baumann, S. et al., 2020: Updated inventory of glacier ice in New Zealand based on 2016 satellite imagery. Journal of glaciology, 67 (261), 13–26, doi: https://doi.org/10.1017/jog.2020.78.
Baumgartner, J. B., M. Esperón-Rodríguez and L. J. Beaumont, 2018: Identifying in situ climate refugia for plant species. Ecography, 41 (11), 1850–1863, doi:10.1111/ecog.03431.
Bayliss, P. et al., 2018: An integrated risk-assessment framework for multiple threats to floodplain values in the Kakadu Region, Australia, under a changing climate. Mar. Freshwater Res. , 69 (7), 1159–1185, doi:10.1071/mf17043.
Bayliss, P. and E. Ligtermoet, 2018: Seasonal habitats, decadal trends in abundance and cultural values of magpie geese (Anseranus semipalmata) on coastal floodplains in the Kakadu Region, northern Australia. Marine and Freshwater Research, 69 (7), 1079, doi:10.1071/mf16118.
Beal, C. D. et al., 2018: Identifying and understanding the drivers of high water consumption in remote Australian Aboriginal and Torres Strait Island communities. J. Clean. Prod. , 172, 2425–2434, doi:10.1016/j.jclepro.2017.11.168.
Beall, E. and J. Brocklesby, 2017: Exploring with Māori organizations comparative advantage in the context of climate change. Journal of Management & Organization, 23 (6), 821–838, doi:10.1017/jmo.2017.65.
Beautrais, A. L., 2018: Farm suicides in New Zealand, 2007–2015: A review of coroners’ records. Aust N Z J Psychiatry, 52 (1), 78–86, doi:10.1177/0004867417704058.
Becken, S., 2013: Developing a Framework for Assessing Resilience of Tourism Sub-Systems to Climatic Factors. Ann. Touris. Res. , 43, 506–528, doi:10.1016/j.annals.2013.06.002.
Becken, S. et al., 2021: Climate crisis and flying: social media analysis traces the rise of “flightshame”. Journal of Sustainable Tourism, 29 (9), 1450–1469, doi:10.1080/09669582.2020.1851699.
Becken, S. and J. Wilson, 2016: Are tourism businesses’ responses to weather variability a suitable precursor to climate change adaptation?Worldwide Hospitality and Tourism Themes, 8 (5), 578–592, doi:10.1108/whatt-06-2016-0033.
Becker, A., A. K. Y. Ng, D. McEvoy and J. Mullett, 2018: Implications of climate change for shipping: Ports and supply chains. Wiley Interdisciplinary Reviews: Climate Change, 9 (2), e508.
Becker, M. et al., 2013: Hybridization may facilitate in situ survival of endemic species through periods of climate change. Nat. Clim. Chang. , 3 (12), 1039–1043, doi:10.1038/nclimate2027.
Bekele, E. et al., 2018: Water Recycling via Aquifers for Sustainable Urban Water Quality Management: Current Status, Challenges and Opportunities. Water, 10 (4), 457, doi:10.3390/w10040457.
Bell-James, J. and B. Collins, 2020: Queensland’s Human Rights Act: A New Frontier for Australian Climate Change Litigation?UNSW Law Journal, 43 (1), doi: https://doi.org/10.53637/WGLW4453.
Bell, R.-A. and J. Nikolaus Callow, 2020: Investigating Banksia Coastal Woodland Decline Using Multi-Temporal Remote Sensing and Field-Based Monitoring Techniques. Remote Sensing, 12 (4), 669, doi:10.3390/rs12040669.
Bell, R., 2018: Impacts of severe weather: Chasing resilience for New Zealand. New Zealand Parliament [Available at: http://library.niwa.co.nz/cgi-bin/koha/opac-detail.pl?biblionumber=281114 ].
Bell, R. G. and J. Hannah, 2019: Update to 2018 of the annual MSL series and trends around New Zealand. National Institute of Water & Atmospheric Research Ltd., 20 [Available at: https://www.mfe.govt.nz/sites/default/files/media/Marine/update-to-2018-of-the-annual-MSL-series-and-trends-around-nz.pdf ].
Bellard, C. et al., 2014: Vulnerability of biodiversity hotspots to global change. Glob. Ecol. Biogeogr. , 23 (12), 1376–1386.
Bendall, S., 2018: Clifton to Tangoio Coastal Hazards Strategy 2120. Northern and Southern Cell Assessment Panels [Available at: https://www.hbcoast.co.nz/assets/Document-Library/Assessment-Panel-Report-FINAL-28.2.18-reduced-size.pdf ].
Bennett, B., M. Leonard, Y. Deng and S. Westra, 2018: An empirical investigation into the effect of antecedent precipitation on flood volume. Journal of Hydrology, 567, 435–445, doi:10.1016/j.jhydrol.2018.10.025.
Bennett, H. et al., 2014: Health and equity impacts of climate change in Aotearoa-New Zealand, and health gains from climate action. N. Z. Med. J. , 127 (1406), 16–31.
Bergstrom, D. M. et al., 2015: Rapid collapse of a sub-Antarctic alpine ecosystem: the role of climate and pathogens. Journal of Applied Ecology, 52 (3), 774–783, doi:10.1111/1365-2664.12436.
Bergstrom, D. M. et al., 2021: Combating ecosystem collapse from the tropics to the Antarctic. Glob. Chang. Biol. , 27 (9), 1692–1703, doi:10.1111/gcb.15539.
Bertram, G., 2015: Research Note: a revised set of New Zealand wealth estimates. Policy Quarterly, 11 (3), 73–75.
Bettini, Y., R. R. Brown and F. J. de Haan, 2015: Exploring institutional adaptive capacity in practice: examining water governance adaptation in Australia. Ecology and Society, 20 (1), doi:10.5751/es-07291-200147.
Bhend, J., J. Bathols and K. Hennessy, 2012: Climate change impacts on snow in Victoria. CSIRO Marine and Atmospheric Research, Melbourne, Australia, 42 [Available at: https://publications.csiro.au/rpr/pub?list=SEA&pid=csiro:EP117309&sb=RECENT&expert=false&n=12&rpp=25&page=1&tr=425&q=Hennessy&dr=all ].
Bickler, S., R. Clough and S. Macready, 2013: The impact of climate change on the archaeology of New Zealand’s coastline: a case study from the Whangarei District . New Zealand Department of Conservation (DOC), 58 [Available at: https://dcon01mstr0c21wprod.azurewebsites.net/globalassets/documents/science-and-technical/sfc322entire.pdf ].
Birkett-Rees, J., D. Bruno and B. Suttie, 2020: Buchan valley and gippsland lakes cultural mapping project . Gunaikurnai Land and Waters Aboriginal Corporation, 73 [Available at: https://bridges.monash.edu/articles/report/Gippsland_Lakes_region_predictive_modelling/15094260 ].
Biswas, T. K. et al., 2021: 2019–2020 Bushfire impacts on sediment and contaminant transport following rainfall in the Upper Murray River catchment. Integr. Environ. Assess. Manag. , doi:10.1002/ieam.4492.
Black, C. F., 2010: The Land is the Source of the Law: A Dialogic Encounter with Indigenous Jurisprudence. Routledge,, England, UK, 224 pp.
Blakers, A., B. Lu and M. Stocks, 2017: 100% renewable electricity in Australia. Energy, 133, 471–482, doi:10.1016/j.energy.2017.05.168.
Blakers, A., M. Stocks, B. Lu and C. Cheng, 2021: A review of pumped hydro energy storage. Progress in Energy, 3 (2), 022003, doi:10.1088/2516-1083/abeb5b.
Blue, B. and P. S. Kench, 2017: Multi-decadal shoreline change and beach connectivity in a high-energy sand system. New Zealand Journal of Marine and Freshwater Research, 51 (3), 406–426, doi:10.1080/00288330.2016.1259643.
Blunden, J. and D. S. Arndt, 2020: State of the Climate in 2019. Bulletin of the American Meteorological Society, 101 (8), S1-S429, doi:10.1175/2020bamsstateoftheclimate.1.
Boer, M. M., V. R. de Dios and R. A. Bradstock, 2020: Unprecedented burn area of Australian mega forest fires. Nature Climate Change, 10, 170–172, doi: https://doi.org/10.1038/s41558-020-0716-1.
BoM, 2016: Improving Water Information Programme Progress Report . Bureau of Meteorology, Bureau of Meteorology, Melbourne, Australia 33.
BoM, 2020: 2020 marine heatwave on the Great Barrier Reef . Bureau of Meteorology, Melbourne, Australia 4[Available at: http://www.bom.gov.au/environment/doc/2020-GBR-marine-heatwave-factsheet.pdf ].
BoM and CSIRO, 2018 : State of the Climate 2018. Commonwealth Scientific Industrial and Research Organisation, Melbourne, Australia, 24.
BoM and CSIRO, 2020 : State of the Climate 2020. Bureau of Meteorology and Commonwealth Scientific Industrial and Research Organisation, Commonwealth Scientific Industrial Rsearch Organisation, Melbourne, Australia.
Bonada, M. et al., 2020: Impact of low rainfall during dormancy on vine productivity and development. Australian Journal of Grape and Wine Research, doi:10.1111/ajgw.12445.
Bonada, M. et al., 2015: Impact of elevated temperature and water deficit on the chemical and sensory profiles of Barossa Shiraz grapes and wines. Australian Journal of Grape and Wine Research, 21 (2), 240–253, doi:10.1111/ajgw.12142.
Bond, M. O., B. J. Anderson, T. H. A. Henare and P. M. Wehi, 2019: Effects of climatically shifting species distributions on biocultural relationships. People and Nature, 1 (1), 87–102, doi:10.1002/pan3.15.
Bond, N. R., J. R. Thomson and P. Reich, 2014: Incorporating climate change in conservation planning for freshwater fishes. Diversity and Distributions, 20 (8), 931–942, doi:10.1111/ddi.12213.
Booth, K. and A. Harwood, 2016: Insurance as catastrophe: A geography of house and contents insurance in bushfire-prone places. Geoforum, 69, 44–52.
Borchers Arriagada, N. et al., 2020: Unprecedented smoke-related health burden associated with the 2019–20 bushfires in eastern Australia. Med. J. Aust. , doi:10.5694/mja2.50545.
Bosomworth, K. and E. Gaillard, 2019: Engaging with uncertainty and ambiguity through participatory ‘Adaptive Pathways’ approaches: scoping the literature. Environmental Research Letters, 14 (9), 093007, doi:10.1088/1748-9326/ab3095.
Bosomworth, K., A. Harwood, P. Leith and P. Wallis, 2015: Adaptation Pathways: a playbook for developing robust options for climate change adaptation in Natural Resource Management. https://www.terranova.org.au/repository/southern-slopes-nrm-collection/adaptation-pathways-a-playbook-for-developing-options-for-climate-change-adaptation-in-natural-resource-management .
Bosomworth, K., P. Leith, A. Harwood and P. J. Wallis, 2017: What’s the problem in adaptation pathways planning? The potential of a diagnostic problem-structuring approach. Environmental Science & Policy, 76, 23–28, doi:10.1016/j.envsci.2017.06.007.
Bostock, H. C. et al., 2015: The carbonate mineralogy and distribution of habitat-forming deep-sea corals in the southwest pacific region. Deep Sea Research Part I: Oceanographic Research Papers, 100, 88–104, doi:10.1016/j.dsr.2015.02.008.
Boston, J., 2016: Anticipatory governance: how well is New Zealand safeguarding the future?Policy Quarterly, 12 (3), doi:10.26686/pq.v12i3.4614.
Boston, J., 2017: Governing for the Future: Designing Democratic Institutions for a Better Tomorrow. Emerald Group Publishing, 576 pp.
Boston, J. and J. Lawrence, 2018: Funding climate change adaptation: the case for a new policy framework. Policy Quarterly, 14 (2), 40–49.
Boström-Einarsson, L. et al., 2020: Coral restoration – A systematic review of current methods, successes, failures and future directions. PLOS ONE, 15 (1), e0226631, doi:10.1371/journal.pone.0226631.
Boulter, S., 2012: A Preliminary Assessment of the Vulnerability of Austra-lian Forests to the Impacts of Climate Change – Synthesis. . National Climate Change Adaptation Research Facility, Gold Coast, Australia, 254.
Bowman, D. 2022: Hot issue – bushfires, powerlines and climate change. [Available at: https://theconversation.com/hot-issue-bushfires-powerlines-and-climate-change-9383, accessed September 2021]
Bowman, D. M. J. S. et al., 2019: Fire caused demographic attrition of the Tasmanian palaeoendemic conifer Athrotaxis cupressoides. Austral Ecology, 44 (8), 1322–1339, doi:10.1111/aec.12789.
Bowman, D. M. J. S. et al., 2014: Abrupt fire regime change may cause landscape-wide loss of mature obligate seeder forests. Glob. Chang. Biol. , 20 (3), 1008-1015, doi:10.1111/gcb.12433.
Bradstock, R. et al., 2014: Divergent responses of fire to recent warming and drying across south-eastern Australia. Glob. Chang. Biol. , 20 (5), 1412–1428, doi:10.1111/gcb.12449.
Brand, E., C. Bond and C. Shannon, 2016: Indigenous in the City: Urban Indigenous populations in local and global contexts. The University of Queensland [Available at: https://poche.centre.uq.edu.au/files/609/Indigenous-in-the-city%281%29.pdf ].
Bremer, J. and M. Linnenluecke, 2017: Determinants of the perceived importance of organisational adaptation to climate change in the Australian energy industry. Australian Journal of Management , 42 (3), 502–521.
Briceño, F. A. et al., 2020: Temperature alters the physiological response of spiny lobsters under predation risk. Conserv Physiol, 8 (1), coaa065, doi:10.1093/conphys/coaa065.
Bridge, G. et al., 2018: Energy and society: a critical perspective. Routledge, UK.
Bridge, T. C. L. et al., 2014: Variable Responses of Benthic Communities to Anomalously Warm Sea Temperatures on a High-Latitude Coral Reef. PLOS ONE, 9 (11), e113079, doi:10.1371/journal.pone.0113079.
Broadbent, A., A. Coutts, N. Tapper and M. Demuzere, 2018: The cooling effect of irrigation on urban microclimate during heatwave conditions. Urban Climate, 23, 20, doi:10.1016/j.uclim.2017.05.002.
Brodison, K., 2013: Effect of smoke in grape and wine production. Viticulture and Oenology Commons, Department of Primary Industries and Regional Development, Perth, Western Australia [Available at: https://www.google.com/url?sa=t&rct=j&q=&esrc=s&source=web&cd=9&ved=2ahUKEwjZ5bXB7pHhAhVY6nMBHRFeBVsQFjAIegQIBBAC&url=https%3A%2F%2Fresearchlibrary.agric.wa.gov.au%2Fcgi%2Fviewcontent.cgi%3Freferer%3D%26httpsredir%3D1%26article%3D1207%26context%3Dbulletins&usg=AOvVaw1pKOvX_WtMkPw51e1KJaFc ].
Brolan, C. E., C. A. McEwan and P. S. Hill, 2019: Australia’s overseas development aid commitment to health through the sustainable development goals: a multi-stakeholder perspective. Globalization and Health, 15 (1), doi:10.1186/s12992-019-0507-5.
Brookfield, S. and L. Fitzgerald, 2018: Homelessness and natural disasters: the role of community service organisations. Australian Journal of Emergency Management , 33 (4), 62–68.
Brookhouse, M. T., G. D. Farquhar and M. L. Roderick, 2013: The impact of bushfires on water yield from south-east Australia’s ash forests. Water Resources Research, 49 (7), 4493–4505, doi:10.1002/wrcr.20351.
Broome, R. A. and W. T. Smith, 2012: The definite health risks from cutting power outweigh possible bushfire prevention benefits. Med. J. Aust. , 197 (8), 440–441, doi:10.5694/mja12.10218.
Brown, C., E. Seville and J. Vargo, 2017: Measuring the organizational resilience of critical infrastructure providers: A New Zealand case study. International Journal of Critical Infrastructure Prevention, 18, 37–49.
Bruyère, C. et al., 2020: Severe weather in a changing climate, 2nd Ed. IAG and NCAR, 132 [Available at: https://www.iag.com.au/sites/default/files/Documents/Climate%20action/Severe-weather-in-a-changing-climate-2nd-Edition.pdf ].
Bryan, B. A. et al., 2016: Land-use and sustainability under intersecting global change and domestic policy scenarios: Trajectories for Australia to 2050. Global Environmental Change, 38, 130–152, doi:10.1016/j.gloenvcha.2016.03.002.
Bryan, K. R., P. S. Kench and D. E. Hart, 2008: Multi-decadal coastal change in New Zealand: Evidence, mechanisms and implications. New Zealand Geographer, 64 (2), 117–128, doi:10.1111/j.1745-7939.2008.00135.x.
Bryant, L. and B. Garnham, 2018: Farming exit and ascriptions of blame: The ordinary ethics of farming communities. Journal of Rural Studies, 62, 62–67, doi:10.1016/j.jrurstud.2018.07.004.
Bryant, M., P. Allan and H. Smith, 2017: Climate Change Adaptations for Coastal Farms: Bridging Science and Mātauranga Māori with Art and Design. The Plan Journal, 2 (2), doi:10.15274/tpj.2017.02.02.25.
Bryant, R. A. et al., 2014: Psychological outcomes following the Victorian Black Saturday bushfires. Aust. N. Z. J. Psychiatry, 48 (7), 634–643, doi:10.1177/0004867414534476.
Bulgarella, M. et al., 2014: Shifting ranges of two tree weta species (Hemideina spp.): Competitive exclusion and changing climate. J. Biogeogr. , 41 (3), 524–535, doi:10.1111/jbi.12224.
Burton, P., 2014: Responding to climate change : lessons from an Australian hotspot . CSIRO Publishing,, Collingwood, Victoria
Butler, C. L., V. L. Lucieer, S. J. Wotherspoon and C. R. Johnson, 2020: Multi-decadal decline in cover of giant kelp Macrocystis pyrifera at the southern limit of its Australian range. Mar. Ecol. Prog. Ser. , 653, 1–18, doi:10.3354/meps13510.
Button, C. and N. Harvey, 2015: Vulnerability and adaptation to climate change on the South Australian coast: a coastal community perspective. Transactions of the Royal Society of South Australia, 139 (1), 38–56, doi:10.1080/03721426.2015.1035216.
Byett, A. et al., 2019: Climate change adaptation within New Zealand’s transport system. Ministry of Transport, 11 [Available at: https://deepsouthchallenge.co.nz/wp-content/uploads/2021/01/Climate-Change-Adaptation-within-New-Zealands-Transport-System.pdf ].
Cadenhead, N. C. R. et al., 2016: Climate and Fire Scenario Uncertainty Dominate the Evaluation of Options for Conserving the Great Desert Skink. Conservation Letters, 9 (3), 181–190, doi:10.1111/conl.12202.
Cagigal, L. et al., 2019: Historical and future storm surge around New Zealand: From the 19th century to the end of the 21st century. Int. J. Climatol. , 19, 77, doi:10.1002/joc.6283.
Cahoon, S., S. L. Chen and B. Brooks, 2016: The impact of climate change on Australian ports and supply chains: the emergence of adaptation strategies. In: Climate Change and Adaptation Planning for Ports [Ng, A., A. Becker and S. Cahoon (eds.)]. Routledge, London, 194–214.
Cai, W., 2015: ENSO and greenhouse warming. Nature Climate Change, doi: DOI: 10.1038/NCLIMATE2743.
Cai, W. et al., 2014: Increasing frequency of extreme El Niño events due to greenhouse warming. Nature Climate Change, 4 (2), 111–116, doi:10.1038/nclimate2100.
Cai, W. et al., 2018: Stabilised frequency of extreme positive Indian Ocean Dipole under 1.5°C warming. Nat. Commun. , 9 (1), 1419, doi:10.1038/s41467-018-03789-6.
Campbell-Tennant, D. J. E., J. L. Gardner, M. R. Kearney and M. R. E. Symonds, 2015: Climate-related spatial and temporal variation in bill morphology over the past century in Australian parrots. J. Biogeogr. , 42 (6), 1163–1175, doi:10.1111/jbi.12499.
Capon, S. J. and T. R. Capon, 2017: An Impossible Prescription: Why Science Cannot Determine Environmental Water Requirements for a Healthy Murray-Darling Basin. Water Economics and Policy, 03 (03), 1650037, doi:10.1142/s2382624x16500375.
Capson, T. L. and J. Guinotte, 2014: Future proofing New Zealand’s shellfish aquaculture: monitoring and adaptation to ocean acidification. New Zealand Aquatic Environment and Biodiversity Report, 136, Ministry for Primary Industries New Zealand, Wellington, NZ.
Caputi, N. et al., 2019: Factors Affecting the Recovery of Invertebrate Stocks From the 2011 Western Australian Extreme Marine Heatwave. Frontiers in Marine Science, 6, 484, doi:10.3389/fmars.2019.00484.
Carey-Smith, T., R. Henderson and S. Singh, 2018: High Intensity System Design Rainfall Version 4. National Institute for Water and Atmospheric Research, National Institute for Water Atmospheric Research, Wellington, 73 [Available at: https://www.niwa.co.nz/information-services/hirds ].
Carter, A. L. et al., 2018: Geostatistical interpolation can reliably extend coverage of a very high-resolution model of temperature-dependent sex determination. J. Biogeogr. , 45 (3), 652–663, doi:10.1111/jbi.13152.
Caruso, B., S. Newton, R. King and C. Zammit, 2017: Modelling climate change impacts on hydropower lake inflows and braided rivers in a mountain basin. Hydrological Sciences Journal, 62 (6), 928–946, doi:10.1080/02626667.2016.1267860.
Castro, L. C. et al., 2020: Combined mechanistic modelling predicts changes in species distribution and increased co-occurrence of a tropical urchin herbivore and a habitat-forming temperate kelp. Diversity and Distributions, 26 (9), 1211–1226, doi:10.1111/ddi.13073.
Caswell, B. A., N. G. Dissanayake and C. L. J. Frid, 2020: Influence of climate-induced biogeographic range shifts on mudflat ecological functioning in the subtropics. Estuar. Coast. Shelf Sci. , 237, 106692, doi:10.1016/j.ecss.2020.106692.
CBA, 2018: Annual Report 2018. Commonwealth Bank of Australia, 50–60 [Available at: https://www.commbank.com.au/content/dam/commbank/about-us/shareholders/pdfs/results/fy18/cba-annual-report-2018.pdf ].
CBA, 2019: Annual Report 2019. Commonwealth Bank of Australia, 322 [Available at: https://www.commbank.com.au/content/dam/commbank/about-us/shareholders/pdfs/annual-reports/CBA-2019-Annual-Report.pdf ].
CCATWG, 2017: Adapting to Climate Change in New Zealand: Stocktake Report from the Climate Change Adaptation Technical Working Group. Climate Change Adaptation Technical Working Group [Available at: www.mfe.govt.nz ].
CCATWG, 2018: Adapting to Climate Change in New Zealand: Recommendations from the Climate Change Adaptation Technical Working Group. Climate Change Adaptation Technical Working Group [Available at: https://www.mfe.govt.nz/sites/default/files/media/Climate%20Change/ccatwg-report-web.pdf ].
CDEM, 2019: National-Disaster-Resilience-Strategy—Rautaki ā-Motu Manawaroa Aituā. Ministry of Civil Defence & Emergency Management, 52 [Available at: https://www.civildefence.govt.nz/assets/Uploads/publications/National-Disaster-Resilience-Strategy/National-Disaster-Resilience-Strategy-10-April-2019.pdf ].
Challinor, A. J. et al., 2018: Transmission of climate risks across sectors and borders. Philos. Trans. A Math. Phys. Eng. Sci. , 376 (2121), doi:10.1098/rsta.2017.0301.
Chambers, I. et al., 2019: A public opinion survey of four future scenarios for Australia in 2050. Futures, 107, 119–132, doi:10.1016/j.futures.2018.12.002.
Champion, C. et al., 2019: Changing windows of opportunity: past and future climate-driven shifts in temporal persistence of kingfish (Seriola lalandi) oceanographic habitat within south-eastern Australian bioregions. Mar. Freshwater Res. , 70 (1), doi:10.1071/mf17387.
Chang-Fung-Martel, J. et al., 2017: The impact of extreme climatic events on pasture-based dairy systems: a review. Crop & Pasture Science, 68 (12), 1158–1169, doi:10.1071/cp16394.
Charles-Edwards, E., M. Bell, J. Cooper and A. Bernard, 2018: Population shift: Understanding internal migration in Australia. Australian Bureau of Statistics [Available at: https://www.abs.gov.au/ausstats/abs@.nsf/Lookup/by%20Subject/2071.0~2016~Main%20Features~Population%20Shift:%20Understanding%20Internal%20Migration%20in%20Australia~69 ].
Chauvenet, A. L. M., J. G. Ewen, D. Armstrong and N. Pettorelli, 2013: Saving the hihi under climate change: a case for assisted colonization. J. Appl. Ecol. , 50 (6), 1330–1340, doi:10.1111/1365-2664.12150.
Cheng, L. et al., 2017: Recent increases in terrestrial carbon uptake at little cost to the water cycle. Nat. Commun. , 8 (1), 110, doi:10.1038/s41467-017-00114-5.
Chester, M. V., B. Shane Underwood and C. Samaras, 2020: Keeping infrastructure reliable under climate uncertainty. Nature Climate Change, 10 (6), 488–490, doi:10.1038/s41558-020-0741-0.
Chiew, F. et al., 2018: Impact of Coal Resource Development on Streamflow Characteristics: Influence of Climate Variability and Climate Change. Water, 10 (9), 1161, doi:10.3390/w10091161.
Chiew, F. and I. Prosser, 2011: Water and Climate. In: Water: Science and Solutions for Australia [Prosser, I. (ed.)]. CSIRO Publishing,, 150 Oxford Street (PO Box 1139) Collingwood VIC 3066 Australia, 29–46.
Chiew, F. H. S. and T. A. McMahon, 2002: Global ENSO-streamflow teleconnection, streamflow forecasting and interannual variability. Hydrological Sciences Journal, 47 (3), 505–522, doi:10.1080/02626660209492950.
Chiew, F. H. S. et al., 2014: Observed hydrologic non-stationarity in far south-eastern Australia: implications for modelling and prediction. Stochastic Environmental Research and Risk Assessment , 28 (1), 3–15, doi:10.1007/s00477-013-0755-5.
Chiew, F. H. S. et al., 2017: Future runoff projections for Australia and science challenges in producing next generation projections. In: 22nd International Congress on Modelling and Simulation (MODSIM 2017) , 2017/12, International Congress on Modelling and Simulation (MODSIM),, 1745–1751.
Chinn, W. G. H. and T. J. H. Chinn, 2020: Tracking the snow line: Responses to climate change by New Zealand alpine invertebrates. Arctic, Antarctic, and Alpine Research, 52 (1), 361–389, doi:10.1080/15230430.2020.1773033.
Chiswell, S. M. and P. J. H. Sutton, 2020: Relationships between long-term ocean warming, marine heat waves and primary production in the New Zealand region. null, 54 (4), 614–635, doi:10.1080/00288330.2020.1713181.
Christie, J. et al., 2020: Department of Conservation climate change adaptation action plan. Department of Conservation New Zealand, Wellington, New Zealand, 80.
Clark, S. et al., 2021: Downscaled GCM climate projections of fire weather over Victoria, Australia. Part 2*: a multi-model ensemble of 21st century trends. International Journal of Wildland Fire, doi:10.1071/wf20175.
Clarke, H. and J. P. Evans, 2019: Exploring the future change space for fire weather in southeast Australia. Theoretical and Applied Climatology, 136 (1-2), 513–527, doi:10.1007/s00704-018-2507-4.
Clarke, H. et al., 2020: The Proximal Drivers of Large Fires: A Pyrogeographic Study. Front Earth Sci. Chin. , 8, 90, doi:10.3389/feart.2020.00090.
Clarvis, M. H., E. Bohensky and M. Yarime, 2015: Can Resilience Thinking Inform Resilience Investments? Learning from Resilience Principles for Disaster Risk Reduction. Sustain. Sci. Pract. Policy, 7 (7), 9048–9066, doi:10.3390/su7079048.
Cleeland, J. B. et al., 2019: Factors influencing the habitat use of sympatric albatrosses from Macquarie Island, Australia. Mar. Ecol. Prog. Ser. , 609, 221–237, doi:10.3354/meps12811.
Climate Change Commission, 2020: Government plans for economic recovery following the coronavirus pandemic. Climate Change Commission,, Wellington, New Zealand.
Climate Institute, 2012: Coming Ready or Not: Managing climate risks to Australia’s infrastructure. The Climate Institute, Sydney, 31.
Clonan, M. et al., 2020: Impact of climate change on flowering induction in mangoes in the Northern Territory. Earth Systems and Climate Change Hub, Earth Systems and Climate Change Hub, 66 [Available at: https://nespclimate.com.au/wp-content/uploads/2019/05/CC-NT-mango-flowering-TR-final.pdf ].
CMSI, 2020: Scenario analysis of climate-related physical risk for buildings and infrastructure: Climate science guidance. Climate Measurement Standards Initiative, 12 [Available at: https://uploads-ssl.webflow.com/5f1bdaf710347301b0c01fd4/5f5c2f4cb000cab9c03025d8_CMSI%20-%20Climate%20Science%20Technical%20Summary.pdf ].
CoA, 2015: National Climate Resilience and Adaptation Strategy. Commonwealth of Australia, 80 [Available at: https://www.environment.gov.au/system/files/resources/3b44e21e-2a78-4809-87c7-a1386e350c29/files/national-climate-resilience-and-adaptation-strategy.pdf ].
CoA, 2017: Stability and Affordability: Forging a path to Australia’s renewable energy future. Senate Select Committee into the Resilience of Electricity Infrastructure in a Warming World, Commonwealth of Australia, 176 [Available at: https://pdfroom.com/books/stability-and-affordability-forging-a-path-to-australias-renewable-energy-future/avd94pnO5KD ].
CoA, 2018a: Current and future impacts of climate change on housing, buildings and infrastructure. Environment and Communications References Committee, Canberra, Australia, 222.
CoA, 2018b: National disaster risk reduction framework. Commonwealth of Australia, 23 [Available at: https://www.homeaffairs.gov.au/emergency/files/national-disaster-risk-reduction-framework.pdf ].
CoA, 2019a: Joint Agency Drought Taskforce. Developing a Commonwealth Strategy for Drought Preparedness and Resilience. Consultations. Department of the Prime Minister and Cabinet,, Canberra
CoA, 2019b: State party report on the state of conservation of the great barrier reef world heritage area (Australia). Department of the Environment and Energy, 68 [Available at: https://www.environment.gov.au/system/files/resources/bfcd4506-2d94-4dc4-9eab-2cc97b931fac/files/gbr-state-party-report-2019.pdf ].
CoA, 2020a: Estimating greenhouse gas emissions from bushfires in Australia’s temperate forests: focus on 2019-20. Australian Government, Department of Industry Science Energy and Resources, 17 [Available at: https://apo.org.au/node/308455 ].
CoA, 2020b: A national approach to national disasters. Department of the Prime Minister and Cabinet, Canberra, Australia [Available at: https://pmc.gov.au/resource-centre/pmc/national-approach-national-disasters ].
CoA, 2020c: Population Statement . Commonwealth of Australia, 21 [Available at: https://population.gov.au/docs/population_statement_2020_overview.pdf ].
CoA, 2020d: Royal Commission into National Natural Disaster Arrangements. Australian Government—Attorney General’s Department, Canberra, Australia, 594 [Available at: https://naturaldisaster.royalcommission.gov.au/system/files/2020-11/Royal%20Commission%20into%20National%20Natural%20Disaster%20Arrangements%20-%20Report%20%20%5Baccessible%5D.pdf ].
CoA, 2020e: Royal Commission Into National Natural Disaster Arrangements Appendices: Volumes 1-2—Volume 2. Australian Government—Attorney General’s Department,, Canberra, Australia, 594 pp.
COAG, 2011: National Strategy for Disaster Resilience. Council of Australian Governments [Available at: https://knowledge.aidr.org.au/media/2153/nationalstrategyfordisasterresilience.pdf ].
Cobon, D. H. et al., 2020: Native pastures and beef cattle show a spatially variable response to a changing climate in Queensland, Australia. European Journal of Agronomy, 114, 126002, doi:10.1016/j.eja.2020.126002.
Cocolas, N., G. Walters and L. Ruhanen, 2015: Behavioural adaptation to climate change among winter alpine tourists: an analysis of tourist motivations and leisure substitutability. J. Sustainable Tour. , 24 (6), 846–865, doi:10.1080/09669582.2015.1088860.
Coenen, L. et al., 2020: Metropolitan governance in action? Learning from metropolitan Melbourne’s urban forest strategy. Australian Planner, 1–5, doi:10.1080/07293682.2020.1740286.
Coenen, L., K. Davidson and B. Gleeson, 2019: Situating C40 in the Evolution of Networked Urban Climate Governance. Global Policy, 10 (4), 723–725, doi:10.1111/1758-5899.12759.
Colberg, F., K. L. McInnes, J. O’Grady and R. Hoeke, 2019: Atmospheric circulation changes and their impact on extreme sea levels around Australia. Natural Hazards and Earth System Sciences, 19 (5), 1067–1086, doi:10.5194/nhess-19-1067-2019.
Colliar, J. and P. E. Blackett, 2018: Tangoio Climate Change Adaptation Decision Model: A process for exploring adaptation pathways for Tangoio Marae[Hn, P. f. M.-T. T. and N. C. R. Deep South National Science Challenge (eds.)]. National Institute of Water & Atmospheric Research Ltd., Hamilton, New Zealand.
Collins, D., K. Montgomery and C. Zammit, 2018a: Hydrological projections for New Zealand rivers under climate change. Ministry for the Environment, Wellington, N.Z. [Available at: http://www.mfe.govt.nz/sites/default/files/media/Climate%20Change/Hydrological%20projections%20report-final.pdf ].
Collins, K. M., O. F. Price and T. D. Penman, 2018b: Suppression resource decisions are the dominant influence on containment of Australian forest and grass fires. J. Environ. Manage. , 228, 373–382, doi:10.1016/j.jenvman.2018.09.031.
Collins, L., 2020: Eucalypt forests dominated by epicormic resprouters are resilient to repeated canopy fires. Journal of Ecology, 108 (1), 310–324, doi:10.1111/1365-2745.13227.
Collins, L. et al., 2021: The 2019/2020 mega-fires exposed Australian ecosystems to an unprecedented extent of high-severity fire. Environmental Research Letters, 16 (4), 044029, doi:10.1088/1748-9326/abeb9e.
Colloff, M. J. et al., 2016: Adaptation services of floodplains and wetlands under transformational climate change. Ecological Applications, 26 (4), 1003–1017, doi:10.1890/15-0848.
Condie, S. A., E. C. J. Oliver and G. M. Hallegraeff, 2019: Environmental drivers of unprecedented Alexandrium catenella dinoflagellate blooms off eastern Tasmania, 2012–2018. Harmful Algae, 87, 101628, doi:10.1016/j.hal.2019.101628.
Conroy, G. C., Y. Shimizu-Kimura, R. W. Lamont and S. M. Ogbourne, 2019: A multidisciplinary approach to inform assisted migration of the restricted rainforest tree, Fontainea rostrata. PLOS ONE, 14 (1), doi:10.1371/journal.pone.0210560.
Correia, D. L. P., A. L. M. Chauvenet, J. M. Rowcliffe and J. G. Ewen, 2015: Targeted management buffers negative impacts of climate change on the hihi, a threatened New Zealand passerine. Biol. Conserv. , 192, 145–153, doi:10.1016/j.biocon.2015.09.010.
Costello, M. J., A. Cheung and N. De Hauwere, 2010a: Surface area and the seabed area, volume, depth, slope, and topographic variation for the world’s seas, oceans, and countries. Environ. Sci. Technol. , 44 (23), 8821–8828, doi:10.1021/es1012752.
Costello, M. J. et al., 2010b: A census of marine biodiversity knowledge, resources, and future challenges. PLOS ONE, 5 (8), e12110, doi:10.1371/journal.pone.0012110.
Coulter, L., S. Serrao-Neumann and E. Coiacetto, 2019: Climate change adaptation narratives: Linking climate knowledge and future thinking. Futures, 111, 57–70, doi:10.1016/j.futures.2019.05.004.
Cradduck, L., G. Warren-Myers and B. Stringer, 2020: Courts’ views on climate change inundation risks for developments: Australian perspectives and considerations for valuers. Journal of European Real Estate Research, 13 (3), 435–453, doi:10.1108/jerer-03-2020-0019.
Cradock-Henry, N., J. Fountain and F. Buelow, 2018a: Transformations for Resilient Rural Futures: The Case of Kaikōura, Aotearoa-New Zealand. Sustainability, 10 (6), 1952.
Cradock-Henry, N. A., 2017: New Zealand kiwifruit growers’ vulnerability to climate and other stressors. Regional Environmental Change, 17 (1), 245–259, doi:10.1007/s10113-016-1000-9.
Cradock-Henry, N. A. et al., 2020a: Climate adaptation pathways for agriculture: Insights from a participatory process. Environmental Science & Policy, 107, 66–79, doi:10.1016/j.envsci.2020.02.020.
Cradock-Henry, N. A., J. Connolly, P. Blackett and J. Lawrence, 2020b: Elaborating a systems methodology for cascading climate change impacts and implications. MethodsX, 7, 100893, doi:10.1016/j.mex.2020.100893.
Cradock-Henry, N. A. et al., 2019: Adaptation knowledge for New Zealand’s primary industries: Known, not known and needed. Climate Risk Management , 25, 100190, doi:10.1016/j.crm.2019.100190.
Cradock-Henry, N. A. and J. Fountain, 2019: Characterising resilience in the wine industry: Insights and evidence from Marlborough, New Zealand. Environmental Science & Policy, 94, 182–190, doi:10.1016/j.envsci.2019.01.015.
Cradock-Henry, N. A. et al., 2018b: Dynamic adaptive pathways in downscaled climate change scenarios. Climatic Change, 150 (3–4), 333–341, doi:10.1007/s10584-018-2270-7.
Cradock-Henry, N. A. and K. McKusker, 2015: Impacts, indicators and thresholds in sheep and beef land management systems. Ministry for Primary Industries, Wellington, N.Z.
Crase, L., 2011: The Fallout to the Guide to the Proposed Basin Plan. Australian Journal of Public Administration, 70 (1), 84–93, doi:10.1111/j.1467-8500.2011.00714.x.
Cresswell, I. D. and H. T. Murphy, 2017: Australia state of the environment 2016: biodiversity, independent report to the Australian Government Minister for the Environment and Energy. State of environment report, Australian Government Department of the Environment and Energy, Canberra.
Crnek-Georgeson, K., L. Wilson and A. Page, 2017: Factors influencing suicide in older rural males: a review of Australian studies. Rural and Remote Health, 17 (4), doi:10.22605/rrh4020.
CRO Forum, 2019: The heat is on: Insurability and Resilience in a Changing Climate Emerging Risk Initiative—Position Paper. 52 [Available at: www.thecroforum.org ].
Crosbie, R. S. et al., 2013: An assessment of the climate change impacts on groundwater recharge at a continental scale using a probabilistic approach with an ensemble of GCMs. Climatic Change, 117 (1-2), 41–53, doi:10.1007/s10584-012-0558-6.
Crous, K. Y. et al., 2013: Photosynthesis of temperate Eucalyptus globulus trees outside their native range has limited adjustment to elevated CO2 and climate warming. Glob. Chang. Biol. , 19 (12), 3790–3807, doi:10.1111/gcb.12314.
Croxall, J. P. et al., 2012: Seabird conservation status, threats and priority actions: a global assessment. Bird Conserv. Int. , 22 (01), 1–34, doi:10.1017/s0959270912000020.
CSIRO, 2008: Water Availability in the Murray-Darling Basin A report from CSIRO to the Australian Government . Commonwealth Scientific Industrial and Research Organisation, 67 [Available at: https://publications.csiro.au/rpr/download?pid=legacy:530&dsid=DS1 ].
CSIRO, 2014: Climate change adaptation tools and resources for NRM. https://adaptnrm.csiro.au. Commonwealth Scientific Industrial and Research Organisation,.
CSIRO, 2018: Climate change in the Torres Strait: Implications for fisheries and marine ecosystems. Earth Systems and Climate Change, 4, 40.
CSIRO, 2019: Australian National Outlook 2019 -. Commonwealth Scientific and Industrial Research Organisation, Canberra, Australia [Available at: https://www.csiro.au/en/Showcase/ANO ].
CSIRO, 2020: Climate and Disaster Resilience: Technical Reports. CSIRO, Australia., Commonwealth Scientific Industrial and Research Organisation, 60 [Available at: https://www.csiro.au/en/Research/Environment/Extreme-Events/Bushfire/frontline-support/report-climate-disaste-resilience ].
CSIRO and BOM, 2015: Climate Change in Australia Information for Australia’s Natural Resource Management Regions. CSIRO and Bureau of Meteorology, Melbourne, Australia.
Cullen, B. R. et al., 2009: Climate change effects on pasture systems in south-eastern Australia. Crop and Pasture Science, 60 (10), doi:10.1071/cp09019.
Cullen, B. R. et al., 2014: Use of modelling to identify perennial ryegrass plant traits for future warmer and drier climates %J Crop and Pasture Science. 65 (8), 758–766, doi: https://doi.org/10.1071/CP13408.
Cummings, V. J. et al., 2021: Assessment of potential effects of climate-related changes in coastal and offshore waters on New Zealand’s seafood sector. New Zealand Aquatic Environment and Biodiversity, Wellington, New Zealand, 153.
Cummings, V. J. et al., 2019: Effect of reduced pH on physiology and shell integrity of juvenile (pāua) from New Zealand. PeerJ, 7, e7670, doi:10.7717/peerj.7670.
Cunningham, R. et al., 2017: Social network analysis: a primer on engaging communities on climate adaptation in New South Wales, Australia. Institute for Sustainable Futures, New South Wales, Australia.
Cunningham, S. C., A. M. Smith and M. D. Lamare, 2016: The effects of elevated CO2 on growth, shell production and metabolism of cultured juvenile abalone, Haliotis iris. Aquaculture Research, 47 (8), 2375–2392, doi:10.1111/are.12684.
D. Collins, B. G., 2020: New Zealand River Hydrology under Late 21st Century Climate Change. Water, 12 (8), 2175, doi:10.3390/w12082175.
D. Frame et al., 2018: Estimating financial costs of climate change in New Zealand: An estimate of climate change-related weather event costs. New Zealand Climate Change Research Institute and NIWA, Wellington, New Zealand, 18.
Dai, A. and T. Zhao, 2017: Uncertainties in historical changes and future projections of drought. Part I: estimates of historical drought changes. Climatic Change, 144 (3), 519–533, doi:10.1007/s10584-016-1705-2.
Dale, A. et al., 2018: Traditional Owners of the Great Barrier Reef: The Next Generation of Reef 2050 Actions. [Available at: https://www.environment.gov.au/system/files/resources/7b495328-8097-4aab-84aa-67b2a9e789fb/files/reef-2050-traditional-owner-aspirations-report.pdf ].
Darbyshire, R., P. Measham and I. Goodwin, 2016: A crop and cultivar-specific approach to assess future winter chill risk for fruit and nut trees. Climatic Change, 137 (3–4), 541–556, doi:10.1007/s10584-016-1692-3.
Darwin City Council, 2011: Climate Change Action Plan 2011–2020. Climate Change & Environment, Darwin City Council, 47 [Available at: https://www.darwin.nt.gov.au/sites/default/files/publications/attachments/cod_climatechangeactionplan_web.pdf ].
Das, S. et al., 2019: Identifying climate refugia for 30 Australian rainforest plant species, from the last glacial maximum to 2070. Landscape Ecology, 34 (12), 2883–2896, doi:10.1007/s10980-019-00924-6.
Davey, S. M. and A. Sarre, 2020: Editorial: the 2019/20 Black Summer bushfires. Australian Forestry, 83 (2), 47–51, doi:10.1080/00049158.2020.1769899.
Davidson, K. and B. Gleeson, 2018: New Socio-ecological Imperatives for Cities: Possibilities and Dilemmas for Australian Metropolitan Governance. Urban Policy and Research, 36 (2), 230–241, doi:10.1080/08111146.2017.1354848.
Davies, A., L. Lockstone-Binney and K. Holmes, 2018: Who are the future volunteers in rural places? Understanding the demographic and background characteristics of non-retired rural volunteers, why they volunteer and their future migration intentions. Journal of Rural Studies, 60, 167–175, doi:10.1016/j.jrurstud.2018.04.003.
Day, P. B., R. D. Stuart-Smith, G. J. Edgar and A. E. Bates, 2018: Species’ thermal ranges predict changes in reef fish community structure during 8 years of extreme temperature variation. Diversity and Distributions, 24 (8), 1036–1046, doi:10.1111/ddi.12753.
DCCEE, 2011: Climate Change Risks to Coastal Buildings and Infrastructure: A supplement to the first pass national assessment . Australian Government Department of Climate Change and Energy Efficiency,, Canberra, Australia, 20 [Available at: https://www.environment.gov.au/system/files/resources/0f56e5e6-e25e-4183-bbef-ca61e56777ef/files/risks-coastal-buildings.pdf ].
de Jesus, A. L. et al., 2020: Two decades of trends in urban particulate matter concentrations across Australia. Environ. Res. , 190, 110021, doi:10.1016/j.envres.2020.110021.
de Kantzow, M. C., P. M. Hick, N. K. Dhand and R. J. Whittington, 2017: Risk factors for mortality during the first occurrence of Pacific Oyster Mortality Syndrome due to Ostreid herpesvirus – 1 in Tasmania, 2016. Aquaculture, 468, 328–336, doi:10.1016/j.aquaculture.2016.10.025.
De, L. L. et al., 2016: Our family comes first: migrants’ perspectives on remittances in disaster. Migration and Development , 5 (1), 130–148, doi:10.1080/21632324.2015.1017971.
Death, R. G., I. C. Fuller and M. G. Macklin, 2015: Resetting the river template: the potential for climate-related extreme floods to transform river geomorphology and ecology. Freshw. Biol. , 60 (12), 2477–2496, doi:10.1111/fwb.12639.
DeCarlo, T. M. et al., 2019: Acclimatization of massive reef-building corals to consecutive heatwaves. Proc. Biol. Sci. , 286 (1898), 20190235, doi:10.1098/rspb.2019.0235.
Dedekorkut-Howes, A., E. Torabi and M. Howes, 2020: Planning for a different kind of sea change: lessons from Australia for sea level rise and coastal flooding. Climate Policy, 1–19, doi:10.1080/14693062.2020.1819766.
Dedekorkut-Howes, A. and J. Vickers, 2017: Coastal Climate Adaptation at the Local Level: A Policy Analysis of the Gold Coast. In: Climate Change Adaptation in Pacific Countries. Springer International Publishing,, Switzerland, 401–415.
DEHP, 2013: Coastal Management Plan. Department of Environment and Heritage Protection, Australia,16 pp.
Delany-Crowe, T. et al., 2019: Australian policies on water management and climate change: are they supporting the sustainable development goals and improved health and well-being?Global. Health, 15 (1), 68, doi:10.1186/s12992-019-0509-3.
Dell, J. T. et al., 2015: Potential impacts of climate change on the distribution of longline catches of yellowfin tuna (Thunnus albacares) in the Tasman sea. Deep Sea Res. Part 2 Top. Stud. Oceanogr. , 113, 235–245, doi:10.1016/j.dsr2.2014.07.002.
Della Bosca, H. and J. Gillespie, 2020: Bringing the swamp in from the periphery: Australian wetlands as sites of climate resilience and political agency. null, 63 (9), 1616–1632, doi:10.1080/09640568.2019.1679100.
Dellink, R., E. Lanzi and J. Chateau, 2019: The Sectoral and Regional Economic Consequences of Climate Change to 2060. Environmental and Resource Economics, 72 (2), 309–363, doi:10.1007/s10640-017-0197-5.
Deloitte, 2016: The economic cost of the social impact of natural disasters. Deloitte Access Economics, Sydney, Australia, 116 [Available at: http://australianbusinessroundtable.com.au/assets/documents/Report%20-%20Social%20costs/Report%20-%20The%20economic%20cost%20of%20the%20social%20impact%20of%20natural%20disasters.pdf ].
Deloitte, 2017a: Beyond the noise: The megatrends of tomorrow’s world. Deloitte Consulting, München [Available at: https://www2.deloitte.com/content/dam/Deloitte/nl/Documents/public-sector/deloitte-nl-ps-megatrends-2ndedition.pdf ].
Deloitte, 2017b: Building resilience to natural disasters in our states and territories. Deloitte Access Economics, Sydney, Australia, 120 [Available at: https://www2.deloitte.com/au/en/pages/economics/articles/building-australias-natural-disaster-resilience.html ].
Deloitte, 2019: The social and economic cost of the North and Far North Queensland Monsoon Trough. Queensland Reconstruction Authority, Deloitte Access Economics, Sydney, Australia, 36 [Available at: https://www2.deloitte.com/content/dam/Deloitte/au/Documents/Economics/deloitte-au-dae-monsoon-trough-social-economic-cost-report-160719.pdf ].
Deloitte, 2020: A new choice Australia’s climate for growth. Deloitte Access Economics, Brisbane, 74 [Available at: https://www2.deloitte.com/content/dam/Deloitte/au/Documents/Economics/deloitte-au-dae-new-choice-climate-growth.pdf?nc=1 ].
Deloitte Access Economics, 2017: At what price? The economic, social and icon value of the Great Barrier Reef . [Available at: https://www2.deloitte.com/au/en/pages/economics/articles/great-barrier-reef.html #].
Delworth, T. L. and F. Zeng, 2014: Regional rainfall decline in Australia attributed to anthropogenic greenhouse gases and ozone levels. Nature Geoscience, 7 (8), 583–587, doi:10.1038/ngeo2201.
DELWP, 2018: Monitoring, Evaluation, Reporting & Improvement Framework for Climate Change Adaptation in Victoria. Department of Environment Land Water and Planning, Melbourne, Australia, 24 [Available at: https://www.climatechange.vic.gov.au/__data/assets/pdf_file/0033/328884/MERI-Framework-for-climate-change-adaptation-in-Victoria.pdf ].
DELWP, 2020: Victoria’s water in a changing climate. The State of Victoria Department of Environment, Land, Water and Planning, 97 [Available at: https://www.water.vic.gov.au/__data/assets/pdf_file/0024/503718/VICWACl_VictoriasWaterInAChangingClimate_FINAL.pdf ].
DENR, 2020a: Delivering the Climate Change Response: Towards 2050 A Three-Year Action Plan for the Northern Territory Government . Office of Climate Change, D. o. E. a. N. R., Darwin, Australia, 6 [Available at: https://denr.nt.gov.au/__data/assets/pdf_file/0004/904774/northern-territory-climate-change-response-3 year.pdf].
DENR, 2020b: Northern Territory Climate Change Response: Towards 2050. Office of Climate Change, Department of Environment and Natural Resources,, Darwin, Australia,11 pp.
Denys, P. H. et al., 2020: Sea Level Rise in New Zealand: The Effect of Vertical Land Motion on Century-Long Tide Gauge Records in a Tectonically Active Region. Journal of Geophysical Research: Solid Earth, 125 (1), doi:10.1029/2019jb018055.
Department of the Prime Minister and Cabinet, 2019: National Disaster Resilience Strategy. Rautaki ā-Motu Manawaroa Aituā. Ministry of Civil Defence & Emergency Management,, New Zealand,50 pp.
Derner, J. et al., 2018: Vulnerability of grazing and confined livestock in the Northern Great Plains to projected mid- and late-twenty-first century climate. Climatic Change, 146 (1), 19–32, doi:10.1007/s10584-017-2029-6.
DES, 2018: Preparing a shoreline erosion management plan—Guideline for coastal development . Queensland Government, 5 [Available at: https://www.qld.gov.au/__data/assets/pdf_file/0011/107300/gl-cd-preparing-a-shoreline-erosion-management-plan.pdf ].
Dey, R., S. C. Lewis and N. J. Abram, 2019: Investigating observed northwest Australian rainfall trends in Coupled Model Intercomparison Project phase 5 detection and attribution experiments. International Journal of Climatology, 39 (1), 112–127, doi:10.1002/joc.5788.
Dhanjal-Adams, K. L. et al., 2016: The distribution and protection of intertidal habitats in Australia. Emu—Austral Ornithology, 116 (2), 208–214, doi:10.1071/mu15046.
Di Luca, A., J. P. Evans and F. Ji, 2018: Australian snowpack in the NARCliM ensemble: evaluation, bias correction and future projections. Clim. Dyn. , 51 (1), 639–666, doi:10.1007/s00382-017-3946-9.
Di Virgilio, G. et al., 2020: Climate Change Significantly Alters Future Wildfire Mitigation Opportunities in Southeastern Australia. Geophys. Res. Lett. , 47 (15), e2020GL088893, doi:10.1029/2020GL088893.
DIA, 2017a: Report of the Havelock North Drinking Water Inquiry, Stage 1. Government Inquiry into Havelock North Drinking Water, Government of Australia [Available at: https://www.dia.govt.nz/vwluResources/Report-Havelock-North-Water-Inquiry-Stage-1/$file/Report-Havelock-North-Water-Inquiry-Stage-1.pdf ].
DIA, 2017b: Report of the Havelock North Drinking Water Inquiry: Stage 2. Government of Australia, ,296 pp.
Dickie, B., 2020: Climate Change Implications for Local Government of the Resource Management Amendment Act 2020. Resource Management .
Ding, N., H. Berry and L. O’Brien, 2015: The Effect of Extreme Heat on Mental Health – Evidence from Australia. Int. J. Epidemiol. , 44 (suppl_1), i64-i64, doi:10.1093/ije/dyv097.238.
Ding, N., H. L. Berry and C. M. Bennett, 2016: The Importance of Humidity in the Relationship between Heat and Population Mental Health: Evidence from Australia. PLOS ONE, 11 (10), e0164190, doi:10.1371/journal.pone.0164190.
DISER, 2020: Australian energy update 2020. Australian Energy Statistics, 38 [Available at: https://www.energy.gov.au/government-priorities/energy-data/australian-energystatistics ].
Dittus, A. J., D. J. Karoly, S. C. Lewis and L. V. Alexander, 2014: An investigation of some unexpected frost day increases in Southern Australia. Australian Meteorological and Oceanographic Journal, 64, 261–271, doi:10.22499/2.6404.002.
Do, H. X. et al., 2020: Historical and future changes in global flood magnitude – evidence from a model–observation investigation. Hydrology and Earth System Sciences, 24 (3), 1543–1564, doi:10.5194/hess-24-1543-2020.
DoC NZ, 2010: New Zealand Coastal Policy Statement 2010. Department of Conservation,, New Zealand 30 [Available at: https://www.doc.govt.nz/globalassets/documents/conservation/marine-and-coastal/coastal-management/nz-coastal-policy-statement-2010.pdf ].
DoC NZ, 2017a: NZCPS 2010 Guidance Note: Coastal Hazards. Objective 5 and Policies 24, 25, 26 & 27. Department of Conservation, , New Zealand,102 pp.
DoC NZ, 2017b: NZCPS 2010 implementation guidance introductory note. Department of Conservation,, New Zealand,8 pp.
Docker, B. and I. Robinson, 2014: Environmental water management in Australia: experience from the Murray-Darling Basin. International Journal of Water Resources Development , 30 (1), 164–177, doi:10.1080/07900627.2013.792039.
Doherty, M. D., A. Malcolm Gill, G. J. Cary and M. P. Austin, 2017: Seed viability of early maturing alpine ash (Eucalyptus delegatensis subsp. delegatensis) in the Australian Alps, south-eastern Australia, and its implications for management under changing fire regimes. Australian Journal of Botany, 65 (7), 517, doi:10.1071/bt17068.
Dominey-Howes, D., A. Gorman-Murray and S. McKinnon, 2016: Emergency management response and recovery plans in relation to sexual and gender minorities in New South Wales, Australia. International Journal of Disaster Risk Reduction, 16, 1–11.
Donat, M. G. et al., 2016: More extreme precipitation in the world’s dry and wet regions. Nature Climate Change, 6 (5), 508–513, doi:10.1038/nclimate2941.
Doubleday, Z. A. et al., 2013: Assessing the risk of climate change to aquaculture: a case study from south-east Australia. Aquaculture Environment Interactions, 3 (2), 163–175, doi:10.3354/aei00058.
Douglas Shire Council, 2019: Resilient Coast Strategic Plan. Douglas Shire Council, 97 [Available at: https://douglas.qld.gov.au/download/resilient_coast/Resilient-Coast-Strategic-Plan.pdf ].
Dowdy, A. and A. Pepler, 2018: Pyroconvection risk in Australia: Climatological changes in atmospheric stability and surface fire weather conditions. Geophys. Res. Lett. , 45(4) , 2005–2013.
Dowdy, A. J., 2020: Climatology of thunderstorms, convective rainfall and dry lightning environments in Australia. Climate Dynamics, 54 (5-6), 3041–3052, doi:10.1007/s00382-020-05167-9.
Dowdy, A. J. et al., 2019: Future changes in extreme weather and pyroconvection risk factors for Australian wildfires. Sci. Rep. , 9 (1), 10073, doi:10.1038/s41598-019-46362-x.
Downing, K., R. Jones and B. Singley, 2016: Handout or Hand-up: Ongoing Tensions in the Long History of Government Response to Drought in Australia. Australian Journal of Politics & History, 62, 186–202.
Dreccer, M. F. et al., 2018: Comparison of sensitive stages of wheat, barley, canola, chickpea and field pea to temperature and water stress across Australia. Agricultural and Forest Meteorology, 248, 275–294.
Drill, A., S. Paddam and S. Wong, 2016: Climate Risk Management for Financial Institutions. Actuaries Institute, Australia.
Duan, H., G. Huang, S. Zhou and D. Tissue, 2018: Dry mass production, allocation patterns and water use efficiency of two conifers with different water use strategies under elevated [CO2], warming and drought conditions. Eurpoean Journal of Forest Research, 137, 605–618.
Dudney, J. et al., 2018: Navigating Novelty and Risk in Resilience Management. Trends in Ecology & Evolution, 33 (11), 863–873, doi:10.1016/j.tree.2018.08.012.
Duke, N. C. et al., 2017: Large-scale dieback of mangroves in Australia’s Gulf of Carpentaria: a severe ecosystem response, coincidental with an unusually extreme weather event. Mar. Freshwater Res. , 68 (10), 1816–1829.
Dun et al., 2018: Recognising knowledge transfers in ‘unskilled’and ‘low-skilled’international migration: insights from Pacific Island seasonal workers in rural Australia. Asia Pac. Viewp. , 59, 276–292.
Duncan, R., 2014: Regulating agricultural land use to manage water quality: The challenges for science and policy in enforcing limits on non-point source pollution in New Zealand. Land use policy, 41, 378–387, doi:10.1016/j.landusepol.2014.06.003.
Dunlop, M. et al., 2016: Exploring Adaptation Pathways in the Murray Basin. CSIRO, Australia.
Dunn, R. J. H. et al., 2020: Development of an updated global land in situ-based data set of temperature and precipitation extremes: HadEX3. J. Geophys. Res. , 125 (16), e2019JD032263, doi:10.1029/2019jd032263.
Duursma, D. E. et al., 2013: Next-generation invaders? Hotspots for naturalised sleeper weeds in Australia under future climates. PLOS ONE, 8 (12), e84222, doi:10.1371/journal.pone.0084222.
Eadie, Laura and C. Hoisington, 2011: Stocking Up: Securing our marine economy. Centre for Policy Development, 72 [Available at: https://cpd.org.au/wp-content/uploads/2011/09/stocking-up_final_for-web.pdf ].
Eagles, H. A. et al., 2014: Ppd1, Vrn1, ALMT1 and Rht genes and their effects on grain yield in lower rainfall environments in southern Australia. Crop and Pasture Science, 65 (2), doi:10.1071/cp13374.
Edwards, P. et al., 2019: Tools for adaptive governance for complex social-ecological systems: a review of role-playing-games as serious games at the community-policy interface. Environ. Res. Lett. , 14 (11), 113002, doi:10.1088/1748-9326/ab4036.
Egan, E., J.-M. Woolley and E. Williams, 2020: Climate Change Vulnerability Assessment of Selected Taonga Species. NIWA, 90 [Available at: https://waimaori.maori.nz/wp-content/uploads/2020/09/2020073CH_Report_FINAL_15April-Technical-Report.pdf ].
Ekström, M., M. R. Grose and P. H. Whetton, 2015: An appraisal of downscaling methods used in climate change research. Wiley Interdiscip. Rev. Clim. Change, 6 (3), 301–319, doi:10.1002/wcc.339.
Eldridge, D. J. and G. Beecham, 2018: The Impact of Climate Variability on Land Use and Livelihoods in Australia’s Rangelands. In: Climate Variability Impacts on Land Use and Livelihoods in Drylands [Gaur, M. and V. Squires (eds.)]. Springer Cham,, 293–315.
Ellis, N. R. and G. A. Albrecht, 2017: Climate change threats to family farmers’ sense of place and mental wellbeing: A case study from the Western Australian Wheatbelt. Soc. Sci. Med. , 175, 161–168, doi:10.1016/j.socscimed.2017.01.009.
Elrick-Barr, C., D. Thomsen, B. Preston and T. Smith, 2017: Perceptions matter: household adaptive capacity and capability in two Australian coastal communities. Regional Environ. Change, 17, 1141–1151.
Elrick-Barr, C. E. and T. F. Smith, 2021: Policy is rarely intentional or substantial for coastal issues in Australia. Ocean & Coastal Management , 207, 105609, doi:10.1016/j.ocecoaman.2021.105609.
Elrick-Barr, C. E. et al., 2016: How are coastal households responding to climate change?Environ. Sci. Policy, 63, 177–186, doi:10.1016/j.envsci.2016.05.013.
Enright, N. J. et al., 2015: Interval squeeze: altered fire regimes and demographic responses interact to threaten woody species persistence as climate changes. Frontiers in Ecology and the Environment , 13 (5), 265–272, doi:10.1890/140231.
Erhart, D. et al., 2020: Climate Risk Management Framework for Queensland Local Government . Local Government Association Queensland [Available at: https://qcrc.lgaq.asn.au/climate-risk-management-framework1 ].
Eriksen, C., 2014: Gendered Risk Engagement: Challenging the Embedded Vulnerability, Social Norms and Power Relations in Conventional Australian Bushfire Education. Geographical Research, 52 (1), 23–33, doi:10.1111/1745-5871.12046.
Eriksen, C., 2019: Negotiating adversity with humour: A case study of wildland firefighter women. Political Geography, 68, 139–145, doi:10.1016/j.polgeo.2018.08.001.
ESCI, 2021: Electricity Sector Climate Information Project Final Report . 58 [Available at: https://www.climatechangeinaustralia.gov.au/en/projects/esci/esci-publications/esci-project-reports/ ].
Espada, R., Jr., A. Apan and K. McDougall, 2015: Vulnerability assessment and interdependency analysis of critical infrastructures for climate adaptation and flood mitigation. International Journal of Disaster Resilience in the Built Environment , 6 (3), 313–346, doi:10.1108/ijdrbe-02-2014-0019.
Etchells, H., A. J. O’Donnell, W. Lachlan McCaw and P. F. Grierson, 2020: Fire severity impacts on tree mortality and post-fire recruitment in tall eucalypt forests of southwest Australia. For. Ecol. Manage. , 459, 117850, doi:10.1016/j.foreco.2019.117850.
Evans, J., M. Kay, A. Prasad and A. Pitman, 2018: The resilience of Australian wind energy to climate change. Environ. Res. Lett. , 13, doi: https://doi.org/10.1088/1748-9326/aaa632.
Evans, J. P., D. Argueso, R. Olson and A. Di Luca, 2017: Bias-corrected regional climate projections of extreme rainfall in south-east Australia. Theoretical and Applied Climatology, 130 (3-4), 1085–1098, doi:10.1007/s00704-016-1949-9.
Evans, J. P. and M. F. McCabe, 2013: Effect of model resolution on a regional climate model simulation over southeast Australia. Climate Research, 56 (2), 131–145, doi:10.3354/cr01151.
Evans, L., T. L. Milfont and J. Lawrence, 2014: Considering local adaptation increases willingness to mitigate. Global Environmental Change, 25, 69–75, doi:10.1016/j.gloenvcha.2013.12.013.
Evans, L. S. et al., 2016: Structural and psycho-social limits to climate change adaptation in the Great Barrier Reef Region. PLOS ONE, 11 (3), e0150575.
Every, D., 2016: Disaster Risk Education Community Connections and Emergency Communication with People who are Homeless. Victoria State Emergency Service, Victoria, Australia, 29.
Fairman, T. A., C. R. Nitschke and L. T. Bennett, 2016: Too much, too soon? A review of the effects of increasing wildfire frequency on tree mortality and regeneration in temperate eucalypt forests. International Journal of Wildland Fire, 25 (8), 831, doi:10.1071/wf15010.
Fastenrath, S., L. Coenen and K. Davidson, 2019: Urban Resilience in Action: the Resilient Melbourne Strategy as Transformative Urban Innovation Policy?Sustain. Sci. Pract. Policy, 11 (3), 693, doi:10.3390/su11030693.
Fatorić, S., R. Morén-Alegret, R. J. Niven and G. Tan, 2017: Living with climate change risks: stakeholders’ employment and coastal relocation in mediterranean climate regions of Australia and Spain. Environment Systems and Decisions, 37 (3), 276–288, doi:10.1007/s10669-017-9629-6.
Fazey, I. et al., 2015: Past and future adaptation pathways. Climate and Development , 1–19, doi:10.1080/17565529.2014.989192.
FENZ, 2018: Annual return of fires database, 1991/92–2017/18. Fire and Emergency New Zealand, Wellington.
Ferrario, F. et al., 2014: The effectiveness of coral reefs for coastal hazard risk reduction and adaptation. Nat. Commun. , 5, 3794, doi:10.1038/ncomms4794.
Fiddes, S. L., A. B. Pezza and V. Barras, 2015: A new perspective on Australian snow. Atmospheric Science Letters, 16 (3), 246–252, doi:10.1002/asl2.549.
Fielke, S. J. and M. S. Srinivasan, 2018: Co-innovation to increase community resilience: influencing irrigation efficiency in the Waimakariri Irrigation Scheme. Sustainability Science, 13 (1), 255–267, doi:10.1007/s11625-017-0432-6.
Filbee-Dexter, K. and T. Wernberg, 2020: Author Correction: Substantial blue carbon in overlooked Australian kelp forests. Sci. Rep. , 10 (1), 17253, doi:10.1038/s41598-020-74313-4.
Filho, W. et al., 2018: Coping with the impacts of urban heat islands. A literature based study on understanding urban heat vulnerability and the need for resilience in cities in a global climate change context. J. Clean. Prod. , 171, 1140–1149, doi:10.1016/j.jclepro.2017.10.086.
Filkov, A. I. et al., 2020: Impact of Australia’s catastrophic 2019/20 bushfire season on communities and environment. Retrospective analysis and current trends. Journal of Safety Science and Resilience, 1 (1), 44–56, doi:10.1016/j.jnlssr.2020.06.009.
Finlayson, C. M. et al., 2017: Policy considerations for managing wetlands under a changing climate. Mar. Freshwater Res. , 68 (10), 1803–1815, doi:10.1071/mf16244.
Firn, J. et al., 2015: Priority threat management of invasive animals to protect biodiversity under climate change. Glob. Chang. Biol. , 21 (11), 3917–3930, doi:10.1111/gcb.13034.
Fitzer, S. C. et al., 2019: Selectively bred oysters can alter their biomineralization pathways, promoting resilience to environmental acidification. Glob. Chang. Biol. , doi:10.1111/gcb.14818.
Fitzer, S. C. et al., 2018: Coastal acidification impacts on shell mineral structure of bivalve mollusks. Ecol. Evol. , 8 (17), 8973–8984, doi:10.1002/ece3.4416
Fitzgerald, G. et al., 2019: Long-term consequences of flooding: A case study of the 2011 Queensland floods. Aust. J. Emerg. Manage. , 34 (1), 35.
Fitzgerald, G. J. et al., 2016: Elevated atmospheric [CO2] can dramatically increase wheat yields in semi-arid environments and buffer against heat waves. Global Change Biology, 22 (6), 2269–2284, doi:10.1111/gcb.13263.
Fleming, A. et al., 2015: Climate change is the least of my worries”Anführungszeichen nicht ausgeglichen. Bitte prüfen Sie den Absatz. : stress limitations on adaptive capacity. Rural Society, 24 (1), 24–41.
Fleming, A. et al., 2014: Climate change risks and adaptation options across Australian seafood supply chains – A preliminary assessment. Climate Risk Management , 1, 39–50.
Fletcher, A. L. et al., 2020: Has historic climate change affected the spatial distribution of water-limited wheat yield across Western Australia?Climatic Change, doi:10.1007/s10584-020-02666-w.
Fletcher, S. M. et al., 2013: Traditional coping strategies and disaster response: examples from the South Pacific region. J. Environ. Public Health, 2013, 264503–264503, doi:10.1155/2013/264503.
Flood, S., N. A. Cradock-Henry, P. Blackett and P. Edwards, 2018: Adaptive and interactive climate futures: systematic review of ‘serious games’ for engagement and decision-making. Environ. Res. Lett. , 13 (6), 063005.
Fogarty, H. E., C. Cvitanovic, A. J. Hobday and G. T. Pecl, 2019: Prepared for change? An assessment of the current state of knowledge to support climate adaptation for Australian fisheries. Rev. Fish Biol. Fish. , 29 (4), 877–894, doi:10.1007/s11160-019-09579-7.
Fogarty, H. E., C. Cvitanovic, A. J. Hobday and G. T. Pecl, 2021: Stakeholder perceptions on actions for marine fisheries adaptation to climate change. Mar. Freshwater Res. , doi:10.1071/MF21055.
Foote, K. J., M. K. Joy and R. G. Death, 2015: New Zealand Dairy Farming: Milking Our Environment for All Its Worth. Environ. Manage. , 56 (3), 709–720, doi:10.1007/s00267-015-0517-x.
Ford, M. R. and M. E. Dickson, 2018: Detecting ebb-tidal delta migration using Landsat imagery. Marine Geology, 405, 38–46, doi:10.1016/j.margeo.2018.08.002.
Forino, G., J. von Meding and G. Brewer, 2019: Community based initiatives to mainstream climate change adaptation into disaster risk reduction: evidence from the Hunter Valley (Australia). Local Environment , 24 (1), 52–67, doi:10.1080/13549839.2018.1548010.
Forino, G., J. von Meding and G. J. Brewer, 2017: Climate Change Adaptation and Disaster Risk Reduction Integration in Australia: Challenges and Opportunities. International Journal of Disaster Resilience in the Built Environment , 9 (1), 273–294, doi:10.1108/IJDRBE-05-2017-0038.
Foster, T. et al., 2015: Effect of ocean warming and acidification on the early life stages of subtropical Acropora spicifera. Coral Reefs, 34 (4), 1217–1226, doi:10.1007/s00338-015-1342-7.
Fowler, K. et al., 2018: Simulating Runoff Under Changing Climatic Conditions: A Framework for Model Improvement. Water Resources Research, 54 (12), 9812–9832, doi:10.1029/2018wr023989.
Fowler, K., R. Morden, L. Lowe and R. Nathan, 2015: Advances in assessing the impact of hillside farm dams on streamflow. Australasian Journal of Water Resources, 19 (2), 96–108, doi:10.1080/13241583.2015.1116182.
Frame, D. J. et al., 2020: Climate change attribution and the economic costs of extreme weather events: a study on damages from extreme rainfall and drought. Climatic Change, doi:10.1007/s10584-020-02729-y.
Friel, S. et al., 2014: The impact of drought on the association between food security and mental health in a nationally representative Australian sample. BMC public health, 14 (1102), doi:10.1186/1471-2458-14-1102.
Fu, G. et al., 2019: Attributing variations of temporal and spatial groundwater recharge: A statistical analysis of climatic and non-climatic factors. Journal of Hydrology, 568, 816–834, doi:10.1016/j.jhydrol.2018.11.022.
Fulton, E. A., C. M. Bulman, H. Pethybridge and S. D. Goldsworthy, 2018: Modelling the Great Australian Bight Ecosystem. Deep Sea Research Part II: Topical Studies in Oceanography, 157–158, 211–235, doi:10.1016/j.dsr2.2018.11.002.
Fünfgeld, H., 2015: Facilitating local climate change adaptation through transnational municipal networks. Current Opinion in Environmental Sustainability, 12, 67–73, doi:10.1016/j.cosust.2014.10.011.
Gallagher, R. V., S. Allen and I. J. Wright, 2019: Safety margins and adaptive capacity of vegetation to climate change. Sci. Rep. , 9 (1), 8241, doi:10.1038/s41598-019-44483-x.
Gallagher, R. V. et al., 2013: The grass may not always be greener: projected reductions in climatic suitability for exotic grasses under future climates in Australia. Biological Invasions, 15 (5), 961–975, doi:10.1007/s10530-012-0342-6.
Gallant, A. J. E., M. J. Reeder, J. S. Risbey and K. J. Hennessy, 2013: The characteristics of seasonal-scale droughts in Australia, 1911–2009. International Journal of Climatology, 33 (7), 1658–1672, doi:10.1002/joc.3540.
Gallego, D., R. García-Herrera, C. Peña-Ortiz and P. Ribera, 2017: The steady enhancement of the Australian Summer Monsoon in the last 200 years. Sci. Rep. , 7 (1), 16166–16166, doi:10.1038/s41598-017-16414-1.
Gardner, J. L. et al., 2014a: Temporal patterns of avian body size reflect linear size responses to broadscale environmental change over the last 50 years. J. Avian Biol. , 45, 529–35.
Gardner, J. L. et al., 2014b: Dynamic size responses to climate change: prevailing effects of rising temperature drive long-term body size increases in a semi-arid passerine. Glob. Chang. Biol. , 20, 2062–2075.
Gardner, J. L. et al., 2018: Associations between changing climate and body condition over decades in two southern hemisphere passerine birds. Clim. Change Res. , 5, 2(1–14).
Garmestani, A. et al., 2019: The Role of Social-Ecological Resilience in Coastal Zone Management: A Comparative Law Approach to Three Coastal Nations. Frontiers in Ecology and Evolution, 7, 410, doi:10.3389/fevo.2019.00410.
Gartin, M. et al., 2020: Climate Change as an Involuntary Exposure: A Comparative Risk Perception Study from Six Countries across the Global Development Gradient. Int. J. Environ. Res. Public Health, 17 (6), doi:10.3390/ijerph17061894.
Gasbarro, F., F. Rizzi and M. Frey, 2016: Adaptation measures of energy and utility companies to cope with water scarcity induced by climate change. Business Strategy and the Environment , 25, 54–72.
Gasparrini, A. et al., 2017: Projections of temperature-related excess mortality under climate change scenarios. Lancet Planet Health, 1 (9), e360-e367, doi:10.1016/S2542-5196(17)30156-0.
Gawith, D., I. Hodge, F. Morgan and A. Daigneault, 2020: Climate change costs more than we think because people adapt less than we assume. Ecol. Econ. , 173, 106636, doi:10.1016/j.ecolecon.2020.106636.
Gawne, B. et al., 2020: Monitoring, evaluation, and adaptive management in the Murray–Darling Basin. In: Murray-Darling Basin, Australia—Its Future Management [Barry, H., B. Neil, B. Nick, P. Carmel and S. Michael (eds.)]. Elsevier, Australia, 227–249.
GBRMPA, 2019: Great Barrier Reef Outlook Report 2019. Great Barrier Reef Marine Park Authority [Available at: http://hdl.handle.net/11017/3474 ].
GCA, 2019: Adapt now: A global call for leadership on climate resilience. Global Center on Adaptation and World Resources Institute, 90 [Available at: https://cdn.gca.org/assets/2019-09/GlobalCommission_Report_FINAL.pdf ].
Gebert, L. L., A. M. Coutts and N. J. Tapper, 2018: The influence of urban canyon microclimate and contrasting photoperiod on the physiological response of street trees and the potential benefits of water sensitive urban design. Urban For. Urban Greening, doi:10.1016/j.ufug.2018.07.017.
Gervais, C. R., C. Champion and G. T. Pecl, 2021: Species on the move around the Australian coastline: A continental-scale review of climate-driven species redistribution in marine systems. Glob. Chang. Biol. , 27 (14), 3200–3217, doi:10.1111/gcb.15634.
Ghahramani, A. et al., 2015: The value of adapting to climate change in Australian wheat farm systems: farm to cross-regional scale. Agriculture, Ecosystems & Environment , 211, 112–125, doi:10.1016/j.agee.2015.05.011.
Gibbs, M. T., 2015: Pitfalls in developing coastal climate adaptation responses. Climate Risk Management , 8 (C), 1–8, doi:10.1016/j.crm.2015.05.001.
Gibbs, M. T., 2020: The two-speed coastal climate adaptation economy in Australia. Ocean & Coastal Management , 190, 105150, doi:10.1016/j.ocecoaman.2020.105150.
Giejsztowt, J., A. T. Classen and J. R. Deslippe, 2020: Climate change and invasion may synergistically affect native plant reproduction. Ecology, 101 (1), e02913, doi:10.1002/ecy.2913.
Gilmour, J. P. et al., 2013: Recovery of an isolated coral reef system following severe disturbance. Science, 340 (6128), 69–71, doi:10.1126/science.1232310.
Gilpin, B. J. et al., 2020: A large scale waterborne Campylobacteriosis outbreak, Havelock North, New Zealand. J. Infect. , 81 (3), 390–395, doi:10.1016/j.jinf.2020.06.065.
Glavovic, B. C., 2014: The 2004 Manawatu Floods, New Zealand: Integrating Flood Risk Reduction and Climate Change Adaptation. Adapting to Climate Change, 231–268, doi:10.1007/978-94-017-8631-7_10.
Glavovic, B. C., W. S. A. Saunders and J. S. Becker, 2010: Land-use planning for natural hazards in New Zealand: the setting, barriers, ‘burning issues’ and priority actions. Natural Hazards, 54 (3), 679–706, doi:10.1007/s11069-009-9494-9.
Glavovic, B. C. and G. P. Smith, 2014: Introduction: Learning from Natural Hazards Experience to Adapt to Climate Change. In: Adapting to Climate Change Lessons from natural Hazards planning [Glavovic, B. C. and G. P. Smith (eds.)]. Springer, Heidelberg, New York, London, 1–38.
Godfree, R. C. et al., 2021: Implications of the 2019–2020 megafires for the biogeography and conservation of Australian vegetation. Nature Communications, 12 (1), doi:10.1038/s41467-021-21266-5.
Goldberg, J. et al., 2016: Climate change, the Great Barrier Reef and the response of Australians. Palgrave Communications, 2 (1), doi:10.1057/palcomms.2015.46.
Golding, B. and C. Campbell, 2009: Learning to be drier in the southern Murray-Darling Basin: Setting the scene for this research volume. Australian Journal of Adult Learning, 49 (3), 423–450.
Gonzalez, D., P. Dillon, D. Page and J. Vanderzalm, 2020: The Potential for Water Banking in Australia’s Murray–Darling Basin to Increase Drought Resilience. Water, 12 (10), 2936, doi:10.3390/w12102936.
Goode, N. et al., 2017: Defining disaster resilience: comparisons from key stakeholders involved in emergency management in Victoria, Australia. Disasters, 41 (1), 171–193.
Goodhue, N. et al., 2012: Coastal Adaptation to Climate Change: Mapping a New Zealand Coastal Sensitivity Index. [Available at: https://niwa.co.nz/sites/niwa.co.nz/files/HAM2013-011%20-%20NZ%20Coastal%20Sensitivity%20Index.pdf ].
Gorddard, R. et al., 2016: Values, rules and knowledge: Adaptation as change in the decision context. Environmental Science & Policy, 57, 60–69, doi:10.1016/j.envsci.2015.12.004.
Gordon, D. P., 2009: New Zealand inventory of biodiversity. Canterbury University Press, New Zealand.
Gorman-Murray, A. et al., 2017: Problems and possibilities on the margins: LGBT experiences in the 2011 Queensland floods. Gender, Place & Culture, 24 (1), 37–51, doi:10.1080/0966369x.2015.1136806.
Government Inquiry into Havelock North Drinking Water, 2017: Havelock North drinking water inquiry: Stage 2. NZ Government, Auckland, New Zealand.
Government of Tasmania, 2017: Tasmanian Planning Scheme – State Planning Provisions. State of Tasmania,, Hobart, Australia,514 pp.
Grace, E., B. Kilvington and M. France-Hudson, 2019: Reducing risk through the management of existing uses: tensions under the RMA. Institute of Geological and Nuclear Sciences, 144 [Available at: https://www.gns.cri.nz/static/download/existinguses/SR2019-55-AD-Reducing-risk-through-the-management-of-existing-uses-tensions_FINAL.pdf ].
Grafton, R. Q. et al., 2014: Water planning and hydro-climatic change in the Murray-Darling Basin, Australia. Ambio, 43 (8), 1082–1092.
Grafton, R. Q., R. Quentin Grafton, J. Horne and S. A. Wheeler, 2016: On the Marketisation of Water: Evidence from the Murray-Darling Basin, Australia. Water Resources Management , 30 (3), 913–926, doi:10.1007/s11269-015-1199-0.
Graham, E. M. et al., 2019: Climate change and biodiversity in Australia: a systematic modelling approach to nationwide species distributions. Australasian Journal of Environmental Management , 26 (2), 112–123, doi:10.1080/14486563.2019.1599742.
Graham, S. et al., 2018: Local values and fairness in climate change adaptation: Insights from marginal rural Australian communities. World Development , 108, 332–343.
Graham, S. L. et al., 2014: Effects of soil warming and nitrogen addition on soil respiration in a New Zealand tussock grassland. PLOS ONE, 9 (3), e91204.
Grayson, K. L. et al., 2014: Sex ratio bias and extinction risk in an isolated population of Tuatara (Sphenodon punctatus). PLOS ONE, 9 (4), e94214, doi:10.1371/journal.pone.0094214.
Grech, A., R. Pressey and J. Day, 2016: Coal, cumulative impacts, and the Great Barrier Reef. Conservation Letters, 9 (3), 200–207.
Grecian, W. J. et al., 2016: Contrasting migratory responses of two closely related seabirds to long-term climate change. Marine Ecology Progress Series, 559, 231–242.
Green, D., U. King and J. Morrison, 2009: Disproportionate burdens: the multidimensional impacts of climate change on the health of Indigenous Australians. Med. J. Aust. , 190 (1), 4–5.
Green, D. and L. Minchin, 2014: Living on Climate-Changed Country: Indigenous Health,Well-Being and Climate Change in Remote Australian Communities. EcoHealth, 10.1007/s10393-013-0892-9, doi:10.1007/s10393-013-0892-9.
Green, K. et al., 2021: Australian Bogong moths Agrotis infusa (Lepidoptera: Noctuidae), 1951–2020: decline and crash. Austral Entomology, 60 (1), 66–81, doi:10.1111/aen.12517.
Greenhalgh, S. and O. Samarasinghe, 2018: Sustainably managing freshwater resources. Ecology and Society, 23 (2), doi:10.5751/es-10233–230244.
Grieger, R., S. Capon and W. Hadwen, 2019: Resilience of coastal freshwater wetland vegetation of subtropical Australia to rising sea levels and altered hydrology. Regional Environmental Change, 19 (1), 279–292, doi:10.1007/s10113-018-1399-2.
Grieger, R., S. J. Capon, W. L. Hadwen and B. Mackey, 2020: Between a bog and a hard place: a global review of climate change effects on coastal freshwater wetlands. Climatic Change, 163 (1), 161–179, doi:10.1007/s10584-020-02815-1.
Griffiths, 2013: New Zealand six main centre extreme rainfall trends 1962–2011. Weather and Climate, 33, 76, doi:10.2307/26169738.
Grimm-Seyfarth, A., J. B. Mihoub, B. Gruber and K. Henle, 2018: Some like it hot: from individual to population responses of an arboreal arid-zone gecko to local and distant climate. Ecol. Monogr. , 88 (3), 336–352, doi:10.1002/ecm.1301.
Grimm-Seyfarth, A., J. B. Mihoub and K. Henle, 2017: Too hot to die? The effects of vegetation shading on past, present, and future activity budgets of two diurnal skinks from arid Australia. Ecol. Evol. , 7 (17), 6803–6813, doi:10.1002/ece3.3238.
Grose, M. R. et al., 2020: Insights From CMIP6 for Australia’s Future Climate. Earth’s Future, 8 (5), 147, doi:10.1029/2019EF001469.
Grundy, M. J. et al., 2016: Scenarios for Australian agricultural production and land use to 2050. Agricultural Systems, 142, 70–83, doi:10.1016/j.agsy.2015.11.008.
Guerin, G. R. and A. J. Lowe, 2013: Multi-species distribution modelling highlights the Adelaide Geosyncline, South Australia, as an important continental-scale arid-zone refugium. Austral Ecol. , 38 (4), 427–435, doi:10.1111/j.1442-9993.2012.02425.x.
Guerreiro, S. B. et al., 2018: Detection of continental-scale intensification of hourly rainfall extremes. Nature Climate Change, 8(9) , 803–807.
Gulsrud, N. M., K. Hertzog and I. Shears, 2018: Innovative urban forestry governance in Melbourne?: Investigating “green placemaking” as a nature-based solution. Environ. Res. , 161, 158–167, doi:10.1016/j.envres.2017.11.005.
Guo, Y. et al., 2018: Quantifying excess deaths related to heatwaves under climate change scenarios: A multicountry time series modelling study. PLoS Med. , 15 (7), e1002629, doi:10.1371/journal.pmed.1002629.
Guthrie, G., 2019: Real Options Analysis of Climate-Change Adaptation: A Simplified Approach. Victoria University Wellington [Available at: https://ssrn.com/abstract=3323549 ].
Gutiérrez, J. M. et al., 2021: Interactive Atlas. In: Climate Change 2021: The Physical Science Basis. Contribution of Working Group I to the Sixth Assessment Report of the Intergovernmental Panel on Climate Change [Masson-Delmotte, V., P. Zhai, A. Pirani, S. L. Connors, C. Péan, S. Berger, N. Caud, Y. Chen, L. Goldfarb, M. I. Gomis, M. Huang, K. Leitzell, E. Lonnoy, J. B. R. Matthews, T. K. Maycock, T. Waterfield, O. Yelekçi, R. Yu and B. Zhou (eds.)]. Cambridge University Press, UK.
Gynther, I., N. Waller and L. K. P. Leung, 2016: Confirmation of the Extinction of the Bramble Cay Melomys Melomys Rubicola on Bramble Cay, Torres Strait: Results and Conclusions from a Comprehensive Survey in August-September 2014. Queensland Government,, Quaeensland, Australia, 59 pp.
Haasnoot, M., J. Lawrence and A. K. Magnan, 2021: Pathways to coastal retreat. Science, 372 (6548), 1287–1290, doi:10.1126/science.abi6594.
Haberle, S. G. et al., 2014: The Macroecology of Airborne Pollen in Australian and New Zealand Urban Areas. PLOS ONE, 9 (5), 13, doi:10.1371/journal.pone.0097925.
Haddad, S. et al., 2020a: On the potential of building adaptation measures to counterbalance the impact of climatic change in the tropics. Energy and Buildings, 229, 110494, doi:10.1016/j.enbuild.2020.110494.
Haddad, S. et al., 2020b: Holistic approach to assess co-benefits of local climate mitigation in a hot humid region of Australia. Scientific Reports, 10 (1), doi:10.1038/s41598-020-71148-x.
Haddad, S. et al., 2019: Experimental and Theoretical analysis of the urban overheating and its mitigation potential in a hot arid city – Alice Springs. Architectural Science Review, 1–16, doi:10.1080/00038628.2019.1674128.
Hadwen, W. L. et al., 2012: Climate change responses and adaptation pathways in Australian coastal ecosystems: Synthesis report . National Climate Change Adaptation Research Facility (NCCARF), Gold Coast, 359 pp.
Haensch, J., S. A. Wheeler and A. Zuo, 2021: Explaining permanent and temporary water market trade patterns within local areas in the southern Murray–Darling Basin. Aust. J. Agric. Resour. Econ. , 65 (2), 318–348, doi:10.1111/1467-8489.12420.
Hague, B. S., B. F. Murphy, D. A. Jones and A. J. Taylor, 2019: Developing impact-based thresholds for coastal inundation from tide gauge observations. Journal of Southern Hemisphere Earth Systems Science, 69 (1), 252, doi:10.1071/es19024.
Hales, S. et al., 2000: Daily mortality in relation to weather and air pollution in Christchurch, New Zealand. Aust. N. Z. J. Public Health, 24 (1), 89–91, doi:10.1111/j.1467-842x.2000.tb00731.x.
Hall, N. L. et al., 2021: Climate change and infectious diseases in Australia’s Torres Strait Islands. Aust. N. Z. J. Public Health, 45 (2), 122–128, doi:10.1111/1753-6405.13073.
Hall, N. L. and L. Crosby, 2020: Climate Change Impacts on Health in Remote Indigenous Communities in Australia. International Journal of Environmental Health Research, 1–16, doi:10.1080/09603123.2020.1777948.
Hallegatte, S. et al., 2012: Investment Decision Making under Deep Uncertainty—Application to Climate Change. Policy Research Working Papers, doi:10.1596/1813-9450-6193.
Hallegraeff, G. and C. Bolch, 2016: Unprecedented toxic algal blooms impact on Tasmanian seafood industry. Microbiol. Aust. , 37 (3), 143–144, doi:10.1071/MA16049.
Hallegraeff, G. M. et al., 2020: Overview of Australian and New Zealand harmful algal species occurrences and their societal impacts in the period 1985 to 2018, including a compilation of historic records. Harmful Algae, 101848, doi:10.1016/j.hal.2020.101848.
Hallett, C. S. et al., 2017: Observed and predicted impacts of climate change on the estuaries of south-western Australia, a Mediterranean climate region. Regional Environ. Change, 18 (5), 1357–1373, doi:10.1007/s10113-017-1264-8.
Halteh, J. et al., 2018: The impact of technology on employment: a research agenda for New Zealand and beyond. Labour & Industry: a journal of the social and economic relations of work, 28 (3), 203–216, doi:10.1080/10301763.2018.1519774.
Hamilton, D. P., N. Salmaso and H. W. Paerl, 2016: Mitigating harmful cyanobacterial blooms: strategies for control of nitrogen and phosphorus loads. Aquat. Ecol. , 50 (3), 351–366, doi:10.1007/s10452-016-9594-z.
Hamin, E. and N. Gurran, 2015: Climbing the Adaptation Planning Ladder: Barriers and Enablers in Municipal Planning. In: Handbook of Climate Change Adaptation [Hamin, E. and N. Gurran (eds.)]. Springer, 839–860.
Hancock, G. R., D. Verdon-Kidd and J. B. C. Lowry, 2017: Soil erosion predictions from a landscape evolution model – An assessment of a post-mining landform using spatial climate change analogues. Science of The Total Environment , 601–602, 109–121, doi:10.1016/j.scitotenv.2017.04.038.
Hanigan, I. C., K. B. G. Dear and A. Woodward, 2021: Increased ratio of summer to winter deaths due to climate warming in Australia, 1968–2018. Aust. N. Z. J. Public Health, doi:10.1111/1753-6405.13107.
Hanigan, I. C., J. Schirmer and T. Niyonsenga, 2018: Drought and Distress in Southeastern Australia. Ecohealth, 15 (3), 642–655, doi:10.1007/s10393-018-1339-0.
Hanna, C., I. White and B. C. Glavovic, 2021: Managed retreats by whom and how? Identifying and delineating governance modalities. Climate Risk Management , 31, 100278, doi:10.1016/j.crm.2021.100278.
Hanna, C. J., 2019: Restraints of change: Limits to ‘managed retreats’ in Aotearoa New Zealand. Ph.D. Thesis. University of Waikato, New Zealand.
Hanslow, D. J., B. D. Morris, E. Foulsham and M. A. Kinsela, 2018: A Regional Scale Approach to Assessing Current and Potential Future Exposure to Tidal Inundation in Different Types of Estuaries. Sci. Rep. , 8 (1), 7065, doi:10.1038/s41598-018-25410-y.
Hardy, D. et al., 2019: Planning for Climate Change Impacts on Māori Coastal Ecosystems and Economies: A Case Study of 5 Māori-owned land blocks in the Horowhenua Coastal Zone. Massey University, 116 [Available at: https://www.deepsouthchallenge.co.nz/sites/default/files/2020-03/Hardy%20et%20al.%20CC%20Impacts%20on%20Maori%20FINAL%20LOW%20RES%20Sections%201%20to%204_2.pdf ].
Hare, K. M. et al., 2019: Intractable: species in New Zealand that continue to decline despite conservation effort. J. R. Soc. N. Z. , doi:10.1080/03036758.2019.1599967.
Harmsworth, G., S. Awatere and M. Robb, 2016: Indigenous Māori values and perspectives to inform freshwater management in Aotearoa-New Zealand. Ecology and Society, 21 (4), doi:10.5751/es-08804-210409.
Harrington, Harrington and Renwick, 2014: Secular changes in New Zealand rainfall characteristics 1950–2009. Weather and Climate, 34, 50, doi:10.2307/26169744.
Harrington, L. J., 2020: Rethinking extreme heat in a cool climate: a New Zealand case study. Environ. Res. Lett. , doi:10.1088/1748-9326/abbd61.
Harris, R. et al., 2020: Climate change: Australia’s wine future-climate information for adaptation to change. Wine & Viticulture, 1, 42–47.
Harris, R. M. B. et al., 2018: Biological responses to the press and pulse of climate trends and extreme events. Nat. Clim. Chang. , 8 (7), 579–587, doi:10.1038/s41558-018-0187-9.
Harris, R. M. B., D. J. Kriticos, T. Remenyi and N. Bindoff, 2017: Unusual suspects in the usual places: a phylo-climatic framework to identify potential future invasive species. Biological Invasions, 19 (2), 577–596, doi:10.1007/s10530-016-1334-8.
Harris, R. M. B., T. Remenyi and N. L. Bindoff, 2016: The Potential Impacts of Climate Change on Victorian Alpine Resorts. A Report for the Alpine Resorts Co-ordinating Council. The Antarctic Climate & Ecosystems Cooperative Research Centre, 203 [Available at: https://www.arcc.vic.gov.au/uploads/publications-and-research/The%20Potential%20Impact%20of%20Climate%20Change%20on%20Victorian%20Alpine%20Resorts%20Study_FINAL.pdf ].
Harris, S. and C. Lucas, 2019: Understanding the variability of Australian fire weather between 1973 and 2017. PLOS ONE, 14 (9), doi: https://doi.org/10.1371/journal.pone.0222328.
Harris, S. et al., 2008: The relationship between the monsoonal summer rain and dry-season fire activity of northern Australia. Int. J. Wildland Fire, 17 (5), 674–684, doi:10.1071/WF06160.
Hart, B. T., 2016: The Australian Murray–Darling Basin Plan: challenges in its implementation (part 1). International Journal of Water Resources Development , 32 (6), 819–834, doi:10.1080/07900627.2015.1083847.
Hart, M. and E. R. Langer, 2011: Mitigating the risk of human caused wildfires: Literature review and stakeholder study. Forest Research Institute, New Zealand.
Hartwig, L., S. Jackson and N. Osborne, 2018: Recognition of Barkandji Water Rights in Australian Settler-Colonial Water Regimes. Resources, 7 (1), 16, doi:10.3390/resources7010016.
Harvey, N., 2019: Protecting private properties from the sea: Australian policies and practice. Mar. Policy, 107, 103566, doi:10.1016/j.marpol.2019.103566.
Harvey, N. and B. Clarke, 2019: 21st Century reform in Australian coastal policy and legislation. Marine Policy, 103, 27–32, doi:10.1016/j.marpol.2019.02.016.
Hasegawa, S., C. A. Macdonald and S. A. Power, 2015: Elevated carbon dioxide increases soil nitrogen and phosphorus availability in a phosphorus-limited Eucalyptus woodland. Glob. Chang. Biol. , 22 (4), 1628–1643.
Haskoning Australia, 2016: Coastal Zone Management Plan for Bilgola Beach (Bilgola) and Basin Beach (Mona Vale). Haskoning Australia Pty Ltd, 80 [Available at: https://files.northernbeaches.nsw.gov.au/sites/default/files/2017224002_201707-bilgolabasinczmp-ecertified.pdf ].
Hassenforder, E. and S. Barone, 2019: Institutional arrangements for water governance. International Journal of Water Resources Development , 35 (5), 783–807, doi:10.1080/07900627.2018.1431526.
Hatvani-Kovacs, G., M. Belusko, J. Pockett and J. Boland, 2018: Heat stress-resistant building design in the Australian context. Energy and Buildings, 158, 290–299, doi:10.1016/j.enbuild.2017.10.025.
Hauraki Gulf Forum, 2017: State of our Gulf—Hauraki State of the Environment Report 2017. Hauraki Gulf Forum, Auckland,127 pp.
Hayes, S. and B. Lovelock, 2017: ‘Demystifying’ worldmaking: exploring New Zealand’s clean and green imaginary through the lens of angling tourists. Tourism Recreation Research, 42 (3), 380–391, doi:10.1080/02508281.2016.1265235.
Hayward, B., 2008: ‘Nowhere Far From the Sea’: Political Challenges of Coastal Adaptation To Climate Change in New Zealand. Polit. Sci. , 60 (1), 47–59, doi:10.1177/003231870806000105.
Hayward, B., 2012: Children, Citizenship and Environment . Routledge, London.
Hayward, B., 2017: Sea Change: Climate Politics and New Zealand. Bridget Williams Books, Wellington, New Zealand, 112 pp.
Hazledine, T. and M. Rashbrooke, 2018: The New Zealand rich list twenty years on. New Zealand Economic Papers, 52 (3), 289–303, doi:10.1080/00779954.2017.1354907.
HDSR, 2020: Health and Disability System Review – Final Report – Pūrongo Whakamutunga. Health and Disability System Review, Wellington, 266 [Available at: https://www.systemreview.health.govt.nz/assets/Uploads/hdsr/health-disability-system-review-final-report.pdf ].
He, T. H. et al., 2016: Evolutionary potential and adaptation of Banksia attenuata (Proteaceae) to climate and fire regime in southwestern Australia, a global biodiversity hotspot. Sci. Rep. , 6, doi:10.1038/srep26315.
Head, L., 2020: Transformative change requires resisting a new normal. Nature Climate Change, 10 (3), 173–174, doi:10.1038/s41558-020-0712-5.
Heaviside, C., H. Macintyre and S. Vardoulakis, 2017: The Urban Heat Island: Implications for Health in a Changing Environment. Current Environmental Health Reports, 4 (3), 296–305, doi:10.1007/s40572-017-0150-3.
Helman, P. and R. Tomlinson, 2018: Two Centuries of Climate Change and Climate Variability, East Coast Australia. J. Mar. Sci. Eng. , 6 (1), 3, doi:10.3390/jmse6010003.
Hendrikx, J., C. Zammit, E. Ö. Hreinsson and S. Becken, 2013: A comparative assessment of the potential impact of climate change on the ski industry in New Zealand and Australia. Climatic Change, 119 (3-4), 965–978, doi:10.1007/s10584-013-0741-4.
Hendy, J. et al., 2018: Drought and climate change adaptation—impacts and projections. Motu Economic and Public Policy Research, New Zealand, 16.
Hennessy, K. et al., 2016: Climate change impacts on Australia’s dairy regions. , CSIRO Oceans and Atmosphere, Melbourne, Australia., 64.
Henwood, W. et al., 2019: Enhancing drinking water quality in remote Māori communities. MAI Journal: A New Zealand Journal of Indigenous Scholarship, 8 (2), doi:10.20507/maijournal.2019.8.2.1.
Heron, S. F. et al., 2017: Impacts of Climate Change on World Heritage Coral Reefs: A First Global Scientific Assessment . Center, U. W. H., Paris.
Hertzler, G. et al., 2013: Will primary producers continue to adjust practices and technologies, change production systems or transform their industry? An application of real options. National Climate Change Adaptation Research Facility, Gold Coast, 93 pp.
Hettiarachchi, S., C. Wasko and A. Sharma, 2019: Can antecedent moisture conditions modulate the increase in flood risk due to climate change in urban catchments?Journal of Hydrology, 571, 11–20, doi:10.1016/j.jhydrol.2019.01.039.
Higham, J. et al., 2016: Climate change, tourist air travel and radical emissions reduction. J. Clean. Prod. , 111, 336–347, doi:10.1016/j.jclepro.2014.10.100.
Hill, R. et al., 2020: Knowledge co-production for Indigenous adaptation pathways: Transform post-colonial articulation complexes to empower local decision-making. Global Environmental Change, 65, 102161, doi:10.1016/j.gloenvcha.2020.102161.
Hinkson, M. and E. Vincent, 2018: Shifting Indigenous Australian Realities: Dispersal, Damage, and Resurgence: Introduction. Oceania, 88 (3), 240–253.
Hintz, M. J., C. Luederitz, D. J. Lang and H. von Wehrden, 2018: Facing the heat: A systematic literature review exploring the transferability of solutions to cope with urban heat waves. Urban Climate, 24, 714–727, doi:10.1016/j.uclim.2017.08.011.
Hirabayashi, Y. et al., 2013: Global flood risk under climate change. Nature Climate Change, 3 (9), 816–821, doi:10.1038/nclimate1911.
Hobday, A. J. and C. Cvitanovic, 2017: Preparing Australian fisheries for the critical decade: insights from the past 25 years. Marine and Freshwater Research, 68 (10), doi:10.1071/mf16393.
Hobday, A. J., C. M. Spillman, J. Paige Eveson and J. R. Hartog, 2016: Seasonal forecasting for decision support in marine fisheries and aquaculture. Fish. Oceanogr. , 25, 45–56, doi:10.1111/fog.12083.
Hochman, Z., D. L. Gobbett and H. Horan, 2017: Climate trends account for stalled wheat yields in Australia since 1990. Global Change Biology, 23 (5), 2071–2081, doi:10.1111/gcb.13604.
Hodder, J., 2019: Climate change litigation- who’s afraid of creative judges? A paper for presentation to the “Climate Change Adaptation” session of the Local Government New Zealand Rural and Provincial Sector Meeting. Jack Hodder QC, Wellington.
Hodgkinson, J., A. Hobday and E. Pinkard, 2014: Climate adaptation in Australia’s resource-extraction industries: ready or not?Regional Environ. Change, 14, 1663–1678.
Hoegh-Guldberg, O., E. S. Poloczanska, W. Skirving and S. Dove, 2017: Coral Reef Ecosystems under Climate Change and Ocean Acidification. Frontiers in Marine Science, 4, doi:10.3389/fmars.2017.00158.
Hoeppner, J. M. and L. Hughes, 2019: Climate readiness of recovery plans for threatened Australian species. Conserv. Biol. , 33 (3), 534–542, doi:10.1111/cobi.13270.
Hoffmann, A. A. et al., 2019: Impacts of recent climate change on terrestrial flora and fauna: Some emerging Australian examples. Austral Ecol. , 44 (1), 3–27, doi:10.1111/aec.12674.
Home Affairs, 2020: The first national action plan to implement the national disaster risk reduction framework. Australian Department of Home Affairs, 85 [Available at: https://www.homeaffairs.gov.au/emergency/files/first-national-action-plan.pdf ].
Hope, P. et al., 2017: A Synthesis of Findings from the Victorian Climate Initiative (VicCI). Bureau of Meteorology Australia, 56 [Available at: https://www.water.vic.gov.au/__data/assets/pdf_file/0030/76197/VicCI-25-07-17-MR.pdf ].
Hopkins, D., 2015: Applying a Comprehensive Contextual Climate Change Vulnerability Framework to New Zealand’s Tourism Industry. Ambio, 44 (2), 110–120, doi:10.1007/s13280-014-0525-8.
Hopkins, D. et al., 2015: Climate change and Aotearoa New Zealand. Wiley Interdisciplinary Reviews: Climate Change, 6 (6), 559–583, doi:10.1002/wcc.355.
Horwood, P., E. McBryde, D. Peniyamina and S. Ritchie, 2018: The Indo-Papuan conduit: a biosecurity challenge for Northern Australia. Aust. N. Z. J. Public Health, 42 (5), 434–436, doi:10.1111/1753-6405.12808.
Houston, W. A. et al., 2020: Climate change, mean sea levels, wetland decline and the survival of the critically endangered Capricorn Yellow Chat. Austral Ecology, doi:10.1111/aec.12886.
Howden, M., S. Schroeter, S. Crimp and I. Hanigan, 2014: The changing roles of science in managing Australian droughts: An agricultural perspective. Weather and Climate Extremes, 3, 80–89, doi:10.1016/j.wace.2014.04.006.
Howes, M. et al., 2015: Towards networked governance: improving interagency communication and collaboration for disaster risk management and climate change adaptation in Australia. J. Environ. Planning Manage. , 58 (5), 757–776.
Hughes, J. et al., 2021: Impacts and implications of climate change on wastewater systems: A New Zealand perspective. Climate Risk Management , 31, 100262, doi:10.1016/j.crm.2020.100262.
Hughes, J. D., K. C. Petrone and R. P. Silberstein, 2012: Drought, groundwater storage and stream flow decline in southwestern Australia. Geophysical Research Letters, 39 (3), doi:10.1029/2011gl050797.
Hughes, L., P. Stock, L. Brailsford and D. Alexander, 2018a: Icons at risk: Climate change threatening Australia’s tourism. Climate Council, Australia.
Hughes, N., D. Galeano and S. Hatfield-Dodds, 2019a: The effects of drought and climate variability on Australian farms. Australian Bureau of Agricultural and Resource Economics and Sciences, Canberra.
Hughes, N. and P. Gooday, 2021: Climate change impacts and adaptation on Australian farms. Department of Agriculture Water and the Environment, 15 [Available at: https://daff.ent.sirsidynix.net.au/client/en_AU/search/asset/1032401/0 ].
Hughes, N. and K. Lawson, 2017: Climate adjusted productivity on Australian cropping farms. In: New Directions in Productivity Measurement and Efficiency Analysis: Counting the Environment and Natural Resources [Ancev, T., M. Samad Azad and F. Hernandez-Sancho (eds.)]. Edward Elgar, Cheltenham, 173.
Hughes, T. P. et al., 2018b: Spatial and temporal patterns of mass bleaching of corals in the Anthropocene. Science, 359 (6371), 80–83, doi:10.1126/science.aan8048.
Hughes, T. P. et al., 2019b: Global warming impairs stock–recruitment dynamics of corals. Nature, 568 (7752), 387–390, doi:10.1038/s41586-019-1081-y.
Hughes, T. P. et al., 2018c: Global warming transforms coral reef assemblages. Nature, 556 (7702), 492–496, doi:10.1038/s41586-018-0041-2.
Hughes, T. P. et al., 2019c: Ecological memory modifies the cumulative impact of recurrent climate extremes. Nat. Clim. Chang. , 9 (1), 40–43, doi:10.1038/s41558-018-0351-2.
Hughey, K. F. D. and S. Becken, 2014: Understanding climate coping as a basis for strategic climate change adaptation – The case of Queenstown-Lake Wanaka, New Zealand. Global Environmental Change, 27, 168–179, doi:10.1016/j.gloenvcha.2014.03.004.
Hunt, J. R., P. T. Hayman, R. A. Richards and J. B. Passioura, 2018: Opportunities to reduce heat damage in rain-fed wheat crops based on plant breeding and agronomic management. Field Crops Research, 224, 126–138, doi:10.1016/j.fcr.2018.05.012.
Hunt, J. R. et al., 2019: Early sowing systems can boost Australian wheat yields despite recent climate change. Nature Climate Change, 9 (3), 244–247, doi:10.1038/s41558-019-0417-9.
Hunter, J., 2012: A simple technique for estimating an allowance for uncertain sea-level rise. Climatic Change, 113 (2), 239–252, doi:10.1007/s10584-011-0332-1.
Hurd, C. L., A. Lenton, B. Tilbrook and P. W. Boyd, 2018: Current understanding and challenges for oceans in a higher-CO2 world. Nat. Clim. Chang. , 8, 686–694.
Hurlbert, M. et al., 2019: Risk management and decision making in relation to sustainable development. In: Special Report on Climate Change and Land.
Hurlimann, A. C., 2008: Barriers to implementing water efficiency practices in the built environment:The case of Melbourne and Bendigo, Australia. Australian Planner, 45 (3), 34–42, doi:10.1080/07293682.2008.9982676.
Hurlimann, A. C., G. R. Browne, G. Warren-Myers and V. Francis, 2018: Barriers to climate change adaptation in the Australian construction industry–Impetus for regulatory reform. Build. Environ. , 137, 235–245.
Hutley and S. H. Davis, 2019: Climate change and directors’ duties: supplementary memorandum of opinion. The Centre for Policy Development [Available at: https://apo.org.au/node/74091 ].
Hyman, I. T. et al., 2020: Impacts of the 2019–2020 bushfires on New South Wales biodiversity: a rapid assessment of distribution data for selected invertebrate taxa. Technical Reports of the Australian Museum online, 32, 1–17, doi:10.3853/j.1835-4211.32.2020.1768.
IAG, 2019: Climate-related Disclosure. Insurance Australia Group, Australia [Available at: https://www.iag.com.au/climate-related-disclosure-2019 ].
ICA, 2020a: Catastrophe Data. Insurance Council of Australia—DataGlobe,, Australia [Available at: https://www.icadataglobe.com/dataglobeposts/2020/7/25/catastrophedata ].
ICA, 2020b: Top five insured loss events normalised in 2017 dollars. Insurance Council of Australia, Australia [Available at: https://www.icadataglobe.com/access-catastrophe-data ].
ICA, 2021: Insurance Council of Australia Data Hub. Insurance Council of Australia, Australia [Available at: https://insurancecouncil.com.au/industry-members/data-hub/ ].
ICCC, 2019: Accelerated Electrification. Interim Climate Change Committee, New Zealand, 120 [Available at: https://www.iccc.mfe.govt.nz/assets/PDF_Library/daed426432/FINAL-ICCC-Electricity-report.pdf ].
ICNZ, 2021: Cost of natural disasters. Insurance Council of New Zealand, Wellington, New Zealand.
IGCC, 2017: From Risk to Return: Investing in Climate Change Adaptation. Investor Group on Climate Change, Investor Group on Climate Change . https://igcc.org.au/wp-content/uploads//03/Adaptation, F. p.
IGCC, 2021a: Aspiration to Action: Insights into investor progress towards net zero. Investor Group on Climate Change, 28 [Available at: https://igcc.org.au/wp-content/uploads/2021/08/ASPIRATION-TO-ACTION_FINAL_17AUG2021.pdf ].
IGCC, 2021b: Confusion to clarity: a plan for mandatory TCFD-aligned disclosure in Australia. Investor Group on Climate Change, CDP and PRI, 65 [Available at: https://igcc.org.au/wp-content/uploads/2021/06/ConfusiontoClarity_APlanforMandatoryTCFDalignedDisclosureinAus.pdf ].
Infometrics, 2017: Real Options Analysis of Strategies to Manage Coastal Hazard Risks-Southern-Units-J-L.pdf . Hawke’s Bay Regional Council, 33 [Available at: https://hbcoast.co.nz/assets/Document-Library/Other-documents/Real-Options-Analysis-of-Strategies-to-Manage-Coastal-Hazard-Risks-Southern-Units-J-L.pdf ].
Infometrics and PSConsulting, 2015: Flood Protection: Option Flexibility and its Value for Greater Wellington Regional Council. Infometrics and PS Consulting, Wellington, New Zealand, 27.
Infrastructure Australia, 2016: Infrastructure Priority List 2021: Project and Initiative Summaries. Infrastructure Australia, Australia [Available at: https://play.google.com/store/books/details?id=9QQ-zgEACAAJ
Infrastructure Australia, 2019: Australian Infrastructure Audit 2019: Report . Infrastructure Australia,, Australia.
Infrastructure Australia, 2021: Australian Infrastructure Plan: The Infrastructure Priority List . Infrastructure Australia,, Australia.
Innes, J. et al., 2019: New Zealand ecosanctuaries: types, attributes and outcomes. J. R. Soc. N. Z. , 49 (3), 370–393, doi:10.1080/03036758.2019.1620297.
Instone, L. et al., 2014: Climate change adaptation in the rental sector. In: Applied Studies in Climate Adaptation [Palutikof, J. P., S. Boulter, J. Barnett and D. Rissik (eds.)]. John Wiley & Sons, 372–379.
Iorns Magallanes, C., 2019: Treaty of Waitangi duties relevant to adaptation to coastal hazards from sea-level rise. Research Report for the Deep South National Science Challenge, 190 [Available at: https://www.deepsouthchallenge.co.nz/sites/default/files/2019-08/Treaty%20%26%20Adaptation%20Final%20Report%20August%202019.pdf ].
Iorns Magallanes, C., V. James and T. Stuart, 2018: Courts as Decision-Makers on Sea Level Rise Adaptation Measures: Lessons from New Zealand. Climate Change Management , 315–335, doi:10.1007/978-3-319-70703-7_17.
Iorns Magallanes, C. and J. Watts, 2019: Adaptation to Sea-level Rise: Local Government Liability Issues : Research Report for the Deep South National Science Challenge. Deep South National Science Challenge,, Auckland, New Zealand.
IPCC, 2018: Global Warming of 1.5°C. An IPCC Special Report on the impacts of global warming of 1.5°C above pre-industrial levels and related global greenhouse gas emission pathways, in the context of strengthening the global response to the threat of climate change, sustainable development, and efforts to eradicate poverty[Masson-Delmotte, V. (ed.)]. World Meteorological Organisation, Geneva, Switzerland, In press pp.
IPCC, 2019a: Climate Change and Land: an IPCC special report on climate change, desertification, land degradation, sustainable land management, food security, and greenhouse gas fluxes in terrestrial ecosystems[Shukla, P. R. (ed.)]. In press pp.
IPCC, 2019b: IPCC Special Report on the Ocean and Cryosphere in a Changing Climate[Pörtner, H. O. (ed.)]. Cambridge University Press,, Cambridge, UK and New York, NY, USA In press pp.
IPCC, 2021: Summary for Policymakers. In: Climate Change 2021: The Physical Science Basis. Contribution of Working Group I to the Sixth Assessment Report of the Intergovernmental Panel on Climate Change[Masson-Delmotte, V., P. Zhai, A. Pirani, S. L. Connors, C. Péan, S. Berger, N. Caud, Y. Chen, L. Goldfarb, M. I. Gomis, M. Huang, K. Leitzell, E. Lonnoy, J. B. R. Matthews, T. K. Maycock, T. Waterfield, O. Yelekçi, R. Yu and B. Zhou (eds.)]. Cambridge University Press, Cambridge, UK and New York, NY, USA.
Ishak, E. H. et al., 2013: Evaluating the non-stationarity of Australian annual maximum flood. Journal of Hydrology, 494, 134–145, doi:10.1016/j.jhydrol.2013.04.021.
Iwanaga, T. et al., 2020: A socio-environmental model for exploring sustainable water management futures: Participatory and collaborative modelling in the Lower Campaspe catchment. Journal of Hydrology: Regional Studies, 28, 100669, doi:10.1016/j.ejrh.2020.100669.
Jackson, M. et al., 2019: Collaborating for Sustainable Water and Energy Management: Assessment and Categorisation of Indigenous Involvement in Remote Australian Communities. Sustainability, 11 (2), doi:10.3390/su11020427.
Jackson, S., 2018: Water and Indigenous rights: Mechanisms and pathways of recognition, representation, and redistribution. Wiley Interdisciplinary Reviews: Water, 5 (6), e1314, doi:10.1002/wat2.1314.
Jackson, S. and B. Moggridge, 2019: Indigenous water management. Australasian Journal of Environmental Management , 26 (3), 193–196, doi:10.1080/14486563.2019.1661645.
Jackson, T., K. Zammit and S. Hatfield-Dodds, 2020: Snapshot of Australian Agriculture 2020. Department of Agriculture, Water and the Environment, Canberra, 8.
Jacobs, B., L. Boronyak and P. Mitchell, 2019: Application of Risk-Based, Adaptive Pathways to Climate Adaptation Planning for Public Conservation Areas in NSW, Australia. Climate, 7 (4), 58, doi:10.3390/cli7040058.
Jacobs, B. et al., 2018a: Towards a climate change adaptation strategy for national parks: Adaptive management pathways under dynamic risk. Environmental Science & Policy, 89, 206–215, doi:10.1016/j.envsci.2018.08.001.
Jacobs, B. et al., 2016: Adaptation Planning Process and Government Adaptation Architecture Support Regional Action on Climate Change in New South Wales, Australia. In: Innovation in Climate Change Adaptation [Filho, W. L. (ed.)]. Springer International Publishing,, Geneva, Switzerland, 17–29.
Jacobs, S., A. Gallant, N. Tapper and D. Li, 2018b: Use of Cool Roofs and Vegetation to Mitigate Urban Heat and Improve Human Thermal Stress in Melbourne, Australia. J. Appl. Meteorol. Climatol. , 57 (8), 1747–1764, doi:10.1175/JAMC-D-17-0243.1.
Jakku, E. et al., 2016: Learning the hard way: a case study of an attempt at agricultural transformation in response to climate change. Climatic Change, 137 (3), 557–574, doi:10.1007/s10584-016-1698-x.
James, C. S. et al., 2017: Sink or swim? Potential for high faunal turnover in Australian rivers under climate change. J. Biogeogr. , 44 (3), 489–501, doi:10.1111/jbi.12926.
Jardine, T. D. et al., 2015: Does flood rhythm drive ecosystem responses in tropical riverscapes?Ecology, 96 (3), 684–692, doi:10.1890/14-0991.1.
Jarvis, C. et al., 2018: Advancement of winegrape maturity continuing for winegrowing regions in Australia with variable evidence of compression of the harvest period. Australian Journal of Grape and Wine Research, doi:10.1111/ajgw.12373.
Jay, O. et al., 2021: Reducing the health effects of hot weather and heat extremes: from personal cooling strategies to green cities. The Lancet , 398 (10301), 709–724, doi: https://doi.org/10.1016/S0140-6736(21)01209-5.
Jennings, S. et al., 2016: Setting objectives for evaluating management adaptation actions to address climate change impacts in south-eastern Australian fisheries. Fisheries Oceanography, 25, 29–44, doi:10.1111/fog.12137.
Jensen, M. P. et al., 2018: Environmental Warming and Feminization of One of the Largest Sea Turtle Populations in the World. Curr. Biol. , 28 (1), 154–159.e4, doi:10.1016/j.cub.2017.11.057.
Ji, F. et al., 2018: Trends and low frequency variability of East Coast Lows in the twentieth century. Journal of Southern Hemisphere Earth System Science, 68 (1), 1–15, doi:10.22499/3.6801.001.
Jiang, N., G. Pacheco and K. Dasgupta, 2017: Residential movement within New Zealand: Quantifying and characterising the transient population. Social Policy Evaluation and Research Unit.
Jiang, W. et al., 2021: Compositional Changes in Grapes and Leaves as a Consequence of Smoke Exposure of Vineyards from Multiple Bushfires across a Ripening Season. Molecules, 26 (11), doi:10.3390/molecules26113187.
Jobst, A. M., D. G. Kingston, N. J. Cullen and J. Schmid, 2018: Intercomparison of different uncertainty sources in hydrological climate change projections for an alpine catchment (upper Clutha River, New Zealand). Hydrology and Earth System Sciences, 22 (6), 3125–3142, doi:10.5194/hess-22-3125-2018.
Johansen, J. L. et al., 2014: Increasing ocean temperatures reduce activity patterns of a large commercially important coral reef fish. Glob. Chang. Biol. , 20 (4), 1067–1074, doi:10.1111/gcb.12452.
Jöhnk, K. D. et al., 2008: Summer heatwaves promote blooms of harmful cyanobacteria. Global Change Biology, 14 (3), 495–512, doi:10.1111/j.1365-2486.2007.01510.x.
Johnson, D., M. Parsons and K. Fisher, 2021: Engaging Indigenous perspectives on health, wellbeing and climate change. A new research agenda for holistic climate action in Aotearoa and beyond. Local Environ. , 26 (4), 477–503, doi:10.1080/13549839.2021.1901266.
Johnson, F. et al., 2016: Natural hazards in Australia: floods. Clim. Change, 139 (1), 21–35, doi:10.1007/s10584-016-1689-y.
Johnston, F. H. et al., 2020: Unprecedented health costs of smoke-related PM2.5 from the 2019–20 Australian megafires. Nature Sustainability, doi:10.1038/s41893-020-00610-5.
Johnston, V. and B. France-Hudson, 2019: Implications of Climate Change for Western Concepts of Ownership: Australian Case Study. UNSW Law Journal, 42 (3).
Jollands, N., M. Ruth, C. Bernier and N. Golubiewski, 2007: The climate’s long-term impact on New Zealand infrastructure (CLINZI) project—A case study of Hamilton City, New Zealand. Journal of Environmental Management , 83 (4), 460–477, doi:10.1016/j.jenvman.2006.09.022.
Jones, R., 2019: Climate change and Indigenous Health Promotion. Glob. Health Promot. , 26 (3_suppl), 73–81, doi:10.1177/1757975919829713.
Jones, R., H. Bennett, G. Keating and A. Blaiklock, 2014: Climate change and the right to health for Māori in Aotearoa/New Zealand. Health Hum. Rights, 16 (1), 54–68.
Jones, R. N. et al., 2013: Valuing adaptation under rapid change. National Climate Change Adaptation Research Facility, Gold Coast, pp. 182. http://www.nccarf.edu.au/publications/valuing-adaptation-under-rapid-change.
Jongejan, R. et al., 2016: Drawing the line on coastline recession risk. Ocean Coast. Manag. , 122, 87–94, doi:10.1016/j.ocecoaman.2016.01.006.
Joshi, S. R. et al., 2016: Physical and Economic Consequences of Sea-Level Rise: A Coupled GIS and CGE Analysis Under Uncertainties. Environ. Resour. Econ. , 65 (4), 813–839, doi:10.1007/s10640-015-9927-8.
Jozaei, J., M. Mitchell and S. Clement, 2020: Using a resilience thinking approach to improve coastal governance responses to complexity and uncertainty: a Tasmanian case study, Australia. J. Environ. Manage. , 253, 109662, doi:10.1016/j.jenvman.2019.109662.
Judd, B., 2019: Kapi Wiya: Water insecurity and aqua-nullius in remote inland Aboriginal Australia. Thesis Eleven, 150 (1), 102–118, doi:10.1177/0725513618821969.
K.E. Lawrence et al., 2017: Using a rule-based envelope model to predict the expansion of habitat suitability within New Zealand for the tick Haemaphysalis longicornis, with future projections based on two climate change scenarios. Veterinary Parasitology, 243, 226–234, doi:10.1016/j.vetpar.2017.07.001.
Kaestli, M. et al., 2019: Opportunistic pathogens and large microbial diversity detected in source-to-distribution drinking water of three remote communities in Northern Australia. PLoS Negl. Trop. Dis. , 13 (9), e0007672, doi:10.1371/journal.pntd.0007672.
Kalaugher, E. et al., 2017: Modelling farm-level adaptation of temperate, pasture-based dairy farms to climate change. Agricultural Systems, 153, 53–68, doi:10.1016/j.agsy.2017.01.008.
Kean, J. et al., 2015: Effects of climate change on current and potential biosecurity pests and diseases in New Zealand. Ministry of Primary Industries, Auckland, New Zealand.
Kearns, R. A., N. Lewis, T. McCreanor and K. Witten, 2009: ‘The status quo is not an option’: Community impacts of school closure in South Taranaki, New Zealand. Journal of Rural Studies, 25 (1), 131–140, doi:10.1016/j.jrurstud.2008.08.002.
Keck, F., M. Lenzen, A. Vassallo and M. Li, 2019: The impact of battery energy storage for renewable energy power grids in Australia. Energy, 173, 647–657, doi:10.1016/j.energy.2019.02.053.
Keenan, J., D. Kemp and J. Owen, 2019: Corporate responsibility and the social risk of new mining technologies. Corporate Social Responsibility and Environmental Management , 26 (4), 752–760, doi:10.1002/csr.1717.
Keenan, R. J., 2017: Climate change and Australian production forests: impacts and adaptation. Australian Forestry, 80 (4), 197–207, doi:10.1080/00049158.2017.1360170.
Kelleway, J. et al., 2017: Technical review of opportunities for including blue carbon in the Australian Government’s Emissions Reduction Fund. Commonwealth Scientific and Industrial Research Organisation,, Australia.
Kelly, E. 2020: Rising seas pose a cultural threat to Australia’s ‘forgotten people’. [Available at: https://theconversation.com/rising-seas-pose-a-cultural-threat-to-australias-forgotten-people-34359 accessed 4 November]
Kelly, P. et al., 2016: Zooplankton responses to increasing sea surface temperatures in the southeastern Australia global marine hotspot. Estuar. Coast. Shelf Sci. , 180, 242–257, doi:10.1016/j.ecss.2016.07.019.
Kench, P. S. et al., 2018: Co-creating Resilience Solutions to Coastal Hazards Through an Interdisciplinary Research Project in New Zealand. Journal of Coastal Research, 85, 1496–1500, doi:10.2112/si85-300.1.
Kennedy, E. V., A. Ordoñez and G. Diaz-Pulido, 2018: Coral bleaching in the southern inshore Great Barrier Reef: a case study from the Keppel Islands. Mar. Freshwater Res. , 69 (1), doi:10.1071/mf16317.
Keppel, G. et al., 2015: The capacity of refugia for conservation planning under climate change. Front. Ecol. Environ. , 13 (2), 106–112, doi:10.1890/140055.
Kettles, H. and R. G. Bell, 2015: Estuarine ecosystem. In: Freshwater conservation under a changing climate, 2015 [Robertson, H., S. Bowie, R. White, R. Death and D. Collins (eds.)], Dept of Conservation publication, Christchurch, 24–30.
Khan, S. J. et al., 2015: Extreme weather events: Should drinking water quality management systems adapt to changing risk profiles?Water Research, 85, 124–136, doi: http://dx.doi.org/10.1016/j.watres.2015.08.018.
Kiem, A. S. et al., 2016: Natural hazards in Australia: droughts. Climatic Change, 139 (1), 37–54, doi:10.1007/s10584-016-1798-7.
King, A. D., M. G. Donat, L. V. Alexander and D. J. Karoly, 2015: The ENSO-Australian rainfall teleconnection in reanalysis and CMIP5. Climate Dynamics, 44 (9–10), 2623–2635, doi:10.1007/s00382-014-2159-8.
King, A. D., D. J. Karoly and B. J. Henley, 2017: Australian climate extremes at 1.5°C and 2°C of global warming. Nature Climate Change, 7 (6), 412–416, doi:10.1038/nclimate3296.
King, D. et al., 2012: Maori Community Adaptation to Climate Variability and Change. National Institute of Atmospheric and Water Research, 131 [Available at: https://niwa.co.nz/sites/niwa.co.nz/files/niwa_report_akl2011-015_0.pdf ].
King, D. J., R. M. Newnham, W. Roland Gehrels and K. J. Clark, 2020: Late Holocene sea-level changes and vertical land movements in New Zealand. New Zealand Journal of Geology and Geophysics, 1–16, doi:10.1080/00288306.2020.1761839.
King, D. N. et al., 2013: Coastal adaptation to climate variability and change: Examining community risk, vulnerability and endurance at Mitimiti, Hokianga, Aotearoa-New Zealand. NIWA, 140 [Available at: https://niwa.co.nz/sites/niwa.co.nz/files/NIWA%20Report%20AKL2013-022_smaller.pdf ].
King, D. N., G. Penny and C. Severne, 2010: The climate change matrix facing Māori society. In: Climate change adaptation in New Zealand: Future scenarios and some sectoral perspectives [Jones, N. W. B. (ed.)]. New Zealand Climate Change Centre,Wellington, 100–111.
King, K. J., R. M. de Ligt and G. J. Cary, 2011: Fire and carbon dynamics under climate change in south-eastern Australia: insights from FullCAM and FIRESCAPE modelling. Int. J. Wildland Fire, 20 (4), 563–577, doi:10.1071/WF09073.
Kingsley, J., M. Townsend, C. Henderson-Wilson and B. Bolam, 2013: Developing an Exploratory Framework Linking Australian Aboriginal Peoples’ Connection to Country and Concepts of Wellbeing. Int J Environ Res Public Health, 10 (2), 678–698.
Kirby, J. M. et al., 2014: Climate change and environmental water reallocation in the Murray–Darling Basin: Impacts on flows, diversions and economic returns to irrigation. Journal of Hydrology, 518, 120–129, doi:10.1016/j.jhydrol.2014.01.024.
Kirkegaard, J. A. and J. R. Hunt, 2011: Increasing productivity by matching farming system management and genotype in water-limited environments. Journal of Experimental Botany, 61, 4129–4143, doi:doi:10.1093/jxb/erq245.
Kirono, D. G. C. et al., 2020: Drought projections for Australia: Updated results and analysis of model simulations. Weather and Climate Extremes, 30, 100280, doi:10.1016/j.wace.2020.100280.
Kjellstrom, T. et al., 2016: Heat, Human Performance, and Occupational Health: A Key Issue for the Assessment of Global Climate Change Impacts. Annu. Rev. Public Health, 37, 97–112, doi:10.1146/annurev-publhealth-032315-021740.
Knight-Lenihan, S., 2016: Benefit cost analysis, resilience and climate change. Clim. Policy, 16 (7), 909–923, doi:10.1080/14693062.2015.1052957.
Knowles, N. L. B. and D. Scott, 2020: Media representations of climate change risk to ski tourism: a barrier to climate action?null, 1–8, doi:10.1080/13683500.2020.1722077.
Knutson, T. R. and F. Zeng, 2018: Model Assessment of Observed Precipitation Trends over Land Regions: Detectable Human Influences and Possible Low Bias in Model Trends. Journal of Climate, 31 (12), 4617–4637, doi:10.1175/jcli-d-17-0672.1.
Koech, R. and P. Langat, 2018: Improving Irrigation Water Use Efficiency: A Review of Advances, Challenges and Opportunities in the Australian Context. Water, 10 (12), 1771, doi:10.3390/w10121771.
Koehler, J. et al., 2019: A research agenda for the Sustainability Transitions Research Network, State of the art and future directions. Environmental Innovation and Societal Transitions, 31, 1–32, doi: https://doi.org/10.1016/j.eist.2019.01.004.
Kompas, T., V. H. Pham and T. N. Che, 2018: The Effects of Climate Change on GDP by Country and the Global Economic Gains From Complying With the Paris Climate Accord. Earth’s Future, 6 (8), 1153–1173, doi:10.1029/2018ef000922.
Kool, R., J. Lawrence, M. Drews and R. Bell, 2020: Preparing for Sea-Level Rise through Adaptive Managed Retreat of a New Zealand Stormwater and Wastewater Network. Infrastructures, 5 (11), 92, doi:10.3390/infrastructures5110092.
Kornakova, M. and B. Glavovic, 2018: Institutionalising wildfire planning in New Zealand: Lessons learnt from the 2009 Victorian bushfire experience. Australas. J. Disaster Trauma Stud. , 22 (2), 12.
Kossin, J. P., 2018: A global slowdown of tropical-cyclone translation speed. Nature, 558 (7708), 104–107, doi:10.1038/s41586-018-0158-3.
Kotey, B., 2015: Demographic and economic changes in remote Australia. Australian Geographer, 46 (2), 183–201.
KPMG, 2021: Anticipate, prepare, respond—Geopolitical megatrends and business resilience. Australian Geopolitics Hub, KPMG Australia, 12 [Available at: https://assets.kpmg/content/dam/kpmg/au/pdf/2021/geopolitical-megatrends-business-resilience.pdf ].
Kunapo, J. et al., 2018: A spatially explicit framework for climate adaptation. Urban Water Journal, , 15 (2), 159–166, doi:10.1080/1573062X.2018.1424216.
Kwakkel, J. H., W. E. Walker and M. Haasnoot, 2016: Coping with the Wickedness of Public Policy Problems: Approaches for Decision Making under Deep Uncertainty. Journal of Water Resources Planning and Management , 142 (3), 01816001, doi:10.1061/(asce)wr.1943-5452.0000626.
Lai, H. et al., 2020: Effects of heavy rainfall on waterborne disease hospitalizations among young children in wet and dry areas of New Zealand. Environ. Int. , 145, 106136, doi:10.1016/j.envint.2020.106136.
Lakeman-Fraser, P. and R. M. Ewers, 2013: Enemy release promotes range expansion in a host plant. Oecologia, 172 (4), 1203–1212, doi:10.1007/s00442-012-2555-x.
Langer, E. R., J. McLennan and D. M. Johnston, 2018: Editorial: Special issue on the Port Hills wildfires. Australas. J. Disaster Trauma Stud. , 22 (2), 29–34.
Langton, M. et al., 2012: National Climate Change Adaptation Research Plan for Indigenous Communities. National Climate Change Adaptation Research Facility, Gold Coast.
Lantschner, M., et al., 2017: Predicting North American Scolytinae invasions in the Southern Hemisphere. Ecological Applications, 27, 66–77.
Lao, J. et al., 2016: Working smart: An exploration of council workers’ experiences and perceptions of heat in Adelaide, South Australia. Saf. Sci. , 82, 228–235, doi:10.1016/j.ssci.2015.09.026.
Laufkötter, C., J. Zscheischler and T. L. Frölicher, 2020: High-impact marine heatwaves attributable to human-induced global warming. Science, 369 (6511), 1621–1625, doi:10.1126/science.aba0690.
Lavorel, S. et al., 2019: Mustering the power of ecosystems for adaptation to climate change. Environ. Sci. Policy, 92, 87–97, doi:10.1016/j.envsci.2018.11.010.
Law, C. S. et al., 2018a: Ocean acidification in New Zealand waters: trends and impacts. New Zealand Journal of Marine and Freshwater Research, 52 (2), 155–195, doi:10.1080/00288330.2017.1374983.
Law, C. S. et al., 2018b: Climate change projections for the surface ocean around New Zealand. New Zealand Journal of Marine and Freshwater Research, 52 (3), 309–335, doi:10.1080/00288330.2017.1390772.
Law, C. S. et al., 2016: Climate Changes, Impacts and Implications for New Zealand to 2100. Synthesis Report: RA2 Marine Case Study. The New Zealand EEZ and South West Pacific, 41 [Available at: https://ccii.org.nz/app/uploads/2017/04/RA2-MarineCaseStudySynthesisReport.pdf ].
Lawrence, J. et al., 2018a: National guidance for adapting to coastal hazards and sea-level rise: Anticipating change, when and how to change pathway. Environmental Science & Policy, 82, 100–107, doi:10.1016/j.envsci.2018.01.012.
Lawrence, J. et al., 2020a: Supporting decision making through adaptive tools in a changing climate: Practice guidance on signals and triggers. Victoria University of Wellington, 67 [Available at: https://www.deepsouthchallenge.co.nz/sites/default/files/2020-03/Supporting%20decision%20making%20through%20adaptive%20tools%20in%20a%20changing%20climate%20Practice%20guidance%20on%20signals%20and%20triggers.pdf ].
Lawrence, J., R. Bell and A. Stroombergen, 2019a: A Hybrid Process to Address Uncertainty and Changing Climate Risk in Coastal Areas Using Dynamic Adaptive Pathways Planning, Multi-Criteria Decision Analysis & Real Options Analysis: A New Zealand Application. Sustainability, 11 (2), 406, doi:10.3390/su11020406.
Lawrence, J., P. Blackett, N. A. Craddock-Henry and B. J. Nistor, 2018b: Climate Change: The Cascade Effect. Cascading impacts and implications for Aotearoa New Zealand. Deep South National Science Challenge, Victoria University of Wellington Wellington, New Zealand.
Lawrence, J. et al., 2016: Synthesis Report RA4: Enhancing capacity and increasing coordination to support decision making. Climate Change Impacts and Implications (CCII) for New Zealand to 2100. MBIE contract C01X1225. NZCCRI, Victoria University of Wellington; NIWA; Landcare Research, Wellington, 74.
Lawrence, J., P. Blackett and N. A. Cradock-Henry, 2020b: Cascading climate change impacts and implications. Climate Risk Management , 29, 100234, doi:10.1016/j.crm.2020.100234.
Lawrence, J. et al., 2020c: Implementing Pre-Emptive Managed Retreat: Constraints and Novel Insights. Current Climate Change Reports, 6, 66–80, doi: https://doi.org/10.1007/s40641-020-00161-z.
Lawrence, J. and M. Haasnoot, 2017: What it took to catalyse uptake of dynamic adaptive pathways planning to address climate change uncertainty. Environmental Science & Policy, 68, 47–57, doi:10.1016/j.envsci.2016.12.003.
Lawrence, J. et al., 2019b: Dynamic Adaptive Policy Pathways (DAPP): From Theory to Practice. In: Decision making under Deep Uncertainty. From theory to Practice. [Marchau, V. A. W. J., W. E. Walker, P. J. T. M. Bloemen and S. W. Popper (eds.)]. Springer Nature, Switzerland, 187–199.
Lawrence, J. and W. Saunders, 2017: The Planning Nexus Between Disaster Risk Reduction and Climate Change Adaptation. In: The Routledge Handbook of Disaster Risk Reduction Including Climate Change Adaptation. Routledge, 418–428.
Lawrence, J. et al., 2015: Adapting to changing climate risk by local government in New Zealand: institutional practice barriers and enablers. Local Environment , 20 (3), 298–320, doi:10.1080/13549839.2013.839643.
Laz, O. U., A. Rahman, A. Yilmaz and K. Haddad, 2014: Trends in sub-hourly, sub-daily and daily extreme rainfall events in eastern Australia. Journal of Water and Climate Change, 5 (4), 667–675, doi:10.2166/wcc.2014.035.
Lazarow, N., 2017: Real options for coastal adaptation. CoastAdapt, National Climate Change Adaptation Research Facility. https://coastadapt.com.au/sites/default/files/factsheets/T4W5_Real_options.pdf.
Leblanc, M., S. Tweed, A. Van Dijk and B. Timbal, 2012: A review of historic and future hydrological changes in the Murray-Darling Basin. Global and Planetary Change, 80–81, 226–246, doi:10.1016/j.gloplacha.2011.10.012.
Lee, E., 2016: Protected areas, country and value: The Nature–Culture Tyranny of the IUCN’s protected area guidelines for Indigenous Australians. Antipode, 48 (2), 355–374.
Lee, H.-L., Y.-P. Lin and J. R. Petway, 2018: Global Agricultural Trade Pattern in A Warming World: Regional Realities. Sustain. Sci. Pract. Policy, 10 (8), 2763, doi:10.3390/su10082763.
Lees, A. M. et al., 2019: The Impact of Heat Load on Cattle. Animals (Basel) , 9 (6), doi:10.3390/ani9060322.
Leitch, A. M. and E. L. Bohensky, 2014: Return to ‘a new normal’: Discourses of resilience to natural disasters in Australian newspapers 2006–2010. Global Environmental Change, 26, 14–26, doi:10.1016/j.gloenvcha.2014.03.006.
Leitch, A. M. et al., 2019: Co-development of a climate change decision support framework through engagement with stakeholders. Climatic Change, 153 (4), 587–605, doi:10.1007/s10584-019-02401-0.
Lenoir, J. and J. C. Svenning, 2015: Climate-related range shifts–a global multidimensional synthesis and new research directions. Ecography, 38 (1), 15–28.
Levy, R. et al., 2020: Te tai pari o Aotearoa – Future sea level rise around New Zealand’s dynamic coastline. New Zealand Coastal Society, 10 [Available at: https://www.coastalsociety.org.nz/assets/Publications/Special-Issues/SP4-Low-res-version.pdf ?].
Lewis, S. C., A. D. King and D. M. Mitchell, 2017: Australia’s Unprecedented Future Temperature Extremes Under Paris Limits to Warming. Geophysical Research Letters, 44 (19), 9947–9956, doi:10.1002/2017gl074612.
LGAQ and DES. QCoast 2100: Councils leading coastal adaptation. [Available at: https://www.qcoast2100.com.au/, accessed September 2021]
LGNZ, 2017: New Zealand Local Government Leaders’ Climate Change Declaration. Local Government New Zealand, 8 [Available at: https://www.lgnz.co.nz/assets/Uploads/0827d40e5d/Climate-Change-Declaration.pdf ].
LGNZ, 2019: Vulnerable: The quantum of local government instrastructure exposed to sea level rise[Simonson, T. and G. Hall (eds.)]. Local Government New Zealand, 51 [Available at: http://www.lgnz.co.nz/our-work/publications/vulnerable-the-quantum-of-local-government-infrastructure-exposed-to-sea-level-rise ].
Liedloff, A. C., E. L. Woodward, G. A. Harrington and S. Jackson, 2013: Integrating indigenous ecological and scientific hydro-geological knowledge using a Bayesian Network in the context of water resource development. Journal of Hydrology, 499, 177–187, doi:10.1016/j.jhydrol.2013.06.051.
Lieffering, M. e. a., 2016: Exploring climate change impacts and adaptations of extensive pastoral agriculture systems by combining biophysical simulation and farm system models. Agricultural Systems, 144, 77–86.
Ligtermoet, E., 2016: Maintaining customary harvesting of freshwater resources: sustainable Indigenous livelihoods in the floodplains of northern Australia. Rev Fish Biol Fisheries, 26, 649–678.
Lim, E. P. et al., 2016: The impact of the Southern Annular Mode on future changes in Southern Hemisphere rainfall. Geophysical Research Letters, doi: https://doi.org/10.1002/2016GL069453.
Lin, B. B. et al., 2017: Adaptation Pathways in Coastal Case Studies: Lessons Learned and Future Directions. Coast. Manage. , 45 (5), 384–405, doi:10.1080/08920753.2017.1349564.
Lin, B. B., J. Meyers, R. M. Beaty and G. B. Barnett, 2016: Urban Green Infrastructure Impacts on Climate Regulation Services in Sydney, Australia. Sustain. Sci. Pract. Policy, 8 (8), 788, doi:10.3390/su8080788.
Lindenmayer, D., D. Blair, L. McBurney and S. Banks, 2015: Mountain Ash: Fire, Logging and the Future of Victoria’s Giant Forests. CSIRO Publishing,, Australia, 200 pp.
Lindenmayer, D. and C. Taylor, 2020a: Extensive recent wildfires demand more stringent protection of critical old growth forest. Pacific Conservation Biology, 26 (4), 384, doi:10.1071/pc20037.
Lindenmayer, D. B. et al., 2020: Managing interacting disturbances: Lessons from a case study in Australian forests. Journal of Applied Ecology, 57 (9), 1711–1716, doi:10.1111/1365-2664.13696.
Lindenmayer, D. B. and C. Taylor, 2020b: New spatial analyses of Australian wildfires highlight the need for new fire, resource, and conservation policies. Proc. Natl. Acad. Sci. U. S. A. , 117 (22), 12481–12485, doi:10.1073/pnas.2002269117.
Lindsay, J. et al., 2019: The Role of Community Champions in Long-Term Sustainable Urban Water Planning. Water, 11 (3), 476, doi:10.3390/w11030476.
Ling, S. D., N. S. Barrett and G. J. Edgar, 2018: Facilitation of Australia’s southernmost reef-building coral by sea urchin herbivory. Coral Reefs, 37 (4), 1053–1073, doi:10.1007/s00338-018-1728-4.
Ling, S. D. and A. J. Hobday, 2019: National research planning accelerates relevance and immediacy of climate-adaptation science. Mar. Freshwater Res. , 70 (1), doi:10.1071/mf17330.
Ling, S. D. and J. P. Keane, 2018: Resurvey of the longspined sea urchin (Centrostephanus rodgersii) and associated barren reef in Tasmania. Institute for Marine and Antarctic Studies, University of Tasmania [Available at: https://eprints.utas.edu.au/28761/ ].
Linnenluecke, M. K., A. Griffiths and P. J. Mumby, 2015: Executives’ engagement with climate science and perceived need for business adaptation to climate change. Clim. Change, 131 (2), 321–333.
Lintermans, M. et al., 2020: Big trouble for little fish: identifying Australian freshwater fishes in imminent risk of extinction. Pacific Conservation Biology, 26 (4), 365, doi:10.1071/pc19053.
Little, L. R. et al., 2015: Funding climate adaptation strategies with climate derivatives. Climate Risk Management , 8, 9–15, doi:10.1016/j.crm.2015.02.002.
Little, L. R. and B. B. Lin, 2015: A decision analysis approach to climate adaptation: a structured method to consider multiple options. Mitigation and Adaptation Strategies for Global Change, 1–14, doi:10.1007/s11027-015-9658-8.
Liu, N. et al., 2020: Drought can offset potential water use efficiency of forest ecosystems from rising atmospheric CO2. Journal of Environmental Sciences, 90, 262–274, doi:10.1016/j.jes.2019.11.020.
Liu, P. R. and A. E. Raftery, 2021: Country-based rate of emissions reductions should increase by 80% beyond nationally determined contributions to meet the 2°C target. Commun Earth Environ, 2, doi:10.1038/s43247-021-00097-8.
Liu, W. et al., 2018: Global Freshwater Availability Below Normal Conditions and Population Impact Under 1.5 and 2°C Stabilization Scenarios. Geophysical Research Letters, 45 (18), 9803–9813, doi:10.1029/2018gl078789.
Liu, X. et al., 2017: Assessing the impact of historical and future climate change on potential natural vegetation types and net primary productivity in Australian grazing lands. The Rangeland Journal, 39 (4), 387, doi:10.1071/rj17081.
Llewelyn, J. et al., 2016: Intraspecific variation in climate-relevant traits in a tropical rainforest lizard. Diversity and Distributions, 22 (10), 1000–1012, doi:10.1111/ddi.12466.
Lobell, D. B. et al., 2015: The shifting influence of drought and heat stress for crops in northeast Australia. Global Change Biology, 21 (11), 4115–4127, doi:10.1111/gcb.13022.
Loechel, B. and J. Hodgkinson, 2014: Climate Impacts and Adaptation in Australian Mining Communities: Industry and Local Government Views and Activities—2013 Follow-up Survey. CSIRO Publishing,, Australia, 54.
Longden, T., 2019: The impact of temperature on mortality across different climate zones. Clim. Change, doi:10.1007/s10584-019-02519-1.
Looi, J. C. L., S. Allison, T. Bastiampillai and P. Maguire, 2020: Commentary. Fire, disease and fear: Effects of the media coverage of 2019–2020 Australian bushfires and novel coronavirus 2019 on population mental health. Australian & New Zealand Journal of Psychiatry, 54 (9), 938–940, doi:10.1177/0004867420931163.
Loorbach, D., N. Frantzeskaki and F. Avelino, 2017: Sustainability Transitions Research: Transforming Science and Practice for Societal Change. Annu. Rev. Environ. Resour. , 42 (1), 599–626, doi:10.1146/annurev-environ-102014–021340.
Loosemore, M., J. Carthey, V. Chandra and A. Mirti Chand, 2011: Climate change risks and opportunities in hospital adaptation. International Journal of Disaster Resilience in the Built Environment , 2 (3), 210–221, doi:10.1108/17595901111167097.
Loosemore, M., V. Chow and D. McGeorge, 2014: Managing the health risks of extreme weather events by managing hospital infrastructure. Eng. Constr. Archit. Manage. , 21 (1), 4–32, doi:10.1108/ECAM-10-2012-0060.
Lough, J. M., K. D. Anderson and T. P. Hughes, 2018: Increasing thermal stress for tropical coral reefs: 1871–2017. Sci. Rep. , 8 (1), 6079, doi: http://dx.doi.org/10.1038/s41598-018-24530-9.
Lough, J. M., S. E. Lewis and N. E. Cantin, 2015: Freshwater impacts in the central Great Barrier Reef: 1648–2011. Coral Reefs, 34 (3), 739–751, doi:10.1007/s00338-015-1297-8.
Loughnan, M., M. Carroll and N. Tapper, 2015: The relationship between housing and heat wave resilience in older people. Int. J. Biometeorol. , 59 (9), 1291–1298, doi:10.1007/s00484-014-0939-9.
Loughnan, M. E. et al., 2013: A spatial vulnerability analysis of urban populations during extreme heat events in Australian capital cities. National Climate Change Adaptation Research Facility, Australia.
Lowe, K., J. G. Castley and J. M. Hero, 2015: Resilience to climate change: complex relationships among wetland hydroperiod, larval amphibians and aquatic predators in temporary wetlands. Mar. Freshwater Res. , 66 (10), 886–899, doi:10.1071/mf14128.
Lu, B. et al., 2021: A zero-carbon, reliable and affordable energy future in Australia. Energy, 220, 119678, doi:10.1016/j.energy.2020.119678.
Lu, P. et al., 2020: Temporal trends of the association between ambient temperature and hospitalisations for cardiovascular diseases in Queensland, Australia from 1995 to 2016: A time-stratified case-crossover study. PLoS Med. , 17 (7), e1003176, doi:10.1371/journal.pmed.1003176.
Lucas, C. H. and K. I. Booth, 2020: Privatizing climate adaptation: How insurance weakens solidaristic and collective disaster recovery. WIREs Climate Change, doi:10.1002/wcc.676.
Lukasiewicz, A., S. Dovers and M. Eburn, 2017: Shared responsibility: the who, what and how. Environmental Hazards, 16 (4), 291–313, doi:10.1080/17477891.2017.1298510.
Lunney, D., E. Stalenberg, T. Santika and J. R. Rhodes, 2014: Extinction in Eden: identifying the role of climate change in the decline of the koala in south-eastern NSW. Wildl. Res. , 41 (1), 22–34.
Luo, Q., K. Behrendt and M. Bange, 2017: Economics and Risk of Adaptation Options in the Australian Cotton Industry. Agric. Syst. , 150, 46–53, doi:10.1016/j.agsy.2016.09.014.
Lyons, I. et al., 2019: Putting uncertainty under the cultural lens of Traditional Owners from the Great Barrier Reef Catchments. Regional Environmental Change, 19 (6), 1597–1610.
Ma, S. and A. P. Kirilenko, 2019: Climate Change and Tourism in English-Language Newspaper Publications. Journal of Travel Research, 004728751983915, doi:10.1177/0047287519839157.
Ma, W., A. Renwick and X. Zhou, 2020: Short communication: The relationship between farm debt and dairy productivity and profitability in New Zealand. J. Dairy Sci. , 103 (9), 8251–8256, doi:10.3168/jds.2019-17506.
MacDiarmid, A. B., C. S. Law, M. Pinkerton and J. Zeldis, 2013: New Zealand marine ecosystem services. Ecosystem services in New Zealand--Conditions and trends, Marine Ecosystem Services, New Zealand, 238–253 [Available at: http://www.mwpress.co.nz/__data/assets/pdf_file/0005/77045/1_17_MacDiarmid.pdf ].
Macfadyen, S., G. McDonald and M. P. Hill, 2018: From species distributions to climate change adaptation: Knowledge gaps in managing invertebrate pests in broad-acre grain crops. Agriculture, Ecosystems & Environment , 253, 208–219, doi:10.1016/j.agee.2016.08.029.
Macinnis-Ng, C. et al., 2021: Climate change impacts exacerbate conservation threats in island systems: New Zealand as a case study. Frontiers in Ecology and the Environment , 19 (4), 216–224, doi:10.1002/fee.2285.
Macinnis-Ng, C. and L. Schwendenmann, 2015: Litterfall, carbon and nitrogen cycling in a southern hemisphere conifer forest dominated by kauri (Agathis australis) during drought. Plant Ecology, 216 (2), 247–262, doi:10.1007/s11258-014-0432-x.
Macintosh, A., A. Foerster and J. McDonald, 2015: Policy design, spatial planning and climate change adaptation: a case study from Australia. J. Environ. Planning Manage. , 58 (8), 1432–1453.
Mackey, B. and D. Claudie, 2015: Points of Contact: Integrating Traditional and Scientific Knowledge for Biocultural Conservation. Environmental Ethics, 37 (3), 341–357.
Mackintosh, A. N. et al., 2017: Regional cooling caused recent New Zealand glacier advances in a period of global warming. Nat. Commun. , 8, 14202, doi:10.1038/ncomms14202.
Maclean, K., M. Cuthill and H. Ross, 2014: Six attributes of social resilience. Journal of Environmental Planning and Management , 57 (1), 144–156, doi:10.1080/09640568.2013.763774.
Maier, H. R. et al., 2016: An uncertain future, deep uncertainty, scenarios, robustness and adaptation: How do they fit together?Environmental Modelling & Software, 81, 154–164, doi:10.1016/j.envsoft.2016.03.014.
Mallon, K. et al., 2019: Change Risk to Australia’s Built Environment: A Second Pass National Assessment . 82 [Available at: https://xdi.systems/wp-content/uploads/2019/10/Climate-Change-Risk-to-Australia%E2%80%99s-Built-Environment-V4-final-reduced-2.pdf ].
Mankad, A. and S. Tapsuwan, 2011: Review of socio-economic drivers of community acceptance and adoption of decentralised water systems. J. Environ. Manage. , 92 (3), 380–391, doi:10.1016/j.jenvman.2010.10.037.
Manning, M., J. Lawrence, D. N. King and R. Chapman, 2014: Dealing with changing risks: a New Zealand perspective on climate change adaptation. Regional Environ. Change, 15, 581–594, doi:DOI.10.1007/s10113-014-0673-1.
March-Salas, M. and L. R. Pertierra, 2020: Warmer and less variable temperatures favour an accelerated plant phenology of two invasive weeds across sub-Antarctic Macquarie Island. Austral Ecology, 45 (5), 572–585, doi:10.1111/aec.12872.
Marchau, V. A. W. J., W. E. Walker, P. J. T. M. Bloemen and S. W. Popper, 2019: Introduction. In: Decision Making under Deep Uncertainty. Springer Sham,, New Zealand, 1–20.
Marchionni, V. et al., 2019: Water balance and tree water use dynamics in remnant urban reserves. J. Hydrol. , 575, 343–353, doi:10.1016/j.jhydrol.2019.05.022.
Mariani, M. et al., 2019: Climate change reduces resilience to fire in subalpine rainforests. Glob. Chang. Biol. , 25 (6), doi: https://doi.org/10.1111/gcb.14609.
Marmion, D., K. Obata and J. Troy, 2014: Community, identity, wellbeing: the report of the Second National Indigenous Languages Survey. Australian Institute of Aboriginal and Torres Strait Islander Studies (AIATSIS), Australia, 62 [Available at: https://aiatsis.gov.au/publication/35167 ].
Marmot, M., 2011: Social determinants and the health of Indigenous Australians. Medical Journal of Australia, 194, 512–513, doi:10.5694/j.1326-5377.2011.tb03086.x.
Marshall, G. R. and L. A. Lobry de Bruyn, 2021: Water Policy Reform for Sustainable Development in the Murray-Darling Basin, Australia: Insights from Resilience Thinking. In: Water Resilience: Management and Governance in Times of Change [Baird, J. and R. Plummer (eds.)]. Springer International Publishing, Cham, 65–89.
Marshall, N. et al., 2019: Reef Grief: investigating the relationship between place meanings and place change on the Great Barrier Reef, Australia. Sustainability Science, 14 (3), 579–587, doi:10.1007/s11625-019-00666-z.
Marshall, N. A., 2015: Adaptive capacity on the northern Australian rangelands. The Rangeland Journal, 37 (6), doi:10.1071/rj15054.
Marshall, N. A. and C. J. Stokes, 2014: Influencing adaptation processes on the Australian rangelands for social and ecological resilience. Ecology and Society, 19 (2), doi:10.5751/es-06440-190214.
Maru, Y. T. et al., 2014: A linked vulnerability and resilience framework for adaptation pathways in remote disadvantaged communities. Glob. Environ. Change, 28 (0), 337–350, doi:10.1016/j.gloenvcha.2013.12.007.
Marzeion, B. et al., 2020: Partitioning the Uncertainty of Ensemble Projections of Global Glacier Mass Change. Earth’s Future, 8 (7), doi:10.1029/2019ef001470.
Mathew, S., B. Zeng, K. K. Zander and R. K. Singh, 2018: Exploring agricultural development and climate adaptation in northern Australia under climatic risks. The Rangeland Journal, 40 (4), 353, doi:10.1071/rj18011.
Matteo, M. D. et al., 2019: Controlling rainwater storage as a system: An opportunity to reduce urban flood peaks for rare, long duration storms. Environmental Modelling & Software, 111, 34–41, doi:10.1016/j.envsoft.2018.09.020.
Matthews, V. et al., 2019: Differential Mental Health Impact Six Months After Extensive River Flooding in Rural Australia: A Cross-Sectional Analysis Through an Equity Lens. Frontiers in Public Health, 7, doi:10.3389/fpubh.2019.00367.
Matusick, G. et al., 2018: Chronic historical drought legacy exacerbates tree mortality and crown dieback during acute heatwave-compounded drought. Environmental Research Letters, 13 (9), 095002, doi:10.1088/1748-9326/aad8cb.
Maybery, D. et al., 2020: A mixed-methods study of psychological distress following an environmental catastrophe: the case of the Hazelwood open-cut coalmine fire in Australia. Anxiety Stress Coping, 33 (2), 216–230, doi:10.1080/10615806.2019.1695523.
MBIE, 2019a: Electricity demand and generation scenarios: Scenario and results summary. Ministry of Business, Innovation and Employment, 40 [Available at: https://www.mbie.govt.nz/dmsdocument/5977-electricity-demand-and-generation-scenarios ].
MBIE, 2019b: New Zealand-Aotearoa Government Tourism Strategy. Ministry of Business, Innovation and Employment and Department of Conservation, 22 [Available at: https://www.mbie.govt.nz/dmsdocument/5482-2019-new-zealand-aotearoa-government-tourism-strategy-pdf ].
McAdam, J., 2015: The emerging New Zealand jurisprudence on climate change, disasters and displacement. Migration Studies, 3, 131–142.
McAneney, J. et al., 2019: Normalised insurance losses from Australian natural disasters: 1966–2017. Environmental Hazards, 18 (5), 414–433, doi:10.1080/17477891.2019.1609406.
McBride, G. et al., 2016: The Firth of Thames and Lower Waihou River. Synthesis Report RA2, Coastal Case Study. Climate Changes, Impacts and Implications (CCII) for New Zealand to 2100. 50 [Available at: https://researchspace.auckland.ac.nz/handle/2292/39671 ].
McClure, L. and D. Baker, 2018: How do planners deal with barriers to climate change adaptation? A case study in Queensland, Australia. Landsc. Urban Plan. , 173, 81–88, doi:10.1016/j.landurbplan.2018.01.012.
McCormack, P. C., 2018: The Legislative Challenge of Facilitating Climate Change Adaptation for Biodiversity. Aust. Law J. , 92 (7), 546–562.
McDonald, J., 2020: Girt by Sea: Antipodean Lessons in Coastal Adaptation Law. Sea Grant L. & Pol’y J. , 10, 29.
McDonald, J. et al., 2019: Adaptation pathways for conservation law and policy. Wiley Interdisciplinary Reviews-Climate Change, 10 (1), doi:10.1002/wcc.555.
McDowell, R. W. et al., 2016: A review of the policies and implementation of practices to decrease water quality impairment by phosphorus in New Zealand, the UK, and the US. Nutr. Cycling Agroecosyst. , 104 (3), 289–305, doi:10.1007/s10705-015-9727-0.
McEvoy, D. and J. Mullett, 2014: Enhancing the resilience of seaports to a changing climate. Applied Studies in Climate Adaptation, 200–207, doi:10.1002/9781118845028.ch22.
McFadgen, B. and D. Huitema, 2017: Stimulating Learning through Policy Experimentation: A Multi-Case Analysis of How Design Influences Policy Learning Outcomes in Experiments for Climate Adaptation. Water, 9 (9), 648, doi:10.3390/w9090648.
McInnes, K. et al., 2015: Information for Australian impact and adaptation planning in response to sea-level rise. Australian Meteorological and Oceanographic Journal, 65 (1), 127–149, doi:10.22499/2.6501.009.
McInnes, K. L. et al., 2016: Natural hazards in Australia: sea level and coastal extremes. Clim. Change, 139 (1), 69–83.
McKemey, M. et al., 2020: Indigenous Knowledge and Seasonal Calendar Inform Adaptive Savanna Burning in Northern Australia. Sustainability, 12 (3), 995, doi:10.3390/su12030995.
McKerchar, A. and B. Mullan, 2004: Seasonal Inflow Distributions for New Zealand Hydroelectric Power Stations. NIWA Client Report: CHC2004-131, Prepared for the Ministry of Economic Development (MED) by the National Institute of Water and Atmospheric Research (NIWA), Wellington, New Zealand, 12.
McKerchar, A. I., J. A. Renwick and J. Schmidt, 2010: Diminishing streamflows on the east coast of the South Island New Zealand and linkage to climate variability and change. J. Hydrol. , 49 (1), 1–14.
McKergow, L. A., F. E. Matheson and J. M. Quinn, 2016: Riparian management: A restoration tool for New Zealand streams. Ecological Management & Restoration, 17 (3), 218–227, doi:10.1111/emr.12232.
McKnight, B. and M. K. Linnenluecke, 2019: Patterns of Firm Responses to Different Types of Natural Disasters. Business & Society, 58 (4), 813–840, doi:10.1177/0007650317698946.
McLean, E. H. et al., 2014: Plasticity of functional traits varies clinally along a rainfall gradient in Eucalyptus tricarpa. Plant Cell Environ. , 37 (6), 1440–1451, doi:10.1111/pce.12251.
McLean, L. J. et al., 2018: Impact of rising sea levels on Australian fur seals. PeerJ, 6, e5786, doi:10.7717/peerj.5786
10.7717/peerj.5786. eCollection 2018.
McLennan, B., J. Whittaker and J. Handmer, 2016: The changing landscape of disaster volunteering: opportunities, responses and gaps in Australia. Natural Hazards, 84 (3), 2031–2048, doi:10.1007/s11069-016-2532-5.
McMahon, S. J. et al., 2020: Elevated CO2 and heatwave conditions affect the aerobic and swimming performance of juvenile Australasian snapper. Marine Biology, 167 (1), doi:10.1007/s00227-019-3614-1.
McManus, P., K. K. Shrestha and D. Yoo, 2014: Equity and climate change: Local adaptation issues and responses in the City of Lake Macquarie, Australia. Urban Climate, 10, 1–18, doi:10.1016/j.uclim.2014.08.003.
McNamara, K. E. and L. Buggy, 2017: Community-based climate change adaptation: a review of academic literature. Local Environ. , 22 (4), 443–460.
McNamara, K. E., R. Westoby and S. G. Smithers, 2017: Identification of limits and barriers to climate change adaptation: case study of two islands in Torres Strait, Australia. Geographical Research, 55 (4), 438–455, doi:10.1111/1745-5871.12242.
McNicol, I., 2021: Increasing the Adaptation Pathways Capacity of Land Use Planning – Insights from New South Wales, Australia. Urban Policy and Research, 39 (2), 143–156, doi:10.1080/08111146.2020.1788530.
McTernan, W. P., M. F. Dollard, M. R. Tuckey and R. J. Vandenberg, 2016: Beneath the Surface: An Exploration of Remoteness and Work Stress in the Mines. Psychosocial Factors at Work in the Asia Pacific, 341–358, doi:10.1007/978-3-319-44400-0_19.
MDBA, 2011: Plain English summary of the proposed Basin Plan. Murray–Darling Basin Authority, 138 [Available at: https://www.mdba.gov.au/sites/default/files/archived/proposed/plain_english_summary.pdf ].
MDBA, 2012: Proposed Basin Plan — A revised draft . Murray Darling Basin Authority, 215 [Available at: https://www.mdba.gov.au/sites/default/files/archived/revised-BP/PBP_reviseddraft.pdf ].
MDBA, 2013: Handbook for Practitioners: Water Plan Requirements. Murray–Darling Basin Authority, 120 [Available at: https://www.mdba.gov.au/sites/default/files/pubs/WRP-Handbook-for-Practitioners_0.pdf ].
MDBA, 2014: Basin-wide environmental watering strategy. 125 [Available at: https://www.mdba.gov.au/sites/default/files/pubs/Final-BWS-Nov14.pdf ].
MDBA, 2019: Climate Change and the Murray-Darling Basin—MDBA Discussion Paper. Murray-Darling Basin Authority, Australia, 29.
MDBA, 2020: The 2020 Basin Plan Evaluation. Murray-Darling Basin Authority, 140 [Available at: https://www.mdba.gov.au/sites/default/files/pubs/bp-eval-2020-full-report.pdf ].
Mead, D., 2013: Sustainable management of Pinus radiata plantations. Forestry Paper No. 170, Food and Agriculture Organization of the United Nations. FAO, Rome: .
Meager, J. J. and C. Limpus, 2014: Mortality of inshore marine mammals in eastern Australia is predicted by freshwater discharge and air temperature. PLOS ONE, 9 (4), e94849, doi:10.1371/journal.pone.0094849.
Merzian, R. et al., 2019: Climate of the Nation 2019: Tracking Australia’s attitudes towards climate change and energy. The Australia Institute, Canberra.
Messina, J. P. et al., 2019: The current and future global distribution and population at risk of dengue. Nat Microbiol, 4 (9), 1508–1515, doi:10.1038/s41564-019-0476-8.
Metcalfe, D. and E. Bui, 2016: Land: Contemporary land-use pressures. Australia State of the Environment, Australian Government Department of the Environment and Energy, Canberra [Available at: https://soe.environment.gov.au/theme/land/topic/2016/contemporary-land-use-pressures ].
MfE, 2010: Tools for Estimating the Effects of Climate Change on Flood Flows—A Guidance Manual for Local Government in New Zealand. Ministry for Environment, New Zealand, Ministry for Environment, N. Z., 63 [Available at: https://www.mfe.govt.nz/sites/default/files/tools-estimating-effects-climate-change.pdf ].
MfE, 2016: New Zealand’s Environmental Reporting Series: Our marine environment 2016. ME, New Zealand, Ministry for the Environment & Statistics [Available at: http://www.mfe.govt.nz ].
MfE, 2017a: Coastal Hazards and Climate Change: Guidance for Local Government [Bell, R. G., J. Lawrence, S. Allan, P. Blackett and S. A. Stephens (eds.)]. Ministry for the Environment, 284 p + Appendices [Available at: http://www.mfe.govt.nz/publications/climate-change/coastal-hazards-and-climate-change-guidance-local-government ].
MfE, 2017b: National Policy Statement for Freshwater Management 2014—updated in 2017. Environment, M. f. t., New Zealand, 47 [Available at: https://www.mfe.govt.nz/sites/default/files/media/Fresh%20water/nps-freshwater-ameneded-2017_0.pdf ].
MfE, 2017c: New Zealand’s Environmental Reporting Series: Our atmosphere and climate 2017. 58 [Available at: https://www.mfe.govt.nz/sites/default/files/media/Environmental%20reporting/our-atmosphere-and-climate-2017.pdf ].
MfE, 2018: Climate Change Projections for New Zealand: Atmosphere Projections Based on Simulations from the IPCC Ffith Assessment, 2nd Edition. Ministry for the Environment, Wellington, 131 [Available at: http://www.mfe.govt.nz/publications/climate-change/climate-change-projections-new-zealand ].
MfE, 2019: Environment Aotearoa 2019. Ministry for the Environment, Wellington, New Zealand [Available at: https://www.mfe.govt.nz/publications/environmental-reporting/environment-aotearoa-2019 ].
MfE, 2020a: National Climate Change Risk Assessment for Aotearoa New Zealand: Main report – Arotakenga Tūraru mō te Huringa Āhuarangi o Āotearoa: Pūrongo whakatōpū. Ministry for the Environment, New Zealand, 133 [Available at: https://environment.govt.nz/what-government-is-doing/areas-of-work/climate-change/adapting-to-climate-change/first-national-climate-change-risk-assessment-for-new-zealand ].
MfE, 2020b: National Policy Statement for Freshwater Management . Ministry for the Environment, 70 [Available at: https://www.mfe.govt.nz/sites/default/files/media/Fresh%20water/national-policy-statement-for-freshwater-management-2020.pdf ].
MfE, 2020c: New directions for resource management in New Zealand. Resource Management Review Panel, 531 [Available at: https://www.mfe.govt.nz/sites/default/files/media/RMA/rm-panel-review-report-web.pdf ].
MfE, 2021: Adaptation preparedness: 2020/21 baseline A summary of reporting organisation responses to the first information request under the Climate Change Response Act 2002. Ministry for the Environment, 39 [Available at: https://environment.govt.nz/publications/adaptation-preparedness-202021-baseline/ ].
MfE and Hawke’s Bay Regional Council, 2020: Challenges with implementing the Clifton to Tangoio Coastal Hazards Strategy 2120 case study. Ministry for the environment, 33 [Available at: https://www.mfe.govt.nz/sites/default/files/media/Climate%20Change/challenges-with-implementing-the-Clifton-to-Tangoio-coastal-hazards-strategy-2120-case-study.pdf ].
MfE and Stats NZ, 2021 : Our Land 2021. New Zealand’s Environmental Reporting Series, 61 [Available at: https://environment.govt.nz/assets/Publications/our-land-2021.pdf ].
Mikaloff-Fletcher, S. E., H. C. Bostock, M. J. Williams and A. Forcen, 2017: Modelling the Effects of Ocean Acidification in New Zealand. New Zealand Aquatic Environment and Biodiversity [Available at: https://fs.fish.govt.nz/Doc/24502/AEBR-187-Modelling-Effects-of-Ocean-Acidification.pdf.ashx ].
Milfont, T. L., E. Zubielevitch, P. Milojev and C. G. Sibley, 2021: Ten-year panel data confirm generation gap but climate beliefs increase at similar rates across ages. Nat. Commun. , 12 (1), 4038, doi:10.1038/s41467-021-24245-y.
Miller, C. et al., 2017: Electrically caused wildfires in Victoria, Australia are over-represented when fire danger is elevated. Landsc. Urban Plan. , 167, 267–274, doi:10.1016/j.landurbplan.2017.06.016.
Mills, M. et al., 2016a: Reconciling development and conservation under coastal squeeze from rising sea level. Conservation Letters, 9 (5), 361–368.
Mills, M. et al., 2016b: Perceived and projected flood risk and adaptation in coastal Southeast Queensland, Australia. Climatic Change, 136 (3–4), 523–537, doi:10.1007/s10584-016-1644-y.
Mitchell, J. W., 2013: Power line failures and catastrophic wildfires under extreme weather conditions. Eng. Fail. Anal. , 35, 726.
Mitchell, M. et al., 2017: Mapping Scenario Narratives: A Technique to Enhance Landscape-scale Biodiversity Planning. Conservation and Society, 15 (2), 179, doi:10.4103/cs.cs_15_121.
Mitchell, N. et al., 2019: The Action Plan for Australian Lizards and Snakes 2017. CSIRO Publishing,, Australia, 680 pp.
Moggridge, B. J., L. Betterridge and R. M. Thompson, 2019: Integrating Aboriginal cultural values into water planning: a case study from New South Wales, Australia. Australasian Journal of Environmental Management , 26 (3), 273–286, doi:10.1080/14486563.2019.1650837.
Moglia, M., S. Cook and S. Tapsuwan, 2018: Promoting Water Conservation: Where to from here?Water, 10 (11), 1510, doi:10.3390/w10111510.
Molloy, S. W., A. H. Burbidge, S. Comer and R. A. Davis, 2020: Using climate change models to inform the recovery of the western ground parrot Pezoporus flaviventris. Oryx, 54 (1), 52–61, doi:10.1017/s0030605318000923.
Moloney, S. and H. McClaren, 2018: Designing a ‘Fit-for-Purpose’ Approach to Tracking Progress on Climate Change Adaptation and Resilience: Learning from Local Governments in Australia. In: Resilience-Oriented Urban Planning. Springer, Cham, 67–90.
Monge, J. J., W. J. Parker and J. W. Richardson, 2016: Integrating forest ecosystem services into the farming landscape: A stochastic economic assessment. J Environ Manage, 174, 87–99, doi:10.1016/j.jenvman.2016.01.030.
Moore, A. D. and A. Ghahramani, 2013: Climate change and broadacre livestock production across southern Australia. 1. Impacts of climate change on pasture and livestock productivity, and on sustainable levels of profitability. Glob Chang Biol, 19 (5), 1440–55, doi:10.1111/gcb.12150.
Moore, D., A. Stow and M. R. Kearney, 2018: Under the weather?-The direct effects of climate warming on a threatened desert lizard are mediated by their activity phase and burrow system. J. Anim. Ecol. , 87 (3), 660–671, doi:10.1111/1365-2656.12812.
Moran, C., S. M. Turton and R. Hill, 2014: Adaptation Pathways and Opportunities for the Wet Tropics NRM Cluster region. Volume 2. Infrastructure, Industry, Indigenous peoples, Social adaptation, Emerging planning frameworks, Evolving methodologies and Climate adaptation planning in practice. James Cook University, Cairns. ISBN: 978-0-9941500-2-8. http://eprints.qut.edu.au/78942/1/Moran_et_al_2014__Adaptation_Pathways_Opportunities_WTC_Volume_2-1.pdf.
Moran, M., P. Petrie and V. Sadras, 2019: Effects of late pruning and elevated temperature on phenology, yield components, and berry traits in Shiraz. American Journal of Enology and Viticulture, 70 (1), 9–18, doi:10.5344/ajev.2018.18031.
Morgan, E. A., J. Nalau and B. Mackey, 2019: Assessing the alignment of national-level adaptation plans to the Paris Agreement. Environmental Science & Policy, 93, 208–220, doi:10.1016/j.envsci.2018.10.012.
Morgan, E. A., E. Torabi and A. Dedekorkut-Howes, 2020: Responding to change: lessons from water management for metropolitan governance. Australian Planner, 56 (2), 125–133, doi:10.1080/07293682.2020.1742171.
Morgan, L. K. and A. D. Werner, 2015: A national inventory of seawater intrusion vulnerability for Australia. Journal of Hydrology: Regional Studies, 4, 686–698, doi:10.1016/j.ejrh.2015.10.005.
Morim, J. et al., 2019: Robustness and uncertainties in global multivariate wind-wave climate projections. Nat. Clim. Chang. , 9 (9), 711–718, doi:10.1038/s41558-019-0542-5.
Morrison, C. and C. Pickering, 2013: Limits to Climate Change Adaptation: Case Study of the Australian Alps. Geographical Research, 51 (1), 11–25, doi:10.1111/j.1745-5871.2012.00758.x.
Morrongiello, J. R. and R. E. Thresher, 2015: A statistical framework to explore ontogenetic growth variation among individuals and populations: a marine fish example. Ecological Monographs, 85 (1), 93–115, doi: https://doi.org/10.1890/13-2355.1.
Mosby, V., 2012: Using metasynthesis to develop sensitising concepts to understand Torres Strait Islander migration. Cosmopolitan Civil Societies: an interdisciplinary journal, 5 (1), 1–18.
Mosnier, A. et al., 2014: Global food markets, trade and the cost of climate change adaptation. Food Security, 6 (1), 29–44, doi:10.1007/s12571-013-0319-z.
Moyle, C.-L. J. et al., 2017: Have Australia’s tourism strategies incorporated climate change?J. Sustainable Tour. , 26 (5), 703–721, doi:10.1080/09669582.2017.1387121.
MPI, 2015: Situation and Outlook for Primary Industries. Ministry for Primary Industries, Ministry for Primary Industries New Zealand, 72 [Available at: https://www.mpi.govt.nz/dmsdocument/7878-situation-and-outlook-for-primary-industries-sopi-2015 ].
Munshi, D. et al., 2020: Centring Culture in Public Engagement on Climate Change Adaptation: Re-shaping the Future of the NZ Tourism Sector—A report to the Deep South National Science Challenge. University of Waikato, Deep South National Science Challenge, 48 [Available at: https://www.deepsouthchallenge.co.nz/sites/default/files/2020-02/Centring%20Culture%20Compressed%20Report.pdf ].
Murphy, K. 2020: Torres Strait Islanders take climate change complaint to the United Nations: Morrison government accused of failing to take action to reduce emissions or pursue adaptation measures. [Available at: https://www.theguardian.com/australia-news/2019/may/13/torres-strait-islanders-take-climate-change-complaint-to-the-united-nations accessed 4 November]
Mushtaq, S., 2016: Economic and policy implications of relocation of agricultural production systems under changing climate: Example of Australian rice industry. Land use policy, 52, 277–286, doi:10.1016/j.landusepol.2015.12.029.
Naccarella, A., J. W. Morgan, S. C. Cutler and S. E. Venn, 2020: Alpine treeline ecotone stasis in the face of recent climate change and disturbance by fire. PLOS ONE, 15 (4), e0231339, doi:10.1371/journal.pone.0231339.
Nagle, N. et al., 2017: Aboriginal Australian mitochondrial genome variation – An increased understanding of population antiquity and diversity. Sci. Rep. , 7, 1–12.
Nairn, J. and S. Williams, 2019: Power outages during heatwaves: Predicting mortality burden in Australian cities. Australian Energy Market Operator (AEMO), 37 [Available at: https://aemo.com.au/-/media/files/initiatives/strategic-partnerships/2020/power-outages-and-mortality-burden-australian-cities.pdf ].
Nalau, J. and J. Handmer, 2018: Improving Development Outcomes and Reducing Disaster Risk through Planned Community Relocation. Sustain. Sci. Pract. Policy, 10 (10), 3545, doi:10.3390/su10103545.
Natural Capital Economics, 2018: Heatwaves in Victoria: A Vulnerability Assessment . Department of Environment, Land, Water and Planning, Victoria, 102 [Available at: https://www.climatechange.vic.gov.au/__data/assets/pdf_file/0029/399440/Heatwaves_VulnerabilityAssessment_2018.pdf ].
NCCARF, 2013: Ensuring Australia’s Urban Water Supplies Under Climate Change. National Climate Change Adaptation Research Facility, Gold Coast, Australia, 6.
Neave, I., A. McLeod, G. Raisin and J. Swirepik, 2015: Managing water in the Murray-Darling basin under a variable and changing climate. Water, Australian Water Association, 6 [Available at: https://www.mdba.gov.au/sites/default/files/pubs/Managing%20water%20in%20the%20murray-darling%20basin%20under%20a%20variable%20and%20changing%20climate.pdf ].
Nelson, G. C., H. Valin, R. D. Sands and others, 2014: Climate change effects on agriculture: Economic responses to biophysical shocks. Proceedings of the National Academy of Sciences, 111 (9).
NESP ESCC, 2020: Scenario analysis of climate-related physical risk for buildings and infrastructure: financial disclosure guidelines. . Climate Measurement Standards Initiative, Australia [Available at: https://www.cmsi.org.au/reports ].
NESP ESCC, 2021: Informing strategic development of a national climate services capability for Australia. National Environmental Science Program [Available at: https://nespclimate.com.au/ ].
Newton, P. et al., 2018: Australian cities and the governance of climate change. In: Australia’s Metropolitan Imperative: An Agenda for Governance Reform [Tomlinson, R. and M. Spiller (eds.)]. CSIRO Publishing, Australia, 193.
Newton, P. and P. Newman, 2015: Critical Connections: The Role of the Built Environment Sector in Delivering Green Cities and a Green Economy. Sustainability, 7 (7), 9417–9443, doi:10.3390/su7079417.
Newton, P. C. D. et al., 2014: Detection of historical changes in pasture growth and attribution to climate change. Clim. Res. , 61 (3), 203–214, doi:10.3354/cr01252.
Newton, P. W. and B. C. Rogers, 2020: Transforming Built Environments: Towards Carbon Neutral and Blue-Green Cities. Sustain. Sci. Pract. Policy, 12 (11), 4745, doi:10.3390/su12114745.
Ngai-Tahu, 2018: He Rautaki Mo Te Huringa O Te Ahuarangi Climate Change Strategy. Te Runanga O Ngai Tahu, New Zealand, 32 [Available at: https://ngaitahu.iwi.nz/wp-content/uploads/2018/11/Ngai-Tahu-Climate-Change-Strategy.pdf ].
Ngāti Tahu- Ngāti Whaoa Rūnanga Trust, 2013: Rising above the mist—te aranga ake i te taimahatanga. Iwi Environmental Management Plan, Te Runanga O Ngai Tahu, New Zealand, 116.
Nicholls et al., 2016: Building evidence that effective heat alert systems save lives in southeast Australia. In: Climate Services for Health: Improving public health decision-making in a new climate. WHO/WMO, Geneva, Switzerland, 188–190.
Nidumolu, U. et al., 2014: Spatio-temporal modelling of heat stress and climate change implications for the Murray dairy region, Australia. Int J Biometeorol, 58 (6), 1095–108, doi:10.1007/s00484-013-0703-6.
Nidumolu, U. B., P. T. Hayman, S. M. Howden and B. M. Alexander, 2012: Re-evaluating the margin of the South Australian grain belt in a changing climate. Climate Research, 51, 249–260, doi:10.3354/cr01075.
Nimbs, M. and S. Smith, 2018: Beyond Capricornia: Tropical Sea Slugs (Gastropoda, Heterobranchia) Extend Their Distributions into the Tasman Sea. Diversity, 10 (3), doi:10.3390/d10030099.
Nitschke, M. et al., 2016: Evaluation of a heat warning system in Adelaide, South Australia, using case-series analysis. BMJ Open, 6 (7), e012125, doi:10.1136/bmjopen-2016–012125.
Nitschke, M. et al., 2011: Impact of two recent extreme heat episodes on morbidity and mortality in Adelaide, South Australia: a case-series analysis. Environ. Health, 10, 42, doi:10.1186/1476-069X-10-42.
NIWA, 2019: Annual climate summary 2018. National Institute of Water and Air, New Zealand
NIWA. 2021: NZ Historic Weather Events Catalogue. [Available at: https://hwe.niwa.co.nz/, accessed September]
Nolan, R. H. et al., 2020: Causes and consequences of eastern Australia’s 2019–20 season of mega-fires. Glob. Chang. Biol. , 26 (3), 1039–1041, doi:10.1111/gcb.14987.
Norman, B., P. Newman and W. Steffen, 2021: Apocalypse now: Australian bushfires and the future of urban settlements. npj Urban Sustainability, 1 (1), doi:10.1038/s42949-020-00013-7.
Norman, J. A. and L. Christidis, 2016: Ecological opportunity and the evolution of habitat preferences in an arid-zone bird: implications for speciation in a climate-modified landscape. Sci. Rep. , 6, doi:10.1038/srep19613.
Nowicki, R. J. et al., 2017: Predicting seagrass recovery times and their implications following an extreme climate event. Mar. Ecol. Prog. Ser. , 567, 79–93, doi:10.3354/meps12029.
Noy, I., 2020: Paying a Price of Climate Change: Who Pays for Managed Retreats?Current Climate Change Reports, 6 (1), 17–23, doi:10.1007/s40641-020-00155-x.
NSW Government, 2016: NSW Climate Change Policy Framework. Office of Environment and Heritage, Sydney, New South Wales, 12 [Available at: https://www.environment.nsw.gov.au/topics/climate-change/policy-framework ].
NSW Government, 2018: State Environmental Planning Policy (Coastal Management). Government of New South Wales, New South Wales, Australia, 22 [Available at: https://www.legislation.nsw.gov.au/EPIs/2018-106.pdf ].
Nunn, P. and N. Reid, 2016: Aboriginal Memories of Inundation of the Australian Coast Dating from More than 7000 Years Ago. Australian Geographer, 47 (1), 11–47, doi:10.1080/00049182.2015.1077539.
Nursey-Bray, M. and R. Palmer, 2018: Country, climate change adaptation and colonisation: insights from an Indigenous adaptation planning process, Australia. Heliyon, 4 (3), doi:10.1016/j.heliyon.2018.e00565.
Nursey-Bray, M., R. Palmer, T. F. Smith and P. Rist, 2019: Old ways for new days: Australian Indigenous peoples and climate change. Local Environment , 24 (5), 473–486, doi:10.1080/13549839.2019.1590325.
Nuttall, J. G. et al., 2018: Acute High Temperature Response in Wheat. Crop Ecology and Physiology, 110 (4), 1296–1308, doi: https://doi.org/10.2134/agronj2017.07.0392.
Nyberg, D. and C. Wright, 2020: Climate-proofing management research. Academy of Management Perspectives, doi:10.5465/amp.2018.0183.
NZ Archaeological Association. 2021: Archaeological site recording scheme. [Available at: https://nzarchaeology.org/archsite ]
NZ Government, 2021: NZ becomes first in world for climate reporting. NZ Government,, New Zealand.
NZ Treasury, 2016: New Zealand Economic and Financial Overview 2016[Treasury, N. Z. (ed.)]. New Zealand Treasury, Wellington.
O’Brien, L. V., H. L. Berry, C. Coleman and I. C. Hanigan, 2014: Drought as a mental health exposure. Environ. Res. , 131, 181–187, doi:10.1016/j.envres.2014.03.014.
O’Donnell, T., 2019: Coastal management and the political-legal geographies of climate change adaptation in Australia. Ocean & Coastal Management , 175, 127–135, doi:10.1016/j.ocecoaman.2019.03.022.
O’Donnell, T., 2020: Don’t get too attached: Property–place relations on contested coastlines. Transactions of the Institute of British Geographers, 45 (3), 559–574, doi:10.1111/tran.12368.
O’Hare, P., I. White and A. Connelly, 2016: Insurance as maladaptation: Resilience and the ‘business as usual’ paradox. Environment and Planning C: Government and Policy, 34 (6), 1175–1193, doi:10.1177/0263774x15602022.
O’Leary, G. J. et al., 2015: Response of wheat growth, grain yield and water use to elevated CO 2 under a free-air CO 2 enrichment (FACE) experiment and modelling in a semi-arid environment. Global Change Biology, 21 (7), 2670–2686.
O’Donnell, T. and L. Gates, 2013: Getting the balance right: a renewed need for the public interest test in addressing coastal climate change and sea level rise. Environ. Plann. Law J. , 30 (3), 220–235.
O’Donnell, T., T. F. Smith and S. Connor, 2019: Property rights and land use planning on the Australian coast. In: Research Handbook on Climate Change Adaptation Policy: Update on Progress [Keskitalo, C. and B. Preston (eds.)]. Edward Elgar, , UK & USA.
Ochoa-Hueso, R. et al., 2017: Rhizosphere-driven increase in nitrogen and phosphorus availability under elevated atmospheric CO2 in a mature Eucalyptus woodland. Plant Soil, 416 (1–2), 283–295, doi:10.1007/s11104-017-3212-2.
Odell, S. D., A. Bebbington and K. E. Frey, 2018: Mining and climate change: A review and framework for analysis. The Extractive Industries and Society, 5, 201–214.
OECD, 2017: OECD Environmental Performance Reviews: New Zealand 2017. OECD Environmental Performance Reviews, OECD Publishing, Paris.
OECD, 2019a: Measuring Distance to the SDG Targets 2019 An Assessment of Where OECD Countries Stand: An Assessment of Where OECD Countries Stand. OECD Publishing,, Google LLC, 144 pp.
OECD, 2019b: Responding to Rising Seas: OECD Country approaches to tackling coastal risks. OECd Publishing, 168 [Available at: https://www.oecd-ilibrary.org/docserver/9789264312487-en.pdf?expires=1600345024&id=id&accname=guest&checksum=6B3F33F96053916FBCE1939FCFC15666 ].
OEH, 2018a: Our future on the coast. NSW Coastal Management Manual Part B: Stage 1 – Identify the scope of a coastal management program. State of NSW and Office of Environment and Heritage, 39 [Available at: https://www.environment.nsw.gov.au/-/media/OEH/Corporate-Site/Documents/Water/Coasts/coastal-management-manual-part-b-stage-1-170672.pdf ].
OEH, 2018b: Our future on the coast: An overview of coastal management in NSW. Office of Environment and Heritage, 16 [Available at: https://www.environment.nsw.gov.au/-/media/OEH/Corporate-Site/Documents/Water/Coasts/coastal-management-overview-170648.pdf ].
OEH, 2018c: Our Future on the Coast: NSW Coastal Management Manual Part A—Introduction and mandatory requirements for a coastal management program. State of NSW and Office of Environment and Heritage, 29 [Available at: https://www.environment.nsw.gov.au/-/media/OEH/Corporate-Site/Documents/Water/Coasts/coastal-management-manual-part-a-170671.pdf ].
Ofori, B. Y., L. J. Beaumont and A. J. Stow, 2017a: Cunningham’s skinks show low genetic connectivity and signatures of divergent selection across its distribution. Ecol. Evol. , 7 (1), 48–57, doi:10.1002/ece3.2627.
Ofori, B. Y., A. J. Stow, J. B. Baumgartner and L. J. Beaumont, 2017b: Combining dispersal, landscape connectivity and habitat suitability to assess climate-induced changes in the distribution of Cunningham’s skink, Egernia cunninghami. PLOS ONE, 12 (9), doi:10.1371/journal.pone.0184193.
Ogier, E. et al., 2020: Responding to Climate Change: Participatory Evaluation of Adaptation Options for Key Marine Fisheries in Australia’s South East. Frontiers in Marine Science, 7, doi:10.3389/fmars.2020.00097.
Oliver, E. C. J. et al., 2021: Marine Heatwaves. Annual Review of Marine Science, 13, 313–42, doi: https://doi.org/10.1146/annurev-marine-032720-095144.
Oppenheimer, M. et al., 2019: Sea level rise and implications for low lying islands, coasts and communities.
Orwin, K. H. et al., 2015: Effects of climate change on the delivery of soil-mediated ecosystem services within the primary sector in temperate ecosystems: a review and New Zealand case study. Glob Chang Biol, 21 (8), 2844–60, doi:10.1111/gcb.12949.
Osbaldison, N., C. McShane, R. Oleszek and Others, 2019: Underinsurance in cyclone and flood environments: A case study in Cairns, Queensland. Australian Journal of Emergency Management, The, 34 (1), 41.
Osborne, K. et al., 2017: Delayed coral recovery in a warming ocean. Glob. Chang. Biol. , 23 (9), 3869–3881, doi: http://dx.doi.org/10.1111/gcb.13707.
Owen, S. et al., 2018: Anticipating staged managed retreat at the coastal margins. New Zealand Planning Institute, 5 [Available at: http://resiliencechallenge.nz/wp-content/uploads/2018/08/Owen-et-al-2018_planning-quarterly.pdf ].
Paddam, S. and S. Wong, 2017: Climate risk disclosure – financial institutions feel the heat . Actuaries Institute, Australia.
Page, D., E. Bekele, J. Vanderzalm and J. Sidhu, 2018: Managed Aquifer Recharge (MAR) in Sustainable Urban Water Management. Water, 10 (3), 239, doi:10.3390/w10030239.
Palutikof, J. P. et al., 2019a: Overcoming knowledge barriers to adaptation using a decision support framework. Climatic Change, 153 (4), 607–624, doi:10.1007/s10584-018-2177-3.
Palutikof, J. P. et al., 2019b: CoastAdapt: an adaptation decision support framework for Australia’s coastal managers. Climatic Change, 153 (4), 491–507, doi:10.1007/s10584-018-2200-8.
Palutikof, J. P., R. B. Street and E. P. Gardiner, 2019c: Decision support platforms for climate change adaptation: an overview and introduction. Climatic Change, 153 (4), 459–476, doi:10.1007/s10584-019-02445-2.
Parida, M., A. A. Hoffmann and M. P. Hill, 2015: Climate change expected to drive habitat loss for two key herbivore species in an alpine environment. J. Biogeogr. , 42 (7), 1210–1221, doi:10.1111/jbi.12490.
Parker, L. M. et al., 2018: Ocean acidification but not warming alters sex determination in the Sydney rock oyster, Saccostrea glomerata. Proc. Biol. Sci. , 285 (1872), doi:10.1098/rspb.2017.2869
10.1098/rspb.2017.2869.
Parkinson, D., 2019: Investigating the Increase in Domestic Violence Post Disaster: An Australian Case Study. J. Interpers. Violence, 34 (11), 2333–2362, doi:10.1177/0886260517696876.
Parliament of Victoria, 2010: 2009 Victorian Bushfires Royal Commission. Victorian Bushfire Royal Commission, 42 [Available at: http://royalcommission.vic.gov.au/Commission-Reports/Final-Report.html ].
Parsons, M., K. Fisher and R. P. Crease, 2021: Rethinking freshwater management in the context of climate change: Planning for different times, climates and generations. In: Decolonising Blue Spaces in the Anthropocene: Freshwater management in Aotearoa New Zealand [Parsons, M., K. Fisher and R. P. Crease (eds.)]. Springer Nature, 419–462.
Parsons, M., J. Nalau, K. Fisher and C. Brown, 2019: Disrupting path dependency: Making room for Indigenous knowledge in river management. Global Environmental Change, 56, 95–113, doi:10.1016/j.gloenvcha.2019.03.008.
Pastor-Paz, J. et al., 2020: Projecting the effect of climate change-induced increases in extreme rainfall on residential property damages: A case study from New Zealand. Motu Economic and Public Policy Research, 32 [Available at: http://motu-www.motu.org.nz/wpapers/20_02.pdf ].
Paulik, R. et al., 2021: Flood Impacts on Dairy Farms in the Bay of Plenty Region, New Zealand. Climate, 9 (2), 30, doi:10.3390/cli9020030.
Paulik, R., C. Heather and D. Collins, 2019a: New Zealand Fluvial and Pluvial Flood Exposure. National Institute of Water and Atmospheric Research,, New Zealand, 58 [Available at: https://www.deepsouthchallenge.co.nz/sites/default/files/2019-08/2019118WN_DEPSI18301_Flood%20Exposure_Final%20%281%29.pdf ].
Paulik, R. et al., 2019b: Coastal Flooding Exposure Under Future Sea-level Rise for New Zealand. NIWA, 76 [Available at: https://www.deepsouthchallenge.co.nz/sites/default/files/2019-08/2019119WN_DEPSI18301_Coast_Flood_Exp_under_Fut_Sealevel_rise_FINAL%20(1)_0.pdf ].
Paulik, R. et al., 2020: National-Scale Built-Environment Exposure to 100-Year Extreme Sea Levels and Sea-Level Rise. Sustainability, 12 (4), 1513, doi:10.3390/su12041513.
PCE, 2015: Preparing New Zealand for rising seas: Certainty and Uncertainty. Parliamentary Commissioner for the Environment, 93 [Available at: https://www.pce.parliament.nz/media/1390/preparing-nz-for-rising-seas-web-small.pdf ].
PCE, 2019: Farms, Forests and Fossil Fuels: The Next Great Landscape Transformation?Office of the Parliamentary Commissioner for the Environment,, Wellington, New Zealand, 184 pp.
Pearce, H. G., 2018: The 2017 Port Hills wildfires – a window into New Zealand’s fire. Australasian Journal of Disaster and Trauma Studies, 22 (Port Hills Wildfire Special Issue), 35–50.
Pearce, H. G. et al., 2011: Improved estimates of the effect of climate change on NZ fire danger. Scion Client Report, Scion, New Zealand [Available at: http://ccrb.agresearch.co.nz/CloudLibrary/2011-13-improved-estimates-of-the-effect-of-climate-change-on-nz-fire-danger[1].pdf ].
Pearce, T., E. H. Rodríguez, D. Fawcett and J. D. Ford, 2018: How is Australia Adapting to Climate Change Based on a Systematic Review?Sustainability, 10 (3280), doi:10.20944/preprints201808.0226.v1.
Pearson, J. et al., 2018: Flood resilience: consolidating knowledge between and within critical infrastructure sectors. Environment Systems and Decisions, 38 (3), 318–329, doi:10.1007/s10669-018-9709-2.
Pecl, G. T. et al., 2019: Autonomous adaptation to climate-driven change in marine biodiversity in a global marine hotspot. Ambio, doi:10.1007/s13280-019-01186-x.
Pecl, G. T. et al., 2014: Rapid assessment of fisheries species sensitivity to climate change. Climatic Change, 127 (3-4), 505–520, doi:10.1007/s10584-014-1284-z.
Pedruco, P. et al., 2018: Assessing climate change impacts on rural flooding in Victoria. In: Hydrology and Water Resources Symposium (HWRS 2018): Water and Communities, 2018, Hydrology and Water Resources Symposium 2018,, Melbourne, 645.
Peel, J. and H. M. Osofsky, 2018: A Rights Turn in Climate Change Litigation?Transnational Environmental Law, 7 (1), 37–67, doi:10.1017/s2047102517000292.
Peel, J., H. M. Osofsky and A. Foerster, 2020: Shaping the Next Generation of Climate Change Litigation in Australia. In: Climate Change Litigation in the Asia Pacific [Jolene, L. and D. A. Kysar (eds.)]. Cambridge University Press,, UK, 175–206.
Peel, M. C., T. A. McMahon and B. L. Finlayson, 2004: Continental differences in the variability of annual runoff-update and reassessment. Journal of Hydrology, 295 (1–4), 185–197, doi:10.1016/j.jhydrol.2004.03.004.
Peirson, W. et al., 2015: Opportunistic management of estuaries under climate change: A new adaptive decision-making framework and its practical application. Journal of Environmental Management , 163, 214–223, doi:10.1016/j.jenvman.2015.08.021.
Pepler, A., L. Ashcroft and B. Trewin, 2018: The relationship between the subtropical ridge and Australian temperatures. Journal of Southern Hemisphere Earth System Science, 68 (1), 201–214, doi:10.22499/3.6801.011.
Pepler, A., B. Trewin and C. Ganter, 2015a: The influence of climate drivers on the Australian snow season. Australian Meteorological and Oceanographic Journal, 65 (2), 195–205, doi:10.22499/2.6502.002.
Pepler, A. S. et al., 2015b: Impact of Identification Method on the Inferred Characteristics and Variability of Australian East Coast Lows. Monthly Weather Review, 143 (3), 864–877, doi:10.1175/mwr-d-14-00188.1.
Perceval, M. et al., 2019: Environmental factors and suicide in Australian farmers: A qualitative study. Arch. Environ. Occup. Health, 74 (5), 279–286, doi:10.1080/19338244.2018.1453774.
Perera, R. S., B. R. Cullen and R. J. Eckard, 2020: Changing patterns of pasture production in south-eastern Australia from 1960 to 2015. Crop and Pasture Science, 71 (1), doi:10.1071/cp19112.
Perkins-Kirkpatrick, S. E. and S. C. Lewis, 2020: Increasing trends in regional heatwaves. Nat. Commun. , 11 (1), 3357, doi:10.1038/s41467-020-16970-7.
Perkins-Kirkpatrick, S. E. et al., 2016: Natural hazards in Australia: heatwaves. Clim. Change, 139 (1), 101–114, doi:10.1007/s10584-016-1650-0.
Perry, B., 2017: Household incomes in New Zealand: Trends in indicators of inequality and hardship 1982 to 2016. Ministry of Social Development: Wellington, New Zealand.
Perry, G. L. W., J. M. Wilmshurst and M. S. McGlone, 2014: Ecology and long-term history of fire in New Zealand. N. Z. J. Ecol. , 38 (2), 1.
Perry, S. J. et al., 2020: Projected late 21st century changes to the regional impacts of the El Niño-Southern Oscillation. Climate Dynamics, 54 (1-2), 395–412, doi:10.1007/s00382-019-05006-6.
Pescaroli, G. and D. Alexander, 2016: Critical infrastructure, panarchies and the vulnerability paths of cascading disasters. Natural Hazards, 82 (1), 175–192, doi:10.1007/s11069-016-2186-3.
Petheram, L., N. Stacey and A. Fleming, 2015: Future sea changes: Indigenous women’s preferences for adaptation to climate change on South Goulburn Island, Northern Territory (Australia). Climate and Development , 7 (4), 339–352.
Pethybridge, H. R. et al., 2020: Contrasting Futures for Australia’s Fisheries Stocks Under IPCC RCP8.5 Emissions – A Multi-Ecosystem Model Approach. Frontiers in Marine Science, 7, doi:10.3389/fmars.2020.577964.
Petrone, K. C., J. D. Hughes, T. G. Van Niel and R. P. Silberstein, 2010: Streamflow decline in southwestern Australia, 1950–2008. Geophysical Research Letters, 37 (11), doi:10.1029/2010gl043102.
Pettit, N. E., P. Bayliss and R. Bartolo, 2016: Dynamics of plant communities and the impact of saltwater intrusion on the floodplains of Kakadu National Park. Mar. Freshwater Res. , 69 (7), 1124–1133, doi:10.1071/MF16148.
Petzold, J. et al., 2020: Indigenous knowledge on climate change adaptation: a global evidence map of academic literature. Environmental Research Letters, 15 (11), 113007, doi:10.1088/1748-9326/abb330.
Phelan, D. C., M. T. Harrison, E. P. Kemmerer and D. Parsons, 2015: Management opportunities for boosting productivity of cool-temperate dairy farms under climate change. Agric. Syst. , 138, 46–54, doi:10.1016/j.agsy.2015.05.005.
Phelan, D. C. et al., 2014: Beneficial impacts of climate change on pastoral and broadacre agriculture in cool-temperate Tasmania. Crop Pasture Sci. , 65 (2), 194–205, doi:10.1071/CP12425.
Phelan, L., 2011: Managing climate risk: extreme weather events and the future of insurance in a climate-changed world. Australasian Journal of Environmental Management , 18 (4), 223–232, doi:10.1080/14486563.2011.611486.
Phelan, L., R. Taplin, A. Henderson-Sellers and G. Albrecht, 2011: Ecological Viability or Liability? Insurance System Responses to Climate Risk. Environmental Policy and Governance, 21 (2), 112–130, doi:10.1002/eet.565.
Phelps, D. and D. Kelly, 2019: Overcoming drought vulnerability in rangeland communities: lessons from central-western Queensland. The Rangeland Journal, 41 (3), 251, doi:10.1071/rj18052.
Phillips, J., 2016: Climate change and surface mining: A review of environment-human interactions & their spatial dynamics. Appl. Geogr. , 74, 95–108, doi:10.1016/j.apgeog.2016.07.001.
Physick, W., M. Cope and S. Lee, 2014: The impact of climate change on ozone-related mortality in Sydney. Int. J. Environ. Res. Public Health, 11 (1), 1034–1048, doi:10.3390/ijerph110101034.
Piggott-McKellar, A. E. and K. E. McNamara, 2016: Last chance tourism and the Great Barrier Reef. J. Sustainable Tour. , 25 (3), 397–415, doi:10.1080/09669582.2016.1213849.
Piggott-McKellar, A. E., K. E. McNamara, P. D. Nunn and J. E. M. Watson, 2019: What are the barriers to successful community-based climate change adaptation? A review of grey literature. Local Environ. , 24 (4), 374–390.
Pingram, M. A. et al., 2021: Surviving invasion: Regaining native fish resilience following fish invasions in a modified floodplain landscape. Water Resources Research, doi:10.1029/2020wr029513.
Pinkard, E., K. Paul, M. Battaglia and J. Bruce, 2014: Vulnerability of Plantation Carbon Stocks to Defoliation under Current and Future Climates. Forests, 5 (6), 1224–1242, doi:10.3390/f5061224.
Pinkerton, M. H., 2017: Impacts of Climate Change on New Zealand Fisheries and Aquaculture. In: Climate Change Impacts on Fisheries and Aquaculture: A Global Analysis [Bruce F. Phillips, M. P.-R. (ed.)]. John Wiley & Sons Ltd,, 91–119.
Pitt, N. R., E. S. Poloczanska and A. J. Hobday, 2010: Climate-driven range changes in Tasmanian intertidal fauna. Mar. Freshwater Res. , 61, 963–970.
Pizarro, J., B. Sainsbury, J. Hodgkinson and B. Loechel, 2017: Australian uranium industry climate change vulnerability assessment. Environmental Development , 24, 109–123, doi:10.1016/j.envdev.2017.06.002.
Plagányi, É. E. et al., 2014: A quantitative metric to identify critical elements within seafood supply networks. PLOS ONE, 9 (3), e91833, doi:10.1371/journal.pone.0091833.
Plummer, R., J. Baird, R. Bullock and others, 2018: Flood Governance: A multiple country comparison of stakeholder perceptions and aspirations. Environmental Policy and Governance, 28 (2), 67–91, doi: https://doi.org/10.1002/eet.1796.
Poloczanska, E. S. et al., 2011: Little change in the distribution of rocky shore faunal communities on the Australian east coast after 50 years of rapid warming. J. Exp. Mar. Bio. Ecol. , 400 (1–2), 145–154, doi:10.1016/j.jembe.2011.02.018.
Pomeroy, A., 2015: Resilience of family farming 1984–2014: Case studies from two sheep/beef hill country districts of New Zealand. New Zealand Geographer, 71 (3), 146–158, doi:10.1111/nzg.12106.
Porfirio, L. L. et al., 2016: Projected direct and indirect effects of climate change on the Swift Parrot, an endangered migratory species. Emu, 116 (3), 273–283, doi:10.1071/MU15094.
Post, D. A. et al., 2014: Decrease in southeastern Australian water availability linked to ongoing Hadley cell expansion. Earth’s Future, 2 (4), 231–238, doi:10.1002/2013ef000194.
Potter, N. J. and F. H. S. Chiew, 2011: An investigation into changes in climate characteristics causing the recent very low runoff in the southern Murray-Darling Basin using rainfall-runoff models. Water Resources Research, 47 (12), doi:10.1029/2010wr010333.
Potter, N. J., F. H. S. Chiew and A. J. Frost, 2010: An assessment of the severity of recent reductions in rainfall and runoff in the Murray–Darling Basin. Journal of Hydrology, 381 (1–2), 52–64, doi:10.1016/j.jhydrol.2009.11.025.
Poyck, S. et al., 2011: Combined snow and streamflow modelling to estimate impacts of climate change on water resources in the Clutha River, New Zealand. J. Hydrol. , 50(2) , 293–312.
Prahalad, V. and J. B. Kirkpatrick, 2019: Saltmarsh conservation through inventory, biogeographic analysis and predictions of change: Case of Tasmania, south-eastern Australia. Aquat. Conserv. , 29 (5), 717–731, doi:10.1002/aqc.3085.
Pratchett, M. S., S. F. Heron, C. Mellin and G. S. Cumming, 2021: Recurrent Mass-Bleaching and the Potential for Ecosystem Collapse on Australia’s Great Barrier Reef. In: Ecosystem Collapse and Climate Change [Canadell, J. G. and R. B. Jackson (eds.)]. Springer International Publishing, Cham, 265–289.
Price, O. F., T. D. Penman, R. A. Bradstock and others, 2015: Biogeographical variation in the potential effectiveness of prescribed fire in south-eastern Australia. Journal of Biogeography, 42 (11), 2234–2245.
Prideaux, B. and A. Pabel, 2018: Australia’s Great Barrier Reef – protection, threats, value and tourism use. In: Coral Reefs: Tourism, Conservation and Management [Bruce Prideaux and A. Pabel (eds.)]. Routledge, London, 44–60.
Prideaux, B., M. Thompson and A. Pabel, 2020: Lessons from COVID-19 can prepare global tourism for the economic transformation needed to combat climate change. Tourism Geographies, 22 (3), 667–678, doi: https://doi.org/10.1080/14616688.2020.1762117.
Priestley, R. K., Z. Heine and T. L. Milfont, 2021: Public understanding of climate change-related sea-level rise. PLOS ONE, 16 (7), e0254348, doi:10.1371/journal.pone.0254348.
Prober, S. M. et al., 2017: Informing climate adaptation pathways in multi-use woodland landscapes using the values-rules-knowledge framework. Agriculture, Ecosystems & Environment , 241, 39–53, doi:10.1016/j.agee.2017.02.021.
Productivity Commission, 2017: Better Urban Planning. Productivity Commission, Auckland, New Zealand [Available at: https://www.productivity.govt.nz/assets/Documents/0a784a22e2/Final-report.pdf ].
Prokopy, L. S. et al., 2015: Farmers and Climate Change: A Cross-National Comparison of Beliefs and Risk Perceptions in High-Income Countries. Environmental Management , 56 (2), 492–504, doi:10.1007/s00267-015-0504-2.
Public Participation, 2014: IAP2 Spectrum of Participation. International Association for Public Participation [Available at: https://www.iap2.org/404.aspx ].
Purdie, H., 2013: Glacier Retreat and Tourism: Insights from New Zealand. Mt. Res. Dev. , 33 (4), 463–472, doi:10.1659/MRD-JOURNAL-D-12-00073.1.
QFCI, 2012: Queensland Floods Commission of Inquiry. Queensland Government, Queensland, 654.
QFES, 2019: State Heatwave Risk Assessment 2019. The State of Queensland (Queensland Fire and Emergency Services),, Queensland,108 pp.
Qin, H. and M. G. Stewart, 2020: Risk-based cost-benefit analysis of climate adaptation measures for Australian contemporary houses under extreme winds. Journal of Infrastructure Preservation and Resilience, 1 (1), 3, doi:10.1186/s43065-020-00002-1.
Queensland Government, 1995: Coastal Protection and Management Act (1995). Queensland Government,, Brisbane, Queensland
Queensland Government, 2011: Understanding Floods: Questions and Answers. Queensland Government,, Brisbane, Queensland,36 pp.
Queensland Government, 2020: Planning Act 2016. Queensland Government, Brisbane, Queensland,366 pp.
Quentin, A., K. Crous, C. Barton and D. Ellsworth, 2015: Photosynthetic enhancement by elevated CO2 depends on seasonal temperatures for warmed and non-warmed Eucalyptus globulus trees. Tree Physiology, 35, 1249–1263.
Qureshi, M. E. et al., 2018: Impact of Climate Variability Including Drought on the Residual Value of Irrigation Water Across the Murray–Darling Basin, Australia. Water Econs. Policy, 04 (01), 1550020, doi:10.1142/S2382624X15500204.
Race, D., S. Mathew, M. Campbell and K. Hampton, 2016: Are Australian Aboriginal Communities Adapting to a Warmer Climate? A Study of Communities Living in Semi-Arid Australia. J. Sustainable Dev. Afr. , 9 (3), 208–223.
Radcliffe, J. C., D. Page, B. Naumann and P. Dillon, 2017: Fifty years of water sensitive urban design, Salisbury, South Australia. Frontiers of Environmental Science & Engineering, 11 (4), doi:10.1007/s11783-017-0937-3.
Radhakrishnan, M., A. Pathirana, R. Ashley and C. Zevenbergen, 2017: Structuring Climate Adaptation through Multiple Perspectives: Framework and Case Study on Flood Risk Management. Water, 9 (2), 129, doi:10.3390/w9020129.
Ramm, T. D., S. Graham, C. J. White and C. S. Watson, 2017: Advancing values-based approaches to climate change adaptation: A case study from Australia. Environmental Science & Policy, 76, 113–123, doi:10.1016/j.envsci.2017.06.014.
Ramm, T. D., C. S. Watson and C. J. White, 2018: Strategic adaptation pathway planning to manage sea-level rise and changing coastal flood risk. Environ. Sci. Policy, 87, 92–101, doi:10.1016/j.envsci.2018.06.001.
Ramos, J. E. et al., 2018: Population genetic signatures of a climate change driven marine range extension. Sci. Rep. , 8 (1), 9558, doi:10.1038/s41598-018-27351-y.
Ramsay, D., B. Gibberd, J. Dahm and R. Bell, 2012: Defining coastal hazard zones for setback lines. A Guide for Good Practice. NIWA report for Envirolink [Available at: https://envirolink.govt.nz/assets/Envirolink/Defining20coastal-hazard20zones20for20setbacks20lines.pdf ].
Ranasinghe, R., 2016: Assessing climate change impacts on open sandy coasts: A review. Earth-Sci. Rev. , 160, 320–332, doi:10.1016/j.earscirev.2016.07.011.
Ranasinghe, R. et al., 2021: Climate Change Information for Regional Impact and for Risk Assessment. In: Climate Change 2021: The Physical Science Basis. Contribution of Working Group I to the Sixth Assessment Report of the Intergovernmental Panel on Climate Change [Masson-Delmotte, V., P. Zhai, A. Pirani, S. L. Connors, C. Péan, S. Berger, N. Caud, Y. Chen, L. Goldfarb, M. I. Gomis, M. Huang, K. Leitzell, E. Lonnoy, J. B. R. Matthews, T. K. Maycock, T. Waterfield, O. Yelekçi, R. Yu and B. Zhou (eds.)]. Cambridge University Press.
Randall, A. et al., 2012: Choosing a decision-making framework to manage uncertainty in climate adaptation decision-making: a practitioner’s handbook. Report for the National Climate Change Adaptation Research Facility (NCCARF), Griffith University. https://www.nccarf.edu.au/publications/Handbook-decision-making-framework-climate-adaptation.
Ratnayake, H. U. et al., 2019: Forecasting wildlife die-offs from extreme heat events. Animal Conservation, 22 (4), 386–395, doi:10.1111/acv.12476.
Raukawa Settlement Trust, 2015: Te Rautaki Taio A Raukawa: Raukawa Environmental Management Plan 2015. Raukawa Settlement Trust, New Zealand, 245.
Rauniyar, S. P. and S. B. Power, 2020: The Impact of Anthropogenic Forcing and Natural Processes on Past, Present, and Future Rainfall over Victoria, Australia. Journal of Climate, 33 (18), 8087–8106, doi:10.1175/jcli-d-19-0759.1.
Raupach, M. R., V. Haverd and P. R. Briggs, 2013: Sensitivities of the Australian terrestrial water and carbon balances to climate change and variability. Agricultural and Forest Meteorology, 182–183, 277–291, doi:10.1016/j.agrformet.2013.06.017.
Raupach, T. H. et al., 2021: The effects of climate change on hailstorms. Nature Reviews Earth & Environment , 2 (3), 213–226, doi:10.1038/s43017-020-00133-9.
Rayner, D. et al., 2021: Intertidal wetland vegetation dynamics under rising sea levels. Sci. Total Environ. , 766, 144237, doi:10.1016/j.scitotenv.2020.144237.
RBA, 2019: Climate Change and the Economy | Speeches. Reserve Bank of Australia,, Sydney
RBNZ, 2018: Financial Stability Report . Reserve Bank of New Zealand, 50 [Available at: https://www.rbnz.govt.nz/-/media/ReserveBank/Files/Publications/Financial%20stability%20reports/2018/fsr-nov-2018.pdf ].
Reisinger, A. et al., 2014: Australasia. In: Climate change 2014: Impacts, adaptation, and vulnerability. Part B: Regional aspects. Contribution of working group II to the fifth assessment report of the intergovernmental panel on climate change. Cambridge University Press, 1371–1438.
Reiter, D. et al., 2018: Increasing the effectiveness of environmental decision support systems: lessons from climate change adaptation projects in Canada and Australia. Regional Environ. Change, 18 (4), 1173–1184, doi:10.1007/s10113-017-1255-9.
Ren, Z., Z. Chen and X. Wang, 2011: Climate change adaptation pathways for Australian residential buildings. Build. Environ. , 46 (11), 2398–2412, doi:10.1016/j.buildenv.2011.05.022.
Reside, A. E. et al., 2014: Characteristics of climate change refugia for A ustralian biodiversity. Austral Ecol. , 39 (8), 887–897.
Rhodes, B. G., J. E. Fagan and K. S. Tan, 2012: Responding to a rapid climate shift—Experiences from Melbourne Australia. In: World Congress on Water, Climate and Energy, 2012, Dublin, Proceedings of the World Congress on Water, Climate and Energy,.
Rich, J. L., S. L. Wright and D. Loxton, 2018: Older rural women living with drought. Local Environment , 23 (12), 1141–1155, doi:10.1080/13549839.2018.1532986.
Richards, R. G. et al., 2015: Effects and mitigations of ocean acidification on wild and aquaculture scallop and prawn fisheries in Queensland, Australia. Fisheries Research, 161, 42–56, doi:10.1016/j.fishres.2014.06.013.
Rickards, L., R. Ison, H. Fünfgeld and J. Wiseman, 2014: Opening and closing the future: climate change, adaptation, and scenario planning. Environ. Plann. C Gov. Policy, 32, 587–602.
Rist, P. et al., 2019: Indigenous protected areas in Sea Country: Indigenous-driven collaborative marine protected areas in Australia. Aquatic Conservation: Marine and Freshwater Ecosystems, 29 (S2), 138–151, doi:10.1002/aqc.3052.
Ritchie, J., 2013: A pedagogy of biocentric relationality. New Zealand Journal of Educational Studies, 48 (1), 34–49.
Rizvanovic, M., J. D. Kennedy, D. Nogues-Bravo and K. A. Marske, 2019: Persistence of genetic diversity and phylogeographic structure of three New Zealand forest beetles under climate change. Diversity and Distributions, 25 (1), 142–153, doi:10.1111/ddi.12834.
Robb, A. et al., 2019: Development Control And Vulnerable Coastal Lands: Examples Of Australian Practice. Urban Policy and Research, 37 (2), 199–214, doi:10.1080/08111146.2018.1489791.
Roberts, S. D. et al., 2019: Marine Heatwave, Harmful Algae Blooms and an Extensive Fish Kill Event During 2013 in South Australia. Frontiers in Marine Science, 6, 610, doi:10.3389/fmars.2019.00610.
Robinson, C., G. James and P. Whitehead, 2016: Negotiating Indigenous benefits from payment for ecosystem service (PES) schemes. Global Environmental Change, 38, 21–29.
Robinson, G. M. et al., 2018: Adapting to Climate Change: Lessons from Farmers and Peri-Urban Fringe Residents in South Australia. Environments, 5 (3), 40, doi:10.3390/environments5030040.
Robinson, L. M. et al., 2015: Rapid assessment of an ocean warming hotspot reveals “high” confidence in potential species’ range extensions. Glob. Environ. Change, 31, 28–37, doi:10.1016/j.gloenvcha.2014.12.003.
Roche, M. and N. Argent, 2015: The fall and rise of agricultural productivism? An Antipodean viewpoint. Progress in Human Geography, 39 (5), 621–635, doi:10.1177/0309132515582058.
Rogelj, J., M. Meinshausen and R. Knutti, 2012: Global warming under old and new scenarios using IPCC climate sensitivity range estimates. Nat. Clim. Chang. , 2 (4), 248–253, doi:10.1038/nclimate1385.
Rogers, B. C. et al., 2020a: An interdisciplinary and catchment approach to enhancing urban flood resilience: a Melbourne case. Philos. Trans. A Math. Phys. Eng. Sci. , 378 (2168), 20190201, doi:10.1098/rsta.2019.0201.
Rogers, B. C. et al., 2020b: Water Sensitive Cities Index: A diagnostic tool to assess water sensitivity and guide management actions. Water Research, 116411, doi:10.1016/j.watres.2020.116411.
Rogers, C., A. Gallant and N. Tapper, 2018: Is the urban heat island exacerbated during heatwaves in southern Australian cities?Theor. Appl. Climatol. , 1–17, doi:10.1007/s00704-018-2599-x.
Rolfe, M. I. et al., 2020: Social vulnerability in a high-risk flood-affected rural region of NSW, Australia. Natural Hazards, 101 (3), 631–650, doi:10.1007/s11069-020-03887-z.
Rosier, S. et al., 2015: Extreme Rainfall in Early July 2014 in Northland, New Zealand—Was There an Anthropogenic Influence?Bulletin of the American Meteorological Society, 96 (12), S136-S140, doi:10.1175/bams-d-15-00105.1.
Roth-Schulze, A. J. et al., 2018: The effects of warming and ocean acidification on growth, photosynthesis, and bacterial communities for the marine invasive macroalga Caulerpa taxifolia. Limnology and Oceanography, 63 (1), 459–471, doi:10.1002/lno.10739.
Rouse, H. et al., 2013: Coastal Adaptation to Climate Change: A New Zealand story. Journal of Coastal Research, 165, 1957–1962, doi:10.2112/si65-331.1.
Rouse, H. L. et al., 2017: Coastal adaptation to climate change in Aotearoa-New Zealand. N. Z. J. Mar. Freshwater Res. , 51 (2), 183–222, doi:10.1080/00288330.2016.1185736.
Royal Society Te Apārangi, 2017: Human Health Impacts of Climate Change for New Zealand—Evidence Summary. Royal Society Te Apārangi, 18 [Available at: https://royalsociety.org.nz/assets/documents/Report-Human-Health-Impacts-of-Climate-Change-for-New-Zealand-Oct-2017.pdf ].
RPS, 2020: IS Rating scheme return on investment . Infrastructure Sustainability Council of Australia, 32 [Available at: https://www.isca.org.au/getmedia/278ee8cb-0ea9-4688-9033-c41b5d43e2a8/19187-IS-Rating-ROI-Final-R2_1.pdf.aspx ].
RSNZ, 2016: Climate change implications for New Zealand. Royal Society of New Zealand, Auckland, New Zealand, 68 [Available at: https://www.royalsociety.org.nz/what-we-do/our-expert-advice/all-expert-advice-papers/climate-change-implications-for-new-zealand/ ].
Ruane, S., 2020: Applying the principles of adaptive governance to bushfire management: a case study from the South West of Australia. Journal of Environmental Planning and Management , 63 (7), 1215–1240, doi:10.1080/09640568.2019.1648243.
Rummukainen, M., 2015: Added value in regional climate modeling. WIREs Climate Change, 7, 145–159.
Ruru, J., 2018: Listening to Papatūānuku: a call to reform water law. J. R. Soc. N. Z. , 48 (2–3), 215–224, doi:10.1080/03036758.2018.1442358.
Ruthrof, K. X. et al., 2016: How drought-induced forest die-off alters microclimate and increases fuel loadings and fire potentials. International Journal of Wildland Fire, 25 (8), 819, doi:10.1071/wf15028.
Ryan, P. A. et al., 2019: Establishment of wMel Wolbachia in Aedes aegypti mosquitoes and reduction of local dengue transmission in Cairns and surrounding locations in northern Queensland, Australia. Gates Open Res, 3, 1547, doi:10.12688/gatesopenres.13061.2.
Rychetnik, L., P. Sainsbury and G. Stewart, 2019: How Local Health Districts can prepare for the effects of climate change: an adaptation model applied to metropolitan Sydney. Aust. Health Rev. , 43 (6), 601–610, doi:10.1071/AH18153.
SA Government, 2019a: Directions for a Climate Smart South Australia. Government of South Australia,, Adelaide, South Asutralia, 12 [Available at: https://www.environment.sa.gov.au/topics/climate-change/climate-smart-sa ].
SA Government, 2019b: Murray-Darling Basin Royal Commission Report . Government of South Australia,, Adelaide, South Australia, 746 [Available at: https://www.mdbrc.sa.gov.au/sites/default/files/murray-darling-basin-royal-commission-report.pdf?v=1548898371 ].
Sadras, V. and M. F. Dreccer, 2015: Adaptation of wheat, barley, canola, field pea and chickpea to the thermal environments of Australia. Crop & Pasture Science, 66 (11), 1137–1150, doi:10.1071/cp15129.
Saft, M., M. C. Peel, A. W. Western and L. Zhang, 2016: Predicting shifts in rainfall-runoff partitioning during multiyear drought: Roles of dry period and catchment characteristics. Water Resources Research, 52 (12), 9290–9305, doi:10.1002/2016wr019525.
Salinger, M. J., B. B. Fitzharris and T. Chinn, 2019a: Atmospheric circulation and ice volume changes for the small and medium glaciers of New Zealand’s Southern Alps mountain range 1977–2018. International Journal of Climatology, 39 (11), 4274–4287, doi:10.1002/joc.6072.
Salinger, M. J., B. B. Fitzharris and T. Chinn, 2021: Extending End-of-Summer-Snowlines for the Southern Alps Glaciers of New Zealand back to 1949. International Journal of Climatology, doi:10.1002/joc.7177.
Salinger, M. J. et al., 2020: Unparalleled coupled ocean-atmosphere summer heatwaves in the New Zealand region: drivers, mechanisms and impacts. Climatic Change, doi:10.1007/s10584-020-02730-5.
Salinger, M. J. et al., 2019b: The unprecedented coupled ocean-atmosphere summer heatwave in the New Zealand region 2017/18: drivers, mechanisms and impacts. Environ. Res. Lett. , 14 (4), 044023.
Salmon, G., 2019: Freshwater Decline. Policy Quarterly, 15 (3), doi:10.26686/pq.v15i3.5682.
Salvador-Carulla, L. et al., 2020: Rapid response to crisis: Health system lessons from the active period of COVID-19. Health Policy Technol, 9 (4), 578–586, doi:10.1016/j.hlpt.2020.08.011.
Sanderson, B. M. and R. A. Fisher, 2020: A fiery wake-up call for climate science. Nat. Clim. Chang. , 10 (3), 175–177, doi:10.1038/s41558-020-0707-2.
Sanderson, T., G. Hertzler, T. Capon and P. Hayman, 2015: A real options analysis of Australian wheat production under climate change. Australian Journal of Agricultural and Resource Economics, n/a-n/a, doi:10.1111/1467-8489.12104.
Sangha, K. K., J. Russell-Smith, J. Evans and A. Edwards, 2020: Methodological approaches and challenges to assess the environmental losses from natural disasters. International Journal of Disaster Risk Reduction, 49, 101619, doi:10.1016/j.ijdrr.2020.101619.
Saunders, C. et al., 2016: The Land and the Brand. AERU Research Report No. 339, , Lincoln University: Agribusiness and Economics Research Unit, Lincoln, New Zealand.
Scanes, E., P. R. Scanes and P. M. Ross, 2020: Climate change rapidly warms and acidifies Australian estuaries. Nat. Commun. , 11 (1), 1803, doi:10.1038/s41467-020-15550-z.
Scarsbrook, M. R. and A. R. Melland, 2015: Dairying and water-quality issues in Australia and New Zealand. Animal Production Science, 55 (7), 856–868, doi:10.1071/an14878.
Schauber, E. M. et al., 2002: Masting by eighteen New Zealand plant apcies: The role of temperature as a synchronizing clue. Ecology, 83 (5), 1214–1225, doi:10.1890/0012-9658(2002)083[1214:mbenzp]2.0.co;2.
Schavemaker, P. and L. van der Sluis, 2017: Electrical power system essentials. John Wiley & Sons, Chichester, West Sussex.
Scheffers, B. R. et al., 2016: The broad footprint of climate change from genes to biomes to people. Science, 354 (6313), aaf7671, doi:10.1126/science.aaf7671.
Scheiter, S., S. I. Higgins, J. Beringer and L. B. Hutley, 2015: Climate change and long-term fire management impacts on Australian savannas. New Phytol. , 205 (3), 1211–1226.
Schenuit, F. et al., 2021: Carbon Dioxide Removal Policy in the Making: Assessing Developments in 9 OECD Cases. Frontiers in Climate, 3, 7, doi:10.3389/fclim.2021.638805.
Schlosberg, D., L. B. Collins and S. Niemeyer, 2017: Adaptation policy and community discourse: risk, vulnerability, and just transformation. Environmental Politics, 26 (3), 413–437, doi:10.1080/09644016.2017.1287628.
Schneider, P., B. Glavovic and T. Farrelly, 2017: So Close Yet So Far Apart: Contrasting Climate Change Perceptions in Two “Neighboring” Coastal Communities on Aotearoa New Zealand’s Coromandel Peninsula. Environments, 4 (3), 65, doi:10.3390/environments4030065.
Schneider, P. et al., 2020: A rising tide of adaptation action: Comparing two coastal regions of Aotearoa-New Zealand. Climate Risk Management , 100244, doi:10.1016/j.crm.2020.100244.
Schumacher, L., 2020: Legal Framework for Coastal Adaptation to Rising Sea Levels in New Zealand. In: The Law of Coastal Adaptation [Schumacher, L. (ed.)]. Springer, 169–278.
Schuster, S., 2013: Natural hazards and insurance. In: Climate Adaptation Futures [Palutikof, J., S. Boulter, A. Ash, M. Stafford Smith, M. Parry, M. Waschka and D. Guitart (eds.)]. John Wiley & Sons, Brisbane, Australia, 133–140.
Schweinsberg, S., S. Darcy and D. Beirman, 2020: ‘Climate crisis’ and ‘bushfire disaster’: Implications for tourism from the involvement of social media in the 2019--2020 Australian bushfires. J. Int. Hosp. Leisure Tour. Manag. , 43, 294–297, doi: https://doi.org/10.1016/j.jhtm.2020.03.006.
Schwerdtle, P., K. Bowen and C. McMichael, 2018: The health impacts of climate-related migration. BMC Med. , 16 (1), doi:10.1186/s12916-017-0981-7.
Scion, 2018: Rural Fire Research. Rural Fire Research, 4 [Available at: https://www.scionresearch.com/__data/assets/pdf_file/0005/64391/Rural_fire_research_infosheet.pdf ].
Scott, D., C. M. Hall and S. Gössling, 2019a: Global tourism vulnerability to climate change. Ann. Touris. Res. , 77, 49–61, doi:10.1016/j.annals.2019.05.007.
Scott, H. and S. Moloney, 2021: Completing the climate change adaptation planning cycle: monitoring and evaluation by local government in Australia. Journal of Environmental Planning and Management , 1–27, doi:10.1080/09640568.2021.1902789.
Scott, J. K., M. H. Friedel, A. C. Grice and B. L. Webber, 2018: Weeds in Australian Arid Regions. In: On the Ecology of Australia’s Arid Zone [Lambers, H. (ed.)]. Springer, 307–330.
Scott, J. K. et al., 2014: AdaptNRM Weeds and Climate Change: Supporting weed management adaptation. Adapt-NRM, 74 [Available at: https://adaptnrm.csiro.au/wp-content/uploads/2014/08/Adapt-NRM_M2_WeedsTechGuide_5.1_LR.pdf ].
Scott, M., H. M. T. Andrew and M. Pratchett, 2017: A large predatory reef fish species moderates feeding and activity patterns in response to seasonal and latitudinal temperature variation. Scientific Reports, 7 (12966), doi: https://doi.org/10.1038/s41598-017-13277-4.
Scott, M. E. et al., 2019b: Latitudinal and seasonal variation in space use by a large, predatory reef fish, Plectropomus leopardus. Funct. Ecol. , 33 (4), 670–680, doi:10.1111/1365-2435.13271.
Sellberg, M. M. et al., 2018: From resilience thinking to Resilience Planning: Lessons from practice. Journal of Environmental Management , 217, 906–918, doi:10.1016/j.jenvman.2018.04.012.
Seneviratne, S. I. et al., 2021: Weather and Climate Extreme Events in a Changing Climate. In: Climate Change 2021: The Physical Science Basis. Contribution of Working Group I to the Sixth Assessment Report of the Intergovernmental Panel on Climate Change [Masson-Delmotte, V., P. Zhai, A. Pirani, S. L. Connors, C. Péan, S. Berger, N. Caud, Y. Chen, L. Goldfarb, M. I. Gomis, M. Huang, K. Leitzell, E. Lonnoy, J. B. R. Matthews, T. K. Maycock, T. Waterfield, O. Yelekçi, R. Yu and B. Zhou (eds.)]. Cambridge University Press.
Serrao-Neumann, S. and D. L. Choy, 2018: Uncertainty and Future Planning: The Use of Scenario Planning for Climate Change Adaptation Planning and Decision. In: Communicating Climate Change Information for Decision-Making [SerraoNeumann, S., A. Coudrain and L. Coulter (eds.)]. Springer International Publishing, Switzerland, 79–90.
Serrao-Neumann, S., M. Cox and D. Low Choy, 2019a: Bridging Adaptive Learning and Desired Natural Resource Management Outcomes: Insights from Australian Planners. null, 34 (2), 149–167, doi:10.1080/02697459.2018.1549188.
Serrao-Neumann, S., G. Di Giulio and D. L. Choy, 2020: When salient science is not enough to advance climate change adaptation: Lessons from Brazil and Australia. Environmental Science & Policy, 109, 73–82, doi:10.1016/j.envsci.2020.04.004.
Serrao-Neumann, S. et al., 2019b: Urban water metabolism information for planning water sensitive city-regions. Land use policy, 88, 104144, doi:10.1016/j.landusepol.2019.104144.
Serrao-Neumann, S., G. Schuch, M. Cox and D. L. Choy, 2019c: Scenario planning for climate change adaptation for natural resource management: Insights from the Australian East Coast Cluster. Ecosystem Services, 38, 100967, doi:10.1016/j.ecoser.2019.100967.
Shalders, T. C. et al., 2018: Potential climate-mediated changes to the distribution and density of pomacentrid reef fishes in south-western Australia. Mar. Ecol. Prog. Ser. , 604, 223–235, doi:10.3354/meps12736.
Sharma-Wallace, L., S. J. Velarde and A. Wreford, 2018: Adaptive governance good practice: Show me the evidence!J. Environ. Manage. , 222, 174–184, doi:10.1016/j.jenvman.2018.05.067.
Sharma, A., C. Wasko and D. P. Lettenmaier, 2018: If Precipitation Extremes Are Increasing, Why Aren’t Floods?Water Resources Research, 54 (11), 8545–8551, doi:10.1029/2018wr023749.
Sharples, C. et al., 2020: Ocean Beach, Tasmania: A swell-dominated shoreline reaches climate-induced recessional tipping point?Marine Geology, 419, 106081, doi:10.1016/j.margeo.2019.106081.
Shaw, J., C. Danese and L. Stocker, 2013: Spanning the boundary between climate science and coastal communities: Opportunities and challenges. Ocean Coast. Manag. , 86, 80–87, doi:10.1016/j.ocecoaman.2012.11.008.
Shearer, H., 2011: Using Geographic Information Systems to explore the determinants of household water consumption and response to the Queensland Government demand-side policy measures imposed during the drought of 2006–2008. In: 5th State of Australian Cities National Conference, 2011 [Whitzman, C. and R. Fincher (eds.)], Melbourne Organizing Committee and State of Australian Cities Conference Research Network (SOACRN).
Sheng, Y. and X. Xu, 2019: The productivity impact of climate change: Evidence from Australia’s Millennium drought. Econ. Model. , 76, 182–191, doi:10.1016/j.econmod.2018.07.031.
Shepherd, J. and K. van Vuuren, 2014: The Brisbane flood: CALD gatekeepers’ risk communication role. Disaster Prevention and Management , 23 (4), 469–483.
Sheppard, C. S. and M. C. Stanley, 2014: Does Elevated Temperature and Doubled CO2 Increase Growth of Three Potentially Invasive Plants?Invasive Plant Sci. Manage. , 7 (2), 237–246, doi:10.1614/ipsm-d-13-00038.1.
Shoo, L. P. et al., 2014: Moving beyond the conceptual: specificity in regional climate change adaptation actions for biodiversity in South East Queensland, Australia. Regional Environ. Change, 14 (2), 435–447, doi:10.1007/s10113-012-0385-3.
Siebentritt, M., N. Halsey and M. Stafford Smith, 2014: Regional Climate Change Adaptation Plan for the Eyre Peninsula. Eyre Peninsula Integrated Climate Change Agreement Committee: South Australia. http://nrmrain.org.au/2015/07/applied-adaptation-pathways-on-the-eyre-peninsula-south-australia%e2%80%a8/.
Silva, D. P. et al., 2018: No deaths in the desert: Predicted responses of an arid-adapted bee and its two nesting trees suggest resilience in the face of warming climates. Insect Conservation and Diversity, 11 (5), 449–463, doi:10.1111/icad.12318.
Silva, L. G. M. et al., 2020: Mortality events resulting from Australia’s catastrophic fires threaten aquatic biota. Global Change Biology, doi:10.1111/gcb.15282.
Simon, K., G. Diprose and A. C. Thomas, 2020: Community-led initiatives for climate adaptation and mitigation. Kōtuitui: New Zealand Journal of Social Sciences Online, 15 (1), 93–105, doi:10.1080/1177083x.2019.1652659.
Simpson, N. P. et al., 2021: A framework for complex climate change risk assessment. One Earth, 4 (4), 489–501, doi:10.1016/j.oneear.2021.03.005.
Sinclair, K., A. Rawluk, S. Kumar and A. Curtis, 2017: Ways forward for resilience thinking: lessons from the field for those exploring social-ecological systems in agriculture and natural resource management. Ecol. Soc. , 22 (4), doi:10.5751/ES-09705-220421.
Singels, A. et al., 2014: Predicting Climate Change Impacts on Sugarcane Production at Sites in Australia, Brazil and South Africa Using the Canegro Model. Sugar Tech, 16 (4), 347–355, doi:10.1007/s12355-013-0274-1.
Singh-Peterson, L., P. Salmon, C. Baldwin and N. Goode, 2015: Deconstructing the concept of shared responsibility for disaster resilience: a Sunshine Coast case study, Australia. Natural Hazards, 79 (2), 755–774, doi:10.1007/s11069-015-1871-y.
Singh, C. et al., 2020: Assessing the feasibility of adaptation options: methodological advancements and directions for climate adaptation research and practice. Climatic Change, 162 (2), 255–277, doi:10.1007/s10584-020-02762-x.
Singh, S., E. G. Hanna and T. Kjellstrom, 2015: Working in Australia’s heat: health promotion concerns for health and productivity. Health Promot. Int. , 30 (2), 239–250, doi:10.1093/heapro/dat027.
Skegg, D. C. and P. C. Hill, 2021: Defining covid-19 elimination. BMJ, 374, n1794, doi:10.1136/bmj.n1794.
Slatyer, R., 2010: Climate change impacts on Australia’s alpine ecosystems. ANU Undergraduate Research Journal, 2, doi:10.22459/aurj.02.2010.05.
Smale, D. A. et al., 2019: Marine heatwaves threaten global biodiversity and the provision of ecosystem services. Nature Climate Change, 9 (4), 306–312, doi:10.1038/s41558-019-0412-1.
Smith, E. F., S. N. Lieske, N. Keys and T. F. Smith, 2018: The socio-economic vulnerability of the Australian east coast grazing sector to the impacts of climate change. Regional Environ. Change, 18 (4), 1185–1199, doi:10.1007/s10113-017-1251-0.
Smith, H. et al., 2017: Adaptation Strategies to Address Climate Change Impacts on Coastal Māori Communities in Aotearoa New Zealand: A Case Study of Dairy Farming in the Horowhenua- Kāpiti Coastal Zone. Massey University, 140 [Available at: https://drive.google.com/file/d/1BLzuGU9-bpz_p05RMTzYXSUWw3GYzrfF/view?usp=drive_open&usp=embed_facebook ].
Smith, K. and G. Lawrence, 2014: Flooding and Security: A Case Study of Community Resilience in Rockhampton. Rural Society, 5230–5249, doi:10.5172/rsj.2014.5230.
Smith, K. and G. Lawrence, 2018: From disaster management to adaptive governance? Governance challenges to achieving resilient food systems in Australia. Journal of Environmental Policy & Planning, 20 (3), 387–401, doi:10.1080/1523908x.2018.1432344.
Smith, K. A., C. E. Dowling and J. Brown, 2019: Simmered Then Boiled: Multi-Decadal Poleward Shift in Distribution by a Temperate Fish Accelerates During Marine Heatwave. Frontiers in Marine Science, 6, 407, doi:10.3389/fmars.2019.00407.
Smith, M. H., 2013: Assessing Climate Change Risks and Opportunities for Investors: Oil and Gas Sector. ANU and Investor Group on Climate Change, Canberra, Australia, 21 [Available at: http://dx.doi.org/10.13140/RG.2.1.3589.2721 ].
Smith, T., A. Leitch and D. Thomsen, 2016: Community Engagement. CoastAdapt Information Manual 9. National Climate Change Adaptation Research Facility, Gold Coast, Australia.
Smith, T. et al., 2015: Adapting Australian coastal regions to climate change: A case study of South-east Coast Queensland. In: Climate Change and the Coast. CRC Press,, 269–284.
Sorensen, J. G., T. N. Kristensen and J. Overgaard, 2016: Evolutionary and ecological patterns of thermal acclimation capacity in Drosophila: is it important for keeping up with climate change?Current Opinion in Insect Science, 17, 98–104, doi:10.1016/j.cois.2016.08.003.
Spector, S., N. A. Cradock-Henry, S. Beaven and C. Orchiston, 2019: Characterising rural resilience in Aotearoa-New Zealand: a systematic review. Regional Environmental Change, 19 (2), 543–557, doi:10.1007/s10113-018-1418-3.
Spinoni, J. et al., 2019: A new global database of meteorological drought events from 1951 to 2016. J Hydrol Reg Stud, 22, 100593, doi:10.1016/j.ejrh.2019.100593.
Spurway, K. and K. Soldatic, 2016: Life just keeps throwing lemons”Anführungszeichen nicht ausgeglichen. Bitte prüfen Sie den Absatz. : the lived experience of food insecurity among Aboriginal people with disabilities in the West Kimberley. Local Environ. , 21 (9), 1118–1131, doi:10.1080/13549839.2015.1073235.
Srinivasan, M. S., D. Bewsell, C. Jongmans and G. Elley, 2017: Just-in-case to justified irrigation: Applying co-innovation principles to irrigation water management. Outlook Agric. , 46 (2), 138–145, doi:10.1177/0030727017708491.
State of Tasmania, 2017a: Climate Action 21: Tasmania’s Climate Change Action Plan 2017–2021. Tasmanian Climate Change Office Department of Premier and Cabinet,, Hobart, Tasmania,36 pp.
State of Tasmania, 2017b: Tasmanian Planning Scheme—State planning provisions. Government of Tasmania,, Hobart, Tasmania
Stats NZ, 2016: National Population Projections: 2016(base)–2068. Statistics New Zealand, New Zealand, 23.
Stats NZ, 2021: Estimated population of NZ. Statistics New Zealand, New Zealand [Available at: https://www.stats.govt.nz/indicators/population-of-nz ].
Steane, D. A. et al., 2017: Evidence for adaptation and acclimation in a widespread eucalypt of semi-arid Australia. Biol. J. Linn. Soc. Lond. , 121 (3), 484–500, doi:10.1093/biolinnean/blw051.
Steffen, W., J. Hunter and L. Hughes, 2014: Counting the costs: Climate change and coastal flooding. Climate Council of Australia, 82 [Available at: https://www.climatecouncil.org.au/resources/coastalflooding/ ].
Steffen, W. et al., 2019: Compound costs: How climate change is damaging Australia’s economy. Climate Council of Australia, 32 [Available at: https://www.climatecouncil.org.au/wp-content/uploads/2019/05/Costs-of-climate-change-report.pdf ].
Steffen, W., A. Stock, D. Alexander and M. Rice, 2017: Angry summer 2016/17. Climate Council of Australia L [Available at: https://www.climatecouncil.org.au/resources/angry-summer-report/ ].
Steiger, R. et al., 2019: A critical review of climate change risk for ski tourism. null, 22 (11), 1343–1379, doi:10.1080/13683500.2017.1410110.
Stenhouse, V. et al., 2018: Modelled incubation conditions indicate wider potential distributions based on thermal requirements for an oviparous lizard. J. Biogeogr. , 45 (8), 1872–1883, doi:10.1111/jbi.13363.
Stephens, S. A., R. G. Bell and I. D. Haigh, 2020: Spatial and temporal analysis of extreme storm-tide and skew-surge events around the coastline of New Zealand. Natural Hazards and Earth System Sciences, 20 (3), 783–796, doi:10.5194/nhess-20-783-2020.
Stephens, S. A., R. G. Bell and J. Lawrence, 2017: Applying Principles of Uncertainty within Coastal Hazard Assessments to Better Support Coastal Adaptation. J. Mar. Sci. Eng. , 5 (3), 40, doi:10.3390/jmse5030040.
Stephens, S. A., R. G. Bell and J. Lawrence, 2018: Developing signals to trigger adaptation to sea-level rise. Environmental Research Letters, 13 (10), 104004, doi:10.1088/1748-9326/aadf96.
Stephenson, J. et al., 2018: Communities and climate change: Vulnerability to rising seas and more frequent flooding. Motu, 21 [Available at: https://www.deepsouthchallenge.co.nz/news-updates/coping-face-climate-change-research-announced-better-support-our-communities ].
Stevens, C. and G. O’Connor, 2015: Combined art and science as a communication pathway in a primary school setting: paper and ice. Journal of Science Communication, 14 (04), A04, doi:10.22323/2.14040204.
Stevenson, T. et al., 2018: Transitioning to zero net emissions by 2050: moving to a very low-emissions electricity system in New Zealand. New Zealand Productivity Commission SAPERE Research Group, New Zealand.
Stewart, E. J. et al., 2016: Implications of climate change for glacier tourism. Tourism Geographies, 18 (4), 377–398, doi:10.1080/14616688.2016.1198416.
Stewart, J., M. Anda and R. Harper, 2019: Low-carbon development in remote Indigenous communities: Applying a community-directed model to support endogenous assets and aspirations. Environ. Sci. Policy, 95 (95), 11–19.
Stewart, M. and X. Wang, 2011: Risk Assessment of Climate Adaptation Strategies for Extreme Wind Events in Queensland. Commonwealth Scientific and Industrial Research Organisation, Csiro [Available at: http://dx.doi.org/10.4225/08/584EE81C22E7B
Stewart, M. G., 2015: Risk and economic viability of housing climate adaptation strategies for wind hazards in southeast Australia. Mitigation and Adaptation Strategies for Global Change, 20 (4), 601–622, doi:10.1007/s11027-013-9510-y.
Stoerk, T., G. Wagner and R. E. T. Ward, 2018: Recommendations for Improving the Treatment of Risk and Uncertainty in Economic Estimates of Climate Impacts in the Sixth Intergovernmental Panel on Climate Change Assessment Report. Review of Environmental Economics and Policy, 12 (2), 371–376, doi: https://doi.org/10.1093/reep/rey005.
Stone, G., R. Dalla Pozza, J. Carter and G. McKeon, 2019: Long Paddock: climate risk and grazing information for Australian rangelands and grazing communities. The Rangeland Journal, 41 (3), 225, doi:10.1071/rj18036.
Storey, B. and I. Noy, 2017: Insuring property under climate change. Policy Quarterly, 13 (4), doi:10.26686/pq.v13i4.4603.
Stroombergen, A., A. Tait, J. Renwick and K. Patterson, 2006: The relationship between New Zealand’s climate, energy, and the economy in 2025. New Zealand Journal of Social Sciences Online, 1, 139–160.
Strydom, S. et al., 2020: Too hot to handle: Unprecedented seagrass death driven by marine heatwave in a World Heritage Area. Glob. Chang. Biol. , 26 (6), 3525–3538, doi:10.1111/gcb.15065.
Stuart-Smith, R. D., C. J. Brown, D. M. Ceccarelli and G. J. Edgar, 2018: Ecosystem restructuring along the Great Barrier Reef following mass coral bleaching. Nature, 560 (7716), 92–96, doi:10.1038/s41586-018-0359-9.
Sultana, S. et al., 2017: Potential impacts of climate change on habitat suitability for the Queensland fruit fly. Sci. Rep. , 7 (1), doi:10.1038/s41598-017-13307-1.
Sultana, S. et al., 2020: Impacts of climate change on high priority fruit fly species in Australia. PLOS ONE, 15 (2), e0213820, doi:10.1371/journal.pone.0213820.
Sunday, J. M. et al., 2015: Species traits and climate velocity explain geographic range shifts in an ocean-warming hotspot. Ecol. Lett. , 18 (9), 944–953, doi:10.1111/ele.12474
Sutton, P. J. H. and M. Bowen, 2019: Ocean temperature change around New Zealand over the last 36 years. N. Z. J. Mar. Freshwater Res. , 1–22, doi:10.1080/00288330.2018.1562945.
Swales, E. A., R. G. Bell and A. Lohrer, 2020: Estuaries and Lowland Brackish Habitats. In: Coastal Systems and Sea Level Rise: What to Look for in Future [C. Hendtlass, S. Morgan and D. Neale (eds.)]. NZ Coastal Society,, Wellington, New Zealand, 55–64.
Swann, T. and R. Campbell, 2016: Great Barrier Bleached: Coral bleaching, the Great Barrier Reef and potential impacts on tourism. Australia Institute,, Canberra [Available at: https://australiainstitute.org.au/wp-content/uploads/2020/12/Swann-Campbell-2016-Great-Barrier-Bleached-FINAL-w-cover.pdf ].
Swiss Re, 2021: The economics of climate change: no action not an option. Swiss Re Management Institute, 30 [Available at: https://www.swissre.com/dam/jcr:e73ee7c3-7f83-4c17-a2b8-8ef23a8d3312/swiss-re-institute-expertise-publication-economics-of-climate-change.pdf ].
Tait, A. and P. Pearce, 2019: Impacts and implications of climate change on Waituna Lagoon, Southland. Science for Conservation, 335, cabdirect.org, New Zealand Department of Conservation [Available at: https://www.cabdirect.org/cabdirect/abstract/20203217703 ].
Tait, A. et al., 2016: Overall CCII Project. Synthesis Report. Climate Changes, Impacts and Implications (CCII) for New Zealand to 2100. 24 [Available at: https://ccii.org.nz/app/uploads/2017/07/Overall-CCII-Project-synthesis-report1.pdf ].
Tan, P.-L., D. George and M. Comino, 2015: Cumulative risk management, coal seam gas, sustainable water, and agriculture in Australia. International Journal of Water Resources Development , 31 (4), 682–700, doi:10.1080/07900627.2014.994593.
Tangney, P., 2019: Between conflation and denial – the politics of climate expertise in Australia. Australian Journal of Political Science, 54 (1), 131–149, doi:10.1080/10361146.2018.1551482.
Tangney, P. and M. Howes, 2016: The politics of evidence-based policy: A comparative analysis of climate adaptation in Australia and the UK. Environment and Planning C: Government and Policy, 34 (6), 1115–1134, doi:10.1177/0263774x15602023.
Tanner-McAllister, S. L., J. Rhodes and M. Hockings, 2017: Managing for climate change on protected areas: An adaptive management decision making framework. J. Environ. Manage. , 204 (Pt 1), 510–518, doi:10.1016/j.jenvman.2017.09.038.
TAO, 2020: Sustainable Finance Forum: Roadmap for Action. The Aotearoa Circle [Available at: https://static1.squarespace.com/static/5bb6cb19c2ff61422a0d7b17/t/5f9f7a83aa6e763a1b0f6759/1604287127400/20207-000234_Sustainable+Finance+Forum+Final.pdf ].
Tapper, N., A. Coutts, M. Loughnan and D. Pankhania, 2014: Urban populations’ vulnerability to climate extremes: mitigating urban heat through technology and water-sensitive urban design. In: Low carbon cities: Transforming urban systems [Lehmann, S. (ed.)]. Routledge, UK, 361–374.
Tapper, N. J., 2021: Creating Cooler, Healthier and More Liveable Australian Cities Using Irrigated Green Infrastructure. In: Urban Climate Science for Planning Healthy Cities [Ren, C. and G. McGregor (eds.)]. Springer, Cham, Geneva, Switzerland, 219–237.
Tasmanian Climate Change Office, 2012: Coastal Adaptation Pathways. Developing Coastal Adaptation Pathways with Local Communities. . [Available at: http://www.dpac.tas.gov.au/__data/assets/pdf_file/0017/229130/Example_Interim_Local_Area_Report_Coastal_module_3.PDF ].
Tausz, M. et al., 2017: Can additional N fertiliser ameliorate the elevated CO2 -induced depression in grain and tissue N concentrations of wheat on a high soil N background?Journal of Agronomy and Crop Science, 203 (6), 574–583, doi:10.1111/jac.12209.
Taylor, C. et al., 2018: Trends in wheat yields under representative climate futures: Implications for climate adaptation. Agric. Syst. , 164, 1–10.
Taylor, K. S., B. J. Moggridge and A. Poelina, 2017: Australian Indigenous Water Policy and the impacts of the ever-changing political cycle. Australasian Journal of Water Resources, 20 (2), 132–147, doi:10.1080/13241583.2017.1348887.
Taylor, M. A. P. and M. L. Philp, 2015: Investigating the impact of maintenance regimes on the design life of road pavements in a changing climate and the implications for transport policy. Transp. Policy, 41, 117–135, doi:10.1016/j.tranpol.2015.01.005.
TCFD, 2017: Recommendations of the Task Force on Climate-related Financial Disclosures. Task Force on Climate-related Financial Disclosures, 74 [Available at: https://www.fsb-tcfd.org/wp-content/uploads/2017/06/FINAL-2017-TCFD-Report-11052018.pdf ].
Te Urunga Kea - Te Arawa Climate Change Working Group, 2021: Te Ara ki Kōpū: Te Arawa Climate Change Strategy. Te Arawa Lakes Trust, Rotorua, Aotearoa-New Zealand, 8 [Available at: https://tearawa.iwi.nz/seeking-feedback-on-our-draft-te-arawa-climate-change-strategy/ ].
Teagle, H., D. A. Smale and D. Schoeman, 2018: Climate-driven substitution of habitat-forming species leads to reduced biodiversity within a temperate marine community. Diversity and Distributions, 24 (10), 1367–1380, doi:10.1111/ddi.12775.
Temby, O., J. Sandall, R. Cooksey and G. M. Hickey, 2016: How do civil servants view the importance of collaboration and scientific knowledge for climate change adaptation?Australasian Journal of Environmental Management , 23 (1), 5–20, doi:10.1080/14486563.2015.1028111.
Teng, J. et al., 2012: Estimation of Climate Change Impact on Mean Annual Runoff across Continental Australia Using Budyko and Fu Equations and Hydrological Models. Journal of Hydrometeorology, 13 (3), 1094–1106, doi:10.1175/jhm-d-11-097.1.
Thamo, T. et al., 2017: Dynamics and the economics of carbon sequestration: common oversights and their implications. Mitig Adapt Strateg Glob Change, 22 (7), 1095–1111, doi:10.1007/s11027-016-9716-x.
Thi Tran, L., N. Stoeckl, M. Esparon and D. Jarvis, 2016: If climate change means more intense and more frequent drought, what will that mean for agricultural production? A case study in Northern Australia. Australasian Journal of Environmental Management , 23 (3), 281–297, doi:10.1080/14486563.2016.1152202.
Thompson, J. A., 2016: A MODIS-derived snow climatology (2000–2014) for the Australian Alps. Climate Research, 68 (1), 25–38, doi:10.3354/cr01379.
Thomsen, M. S. et al., 2019: Local Extinction of Bull Kelp (Durvillaea spp.) Due to a Marine Heatwave. Frontiers in Marine Science, 6, 84, doi:10.3389/fmars.2019.00084.
Thomson, J. A. et al., 2015: Extreme temperatures, foundation species, and abrupt ecosystem change: an example from an iconic seagrass ecosystem. Glob. Chang. Biol. , 21 (4), 1463–1474, doi: http://dx.doi.org/10.1111/gcb.12694.
TIA, 2019: Tourism 2025 and Beyond: A Sustainable growth framework. Kaupapa Whakapakari Ta-Poi. Tourism Industry Aotearoa, 24 [Available at: https://tia.org.nz/assets/Uploads/d5156c4126/Tourism2025-and-Beyond.pdf ].
Timbal, B. and H. Hendon, 2011: The role of tropical modes of variability in recent rainfall deficits across the Murray-Darling Basin. Water Resources Research, 47 (12), doi:10.1029/2010wr009834.
Tobler, R. et al., 2017: Aboriginal mitogenomes reveal 50,000 years of regionalism in Australia. Nature, 544 (7649), 180–184, doi:10.1038/nature21416.
Tolhurst, K. G. and G. McCarthy, 2016: Effect of prescribed burning on wildfire severity: a landscape-scale case study from the 2003 fires in Victoria. Australian Forestry, 79 (1), 1–14, doi:10.1080/00049158.2015.1127197.
Tombs, D and B. France-Hudson, 2018: Climate change compensation. Policy Quarterly, 14 (4), 50–56.
Tompkins, D. M., A. E. Byrom and R. P. Pech, 2013: Predicted responses of invasive mammal communities to climate-related changes in mast frequency in forest ecosystems. Ecol. Appl. , 23 (5), 1075–1085.
Tonmoy, F. N., S. M. Cooke, F. Armstrong and D. Rissik, 2020: From science to policy: Development of a climate change adaptation plan for the health and wellbeing sector in Queensland, Australia. Environmental Science & Policy, 108, 1–13, doi:10.1016/j.envsci.2020.03.005.
Tonmoy, F. N. and A. El-Zein, 2018: Vulnerability to sea level rise: A novel local-scale indicator-based assessment methodology and application to eight beaches in Shoalhaven, Australia. Ecological Indicators, 85, 295–307, doi:10.1016/j.ecolind.2017.10.010.
Tonmoy, F. N., D. Rissik and J. P. Palutikof, 2019: A three-tier risk assessment process for climate change adaptation at a local scale. Clim. Change, doi:10.1007/s10584-019-02367-z.
Tonmoy, F. N., D. Wainwright, D. C. Verdon-Kidd and D. Rissik, 2018: An investigation of coastal climate change risk assessment practice in Australia. Environmental Science & Policy, 80, 9–20, doi:10.1016/j.envsci.2017.11.003.
Torabi, E., A. Dedekorkut-Howes and M. Howes, 2018: Adapting or maladapting: Building resilience to climate-related disasters in coastal cities. Cities, 72, 295–309, doi:10.1016/j.cities.2017.09.008.
Torabi, E., A. Dedekorkut-Howes and M. Howes, 2021: A framework for using the concept of urban resilience in responding to climate-related disasters. Urban Research & Practice, 1–23, doi:10.1080/17535069.2020.1846771.
Tozer, C. R., D. C. Verdon-Kidd and A. S. Kiem, 2014: Temporal and spatial variability of the cropping limit in South Australia. Climate Research, 60 (1), 25–34, doi:10.3354/cr01218.
Tracey, D. and F. Hjorvarsdottir, 2019: The state of knowledge of deep-sea corals in the New Zealand region. NIWA Science and Technology Series, 140 [Available at: https://niwa.co.nz/sites/niwa.co.nz/files/Deepsea-corals-NZ-2019-NIWA-SciTechSeries-84.pdf ].
Trancoso, R. et al., 2020: Heatwaves intensification in Australia: A consistent trajectory across past, present and future. Sci. Total Environ. , 742, 140521, doi:10.1016/j.scitotenv.2020.140521.
Transpower, 2020: Whakamana i Te Mauri Hiko – empowering our energy future. Transpower, 89 [Available at: https://www.transpower.co.nz/sites/default/files/publications/resources/TP%20Whakamana%20i%20Te%20Mauri%20Hiko.pdf ].
Trębicki, P. et al., 2015: Virus disease in wheat predicted to increase with a changing climate. Glob Chang Biol. , 21 (9), 3511–3519, doi:10.1111/gcb.12941.
Trewin, B. et al., 2020: An updated long-term homogenized daily temperature data set for Australia. Geoscience Data Journal, 7 (2), 149–169, doi:10.1002/gdj3.95.
Trivedi, N. S., M. S. Venkatraman, C. Chu and I. S. Cole, 2014: Effect of climate change on corrosion rates of structures in Australia. Clim. Change, 124 (1), 133–146, doi:10.1007/s10584-014-1099-y.
Troccoli, A. et al., 2012: Long-Term Wind Speed Trends over Australia. Journal of Climate, 25 (1), 170–183, doi:10.1175/2011jcli4198.1.
Tschakert, P. et al., 2017: Climate change and loss, as if people mattered: values, places, and experiences. Wiley Interdisciplinary Reviews: Climate Change, 8 (5), e476, doi:10.1002/wcc.476.
Tschakert, P. et al., 2016: Micropolitics in collective learning spaces for adaptive decision making. Glob. Environ. Change, 40, 182–194, doi: https://doi.org/10.1016/j.gloenvcha.2016.07.004.
TSRA, 2014: Torres Strait Climate Change Strategy 2014–2018. Land and Sea Management Unit, Torres Strait Regional Authority,, Torres Strait,36 pp.
TSRA, 2016: Torres Strait Regional Adaptation and Resilience Plan 2016–2021. Environmental Management Program, Torres Strait Regional Authority,, Torres Strait,108 pp.
TSRA, 2018: Torres Strait Climate Change and Health – First Pass Risk Assessment . Prepared by BMT Global for the Environmental Management Program, Torres Strait Regional Authority, Thursday Island, Queensland.
Tuckett, C. A., T. de Bettignies, J. Fromont and T. Wernberg, 2017: Expansion of corals on temperate reefs: direct and indirect effects of marine heatwaves. Coral Reefs, 36 (3), 947–956, doi:10.1007/s00338-017-1586-5.
Turton, S. M., 2014: Climate change and rainforest tourism in Australia. In: Rainforest Tourism, Conservation and Management: challenges for sustainable development [Prideaux, B. (ed.)]. Routledge, New York, NY USA, 70–86.
Turton, S. M., 2017: Expansion of the tropics: revisiting frontiers of geographical knowledge. Geographical Research, 55 (1), 3–12, doi:10.1111/1745-5871.12230.
Ukkola, A. M. et al., 2016: Reduced streamflow in water-stressed climates consistent with CO2 effects on vegetation. Nature Climate Change, 6 (1), 75–78, doi:10.1038/nclimate2831.
UN, 2018 : Indigenous Peoples Disproportionately Impacted by Climate Change, Systematically Targeted for Defending Freedoms, Speakers Tell Permanent Forum. UN Economic and Social Council,, Permanent Forum on Indigenous Issues Seventeenth Session, 5th and 6th Meetings
UN, ADB and UNDP, 2018: Transformation Towards Sustainable and Resilient Societies in Asia and the Pacific. United Nations, Asian Development Bank, United Nations Development Programme, Escap, U. N., 65 [Available at: https://play.google.com/store/books/details?id=ZeIBugEACAAJ
UN DESA, 2019: World Urbanization Prospects. United Nations Department of Economic & Social Affairs.
UNEP, 2020: Emissions Gap Report 2020. United Nations Environment Programme (UNEP), United Nations Environment, P. and U. D. Partnership, 101 [Available at: https://www.unep.org/emissions-gap-report-2020 ].
Uthicke, S. et al., 2015: Outbreak of coral-eating Crown-of-Thorns creates continuous cloud of larvae over 320 km of the Great Barrier Reef. Sci Rep, 5, 16885, doi:10.1038/srep16885.
van Dijk, A. I. J. M. et al., 2013: The Millennium Drought in southeast Australia (2001–2009): Natural and human causes and implications for water resources, ecosystems, economy, and society. Water Resources Research, 49 (2), 1040–1057, doi:10.1002/wrcr.20123.
van Leeuwen, C. and P. Darriet, 2016: The Impact of Climate Change on Viticulture and Wine Quality. Journal of Wine Economics, 11 (1), 150–167, doi:10.1017/jwe.2015.21.
van Oldenborgh, G. J. et al., 2021: Attribution of the Australian bushfire risk to anthropogenic climate change. Natural Hazards and Earth System Sciences, 21 (3), 941–960, doi:10.5194/nhess-21-941-2021.
van Wettere, W. H. E. J. et al., 2021: Review of the impact of heat stress on reproductive performance of sheep. J. Anim. Sci. Biotechnol. , 12 (1), 26, doi:10.1186/s40104-020-00537-z.
Vardoulakis, S. et al., 2020: Bushfire smoke: urgent need for a national health protection strategy. Med. J. Aust. , doi:10.5694/mja2.50511.
Vargo, L. J. et al., 2020: Anthropogenic warming forces extreme annual glacier mass loss. Nat. Clim. Chang. , 10 (9), 856–861, doi:10.1038/s41558-020-0849-2.
Vaze, J. et al., 2010: Climate non-stationarity – Validity of calibrated rainfall–runoff models for use in climate change studies. Journal of Hydrology, 394 (3–4), 447–457, doi:10.1016/j.jhydrol.2010.09.018.
Vergés, A. et al., 2016: Long-term empirical evidence of ocean warming leading to tropicalization of fish communities, increased herbivory, and loss of kelp. Proc. Natl. Acad. Sci. U. S. A. , 113 (48), 13791–13796, doi:10.1073/pnas.1610725113.
Vermeulen, S. J. et al., 2018: Transformation in Practice: A Review of Empirical Cases of Transformational Adaptation in Agriculture Under Climate Change. Frontiers in Sustainable Food Systems, 2, 65, doi:10.3389/fsufs.2018.00065.
Vertessy, R. A., 2013: Water information services for Australians. Australian Journal of Water Resources, 16, 15.
Vertessy, R. V. et al., 2019: Final Report of the Independent Assessment of the 2018–19 Fish Deaths in the Lower Darling. Independent panel for the Australian Government, 99 [Available at: https://www.mdba.gov.au/sites/default/files/pubs/Final-Report-Independent-Panel-fish-deaths-lower%20Darling_4.pdf ].
Vicedo-Cabrera, A. M. et al., 2021: The burden of heat-related mortality attributable to recent human-induced climate change. Nat. Clim. Chang. , 11 (6), 492–500, doi:10.1038/s41558-021-01058-x.
Victoria State Government DELWP, 2016: Victoria’s Climate Change Adaptation Plan 2017–2020. Victoria State Government DELWP, Melbourne.
Victorian Council of Social Service, 2016: Easing the crisis: Reducing risks for people experiencing homelessness in disasters and emergency events. VCOSS, 20 [Available at: https://drive.google.com/file/d/1zQoTd6OhTg6Em5ti2RuL7eYQqRNGxUDl/view?usp=drive_open&usp=embed_facebook ].
Virgilio, G. D. et al., 2019: Climate Change Increases the Potential for Extreme Wildfires. Geophysical Research Letters, 46 (14), 8517–8526, doi:10.1029/2019gl083699.
Virgilio, G. D. et al., 2021: Realised added value in dynamical downscaling of Australian climate change. In: EGU General Assembly 2021, Gather Online, European Geosciences Union,, doi:10.5194/egusphere-egu21-3855.
Vose, R. S. and S. Applequist, 2014: Monitoring and Understanding Changes in Extremes: Extratropical Storms, Winds, and Waves. Bull. Am. Meteorol. Soc. , 95, 377–386.
WA Government, 2012: Adapting to our changing climate. Government of Western Australia, Department of Environment and Conservation, 12 [Available at: https://www.der.wa.gov.au/images/documents/your-environment/climate-change/adapting-to-our-changing-climate-october-2012.pdf ].
WA Government, 2016: Water for Growth: Urban—Western Australia’s water supply and demand outlook to 2050. Government of Western Australia, Department of Water, 25 [Available at: https://www.water.wa.gov.au/__data/assets/pdf_file/0016/8521/110200.pdf ].
Wahl, M. et al., 2015: The responses of brown macroalgae to environmental change from local to global scales: direct versus ecologically mediated effects. Perspectives in Phycology, 2 (1), 11–29, doi:10.1127/pip/2015/0019.
Walker, S., A. Monks and J. Innes, 2019: Thermal squeeze will exacerbate declines in New Zealand’s endemic forest birds. Biol. Conserv. , 237, 166–174, doi:10.1016/j.biocon.2019.07.004.
Walker, S., D. Stuart-Fox and M. R. Kearney, 2015: Has contemporary climate change played a role in population declines of the lizard Ctenophorus decresii from semi-arid Australia?J. Therm. Biol. , 54, 66–77.
Wallace, J., N. Waltham, D. Burrows and D. McJannet, 2015: The temperature regimes of dry-season waterholes in tropical northern Australia: potential effects on fish refugia. Freshw. Sci. , 34 (2), 663–678.
Wallace, K. J. and B. D. Clarkson, 2019: Urban forest restoration ecology: a review from Hamilton, New Zealand. null, 49 (3), 347–369, doi:10.1080/03036758.2019.1637352.
Waller, N. L. et al., 2017: The Bramble Cay melomys Melomys rubicola (Rodentia: Muridae): a first mammalian extinction caused by human-induced climate change?Wildl. Res. , 44, 9–21, doi:10.1071/WR16157.
Walsh, K. et al., 2016: Natural hazards in Australia: storms, wind and hail. Clim. Change, 139, doi:DOI 10.1007/s10584-016-1737-7.
Walters, G. and L. Ruhanen, 2015: From White to Green. Journal of Hospitality & Tourism Research, 39 (4), 517–539, doi:10.1177/1096348013491603.
Wang, B. et al., 2018a: Australian wheat production expected to decrease by the late 21st century. Global Change Biology, 24 (6), 2403–2415, doi:10.1111/gcb.14034.
Wang, C.-H. et al., 2016: Rising tides: adaptation policy alternatives for coastal residential buildings in Australia. Struct. Infrastruct. Eng.: Maint. Manage. Life-Cycle Des. Perform. , 12 (4), 463–476, doi:10.1080/15732479.2015.1020500.
Wang, C.-H., Y. B. Khoo and X. Wang, 2015: Adaptation benefits and costs of raising coastal buildings under storm-tide inundation in South East Queensland, Australia. Climatic Change, 132 (4), 545–558, doi:10.1007/s10584-015-1454-7.
Wang, J. et al., 2018b: Vulnerability of Ecological Condition to the Sequencing of Wet and Dry Spells Prior to and during the Murray-Darling Basin Millennium Drought. Journal of Water Resources Planning and Management , 144 (8), doi:10.1061/(asce)wr.1943-5452.0000963.
Wang, S.-J. and L.-Y. Zhou, 2019: Integrated impacts of climate change on glacier tourism. Advances in Climate Change Research, 10, 71–79.
Wang, X., D. Chen and Z. Ren, 2010: Assessment of climate change impact on residential building heating and cooling energy requirement in Australia. Build. Environ. , 45, 1663–1982, doi:10.1016/j.buildenv.2010.01.022.
Ward, M. et al., 2020: Impact of 2019-2020 mega-fires on Australian fauna habitat. Nat Ecol Evol, doi:10.1038/s41559-020-1251-1.
Wardell-Johnson, G. W., M. Calver, N. Burrows and G. Di Virgilio, 2015: Integrating rehabilitation, restoration and conservation for a sustainable jarrah forest future during climate disruption. Pac. Conserv. Biol. , 21 (3), 175–185.
Ware, D. and Z. Banhalmi-Zakar, 2020: Strategies for governments to help close the coastal adaptation funding gap. Ocean Coast. Manag. , 198, 105223, doi:10.1016/j.ocecoaman.2020.105223.
Ware, D. et al., 2020: Using Historical Responses to Shoreline Change on Australia’s Gold Coast to Estimate Costs of Coastal Adaptation to Sea Level Rise. J. Mar. Sci. Eng. , 8 (6), 380.
Warmenhoven, T. et al., 2014: Climate Change and Community Resilience in the Waiapu Catchment . MPI, Auckland, New Zealand,76 pp.
Warner, K. et al., 2019: Cross-Chapter Box 10: Economic dimensions of climate change and land. In: Special Report on Climate Change and Land [IPCC (ed.)].
Warner, K., Z. Zommers and A. Wreford, 2020: The Real Economic Dimensions of Climate Change. J. of Extr. Even. , 07 (03), 2131001, doi:10.1142/S2345737621310011.
Warnken, J. and R. Mosadeghi, 2018: Challenges of implementing integrated coastal zone management into local planning policies, a case study of Queensland, Australia. Marine Policy, 91, 75–84, doi:10.1016/j.marpol.2018.01.031.
Warren-Myers, G., A. Hurlimann and J. Bush, 2020a: Advancing capacity to adapt to climate change: addressing information needs in the Australian property industry. Journal of European Real Estate Research, ahead-of-print (ahead-of-print), doi:10.1108/JERER-03-2020-0017.
Warren-Myers, G., A. Hurlimann and J. Bush, 2020b: Barriers to climate change adaption in the Australian property industry. Journal of Property Investment & Finance, 38 (5), 449–462, doi:10.1108/jpif-12-2019-0161.
Wasko, C. and R. Nathan, 2019: Influence of changes in rainfall and soil moisture on trends in flooding. Journal of Hydrology, 575, 432–441, doi:10.1016/j.jhydrol.2019.05.054.
Wasko, C. and A. Sharma, 2015: Steeper temporal distribution of rain intensity at higher temperatures within Australian storms. Nature Geoscience, 8 (7), 527–529, doi:10.1038/ngeo2456.
Wasko, C., A. Sharma and S. Westra, 2016: Reduced spatial extent of extreme storms at higher temperatures. Geophysical Research Letters, 43 (8), 4026–4032, doi:10.1002/2016gl068509.
WaterNz, 2018: National Performance Review 2018–2019. Water New Zealand, 80 [Available at: https://www.waternz.org.nz/Attachment?Action=Download&Attachment_id=4271 ].
Waters, E. and J. Barnett, 2018: Spatial imaginaries of adaptation governance: A public perspective. Environment and Planning C: Politics and Space, 36 (4), 708–725, doi:10.1177/2399654417719557.
Waters, E., J. Barnett and A. Puleston, 2014: Contrasting perspectives on barriers to adaptation in Australian climate change policy. Climatic Change, 124 (4), 691–702, doi:10.1007/s10584-014-1138-8.
Watson, P. J., 2020: Updated Mean Sea-Level Analysis: Australia. Journal of Coastal Research, 36 (5), 915, doi:10.2112/jcoastres-d-20-00026.1.
Watson, S. A. et al., 2018: Ocean warming has a greater effect than acidification on the early life history development and swimming performance of a large circumglobal pelagic fish. Glob. Chang. Biol. , doi: http://dx.doi.org/10.1111/gcb.14290.
Watt, M. S. et al., 2019: Assessment of multiple climate change effects on plantation forests in New Zealand. Forestry: An International Journal of Forest Research, 92(1) , 1–15, doi: https://doi.org/10.1093/forestry/cpy024.
Webb, L. et al., 2014: Effect of ambient temperature on Australian northern territory public hospital admissions for cardiovascular disease among indigenous and non-indigenous populations. Int. J. Environ. Res. Public Health, 11 (2), 1942–1959, doi:10.3390/ijerph110201942.
Webb, L., R. Darbyshire, T. Erwin and I. Goodwin, 2017: A robust impact assessment that informs actionable climate change adaptation: future sunburn browning risk in apple. Int. J. Biometeorol. , 61 (5), 891–901, doi:10.1007/s00484-016-1268-y.
Webb, L. B. and K. Hennessy, 2015: Climate change in Australia: Projections for selected Australian cities. CSIRO and Bureau of Meteorology, Australia.
Webb, R. et al., 2019: Co-designing adaptation decision support: meeting common and differentiated needs. Climatic Change, 153 (4), 569–585, doi:10.1007/s10584-018-2165-7.
Weeks, E. S. et al., 2016: Conservation Science Statement. the demise of New Zealand’s freshwater flora and fauna: A forgotten treasure. Pac. Conserv. Biol. , 22 (2), 110–115, doi:10.1071/PC15038.
Wen, J., T. Ying, D. Nguyen and S. Teo, 2020: Will tourists travel to post-disaster destinations? A case of 2019 Australian bushfires from a Chinese tourists’ perspective. Tourism Recreation Research, 45 (3), 420–424, doi:10.1080/02508281.2020.1763025.
Wenger, C., 2017: The oak or the reed: how resilience theories are translated into disaster management policies. Ecology and Society, 22 (3), doi:10.5751/es-09491-220318.
Wernberg, T. et al., 2016: Climate-driven regime shift of a temperate marine ecosystem. Science, 353 (6295), 169–172, doi:10.1126/science.aad8745
10.1126/science.aad8745.
West, T. A. P. et al., 2021: Diversification of forestry portfolios for climate change and market risk mitigation. J. Environ. Manage. , 289, 112482, doi:10.1016/j.jenvman.2021.112482.
Westra, S. and S. A. Sisson, 2011: Detection of non-stationarity in precipitation extremes using a max-stable process model. Journal of Hydrology, 406 (1–2), 119–128, doi:10.1016/j.jhydrol.2011.06.014.
Wheeler, S., D. Garrick, A. Loch and H. Bjornlund, 2013: Evaluating water market products to acquire water for the environment in Australia. Land use policy, 30 (1), 427–436, doi:10.1016/j.landusepol.2012.04.004.
Wheeler, S. A., A. Zuo and A. Loch, 2018: Water torture: Unravelling the psychological distress of irrigators in Australia. Journal of Rural Studies, 62, 183–194, doi:10.1016/j.jrurstud.2018.08.006.
Whetton, P. and F. Chiew, 2020: Climate Change in the Murray-Darling Basin. In: Murray-Darling Basin, Australia – Its Future Management [Hart, B. T., N. R. Bond, N. Byron, C. A. Pollino and M. J. Stewardson (eds.)]. Elsevier, 253–274.
White, C. J. et al., 2016a: Tasmania’s State Natural Disaster Risk Assessment . University of Tasmania, Hobart, 191 [Available at: http://climatefutures.org.au/wp-content/uploads/2016/07/TSNDRA-2016.pdf ].
White, I. and J. Lawrence, 2020: Continuity and change in national riskscapes: a New Zealand perspective on the challenges for climate governance theory and practice. Cambridge Journal of Regions, Economy and Society, doi:10.1093/cjres/rsaa005.
White, I. and P. O’Hare, 2014: From Rhetoric to Reality: Which Resilience, Why Resilience, and Whose Resilience in Spatial Planning?Environment and Planning C: Government and Policy, 32 (5), 934–950, doi:10.1068/c12117.
White, R. S. A., P. A. McHugh and A. R. McIntosh, 2016b: Drought survival is a threshold function of habitat size and population density in a fish metapopulation. Glob. Chang. Biol. , 22 (10), 3341–3348, doi:10.1111/gcb.13265.
White, R. S. A. et al., 2017: The scaling of population persistence with carrying capacity does not asymptote in populations of a fish experiencing extreme climate variability. Proc. Biol. Sci. , 284 (1856), doi:10.1098/rspb.2017.0826.
Whittenbury, K., 2013: Climate Change, Women’s Health, Wellbeing and Experiences of Gender Based Violence in Australia. In: Research, Action and Policy: Addressing the Gendered Impacts of Climate Change. Springer, Dordrecht, 207–221.
Whittle, L., 2019: Snapshot of Australia’s Forest industry. Department of Agriculture Water and the Environment, Australian Bureau of Agricultural Resource Economics and Sciences (ABARES), Australia [Available at: http://agris.fao.org/agris-search/search.do?recordID=QN2019000000328 ].
Williams, M. N., S. R. Hill and J. Spicer, 2016: Do hotter temperatures increase the incidence of self-harm hospitalisations?Psychol. Health Med. , 21 (2), 226–235, doi:10.1080/13548506.2015.1028945.
Williams, R. J. et al., 2015: An International Union for the Conservation of Nature Red List ecosystems risk assessment for alpine snow patch herbfields, South-Eastern Australia. Austral Ecology, 40 (4), 433–443, doi:10.1111/aec.12266.
Williams, S. E. et al., 2020: Research priorities for natural ecosystems in a changing global climate. Global Change Biology, 26 (2), 410–416, doi:10.1111/gcb.14856.
Wilson, S. et al., 2013: Separating Adaptive Maintenance (Resilience) and Transformative Capacity of Social-Ecological Systems. Ecol. Soc. , 18 (1), doi:10.5751/ES-05100-180122.
Wilson, S. and G. Swan, 2017: A Complete Guide to Reptiles of Australia. Reed New Holland,, 560 pp.
Wintle, B. A., S. Legge and J. C. Z. Woinarski, 2020: After the Megafires: What Next for Australian Wildlife?Trends Ecol. Evol. , 35 (9), 753–757, doi:10.1016/j.tree.2020.06.009.
Wiseman, N. and D. Bardsley, 2016: Monitoring to learn, learning to monitor: a critical analysis of opportunities for Indigenous community-based monitoring of environmental change in Australian rangelands. Geographical Research, 54 (1), 52–71.
Wohling, M., 2009: The problem of scale in indigenous knowledge: a perspective from northern Australia. Ecology and Society, 14 (1).
Wong, T. H. F., N. J. Tapper and S. P. Luby, 2020: Planetary health approaches for dry cities: water quality and heat mitigation. British Medical Journal, 371, doi: https://doi.org/10.1136/bmj.m4313.
Woodroffe, C. et al., 2014: A framework for modelling the risks of climate-change impacts on Australian coasts. In: Applied Studies in Climate Adaptation [Palutikof, J. P., S. L. Boulter, J. Barnett and D. Rissik (eds.)]. John Wiley & Sons, Ltd, Chichester, UK, 88, 181–189.
World Economic Forum, 2014: Global risks report . World Economic Forum, Geneva [Available at: https://reports.weforum.org/global-risks-2014/ ].
Worth, J. R. P. et al., 2014: Environmental niche modelling fails to predict Last Glacial Maximum refugia: niche shifts, microrefugia or incorrect palaeoclimate estimates?Glob. Ecol. Biogeogr. , 23 (11), 1186–1197, doi:10.1111/geb.12239.
Wreford, A., K. Bayne, P. Edwards and A. Renwick, 2019: Enabling a transformation to a bioeconomy in New Zealand. Environmental Innovation and Societal Transitions, 31, 184–199, doi:10.1016/j.eist.2018.11.005.
Wreford, A. et al., 2020: Robust climate change adaptation decision-making under uncertainty: Real Options Analysis for water storage. Wellington [Available at: https://deepsouthchallenge.co.nz/ ].
WSAA, 2016: Climate Change Adaptation Guidelines. Water Services Association of Australia, Water Services Association of Australia, Melbourne/Sydeny, Australia, 89 [Available at: https://www.wsaa.asn.au/publication/climate-change-adaptation-guidelines ].
WTTC, 2018: Travel and tourism: Economic impact 2018 New Zealand. World Travel and Tourism Council, New Zealand [Available at: https://www.wttc.org/economic-impact/country-analysis/country-data/ ].
Wu, W. et al., 2018: Mapping Dependence Between Extreme Rainfall and Storm Surge. Journal of Geophysical Research: Oceans, 123 (4), 2461–2474, doi:10.1002/2017jc013472.
Yazd, D. S., S. A. Wheeler and A. Zuo, 2020: Understanding the impacts of water scarcity and socio-economic demographics on farmer mental health in the Murray-Darling Basin. Ecological Economics, 169, 106564, doi: https://doi.org/10.1016/j.ecolecon.2019.106564.
Yazd, S. D., S. A. Wheeler and A. Zuo, 2019: Exploring the Drivers of Irrigator Mental Health in the Murray–Darling Basin, Australia. Sustainability, 11 (21), 6097, doi:10.3390/su11216097.
Yen, J. D. L. et al., 2013: Identifying effective water-management strategies in variable climates using population dynamics models. J. Appl. Ecol. , 50 (3), 691–701, doi:10.1111/1365-2664.12074.
Yenneti, K. et al., 2020: Urban Overheating and Cooling Potential in Australia: An Evidence-Based Review. Climate, 8 (11), 126, doi:10.3390/cli8110126.
Yletyinen, J. et al., 2019: Understanding and Managing Social–Ecological Tipping Points in Primary Industries. BioScience, 69 (5), 335–347, doi:10.1093/biosci/biz031.
Young, I. R. and A. Ribal, 2019: Multiplatform evaluation of global trends in wind speed and wave height. Science, 364 (6440), 548–552, doi:10.1126/science.aav9527.
Zarco-Perello, S. et al., 2019: Overwintering tropical herbivores accelerate detritus production on temperate reefs. Proc. Biol. Sci. , 286 (1915), 20192046, doi:10.1098/rspb.2019.2046.
Zarco-Perello, S., T. Wernberg, T. J. Langlois and M. A. Vanderklift, 2017: Tropicalization strengthens consumer pressure on habitat-forming seaweeds. Sci. Rep. , 7 (1), 820, doi: http://dx.doi.org/10.1038/s41598-017-00991-2.
Zhang, X., J. A. Church, D. Monselesan and K. L. McInnes, 2017: Sea level projections for the Australian region in the 21st century. Geophysical Research Letters, 44 (16), 8481–8491, doi:10.1002/2017gl074176.
Zhang, X. S. et al., 2016: How streamflow has changed across Australia since the 1950s: evidence from the network of hydrologic reference stations. Hydrology and Earth System Sciences, 20 (9), 3947–3965, doi:10.5194/hess-20-3947-2016.
Zhang, Y. and P. J. Beggs, 2018: The Lancet Countdown down under: tracking progress on health and climate change in Australia. Medical Journal of Australia, 208 (7), 285–286, doi:10.5694/mja17.01245.
Zhang, Y., M. Nitschke and P. Bi, 2013: Risk factors for direct heat-related hospitalization during the 2009 Adelaide heatwave: a case crossover study. Sci. Total Environ. , 442, 1–5.
Zhang, Y. and C. J. C. Phillips, 2019: Climatic influences on the mortality of sheep during long-distance sea transport. animal, 13 (5), 1054–1062, doi:10.1017/S1751731118002380.
Zheng, F., S. Westra and M. Leonard, 2015: Opposing local precipitation extremes. Nature Climate Change, 5 (5), 389–390, doi:10.1038/nclimate2579.
Zheng, H., F. H. S. Chiew, N. J. Potter and D. G. C. Kirono, 2019: Projections of water futures for Australia: an update. In: 23rd International Congress on Modelling and Simulation, 2019, Canberra, Australia, International Congress on Modelling and Simulation,, 1000–1006.
Ziembicki, M. R., J. C. Z. Woinarski and B. Mackey, 2013: Evaluating the status of species using Indigenous knowledge: Novel evidence for major native mammal declines in northern Australia. Biological Conservation, 157, 78–92, doi:10.1016/j.biocon.2012.07.004.
Zografos, C., I. Anguelovski and M. Grigorova, 2016: When exposure to climate change is not enough: Exploring heatwave adaptive capacity of a multi-ethnic, low-income urban community in Australia. Urban Climate, 17, 248–265, doi:10.1016/j.uclim.2016.06.003.
Zscheischler, J. et al., 2018: Future climate risk from compound events. Nat. Clim. Chang. , 8 (6), 469–477, doi:10.1038/s41558-018-0156-3.
Zylstra, P. J., 2018: Flammability dynamics in the Australian Alps. Austral Ecology, 43 (5), 578–591.
1 In this Report, the following summary terms are used to describe the available evidence: limited, medium, or robust; and for the degree of agreement: low, medium, or high. A level of confidence is expressed using five qualifiers: very low, low, medium, high, and very high, and typeset in italics, e.g., medium confidence. For a given evidence and agreement statement, different confidence levels can be assigned, but increasing levels of evidence and degrees of agreement are correlated with increasing confidence.
2 In this Report, the following summary terms are used to describe the available evidence: limited, medium, or robust; and for the degree of agreement: low, medium, or high. A level of confidence is expressed using five qualifiers: very low, low, medium, high, and very high, and typeset in italics, e.g., medium confidence. For a given evidence and agreement statement, different confidence levels can be assigned, but increasing levels of evidence and degrees of agreement are correlated with increasing confidence.


