Chapter 11: Industry


This chapter should be cited as:
Bashmakov, I.A., L.J. Nilsson, A. Acquaye, C. Bataille, J.M. Cullen, S. de la Rue du Can, M. Fischedick, Y. Geng, K. Tanaka, 2022: Industry. In IPCC, 2022: Climate Change 2022: Mitigation of Climate Change. Contribution of Working Group III to the Sixth Assessment Report of the Intergovernmental Panel on Climate Change[P.R. Shukla, J. Skea, R. Slade, A. Al Khourdajie, R. van Diemen, D. McCollum, M. Pathak, S. Some, P. Vyas, R. Fradera, M. Belkacemi, A. Hasija, G. Lisboa, S. Luz, J. Malley, (eds.)]. Cambridge University Press, Cambridge, UK and New York, NY, USA. doi: 10.1017/9781009157926.013
Executive Summary
The Paris Agreement, the Sustainable Development Goals (SDGs) and the COVID-19 pandemic provide a new context for the evolution of industry and the mitigation of industry greenhouse gas (GHG) emissions (high confidence). This chapter is focused on what is new since AR5. It emphasises the energy and emissions intensive basic materials industries and key strategies for reaching net zero emissions. {11.1.1}
Net zero CO2 emissions from the industrial sector are possible but challenging (high confidence) . Energy efficiency will continue to be important. Reduced materials demand, material efficiency, and circular economy solutions can reduce the need for primary production. Primary production options include switching to new processes that use low to zero GHG energy carriers and feedstocks (e.g., electricity, hydrogen, biofuels, and carbon capture and utilisation (CCU) for carbon feedstock), and carbon capture and storage (CCS) for remaining CO2. These options require substantial scaling up of electricity, hydrogen, recycling, CO2, and other infrastructure, as well as phase-out or conversion of existing industrial plants. While improvements in the GHG intensities of major basic materials have nearly stagnated over the last 30 years, analysis of historical technology shifts and newly available technologies indicate these intensities can be reduced to net zero emissions by mid-century. {11.2, 11.3, 11.4}
Whatever metric is used, industrial emissions have been growing faster since 2000 than emissions in any other sector, driven by increased basic materials extraction and production (high confidence). GHG emissions attributed to the industrial sector originate from fuel combustion, process emissions, product use and waste, which jointly accounted for 14.1 GtCO2-eq or 24% of all direct anthropogenic emissions in 2019, second behind the energy transformation sector. Industry is a leading GHG emitter – 20 GtCO2-eq or 34% of global emissions in 2019 – if indirect emissions from power and heat generation are included. The share of emissions originating from direct fuel combustion is decreasing and was 7 GtCO2-eq, 50% of direct industrial emissions in 2019. {11.2.2}
Global material intensity (in-use stock of manufactured capital, in tonnes per unit of GDP is increasing (high confidence). In-use stock of manufactured capital per capita has been growing faster than GDP per capita since 2000. Total global in-use stock of manufactured capital grew by 3.4% yr –1 in 2000–2019. At the same time, per capita material stocks in several developed countries have stopped growing, showing a decoupling from GDP per capita. {11.2.1, 11.3.1}
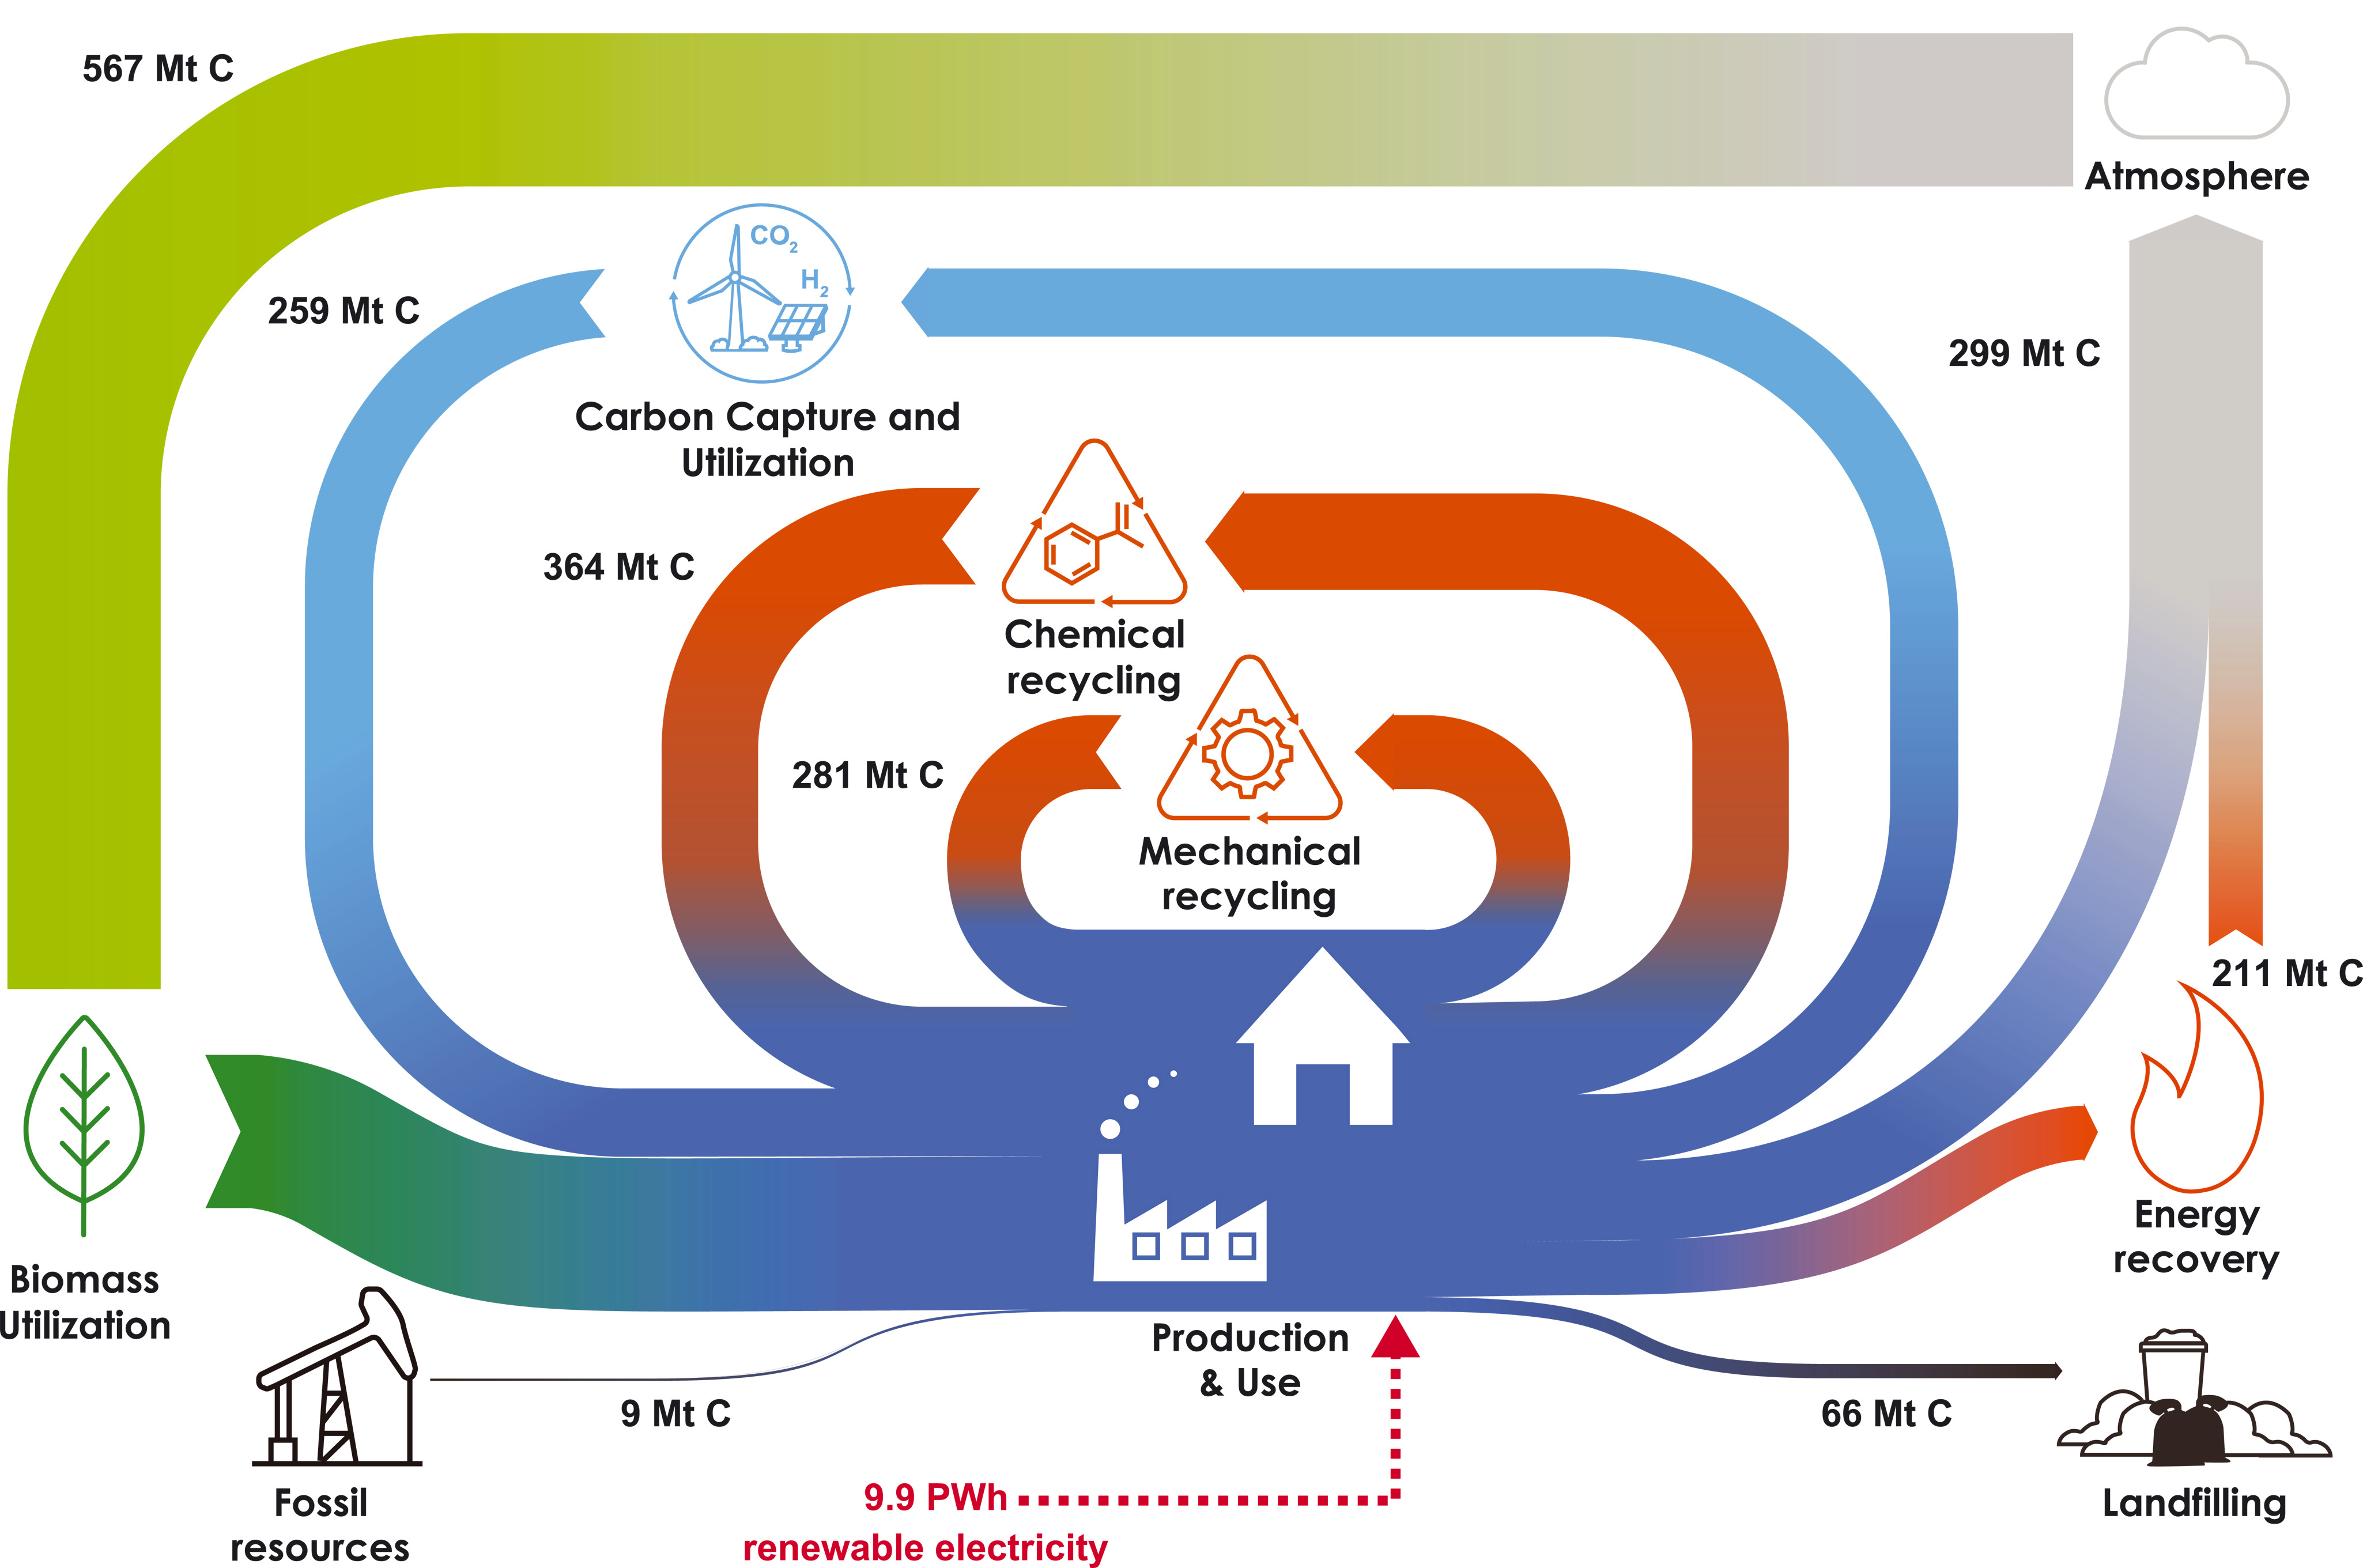
Plastic is the material for which demand has been growing the strongest since 1970 (high confidence). The current >99% reliance on fossil feedstock, very low recycling, and high emissions from petrochemical processes is a challenge for reaching net zero emissions. At the same time, plastics are important for reducing emissions elsewhere, for example, light-weighting vehicles. There are as yet no shared visions for fossil-free plastics, but several possibilities. {11.4.1.3}
Scenario analyses show that significant cuts in global GHG emissions and even close to net zero emissions from GHG intensive industry (e.g., steel, plastics, ammonia, and cement) can be achieved by 2050 by deploying multiple available and emerging options (medium confidence). Cutting industry emissions significantly requires a reorientation from the historic focus on important but incremental improvements (e.g., energy efficiency) to transformational changes in energy and feedstock sourcing, materials efficiency, and more circular material flows. {11.3, 11.4}
Key climate mitigation options such as materials efficiency, circular material flows and emerging primary processes, are not well represented in climate change scenario modelling and integrated assessment models, albeit with some progress in recent years (high confidence). The character of these interventions (e.g., appearing in many forms across complex value chains, making cost estimates difficult) combined with the limited data on new fossil-free primary processes help explain why they are less represented in models than, for example, CCS. As a result, overall mitigation costs and the need for CCS may be overestimated. {11.4.2.1}
Electrification is emerging as a key mitigation option for industry (high confidence). Electricity is a versatile energy carrier, potentially produced from abundant renewable energy sources or other low carbon options; regional resources and preferences will vary. Using electricity directly, or indirectly via hydrogen from electrolysis for high temperature and chemical feedstock requirements, offers many options to reduce emissions. It also can provide substantial grid balancing services, for example through electrolysis and storage of hydrogen for chemical process use or demand response. {11.3.5}
Carbon is a key building block in organic chemicals, fuels and materials, and will remain important (high confidence). In order to reach net zero CO2 emissions for the carbon needed in society (e.g., plastics, wood, aviation fuels, solvents, etc.), it is important to close the use loops for carbon and carbon dioxide through increased circularity with mechanical and chemical recycling, more efficient use of biomass feedstock with the addition of low GHG hydrogen to increase product yields (e.g., for biomethane and methanol), and potentially direct air capture of CO2 as a new carbon source. {11.3, 11.4.1}
Production costs for very low to zero emissions basic materials may be high but the cost for final consumers and the general economy will be low (medium confidence). Costs and emissions reductions potential in industry, and especially heavy industry, are highly contingent on innovation, commercialisation, and market uptake policy. Technologies exist to take all industry sectors to very low or zero emissions but require 5 to 15 years of intensive innovation, commercialisation, and policy to ensure uptake. Mitigation costs are in the rough range of USD50–150 tCO2-eq –1, with wide variation within and outside this band. This affects competitiveness and requires supporting policy. Although production cost increases can be significant, they translate to very small increases in the costs for final products, typically less than a few percent depending on product, assumptions, and system boundaries. {11.4.1.5}
There are several technological options for very low to zero emissions steel, but their uptake will require integrated material efficiency, recycling, and production decarbonisation policies (high confidence). Material efficiency can potentially reduce steel demand by up to 40% based on design for less steel use, long life, reuse, constructability, and low contamination recycling. Secondary production through high quality recycling must be maximised. Production decarbonisation will also be required, starting with the retrofitting of existing facilities for partial fuel switching (e.g., to biomass or hydrogen), CCU and CCS, followed by very low and zero emissions production based on high-capture CCS or direct hydrogen, or electrolytic iron ore reduction followed by an electric arc furnace. {11.3.2, 11.4.1.1}
There are several current and near-horizon options to greatly reduce cement and concrete emissions. Producer, user, and regulator education, as well as innovation and commercialisation policy are needed (medium confidence). Cement and concrete are currently overused because they are inexpensive, durable, and ubiquitous, and consumption decisions typically do not give weight to their production emissions. Basic material efficiency efforts to use only well-made concrete thoughtfully and only where needed (e.g., using right-sized, prefabricated components) could reduce emissions by 24–50% through lower demand for clinker. Cementitious material substitution with various materials (e.g., ground limestone and calcined clays) can reduce process calcination emissions by up to 50% and occasionally much more. Until a very low GHG emissions alternative binder to Portland cement is commercialised, which does not look promising in the near to medium term, CCS will be essential for eliminating the limestone calcination process emissions for making clinker, which currently represent 60% of GHG emissions in best available technology plants. {11.3.2, 11.3.6, 11.4.1.2}
While several technological options exist for decarbonising the main industrial feedstock chemicals and their derivatives, the costs vary widely (high confidence) . Fossil fuel-based feedstocks are inexpensive and still without carbon pricing, and their biomass- and electricity-based replacements will likely be more expensive. The chemical industry consumes large amounts of hydrogen, ammonia, methanol, carbon monoxide, ethylene, propylene, benzene, toluene, and mixed xylenes and aromatics from fossil feedstock, and from these basic chemicals produces tens of thousands of derivative end-use chemicals. Hydrogen, biogenic or air-capture carbon, and collected plastic waste for the primary feedstocks can greatly reduce total emissions. Biogenic carbon feedstock is likely to be limited due to competing land uses. {11.4.1.3}
Light industry and manufacturing can be largely decarbonised through switching to low GHG fuels (e.g., biofuels and hydrogen) and electricity (e.g., for electrothermal heating and heat pumps) (high confidence) . Most of these technologies are already mature, for example, for low temperature heat, but a major challenge is the current low cost of fossil methane and coal relative to low and zero GHG electricity, hydrogen, and biofuels. {11.4.1.4}
The pulp and paper industry has significant biogenic carbon emissions but relatively small fossil carbon emissions. Pulp mills have access to biomass residues and by-products and in paper mills the use of process heat at low to medium temperatures allows for electrification (high confidence). Competition for feedstock will increase if wood substitutes for building materials and petrochemicals feedstock. The pulp and paper industry can also be a source of biogenic carbon dioxide and carbon for organic chemicals feedstock and carbon dioxide removal (CDR) using CCS. {11.4.1.4}
The geographical distribution of renewable resources has implications for industry (medium confidence). The potential for zero emission electricity and low-cost hydrogen from electrolysis powered by solar and wind, or hydrogen from other very low emission sources, may reshape where currently energy and emissions intensive basic materials production is located, how value chains are organised, trade patterns, and what gets transported in international shipping. Regions with bountiful solar and wind resources, or low fugitive methane co-located with CCS geology, may become exporters of hydrogen or hydrogen carriers such as methanol and ammonia, or home to the production of iron and steel, organic platform chemicals, and other energy-intensive basic materials. {11.2, 11.4 and Box 11.1}
The level of policy maturity and experience varies widely across the mitigation options (high confidence). Energy efficiency is a well-established policy field with decades of experience from voluntary and negotiated agreements, regulations, energy auditing and demand side-management (DSM) programmes (see AR5). In contrast, materials demand management and efficiency are not well understood and addressed from a policy perspective. Barriers to recycling that policy could address are often specific to the different material loops (e.g., copper contamination for steel and lack of technologies or poor economics for plastics) or waste management systems. For electrification and fuel switching the focus has so far been mainly on innovation and developing technical supply-side solutions rather than creating market demand. {11.5.2, 11.6}
Industry has so far largely been sheltered from the impacts of climate policy and carbon pricing due to concerns for competitiveness and carbon leakage (high confidence). New industrial development policy approaches needed for realising a transition to net zero GHG emissions are emerging. The transition requires a clear direction towards net zero, technology development, market demand for low-carbon materials and products, governance capacity and learning, socially inclusive phase-out plans, as well as international coordination of climate and trade policies. It requires comprehensive and sequential industrial policy strategies leading to immediate action as well as preparedness for future decarbonisation, governance at different levels (from international to local), and integration with other policy domains. {11.6}
11.1Introduction and New Developments
11.1.1About This Chapter
The AR5 was published in 2014. The Paris Agreement and the 17 Sustainable Development Goals (SDGs) were adopted in 2015. An increasing number of countries have since announced ambitions to be carbon neutral by 2045–2060. The COVID-19 pandemic shocked the global economy in 2020 and motivated economic stimulus with demands for green recovery and concerns for economic security. All this has created a new context and a growing recognition that all industry, including the energy and emissions intensive industries, need to reach net zero GHG emissions. There is an ongoing mind shift around the opportunities to do so, with electrification and hydrogen emerging among key mitigation options as a result of renewable electricity costs falling rapidly. On the demand side there has been renewed attention to end-use demand, material efficiency, and more and better-quality recycling measures. This chapter takes its starting point in this new context and emphasises the need for deploying innovative processes and practices in order to limit the global warming to 1.5°C or 2°C (IPCC 2018a).
The industrial sector includes ores and minerals mining, manufacturing, construction and waste management. It is the largest source of global GHG and CO2 emissions, which include direct and indirect fuel-combustion-related emissions, emissions from industrial processes and products use, as well as from waste. This chapter is focused on heavy industry – the high temperature heat and process emissions intensive basic materials industries that account for 65% of industrial GHG and over 70% of industrial CO2 emissions (waste excluded), where deployment of near‐zero emissions technologies can be more challenging due to capital intensity and equipment lifetimes compared with other manufacturing industries. The transition of heavy industries to zero emissions requires supplementing the traditional toolkit of energy and process efficiency, fuel switching, electrification, and decarbonisation of power with material end-use demand management and efficiency, circular economy, fossil-free feedstocks, carbon capture and utilisation (CCU), and carbon capture and storage (CCS). Energy efficiency was extensively treated in AR5 and remains a key mitigation option. This chapter is focused mainly on new options and developments since AR5, highlighting measures along the whole value chains that are required to approach zero emissions in primary materials production.
11.1.2Approach to Understanding Industrial Emissions
The Kaya identity offers a useful tool of decomposing emission sources and their drivers, as well as of weighing the mitigation options. The one presented below (Equation 11.1) builds on the previous assessments (IPCC 2014, 2018b; Hoegh-Guldberg et al. 2018), and reflect a material stock-driven services-oriented vision to better highlight the growing importance of industrial processes (dominated in emissions increments in 2010–2019), product use and waste in driving emissions. Services delivery (nutrition, shelter, mobility, education, etc.; see Chapter 5 for more detail) not only requires energy and material flows (fuels, food, feed, fertilisers, packaging, etc.), but also material stocks (buildings, roads, vehicles, machinery, etc.), the mass of which has already exceeded 1000 Gt (Krausmann et al. 2018). As material efficiency appears to be an important mitigation option, material intensity or productivity (material extraction or consumption versus GDP (Oberle et al. 2019; Hertwich et al. 2020)) is reflected in the identity with two dimensions: as material stock intensity of GDP (tonnes per dollar) and material intensity of building and operating accumulated in-use stock. 1 For sub-global analysis the ratio of domestically used materials to total material production becomes important to reflect outsourced materials production and distinguish between territorial and consumption-based emissions. The identity for industry differs significantly from that for sectors with where combustion emissions dominate (Lamb et al. 2021).
Recent progress in data availability that allows the integration of major emission sources along with socio-economic metabolism, material flows and stock analysis enriches the identity for industry from a perspective of possible policy interventions (Bashmakov 2021):
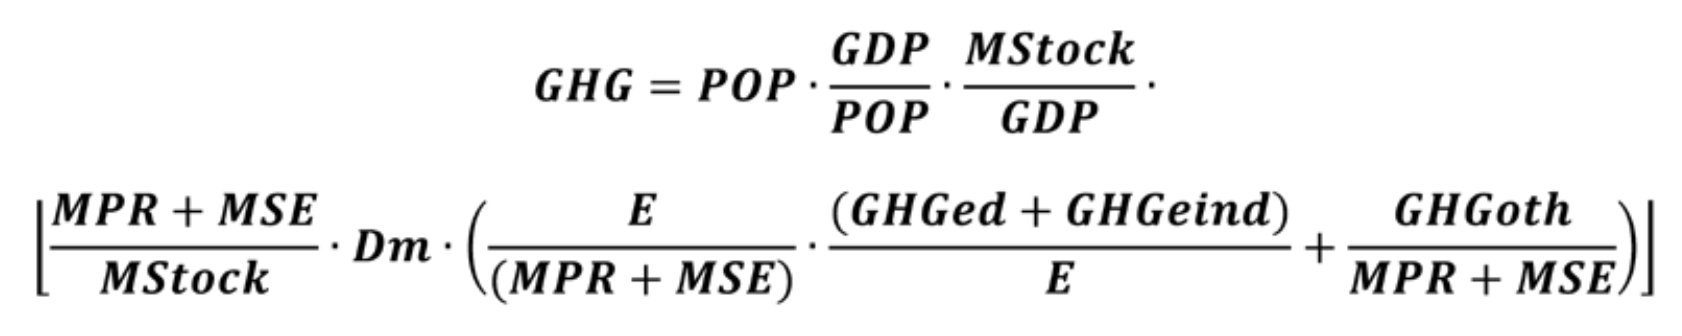
Equation 11.1 Table 1 | Variables, Factors, Policies and Drivers
Variables | Factors | Policies and drivers | |
POP | Population | Demographic policies | Demand decarbonisation |
GDP/POP | Services (expressed via GDP– final consumption and investments needed to maintain and expand stock) per capita | Sufficiency and demand management (reduction) | |
MStock/GDP | Material stock (MStock – accumulated in-use stocks of materials embodied in manufactured fixed capital) intensity of GDP | Material stock efficiency improvement | |
(MPR+MSE)/MStock | Material inputs (both virgin (primary materials extraction, MPR) and recycled (secondary materials use, MSE)) per unit of in-use material stock | Material efficiency, substitution and circular economy | |
Dm | Share of allocated emissions – consumption vs production emissions accounting (valid only for sub-global levels)* | Trade policies including carbon leakage issues (localisation versus globalisation) | CBAM |
E/(MPR+MSE) | Sum of energy use for basic material production (Em), processing and other operational industrial energy use (Eoind) per unit of material inputs | Energy efficiency of basic materials production and other industrial processes | Production decarbonisation |
(GHGed+GHGeind)/E | Direct (GHGed) and indirect (GHGeind) combustion-related industrial emissions per unit of energy | Electrification, fuel switching, and energy decarbonisation (hydrogen, CCUS-fuels) | |
GHGoth/(MPR+MSE) | Emissions from industrial processes and product use, waste, F-gases, indirect nitrogen emissions per unit of produced materials | Feedstock decarbonisation (hydrogen), CCUS-industrial processes, waste and F-gases management |
*Dm=1, when territorial emission is considered, and Dm equals the ratio of domestically used materials to total material production for the consumption-based emission accounting). CBAM – carbon border adjustment mechanism.
Factors in Equation 11.1 are interconnected by either positive or negative feedbacks: scrap-based production or light-weighing improves operational energy efficiency, while growing application of carbon capture, use and storage (CCUS) brings it down and increases material demands (Hertwich et al. 2019; IEA 2020a, 2021a). There are different ways to disaggregate Equation 11.1: by industrial subsectors (Bashmakov 2021); by reservoirs of material stock (buildings, infrastructure, vehicles, machinery and appliances, packaging, etc.); by regions and countries (where carbon leakage becomes relevant); by products and production chains (material extraction, production of basic materials, basic materials processing, production of final industrial products); by traditional and low carbon technologies used; and by stages of products’ lives including recycling.
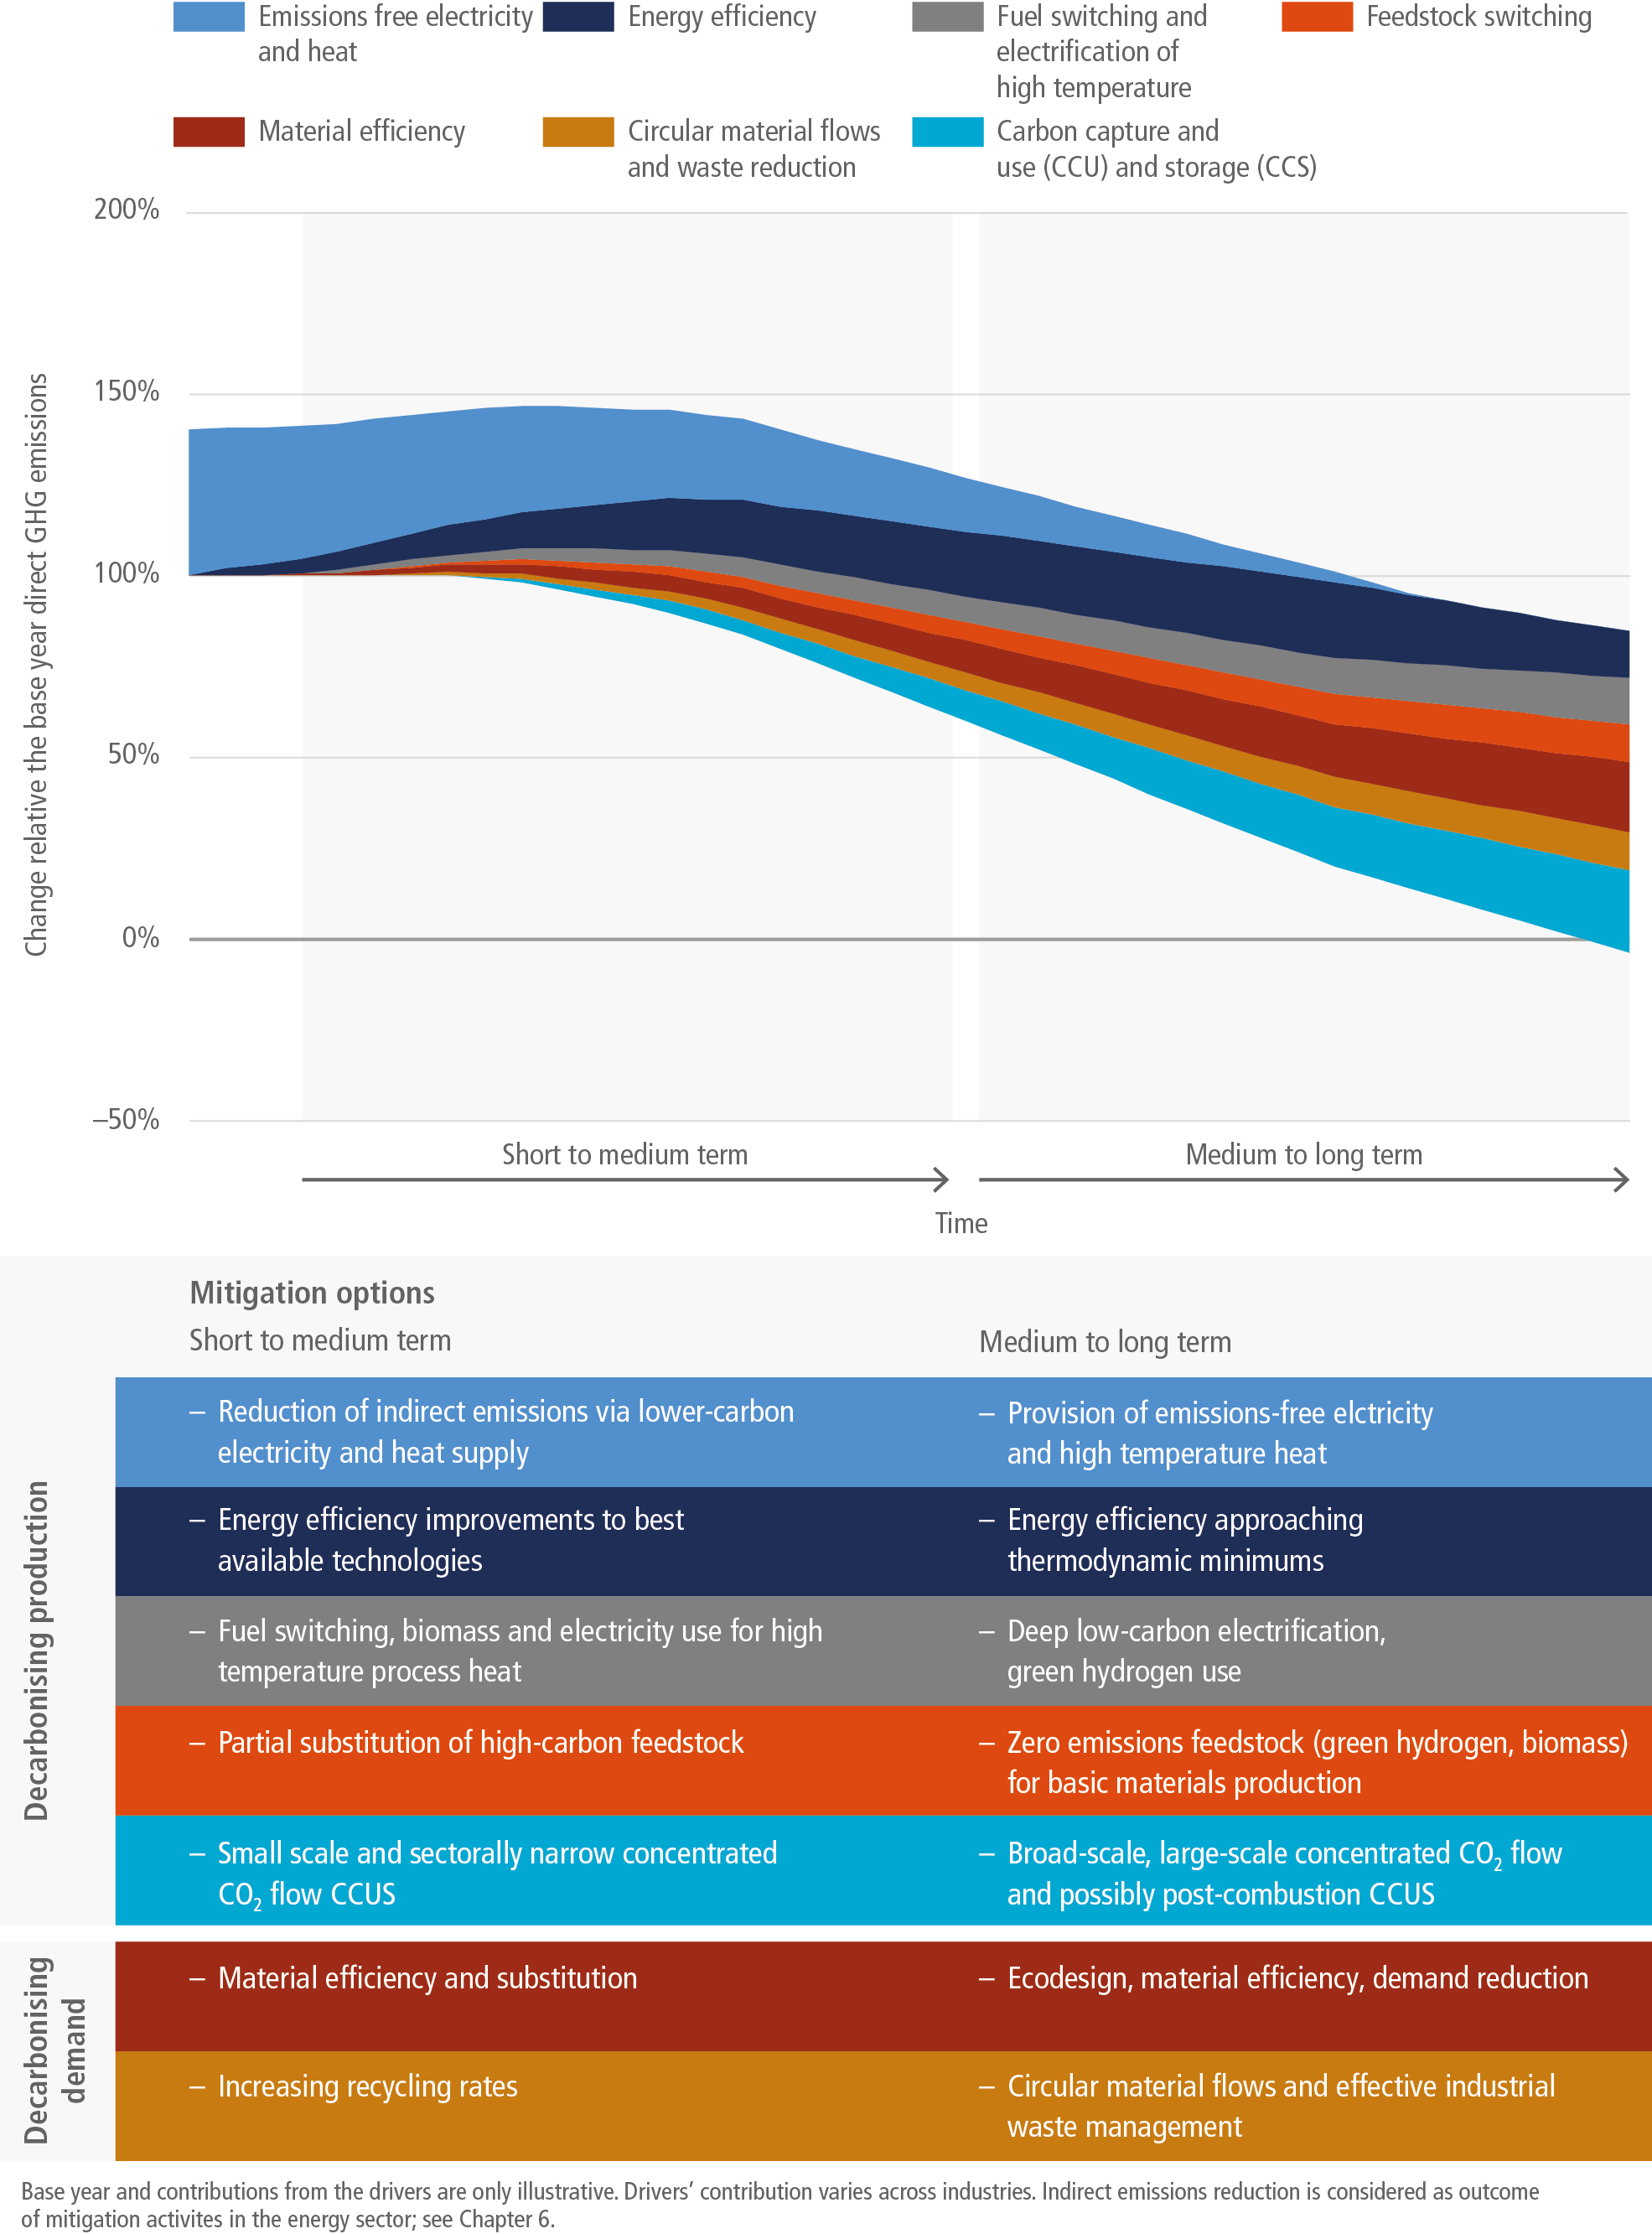
An industrial transition to net zero emissions is possible when the three last multipliers in Equation 11.1 (in square parentheses) are approaching zero. Contributions from different drivers (energy efficiency, low carbon electricity and heat, material efficiency, switching to low carbon feedstock and CCUS) to this evolution vary with time. Energy efficiency dominates in the short- and medium term and potentially long term (in the range of 10–40% by 2050) (IPCC 2018a; Crijns-Graus et al. 2020; IEA 2020a), but for deep decarbonisation trajectories, contributions from the other drivers steadily grow, as the share of non-energy sources in industrial emissions rises and new technologies to address mitigation from these sources mature (Material Economics 2019; CEMBUREAU 2020; BP 2020; Hertwich et al. 2020, 2019; IEA 2021a, 2020a; Saygin and Gielen 2021) (Figure 11.1).

Figure 11.1 | Stylised composition and contributions from different drivers to the transition of industry to net zero emissions.
11.2New Trends in Emissions and Industrial Development
11.2.1Major Drivers
The use of materials is deeply coupled with economic development and growth. For centuries, humanity has been producing and using hundreds of materials (Ashby 2012), the diversity of which skyrocketed in the recent half-century to achieve the desired performance and functionality of multiple products (density; hardness; compressive strength; melting point, resistance to mechanical and thermal shocks and to corrosion; transparency; heat- or electricity conductivity; chemical neutrality or activity, to name a few). New functions drive the growth of material complexity of products; for example, a modern computer chip embodies over 60 different elements (Graedel et al. 2015).
Key factors driving up industrial GHG emissions since 1900 include population and per capita GDP, 2 while energy efficiency and non-combustion GHG emissions intensity (from industrial processes and waste) has been pushing it down. Material efficiency factors – material stock intensity of GDP and ratio of extraction, processing and recycling of materials per unit of built capital along with combustion-related emissions intensity factors and electrification – were cyclically switching their contributions with relatively limited overall impact. Growing recycling allowed for replacement of some energy-intensive virgin materials and thus contributed to mitigation. In 2014–2019, a combination of these drivers allowed for a slowdown in the growth of industrial GHG emissions to below 1% (Figure 11.2 and Table 11.1), while to match a net zero emissions trajectory it should decline by 2% yr –1 in 2020–2030 and by 8.9% yr –1 in 2030–2050 (IEA 2021a).
Table 11.1 | Dynamics and structure of industrial greenhouse gas (GHG) emissions.
Average annual growth rates | Share in total industrial sector emissions | 2019 emissions MtCO2-eq | |||||||||
1971–1990 | 1991–2000 | 2000–2010 | 2011–2019 | 1970 | 1990 | 2000 | 2010 | 2019 | |||
Direct CO2 emissions from fuel combustion | Mining (excl. fuels), manufacturing industries and construction | 0.13% | –0.18% | 4.62% | 0.77% | 45.8% | 37.3% | 33.2% | 36.6% | 34.9% | 6981 |
Iron and steel | 0.20% | 0.13% | 5.62% | 2.28% | 12.4% | 10.2% | 9.4% | 11.4% | 12.4% | 2481 | |
Chemical and petrochemical | 3.66% | 1.54% | 3.16% | 1.19% | 3.0% | 4.9% | 5.2% | 4.9% | 4.9% | 977 | |
Non-ferrous metals | 2.12% | 3.20% | 1.12% | 1.36% | 0.7% | 0.8% | 1.0% | 0.8% | 0.8% | 163 | |
Non-metallic minerals | 2.91% | 1.88% | 6.24% | –0.04% | 3.3% | 4.6% | 5.0% | 6.5% | 5.7% | 1148 | |
Paper, pulp and printing | 0.78% | 2.79% | 0.09% | –2.69% | 1.4% | 1.3% | 1.5% | 1.1% | 0.7% | 150 | |
Food and tobacco | 2.55% | 1.50% | 3.03% | –1.04% | 1.3% | 1.6% | 1.7% | 1.6% | 1.3% | 265 | |
Other | –1.55% | –2.89% | 4.61% | –0.22% | 23.8% | 13.8% | 9.4% | 10.3% | 9.0% | 1797 | |
Indirect emissions – electricity | 2.87% | 2.06% | 3.00% | –0.87% | 17.6% | 24.6% | 27.3% | 25.8% | 21.2% | 4236 | |
Indirect emissions – heat | 2.08% | –3.09% | 2.53% | 9.83% | 5.6% | 6.7% | 4.5% | 4.0% | 8.3% | 1663 | |
Industrial processes CO2 | Total | 1.45% | 2.16% | 5.00% | 1.93% | 11.0% | 11.6% | 13.0% | 14.9% | 15.7% | 3144 |
Non-metallic minerals | 2.22% | 2.36% | 5.66% | 1.67% | 5.7% | 7.0% | 8.0% | 9.7% | 10.0% | 2008 | |
Chemical and petrochemical | 4.51% | 2.52% | 3.50% | 2.01% | 1.5% | 2.9% | 3.4% | 3.4% | 3.6% | 720 | |
Metallurgy | –3.11% | 0.37% | 5.16% | 3.10% | 3.6% | 1.5% | 1.4% | 1.7% | 2.0% | 391 | |
Other | 1.55% | 2.30% | –1.21% | 2.89% | 0.1% | 0.2% | 0.2% | 0.1% | 0.1% | 25 | |
Industrial product use GHG | –0.22% | –0.49% | –1.02% | 0.41% | 2.7% | 2.0% | 1.7% | 1.1% | 1.0% | 204 | |
Other non-CO2GHG | –0.60% | 5.20% | 4.29% | 3.20% | 5.5% | 3.9% | 5.8% | 6.2% | 7.3% | 1470 | |
Waste GHG | 1.94% | 1.35% | 1.22% | 1.57% | 11.9% | 13.8% | 14.4% | 11.4% | 11.6% | 2327 | |
Total GHG | 1.16% | 0.98% | 3.61% | 1.32% | 100.0% | 100.0% | 100.0% | 100.0% | 100.0% | 20,025 | |
Source: calculated based on Crippa et al. (2021); IEA (2021b); and Minx et al. (2021).
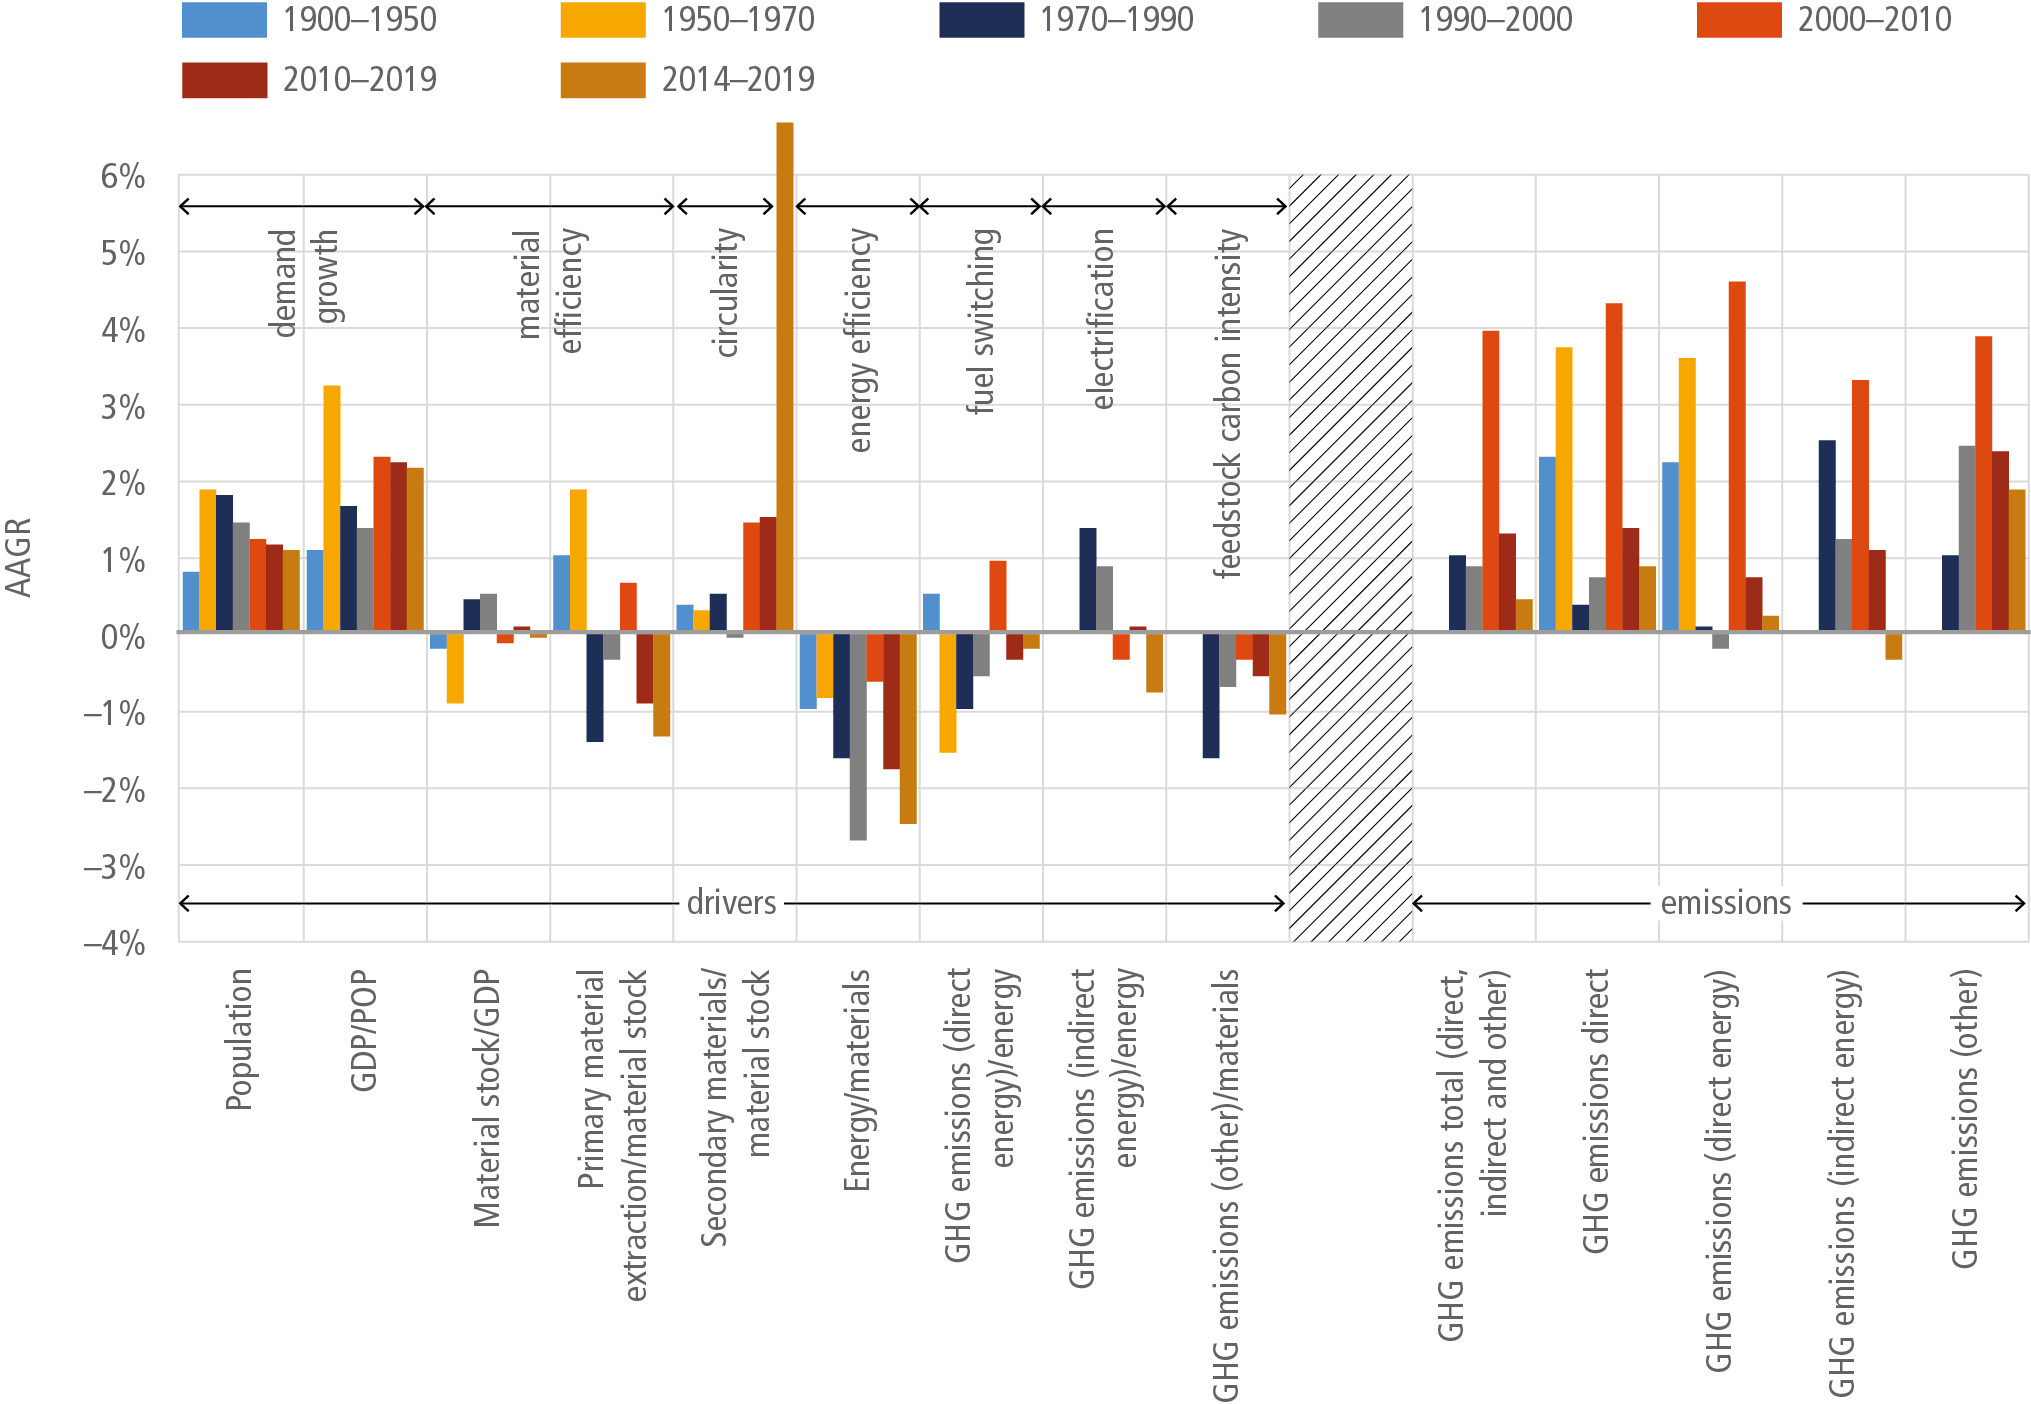
Figure 11.2 | Average annual growth rates of industrial sector GHG emissions and drivers (1900–2019). Before 1970, GHG emission (other) is limited to that from cement production. Waste emission is excluded. Primary material extraction excludes fuels and biomass. Presented factors correspond directly to Equation 11.1. Sources: population before 1950 and GDP before 1960: Maddison Project (2018); population from 1950 to 1970: UN (2015); population and GDP for 1960–2020: World Bank (2021); data on material stock, extraction, and use of secondary materials: Wiedenhofer et al. (2019); data on material extraction: UNEP and IRP (2020); industrial energy use for 1900–1970: IIASA (2018), for 1971–2019: IEA (2021b); data on industrial GHG emissions for 1900–1970: CDIAC (2017), for 1970–2019: data from Crippa et al. (2021) and Minx et al. (2021).
There are two major concepts of material efficiency (ME). The broader one highlights demand reduction via policies promoting more intensive use, assuming sufficient (excluding luxury) living space or car ownership providing appropriate service levels – housing days or miles driven and life-time extension (Hertwich et al. 2019, 2020). This approach focuses on dematerialisation of society (Lechtenböhmer and Fischedick 2020), where a ‘dematerialisation multiplier’ (Pauliuk et al. 2021) limits both material stock and GDP growth, as progressively fewer materials are required to build and operate the physical in-use stock to deliver sufficient services. According to the IRP (2020), reducing floor space demand by 20% via shared and smaller housing compared to the reference scenario would decrease Group of Seven (G7) countries’ GHG emissions from the material-cycle of residential construction up to 70% in 2050. The narrower concept ignores demand and sufficiency aspects and focuses on supply chains considering ME as less basic materials use to produce a certain final product, for example, a car or a metre squared of living space (OECD 2019a; IEA 2020a). No matter if the broader or the narrower concept of ME is applied, in 1970–2019 it did not contribute much to the decoupling of industrial emissions from GDP. This is expected to change in the future (Figure 11.2).
Material efficiency analysis mostly uses material intensity or productivity indicators, which compare material extraction or consumption with GDP (Oberle et al. 2019; Hertwich et al. 2020). Those indicators are functions of material stock intensity of GDP (tonnes per dollar) and material intensity of building and operating accumulated in-use stock. Coupling services or GDP with the built stock allows for a better evaluation of demand for primary basic materials (Müller et al. 2011; Liu et al. 2013; Liu and Müller 2013; Pauliuk et al. 2013a; Cao et al. 2017; Wiedenhofer et al. 2019; Hertwich et al. 2020; Krausmann et al. 2020). Since 1970 material stock growth driven by industrialisation and urbanisation slightly exceeded that of GDP and there was no decoupling, 3 so in Kaya-like identities material stock may effectively replace GDP. There are different methods to estimate the former (see reviews in Pauliuk et al. (2015, 2019) and Wiedenhofer et al. (2019), the results of which are presented for major basic materials with some geographical resolution (Liu and Müller 2013; Pauliuk et al. 2013a) or globally (Graedel et al. 2011; Geyer et al. 2017; Krausmann et al. 2018; Pauliuk et al. 2019; Wiedenhofer et al. 2019; International Aluminium Institute 2021a).
For a subset of materials, such as solid wood, paper, plastics, iron/steel, aluminium, copper, other metals/minerals, concrete, asphalt, bricks, aggregate, and glass, total in-use stock escalated from 36 Gt back in 1900 to 186 Gt in 1970, 572 Gt in 2000, and 960 Gt in 2015, and by 2020 it exceeded 1,100 Gt, or 145 tonnes per capita (Krausmann et al. 2018, 2020; Wiedenhofer et al. 2019). In 1900–2019, the stock grew 31-fold, which is strongly coupled with GDP growth (36-fold). As the UK experience shows, material stock intensity of GDP may ultimately decline after services fully dominate GDP, and this allows for material productivity improvements to achieve absolute reduction in material use, as stock expansion slows down (Streeck et al. 2020). While the composition of basic materials within the stock of manufactured capital was evolving significantly, overall stock use associated with a unit of GDP has been evolving over the last half-century in a quite narrow range of 7.7–8.6 t per USD1000 (2017 purchasing power parity (PPP)) showing neither signs of decoupling from GDP, nor saturation as of yet. Mineral building materials (concrete, asphalt, bricks, aggregate, and glass) dominate the stock volume by mass (94.6% of the whole stock, with the share of concrete alone standing at 43.5%), followed by metals (3.5%) and solid wood (1.4%). The largest part of in-use stock of our ‘cementing societies’ (Cao et al. 2017) is constituted by concrete: about 417 Gt in 2015; Krausmann et al. (2018) extrapolated this to 478 Gt (65 tonnes per capita) in 2018, which contains about 88 Gt of cement. 4 The iron and steel stock is assessed at 25–35 Gt (Wiedenhofer et al. 2019; Gielen et al. 2020; Wang et al. 2021), while the plastics stock reached 2.5–3.2 Gt (Geyer et al. 2017; Wiedenhofer et al. 2019; Saygin and Gielen 2021) and the aluminium stock approached 1.1 Gt (International Aluminium Institute 2021a), or just 0.1% of the total. In sharp contrast to global energy intensity, which has more than halved since 1900 (Bashmakov 2019), in 2019 material stock intensity (in-use stock of manufactured capital per GDP) was only 14% below the 1900 level, but 15% above the 1970 level. In-use stock per capita has been growing faster than GDP per capita since 2000 (Figure 11.3). The growth rate of total in-use stock of manufactured capital was 3.8% in 1971–2000 and 3.5% in 2000–2019, or 32–35 Gt yr –1, to which concrete and aggregates contributed 88%. Recent demand for stockbuilding materials was 51–54 Gt yr –1, to which recycled materials recently contributed only about 10% of material input. About 46–49 Gt yr –1 was virgin inputs, which after accounting for processing waste and short-lived products (over 8 Gt yr –1) scale up to 54–58 Gt yr –1 of primary extraction (Krausmann et al. 2017, 2018; UNEP and IRP 2020). The above indicates that we have only begun to exploit the potential for recycling and circularity more broadly.
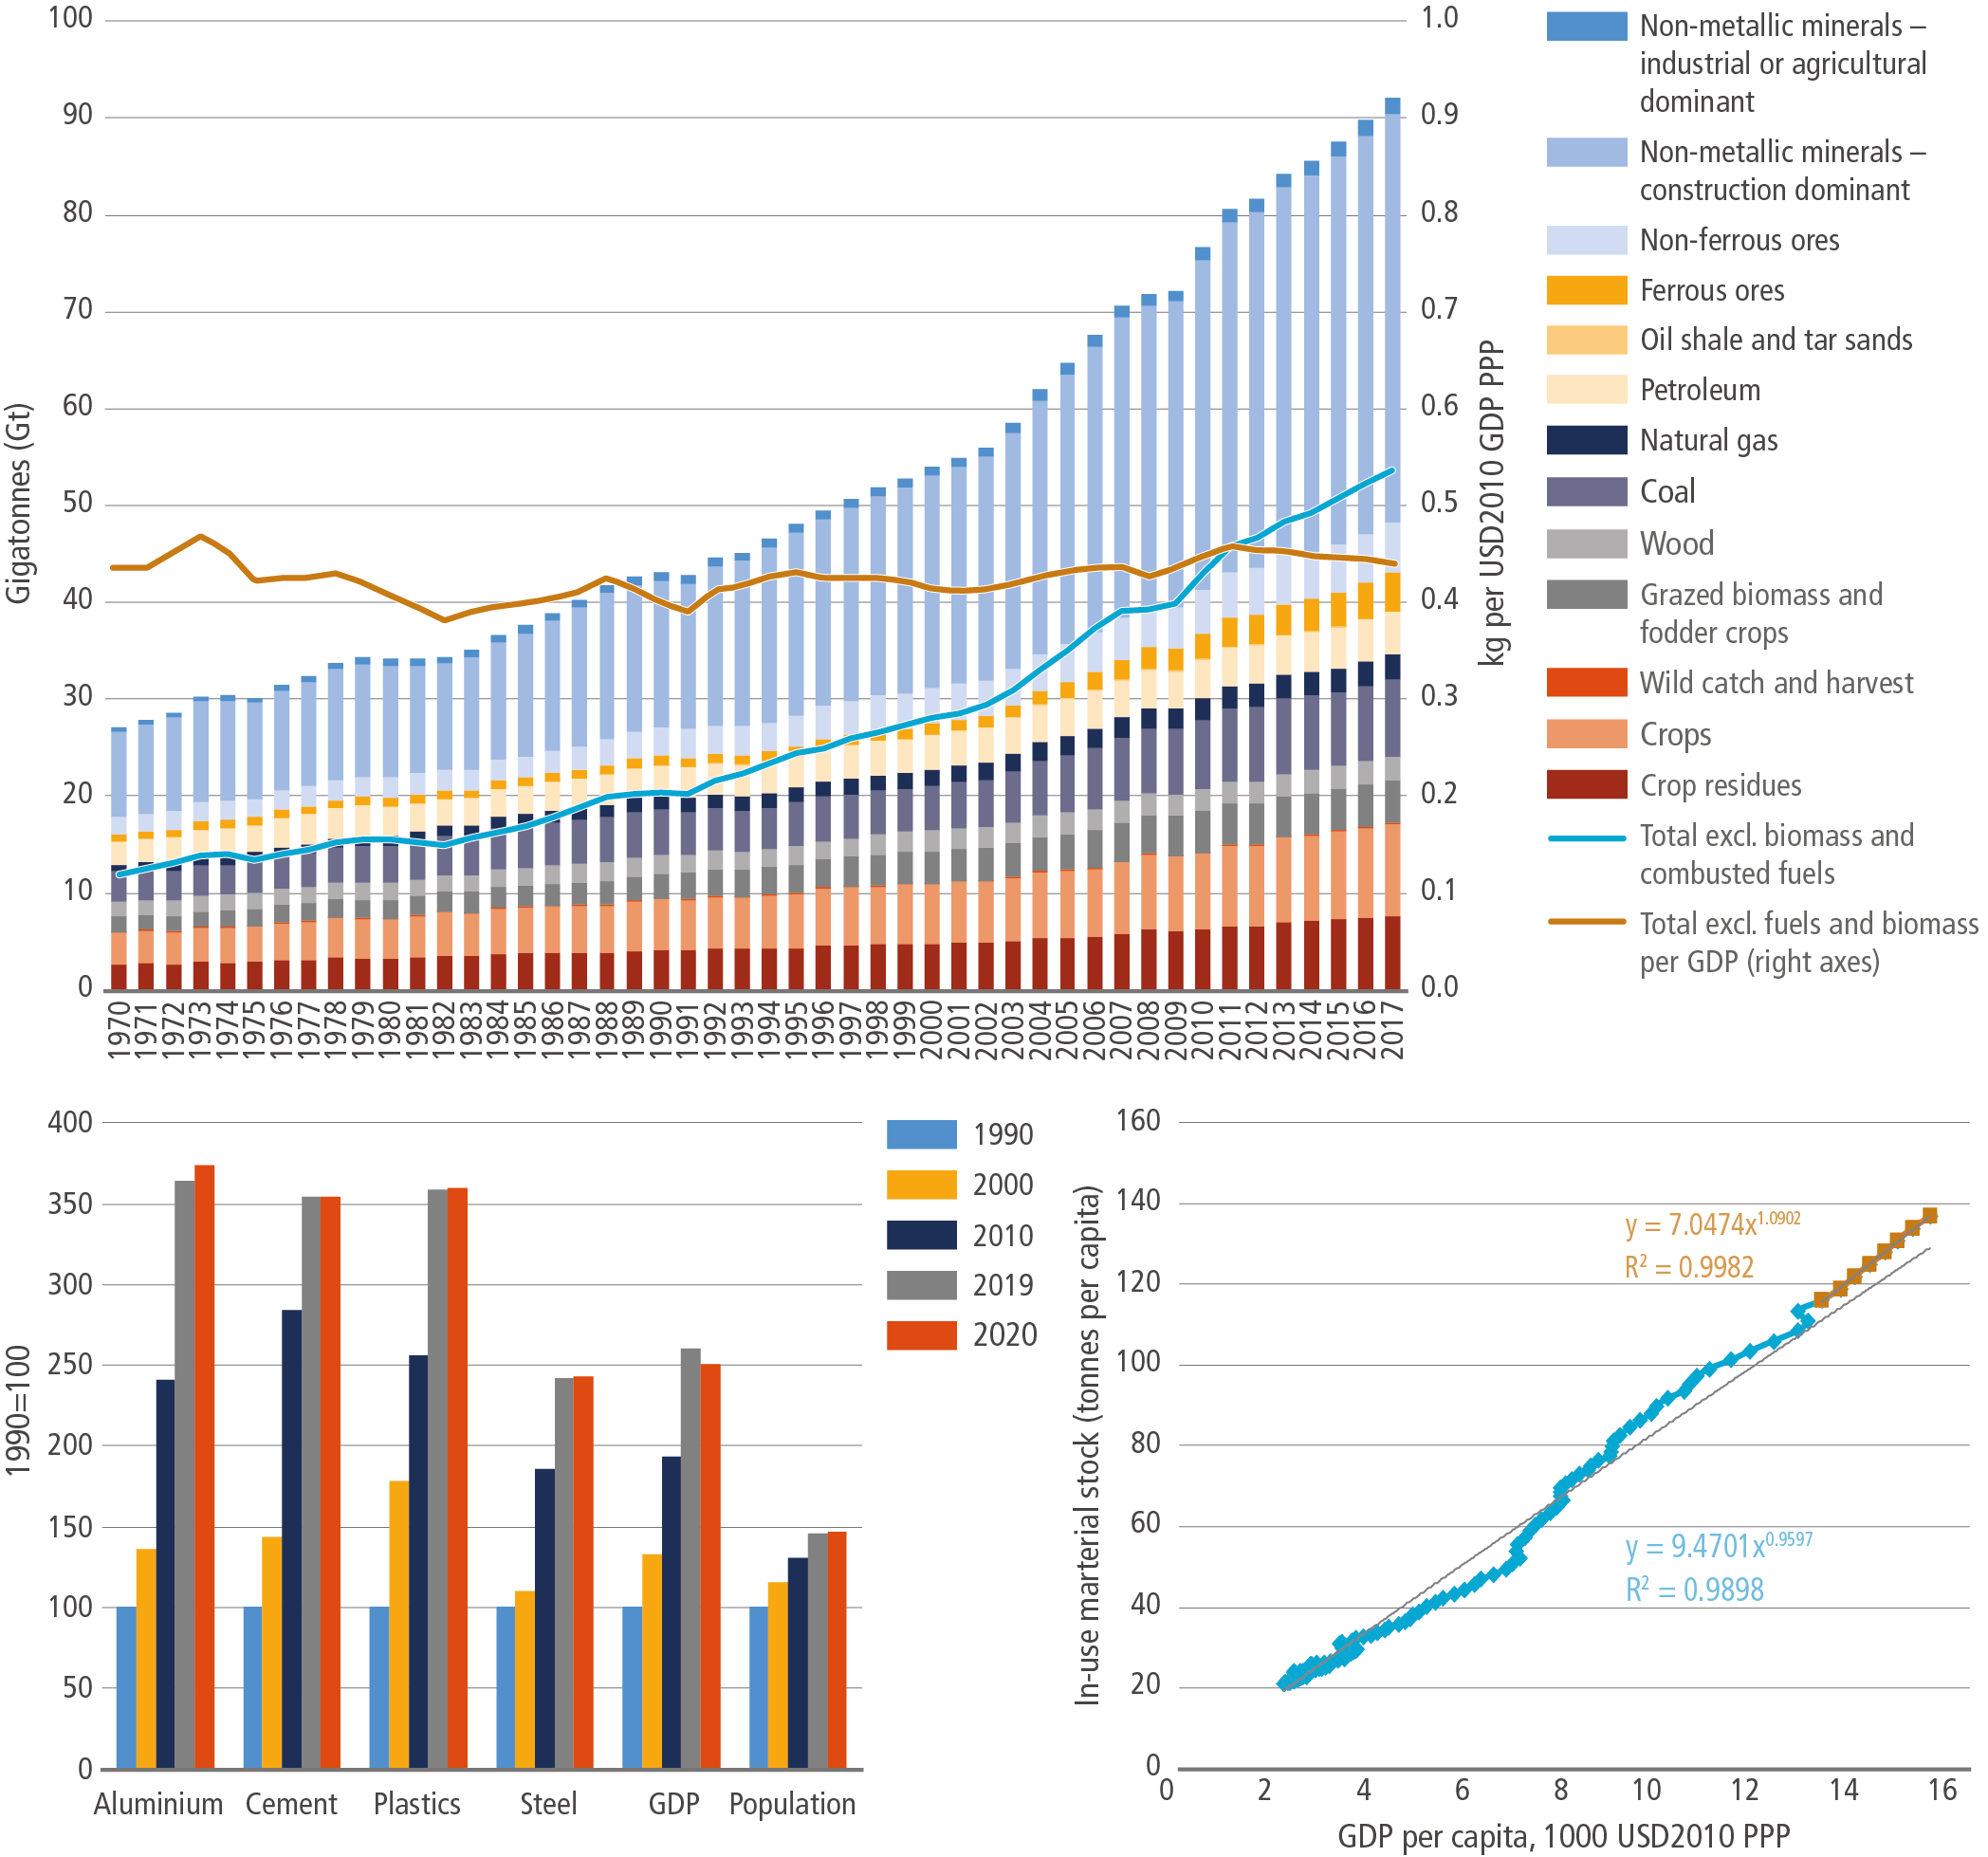
Figure 11.3 | Raw natural materials extraction since 1970. In windows: left – growth of population, GDP and basic materials production (1990 = 100) in 1990–2020; right – in-use stock per capita vs income level (1900–2018; brown dots are for 2000–2018). The regressions provided show that for more recent years elasticity of material stock to GDP was greater than unity, comparing with the lower unity in preceding years. Source: developed based on Maddison Project (2018); Wiedenhofer et al. (2019); IEA (2020b); UNEP and IRP (2020); International Aluminium Institute (2021a); Statista (2021a,b); U.S. Geological Survey (2021); World Bank (2021); World Steel Association (2021).
Total extraction of all basic materials (including biomass and fuels) in 2017 reached 92 Gt yr –1, which is 13 times above the 1900 level (Figure 11.3). 5 When recycled resources are added, total material inputs exceed 100 Gt (Circle Economy 2020). In Equation 11.1MPR represents only material inputs to the stock, excluding dissipative use – biomass (food and feed) and combusted fuels. Total extraction of stock building materials (metal ores and non-metallic minerals) in 2017 reached 55 Gt yr –1. 6 In 1970–2018, it grew 4.3-fold and the ratio of MPR to accumulated in-use capital has nearly been constant since 1990 along with ratio to GDP (Figure 11.3).
End-of-life waste from accumulated stocks along with (re)-manufacturing and construction waste is assessed at 16 Gt yr –1 in 2014 and can be extrapolated in 2018 to 19 Gt yr –1 (Krausmann et al. 2018; Wiedenhofer et al. 2019), or 1.8% from stock of manufactured capital. Less than 6 Gt yr –1 was recycled and used to build the stock (about 10% of inputs). 7 While the circularity gap is still large, and limited circularity was engineered into accumulated stocks, 8 material recycling mitigated some GHG emissions by replacing energy-intensive virgin materials. 9 When the stock saturates, in closed material loops the end-of-life materials waste has to be equal to material input, and primary production therefore has to be equal to end-of-life waste multiplied by unity minus recycling rate. When the latter grows, as the linear metabolism is replaced with the circular one, the share of primary materials production in total material input declines.
Recycling rates for metals are higher than for other materials: the end-of-life scrap input ratio for 13 metals is over 50%, and stays in the range of 25–50% for another ten, but even for metals recycling flows fail to match the required inputs (Graedel et al. 2011). Globally, despite overall recycling rates being at 85%, the all-scrap ratio for steel production in recent years stays close to 35–38% (Gielen et al. 2020; IEA 2021b) ranging from 22% in China (only 10% in 2015) to 69% in the US and to 83% in Turkey (BIR 2020). For end-of-life scrap this ratio declined from 30% in 1995–2010 to 21–25% after 2010 (Gielen et al. 2020; Wang et al. 2021).
For aluminium, the share of scrap-based production grew from 17% in 1962 to 34% in 2010 and stabilised at this level until 2019, while the share of end-of-life scrap grew from 1.5% in 1962 to nearly 20% in 2019 (International Aluminium Institute 2021a). The global recycling (mostly mechanical) rate for plastics is only 9–10%10 (Geyer et al. 2017; Saygin and Gielen 2021), and that for paper progressed from 34% in 1990 to 44% in 2000 and to over 50% in 2014–2018 (IEA 2020b).
The limited impacts of material efficiency factors on industrial GHG emissions trends reflect the lack of integration of material efficiency in energy and climate policies which partly results from the inadequacy of monitored indicators to inform policy debates and set targets; 11 lack of high-level political focus and industrial lobbying; uncoordinated policy across institutions and sequential nature of decision-making along supply chains; carbon pricing policy lock-in with upstream sectors failing to pass carbon costs on to downstream sectors (due to compensation mechanisms to reduce carbon leakage) and so have no incentives to exploit such options as light-weighting, reusing, remanufacturing, recycling, diverting scrap, extending product lives, using products more intensely, improving process yields, and substituting materials (Skelton and Allwood 2017; Gonzalez Hernandez et al. 2018b; Hilton et al. 2018). Poor progress with material efficiency is part of the reason why industrial GHG emissions are perceived as ‘hard to abate’, and many industrial low-carbon trajectories to 2050 leave up to 40% of emissions in place (Material Economics 2019; IEA 2021a). The importance of this factor activation rises as in-use material stock is expected to scale up by a factor of 2.2–2.7 to reach 2215–2720 Gt by 2050 (Krausmann et al. 2020). Material extraction in turn is expected to rise to 140–200 Gt yr –1 by 2060 (OECD 2019a; Hertwich et al. 2020) providing unsustainable pressure on climate and environment and calling for fundamental improvements in material productivity.
In 2014–2019, the average annual growth rate (AAGR) of global industrial energy use was 0.4% compared to 3.2% in 2000–2014, following new policies and trends, particularly demonstrated by China 12 (IEA 2020b,d). Whatever metric is applied, industry (coal transformation, mining, quarrying, manufacturing and construction) driven mostly by material production, dominates global energy consumption. About two fifths of energy produced globally goes to industry, directly or indirectly. Direct energy use (including energy used in coal transformation) accounts for nearly 30% of total final energy consumption. When supplemented by non-energy use, the share for the post-AR5 period (2015–2019) stands on average close to 40% of final energy consumption, and at 28.5% of primary energy use. 13 With an account of indirect energy use for the generation of power and centralised heat to be consumed in industry, the latter scales up to 37%. Industrial energy use may be split by: material production and extraction (including coal transformation): 51% on average for 2015–2019; non-energy use (mostly chemical feedstock): 22%14 ; and other energy use (equipment, machinery, food and tobacco, textiles, leather, etc.): 27%. Energy use for material production and feedstock 15 makes about three quarters (73%) of industrial energy consumption and is responsible for 77% of its increment in 2015–2019 (based on IEA 2021a).
For over a century, industrial energy efficiency improvements have partially offset growth in GHG emissions. Industrial energy use per tonne of extracted materials (ores and building materials as a proxy for materials going through the whole production chain to final products) fell by 20% in 2000–2019 and by 15% in 2010–2019, accelerated driven by high energy prices to 2.4% yr –1 in 2014–2019, matching the values observed back in 1990–2000 (Figure 11.2). Assessed per value added using market exchange rates, industrial energy intensity globally dropped by 12% in 2010–2018, after its 4% decline in 2000–2010, resulting in 2000–2018 decline by 15% (IEA 2020b,a). The 2020 COVID crisis slowed down energy intensity improvements by shifting industrial output towards more energy-intensive basic materials (IEA 2020e). Specific energy consumption per tonne of iron and steel, chemicals and cement production in 2019 was about 20% below the 2000 level (IEA 2020b,a). This progress is driven by moving towards best available technologies (BATs) for each product through new and highly efficient production facilities in China, India and elsewhere, and by the contribution from recycled scrap metals, paper and cardboard.
Physical energy intensity for the production of materials typically declines and then stabilises at the BAT level once the market is saturated, unless a transformative new technology enters the market (Gutowski et al. 2013; Crijns-Graus et al. 2020; IEA 2021a). Thus, the energy saving effect of switching to secondary used material comes to the forefront, as energy consumption per tonne for many basic primary materials approach the BATs. This highlights the need to push towards circular economy, materials efficiency, reduced demand, and fundamental process changes (e.g., towards electricity and hydrogen-based steel making). Improved recycling rates allow for a substantial reduction in energy use along the whole production chain – material extraction, production, and assembling – which is in great excess of energy used for collection, separation, treatment, and scrap recycling minus energy used for scrap landfilling. The International Energy Agency (IEA 2019b) estimates that by increasing the recycling content of fabricated metals, average specific energy consumption (SEC) for steel and aluminium may be halved by 2060. Focusing on whole systems ‘integrative design’ expands efficiency resource much beyond the sum of potentials for individual technologies. Material efficiency coupled with energy efficiency can deliver much greater savings than energy efficiency alone. Gonzalez Hernandez et al. (2018b) stress that presently about half of steel or aluminium are scrapped in production or oversized for targeted services. They show that resource efficiency expressed in exergy as a single metric for both material and energy efficiency for the global iron and steel sector is only 33%, while secondary steel-making is about twice as efficient (66%) as ore-based production (29%). While shifting globally in ore-based production from the average to the best available level can save 6.4 EJ yr –1, the saving potential of shifting to secondary steel-making is 8 EJ yr –1, and is limited mostly by scrap availability and steel quality requirements.
11.2.2New Trends in Emissions
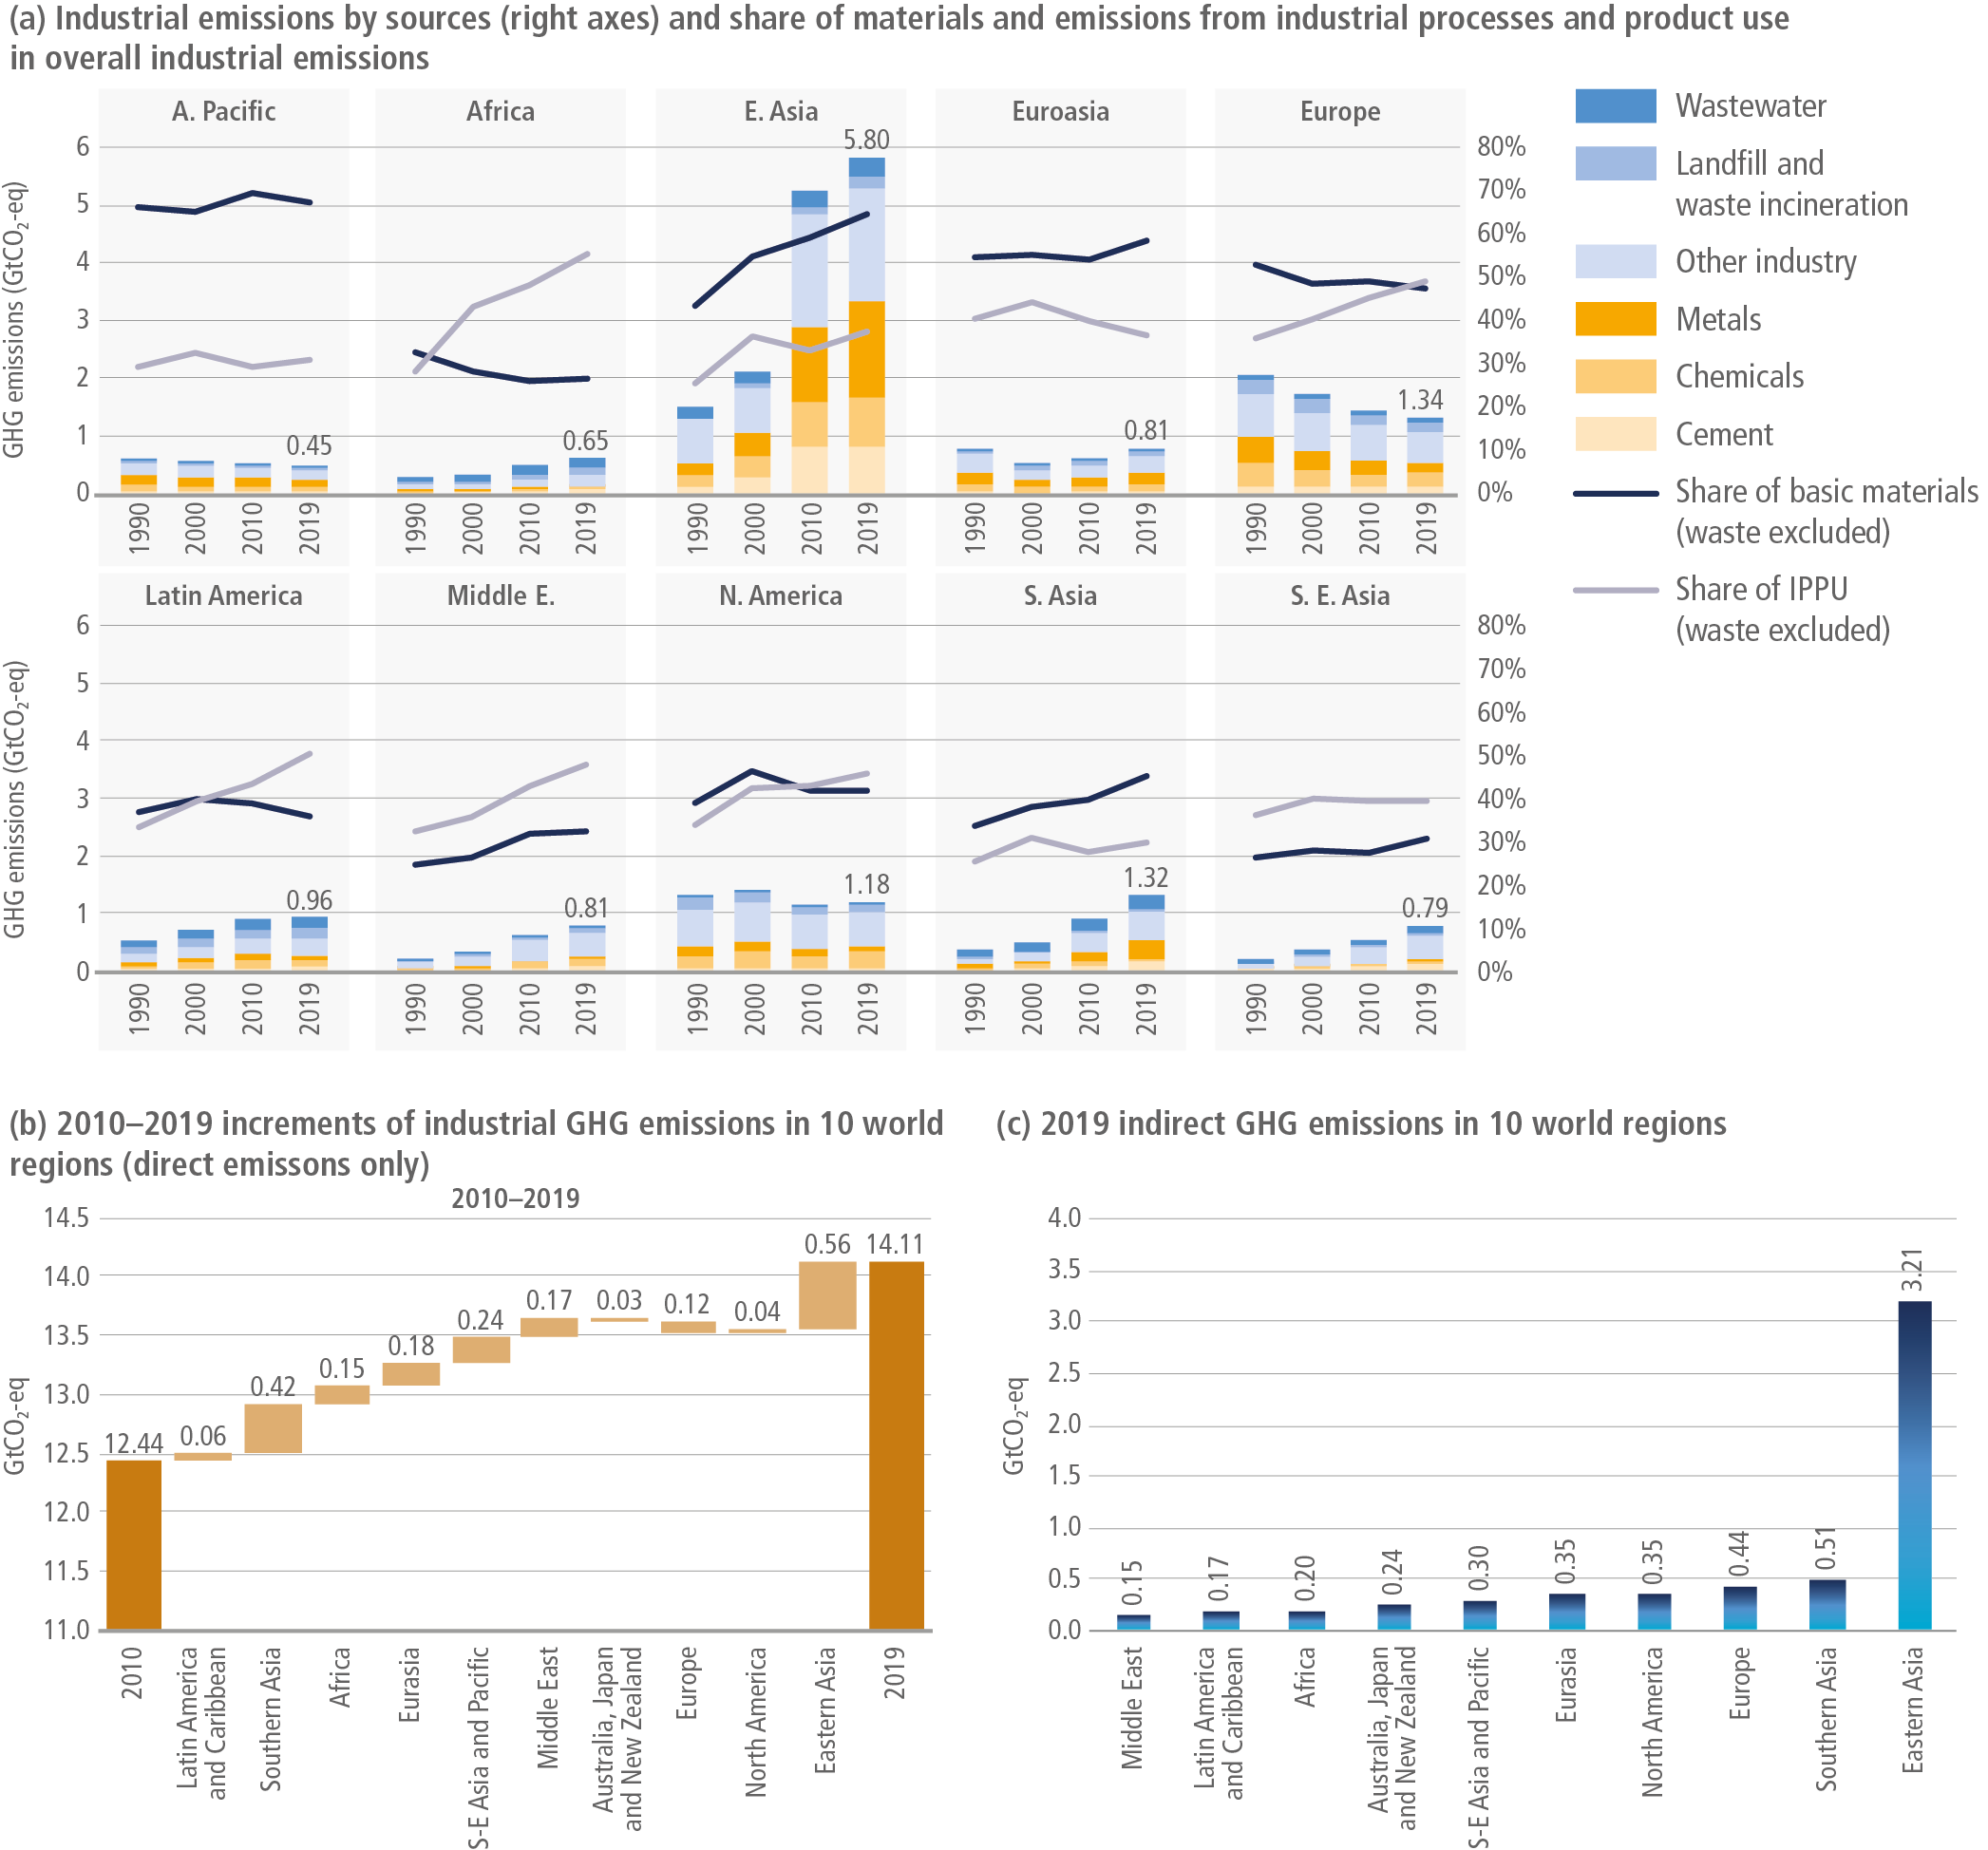
GHG emissions attributable to the industrial sector (see Chapter 2) in 2019 originate from industrial fuel combustion (7.1 GtCO2-eq directly and about 5.9 Gt indirectly from electricity and heat generation 16 ); industrial processes (4.5 GtCO2-eq) and products use (0.2 Gt), as well as from waste (2.3 Gt) (Figure 11.4a,b). Overall industrial direct GHG emissions amount to 14.1 GtCO2-eq (Figure 11.4c and Table 11.1), and scales up to 20 GtCO2-eq after indirect emissions are added, 17 putting industry (24%, direct emissions) second after the energy sector in total GHG emissions and lifting it to the leading position after indirect emissions are allocated (34% in 2019). 18 The corresponding shares for 1990–2000 were 21% for direct emissions and 30% for both direct and indirect (Crippa et al. 2021; Lamb et al. 2021; Minx et al. 2021). As the industrial sector is expected to decarbonise slower than other sectors it will keep this leading position for the coming decades (IEA 2021a). In 2000–2010, total industrial emissions grew faster (3.8% yr –1) than in any other sector (see Chapter 2), mostly due to the dynamics shown by basic materials extraction and production. Industry contributed nearly half (45%) of overall incremental global GHG emissions in the 21st century.
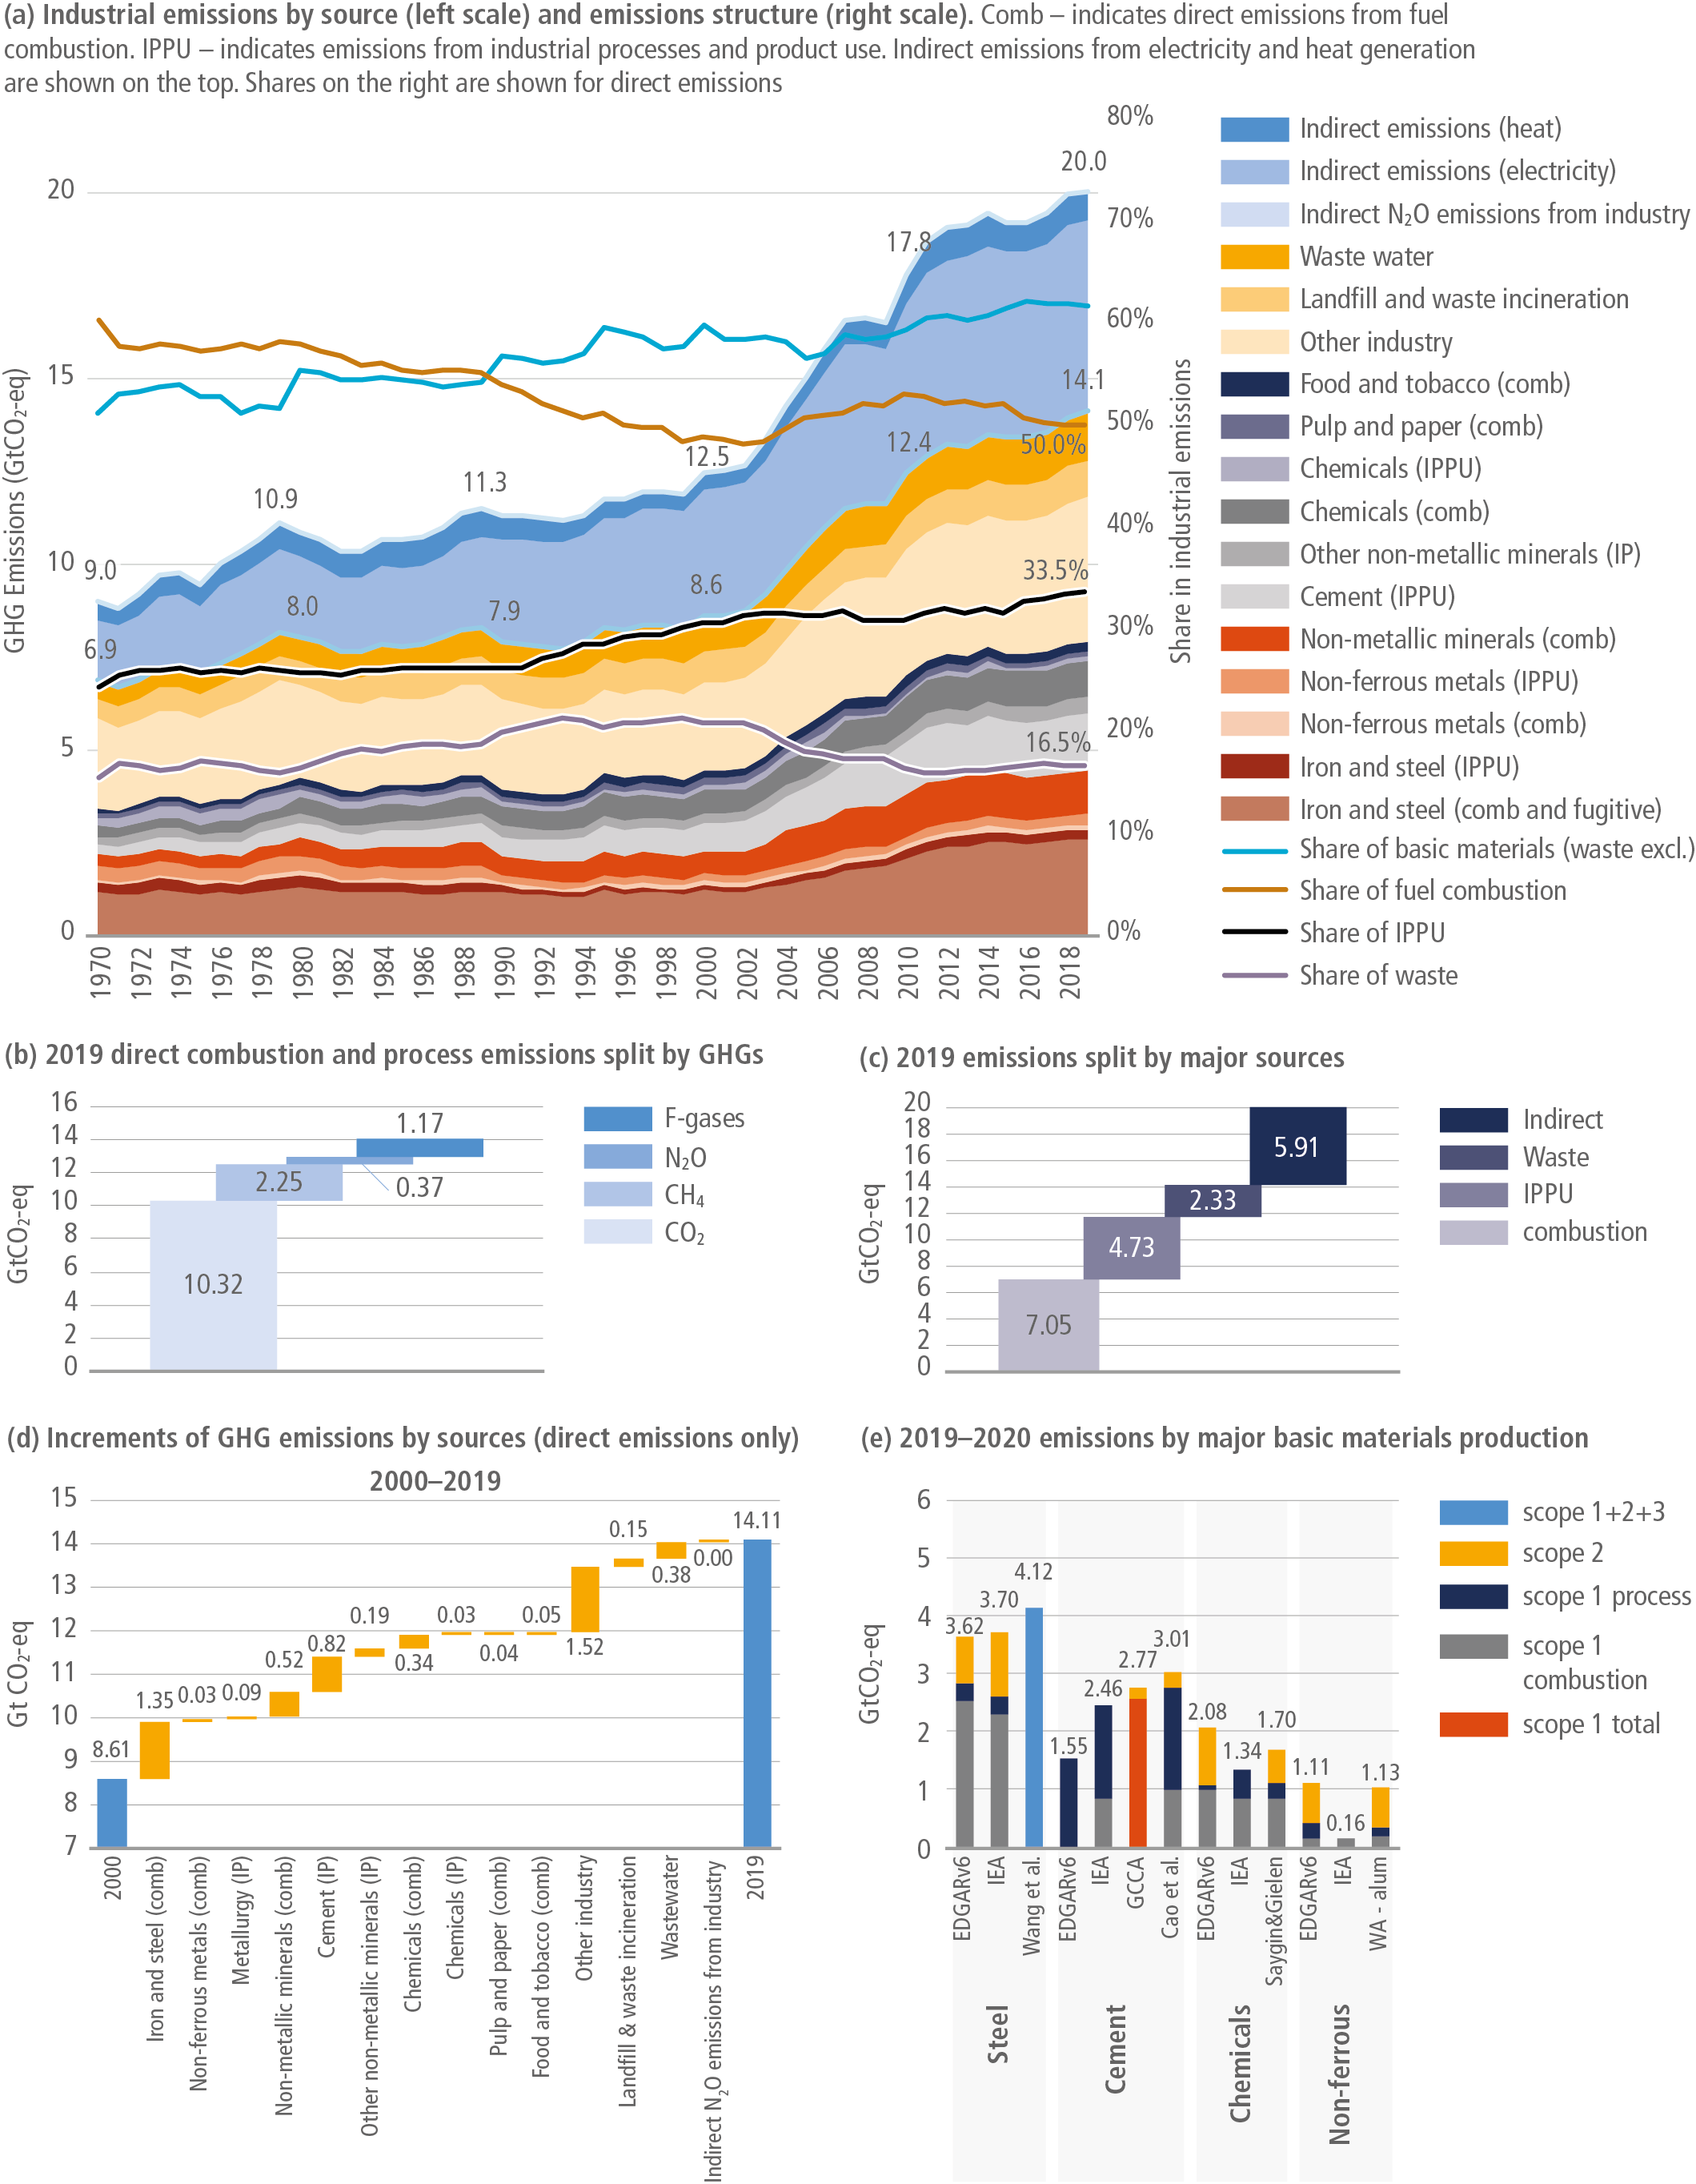
Figure 11.4 | Industrial sector direct global greenhouse gas (GHG) emissions. Source: calculated based on emissions data from Crippa et al. (2021) and Minx et al. (2021). Indirect emissions were assessed using IEA (2021b). For (e): Cao et al. (2020); IEA (2020b, 2021a); GCCA (2021a); International Aluminium Institute (2021a); and Wang et al. (2021).
Industrial sector GHG emissions accounting is complicated by carbon storage in products (Levi and Cullen 2018). About 35% of chemicals’ mass is CO2, which is emitted at use stage – decomposition of fertilisers, or plastic waste incineration (Saygin and Gielen 2021), and sinks. Recarbonation and mineralisation of alkaline industrial materials and wastes (also known as the ‘sponge effect’) provide 0.6–1 GtCO2 yr –1 uptake by cement-containing products 19 (Cao et al. 2020; Guo et al. 2021); see Section 11.3.6 for further discussion in decarbonisation context.
In 1970–1990, industrial direct combustion-related emissions were growing modestly, and in 1990–2000 even switched to a slowly declining trend, steadily losing their share in overall industrial emissions. Electrification was the major driver behind both indirect and total industrial emissions in those years. This quiet evolution was interrupted in the beginning of the 21st century, when total emissions increased by 60–68% depending on the metric applied (the fastest growth ever seen). In 2000–2019 iron, steel and cement absolute GHGs increased more than any other period in history (Bashmakov 2021). Emissions froze temporarily in 2014–2016, partly in the wake of the financial crisis, but returned to their growth trajectory in 2017–2019 (Figure 11.4a).
The largest incremental contributors to industrial emissions in 2010–2019 were industrial processes at 40%, then indirect emissions (25%), and only then direct combustion (21%), followed by waste (14%; Figure 11.4). Therefore, to stop emission growth and to switch to a zero-carbon pathway more mitigation efforts should be focused on industrial processes, product use and waste decarbonisation, along with the transition to low-carbon electrification (Hertwich et al. 2020).
Basic materials production dominates both direct industrial GHG emissions (about 62%, waste excluded)20 as well as direct industrial CO2 emissions (70%), led by iron and steel, cement, chemicals, and non-ferrous metals (Figure 11.4e). Basic materials also contribute 60% to indirect emissions. In a zero-carbon power world, with industry lagging behind in the decarbonisation of high-temperature processes and feedstock, it may replace the energy sector as the largest generator of indirect emissions embodied in capital stock. 21 According to Circle Economy (2020) and Hertwich et al. (2020), GHG emissions embodied in buildings and infrastructure, machinery and transport equipment exceed 50% of their present carbon footprint.
In 1970–2000, direct GHG emissions per unit of energy showed a steady decline interrupted by noticeable growth in 2001–2018 driven by the fast expansion of steel and cement production (Figure 11.5; IEA 2021a). Non-energy-related GHG emissions per unit of extracted materials decline continuously, as the share of not carbon intensive building materials (aggregates and sand) grows.

Figure 11.5 | Industrial sector greenhouse gas (GHG) emissions in 10 world regions (1990–2019). Source: calculated based on emissions data from Crippa et al. (2021). Indirect emissions were assessed using IEA (2021b).
|Iron and steel carbon intensity stagnated in 1995–2015 due to rapid growth in carbon-intensive production in some countries (Wang et al. 2021). For aluminium carbon intensity declined in 2010–2019 by only 2% (International Aluminium Institute 2021a). The carbon intensity of cement-making since 2010 is down by only 4%. In 1990–2019 it fell by 19.5%, mostly due to energy efficiency improvements (by 18.5%) as the carbon intensity of the fuel mix declined only by 3% (GCCA 2021b). Historical analysis shows the carbon intensity of steel production has declined with ‘stop and go’ patterns in 50–60-year cycles, reflective of the major jumps in best available technology (BAT). From 1900 to 1935 and from 1960 to 1990 specific scope 1 + 2 + 3 emissions fell by 1.5–2.5 tCO2 per tonne, or as much as needed now to achieve net zero. While historical declines were mostly due to commissioning large capacities with new technologies, with total emissions growing, by 2050 and beyond the decline will likely materialise via new ultra-low emission capacity replacements pushing absolute emissions to net zero (Bataille et al. 2021b).
11.2.3Industrial Development Patterns and Supply Chains (Regional)
The dramatic increase in industrial emissions after 2000 is clearly associated with economic growth in Asia, which dominated both absolute and incremental emissions (Figure 11.5 a,b).
More recent 2010 to 2019 trends show that regional contributions to additional emissions are distributed more evenly, while a large part still comes from Asian countries, where both rates of economic growth and the share of industrial emissions much exceed the global average. All other regions also contributed to total industrial GHG emissions. Structural shifts towards emissions from industrial processes and products use are common for many regions (Figure 11.5 a).
Economic development. Regional differences in emission trends are determined by the differences observed in economic development, trade and supply chain patterns. The major source of industrial emissions is production of energy-intensive materials, such as iron and steel, chemicals and petrochemicals, non-ferrous metals and non-metallic products. Steel and cement are key inputs to urbanisation and infrastructure development (buildings and infrastructure are responsible for about three fourths of the steel stock). Application of a ‘services-stock-flow-emissions’ perspective (Wiedenhofer et al. 2019; Bashmakov 2021; Haberl et al. 2021) shows that relationship patterns between stages of economic development, per capita stocks and flows of materials are not trivial with some clear transition points. Cao et al. (2017) mapped countries by four progressive stages in cement stock per capita S-shape evolution as a function of income and urbanisation: initial stage for developing countries with a low level and slow linear growth; take-off stage with accelerated growth; slowdown stage; and finally a shrinking stage (represented by just a few countries with very high incomes exceeding 40,000 USD2010 per capita) and urbanisation levels above 80%. Bleischwitz et al. (2018) use a similar approach with five stages to study material saturation effects for apparent consumption and stocks per capita for steel, cement, aluminium, and copper. This logic may be generalised to other materials from which in-use stock is built. While globally cement in-use stock is about 12 tonnes per capita, in developed countries it is 15–30 tonnes per capita, but the order of magnitude is lower in developing states with high per capita escalation rates (Cao et al. 2017). When stocks for some materials saturate – per capita stock peaks – the ‘scrap age’ is coming (Pauliuk et al. 2013a). Steel in-use stock has already saturated in advanced economies at 14 ± 2 tonnes per capita due to largely completed urbanisation and infrastructure developments, and a switch towards services-dominated economy. This saturation level is three to four times that of the present global average, which is below 4 tonnes per capita (Pauliuk et al. 2013a; Graedel et al. 2011; Wiedenhofer et al. 2019). China is entering the maturing stage of steel and cement consumption, resulting in a moderate projection of additional demand followed by expected industrial emissions peaking in the next 10 to 15 years (Zhou et al. 2013; Bleischwitz et al. 2018; OECD 2019a; Wu et al. 2019; Zhou et al. 2020). But many developing countries are still urbanising, and the growing need for infrastructure services results in additional demand for steel and cement. Materials intensity of the global economy is projected by OECD (2019a) to decline at 1.3% yr –1 until 2060, driven by improving resource efficiency and the switch to circular economy, but with a projected tripling of global GDP it means a doubling of projected materials use (OECD 2019a). Under the business-as-usual scenario, India’s demand for steel may more than quadruple over the next 30 years (de la Rue du Can et al. 2019; Dhar et al. 2020). In the IEA (2021a) net-zero-energy scenario, the saturation effect along with material efficiency counterbalances activity effects and keeps demand growth for basic materials modest while escalate demand for critical materials (copper, lithium, nickel, graphite, cobalt and others).
International trade and supply chain. In Equation 11.1 the share of allocated emissions (Dm) equals unity when territorial emission is considered, and to the ratio of domestically used materials to total material production for consumption-based emission accounting. Tracking consumption-based emissions provides additional insights in the global effectiveness of national climate policies. Carbon emissions embodied in international trade are estimated to account for 20–30% of global carbon emissions (Meng et al. 2018; OECD.Stat 2019) and are the reason for different emissions patterns of OECD versus non-OECD countries (Chapter 2).
Based on OECD.Stat (2019) datasets, 2015 CO2 emissions embodied in internationally traded industrial products (manufacturing and mining, excluding fuels) by all countries are assessed at 3 GtCO2, or 30% of direct CO2 emissions in the industrial sector as reported by Crippa et al. (2021). OECD countries collectively have reduced territorial emissions (shares of basic materials in direct emissions in those regions decline (Figure 11.5 b), but demonstrated no progress in reducing outsourced emissions embedded in imported industrial products (Arto and Dietzenbacher 2014; OECD.Stat 2019). Accounting for net carbon emissions embodied in international trade of only industrial products (1283 million tCO2 in 2015) escalates direct OECD industrial CO2 emissions (1333 million tCO2 of energy-related and 502 million tCO2 of industrial processes) 1.7 fold, 2.3-fold for the US, 1.5-fold for the EU, and more than triples it for the UK, while cutting (Dm) by a third for China and Russia (OECD.Stat 2019; IEA 2020f). In most OECD economies, the amount of CO2 embodied in net import from non-OECD countries is equal to, or even greater than, the size of their Paris 2030 emissions reduction commitments. In the UK, the Parliament Committee on Energy and Climate Change requested that a consumption-based inventory be complementarily used to assess the effectiveness of domestic climate policy in delivering absolute global emissions reductions (Barrett et al. 2013; UKCCC 2019a). It should be noted that the other side of the coin is that exports from countries with lower production carbon intensities can lead to overall less emissions than if production took place in countries with high carbon intensities, which may become critical in the global evolution toward lower emissions. The evolution of Dm to the date was driven mostly by factors other than carbon regulation often equipped with carbon leakage prevention tools. Empirical tests have failed to date to detect meaningful ‘carbon leakage’ and impacts of carbon prices on net import, direct foreign investments, volumes of production, value added, employment, profits, and innovation in industry (Sartor 2013; Branger et al. 2016; Saussay and Sato 2018; Ellis et al. 2019; Naegele and Zaklan 2019; Acworth et al. 2020; Carratù et al. 2020; Pyrka et al. 2020; Zachmann and McWilliams 2020). In the coming years, availability of large low-cost renewable electricity potential and cheap hydrogen may become a new driver for relocation of such carbon intensive industries as steel production (Bataille 2020a; Gielen et al. 2020; Bataille et al. 2021a; Saygin and Gielen 2021).
11.3Technological Developments and Options
The following overview of technical developments and mitigation options which relate to the industrial sector is organised in six equally important strategies: (i) demand for materials, (ii) materials efficiency, (iii) circular economy and industrial waste, (iv) energy efficiency, (v) electrification and fuel switching, and (vi) CCUS, feedstock and biogenic carbon. Each strategy is described in detail, followed by a discussion of possible overlaps and interactions between strategies and how conflicts and synergies can be addressed through integration of the approaches.
11.3.1Demand for Materials
Demand for materials is a key driver of energy consumption and CO2 emissions in the industrial sector. Rapid growth in material demand over the last quarter century has seen demand for key energy-intensive materials increase 2.5- to 3.5-fold (Figure 11.6), with growth linked to, and often exceeding, population growth and economic development. The International Energy Agency (IEA) explains, ‘as economies develop, urbanise, consume more goods and build up their infrastructure, material demand per capita tends to increase considerably. Once industrialised, an economy’s material demand may level off and perhaps even begin to decline’ (IEA 2019b).
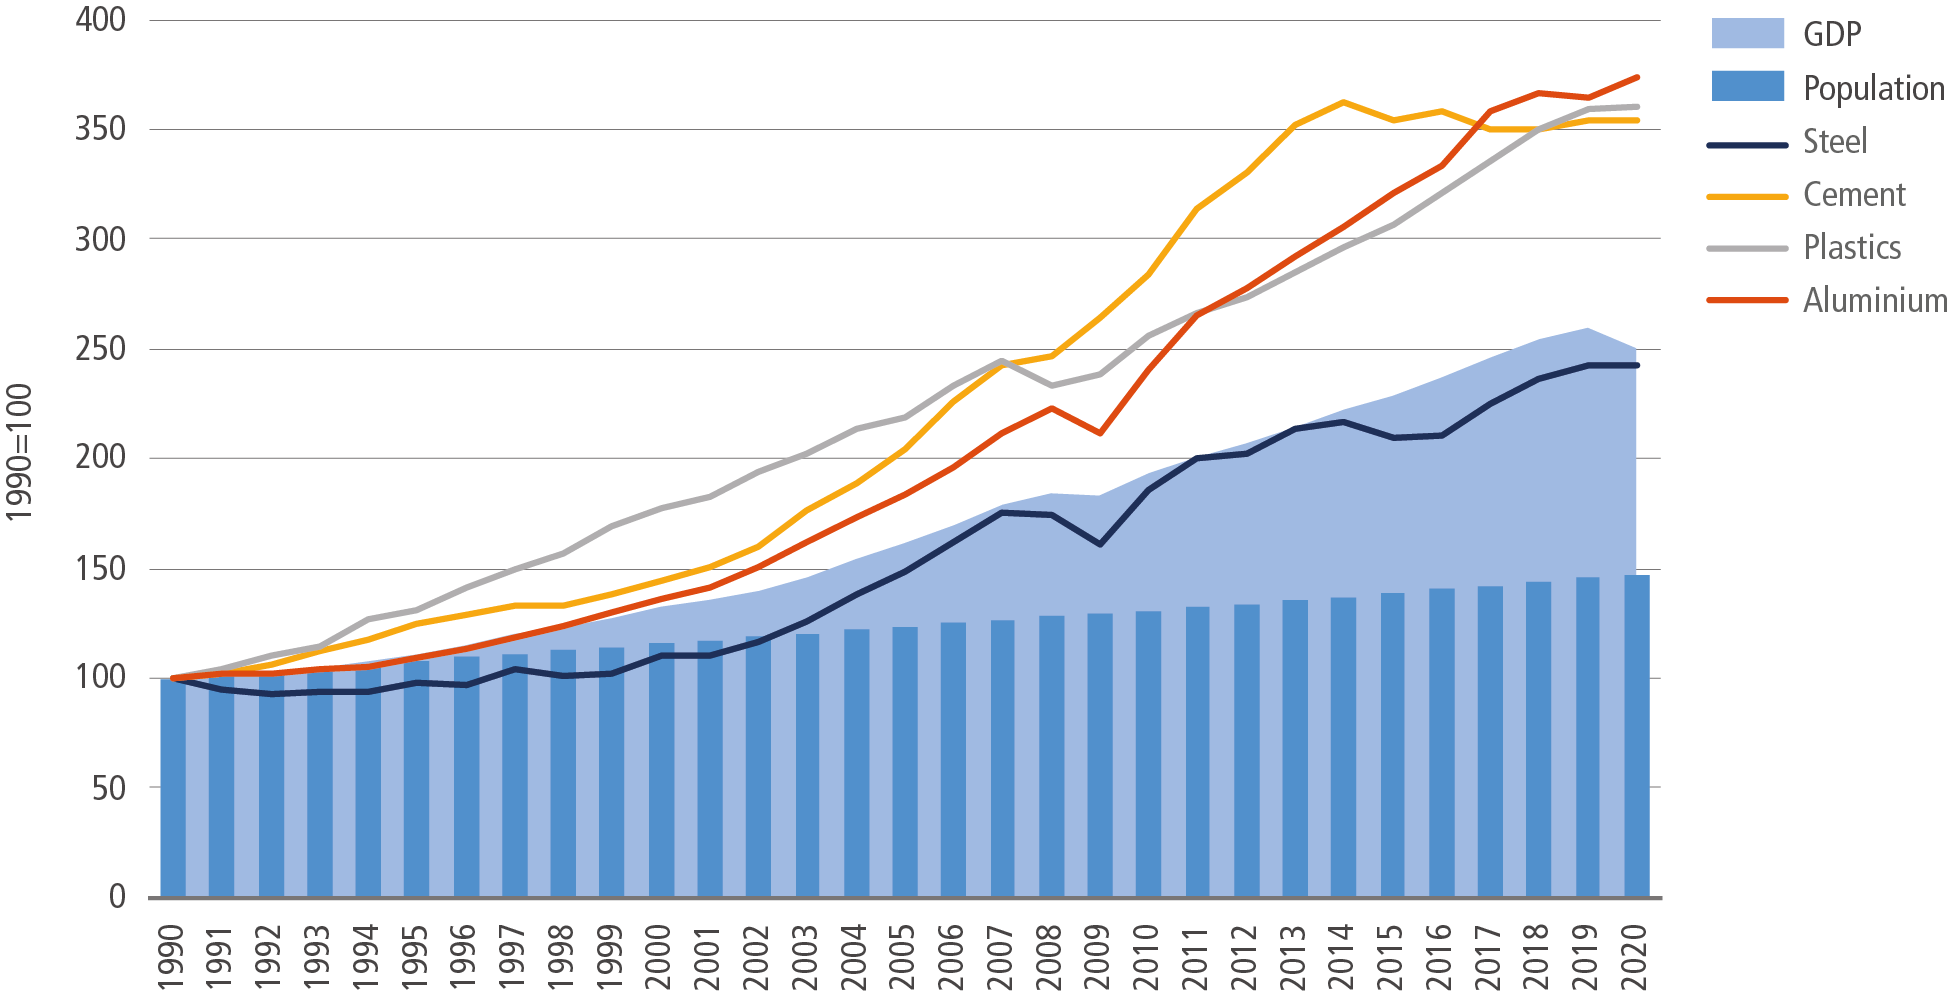
Figure 11.6 | Growth in global demand for selected key materials and global population, 1990–2019. Notes: based on global values, shown indexed to 1990 levels (=100). Steel refers to crude steel production. Aluminium refers to primary aluminium production. Plastic refers to the production of a subset of key thermoplastic resins. Cement and concrete follow similar demand patterns. Sources: 1990–2018: IEA (2020b). 2019–2020: GCCA (2021a); International Aluminium Institute (2021a); Statista (2021b); U.S. Geological Survey (2021); World Bank (2021); World Steel Association (2021).
The Kaya-like identity presented earlier in the chapter (Equation 11.1) suggests that material demand can be decoupled from population and economic development by two means: (i) reducing the accumulated material stock (MStock) used to deliver material services; and (ii) reducing the material (MPR+MSE) required to maintain material stocks (MStock). Such material demand reduction strategies are linked upstream to material efficiency strategies (the delivery of goods and services with less material demand, and thus energy and emissions) and to demand reduction behaviours, through concepts such as sufficiency, sustainable consumption and social practice theory (Spangenberg and Lorek 2019). Materials demand can also be influenced through urban planning, building codes and related socio-cultural norms that shape the overall demand for square metres per capita of floor space, mobility and transport infrastructures (Chapter 5).
Modelling suggests that per capita material stocks saturate (level off) in developed countries and decouple from GDP. Pauliuk et al. (2013b) demonstrated this saturation effect in an analysis of in-use steel stocks in 200 countries, showing that per capita steel in stocks in countries with a long industrial history (e.g., USA, UK, Germany) had saturation levels between 11 and 16 tonnes. More recently, Bleischwitz et al. (2018) confirmed the occurrence of a saturation effect for four materials (steel, cement, aluminium and copper) in four industrialised countries (Germany, Japan, UK and USA) together with China. These findings have led to the revision of some material demand forecasts, which previously had been based solely on population and economic trends.
The saturation effect for material stocks is critical for managing material demand in developed countries. Materials are required to meet demand for the creation of new stocks and the maintenance of existing stocks (Gutowski et al. 2017). Once saturation is attained the need for new stocks is minimised, and materials are only required for replacing old stocks and maintenance. Saturation allows material efficiency strategies (such as light-weight design, longer lifetimes, and more intense use) to reduce the required per capita level of material stocks, and material circularity strategies (closing material loops through remanufacture, reuse and recycling) to lessen the energy and carbon impacts required to maintain the material stock. However, it should be noted that some materials still show little evidence of saturation (i.e., plastics, see Box 11.2). Furthermore, meeting climate change targets in developed countries will require the construction of new low-carbon infrastructures (i.e., renewable energy generation, new energy distribution and storage systems, electric vehicles and building heating systems) which may increase demand for emissions intensive materials (i.e., steel, concrete and glass).
For developing countries, who are still far from saturation levels, strong growth for new products and the creation of new infrastructure capacity may still drive global material demand. However, there is an expectation that economic development can be achieved at lower per capita material stock levels, based on the careful deployment of material efficiency and circularity by design (Grubler et al. 2018).
11.3.2Material Efficiency
Material efficiency (ME) – the delivery of goods and services with less material – is increasingly seen as an important strategy for reducing GHG emissions in industry (IEA 2017, 2019b). Options to improve ME exist at every stage in the lifecycle of materials and products, as shown in Figure 11.7. This includes: designing products which are lighter, optimising to maintain the end-use service while minimising material use, designing for circular principles (i.e., longer life, reusability, repairability, and ease of high-quality recycling); pushing manufacturing and fabrication process to use materials and energy more efficiently and recover material wastes; increasing the capacity, intensity of use, and lifetimes of product in use; improving the recovery of materials at the end of life, through improved remanufacturing, reuse and recycling processes. For more specific examples see Allwood et al. (2012); Lovins (2018); Hertwich et al. (2019); Scott et al. (2019); and Rissman et al. (2020).
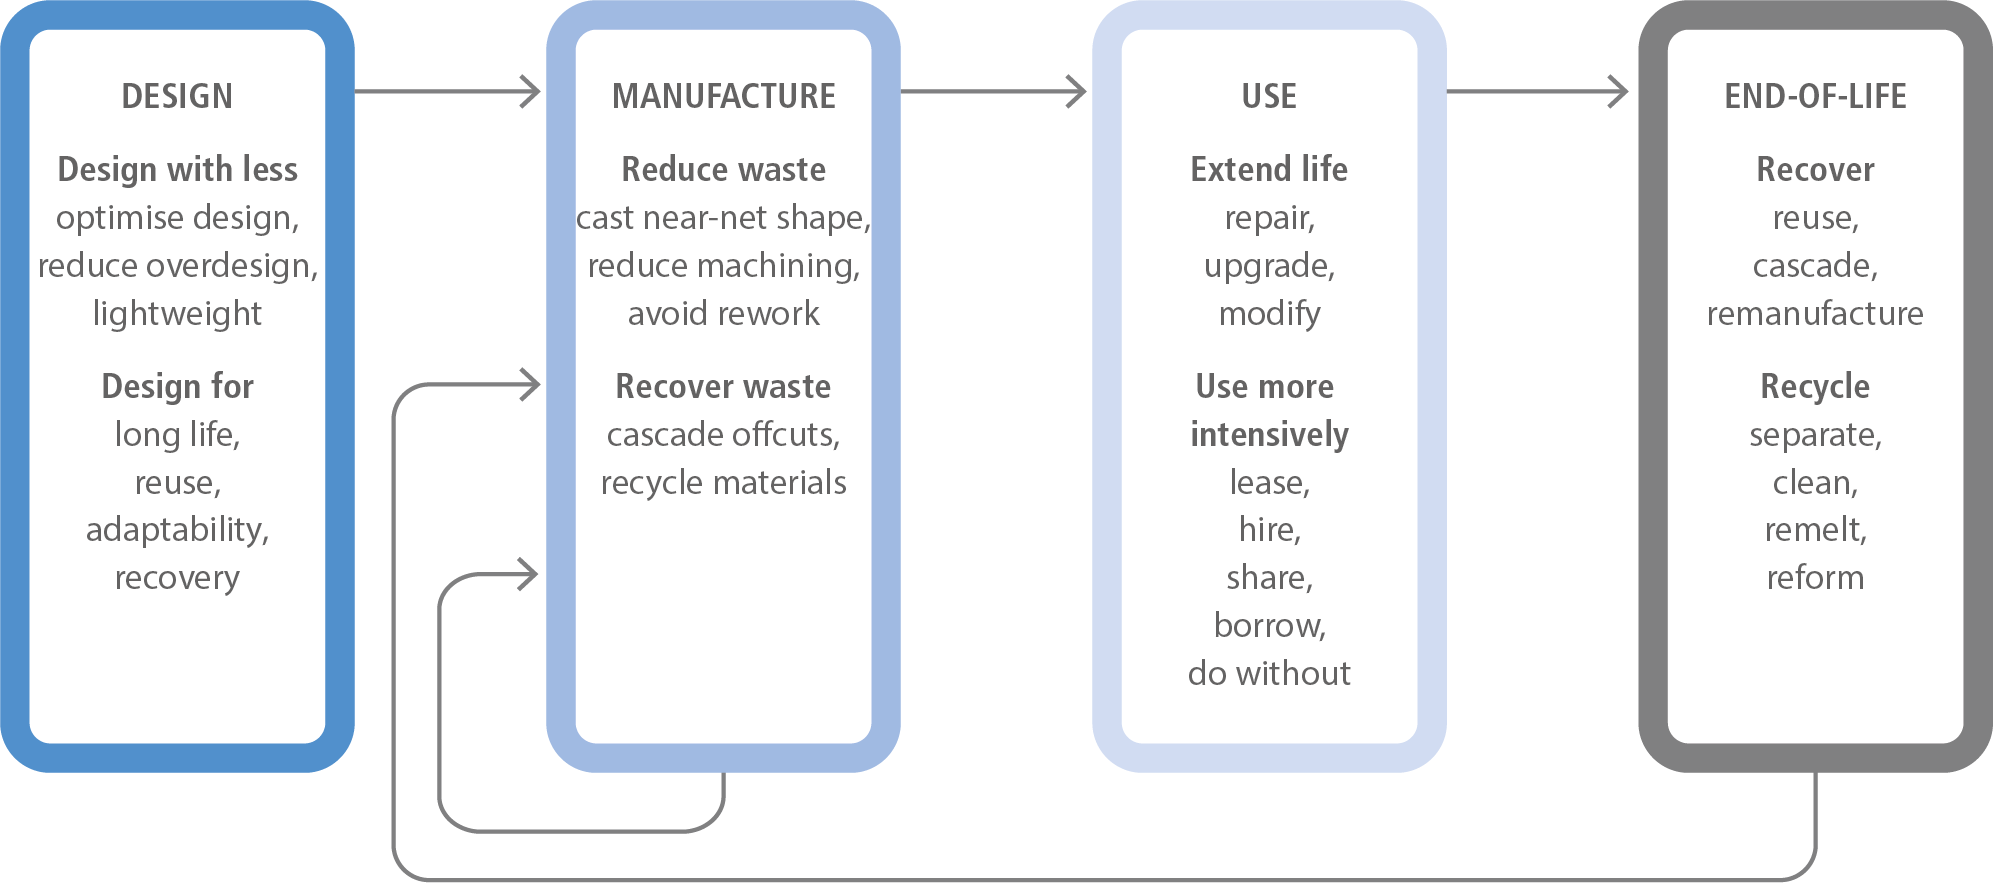
Figure 11.7 | Material efficiency (ME) strategies across the value chain. Source: derived from strategies in Allwood et al. (2012).
ME provides plentiful options to reduce emissions, yet because interventions are dispersed across supply chains and span many different stakeholders, this makes assessing mitigation potentials and costs more challenging. For this reason, ME interventions have traditionally been under-represented in climate change scenario modelling and integrated assessment models (IAMs) (Grubler et al. 2018; Allwood 2018). However, two advances in the modelling of materials flows have underpinned the recent emergence of ME options being included in climate scenario modelling.
Firstly, over many years, the academic community has built up detailed global material-flow maps of the processing steps involved in making energy-intensive materials. Some prominent recent examples include: steel (Gonzalez Hernandez et al. 2018b), pulp and paper (Van Ewijk et al. 2018), petrochemicals (Levi and Cullen 2018). In addition, material-flow maps at the regional and sectoral levels have flourished, for example: steel (Serrenho et al. 2016) and cement (Shanks et al. 2019) in the UK; automotive sheet-metal (Horton et al. 2019); and steel-powder applications (Azevedo et al. 2018). The detailed and transparent physical mapping of material supply chains in this manner enables ME interventions to be traced back to where emissions are released, and allows these options to be compared against decarbonisation and traditional energy efficiency measures (Levi and Cullen 2018). For example, a recent analysis by Hertwich et al. (2019) makes the link between ME strategies and reducing GHG emissions in buildings, vehicles and electronics, while Gonzalez Hernandez et al. (2018a) examines leveraging ME as a climate strategy in European Union (EU) policy. Research to explore the combined analysis of materials and energy, using exergy analysis (for steel: Gonzalez Hernandez et al. 2018b) allows promising comparisons across industrial sectors.
Secondly, many ME interventions result in immediate GHG emissions savings (short-term), for example, light-weighting products, reusing today’s product components, and improving manufacturing yields. Yet, for other ME actions emissions savings are delayed temporally (long-term). For example, designing a product for future reuse, or with a longer life, only reaps emissions savings at the end of the product life, when emissions for a replacement product are avoided. Many durable products have long lifetimes (cars >10 years, buildings >40 years) which requires dynamic modelling of material stocks, over time, to enable these actions to be included in scenario modelling activities. Consequently, much effort has been invested recently to model material stocks in use, to estimate their lifetimes, and anticipate the future waste and replenishment materials to maintain existing stocks and grow the material stock base. Dynamic material models have been applied to material and product sectors, at the country and global level. These include, for example: vehicles stocks in the UK (Serrenho et al. 2017; Craglia and Cullen 2020) and in China (Liu et al. 2020); buildings stocks in the UK (Cabrera Serrenho et al. 2019), China (Hong et al. 2016; Cao et al. 2018, 2019) and the European Union (Sandberg et al. 2016); electronic equipment in Switzerland (Thiébaud et al. 2017); specific material stocks, such as cement (Cao et al. 2020, 2017), construction materials (Sverdrup et al. 2017; Habert et al. 2020), plastics (Geyer et al. 2017), copper (Daehn et al. 2017), and all metals (Elshkaki et al. 2018); all materials in China (Jiang et al. 2019), Switzerland (Heeren and Hellweg 2019) and the world (Krausmann et al. 2017).
These two advances in the knowledge base have allowed the initial inclusion of some ME strategies in energy and climate change scenario models. The International Energy Agency (IEA) first created a ME scenario (MES) in 2015, with an estimated 17% reduction in industrial energy demand in 2040 (IEA 2015). The World Energy Outlook report includes a dedicated sub-chapter with calculations explicitly on industrial material efficiency (IEA 2019c). They also include ME options in their modelling frameworks and reporting, for example for petrochemicals (IEA 2018a), and in the Material Efficiency in Clean Energy Transitions report (IEA 2019b). In Grubler et al. (2018) 1.5°C Low Energy Demand (LED) scenario, global material output decreases by 20% from today, by 2050, with one-third due to dematerialisation, and two-thirds due to ME, resulting in significant emissions savings. Material Economics’ analysis of Industrial Transformation 2050 (Material Economics 2019), found that resource efficiency and circular economy measures (i.e., ME) could almost halve the 530 MtCO2 yr –1 emitted by the basic materials sectors in the EU by 2050. Finally, the Emissions Gap Report, UNEP (2019) includes an assessment of potential material efficiency savings in residential buildings and cars.
Clearly, more work is required to fully integrate ME strategies into mainstream climate change models and future scenarios. Efforts are focused on endogenising ME strategies within climate change modelling, assessing the synergies and trade-offs which exist between energy efficiency and ME interventions, and building up data for the assessment of emissions saved and the cost of mitigation from real ME actions. This requires analysts to work in cross-disciplinary teams and to engage with stakeholders from across the full breadth of material supply chains. Efforts should be prioritised to foster engagement between the IAM community and emerging ME models based in the Life Cycle Assessment, Resource Efficiency, and Industrial Ecology communities (see also Sharmina et al. 2021).
11.3.3Circular Economy and Industrial Waste
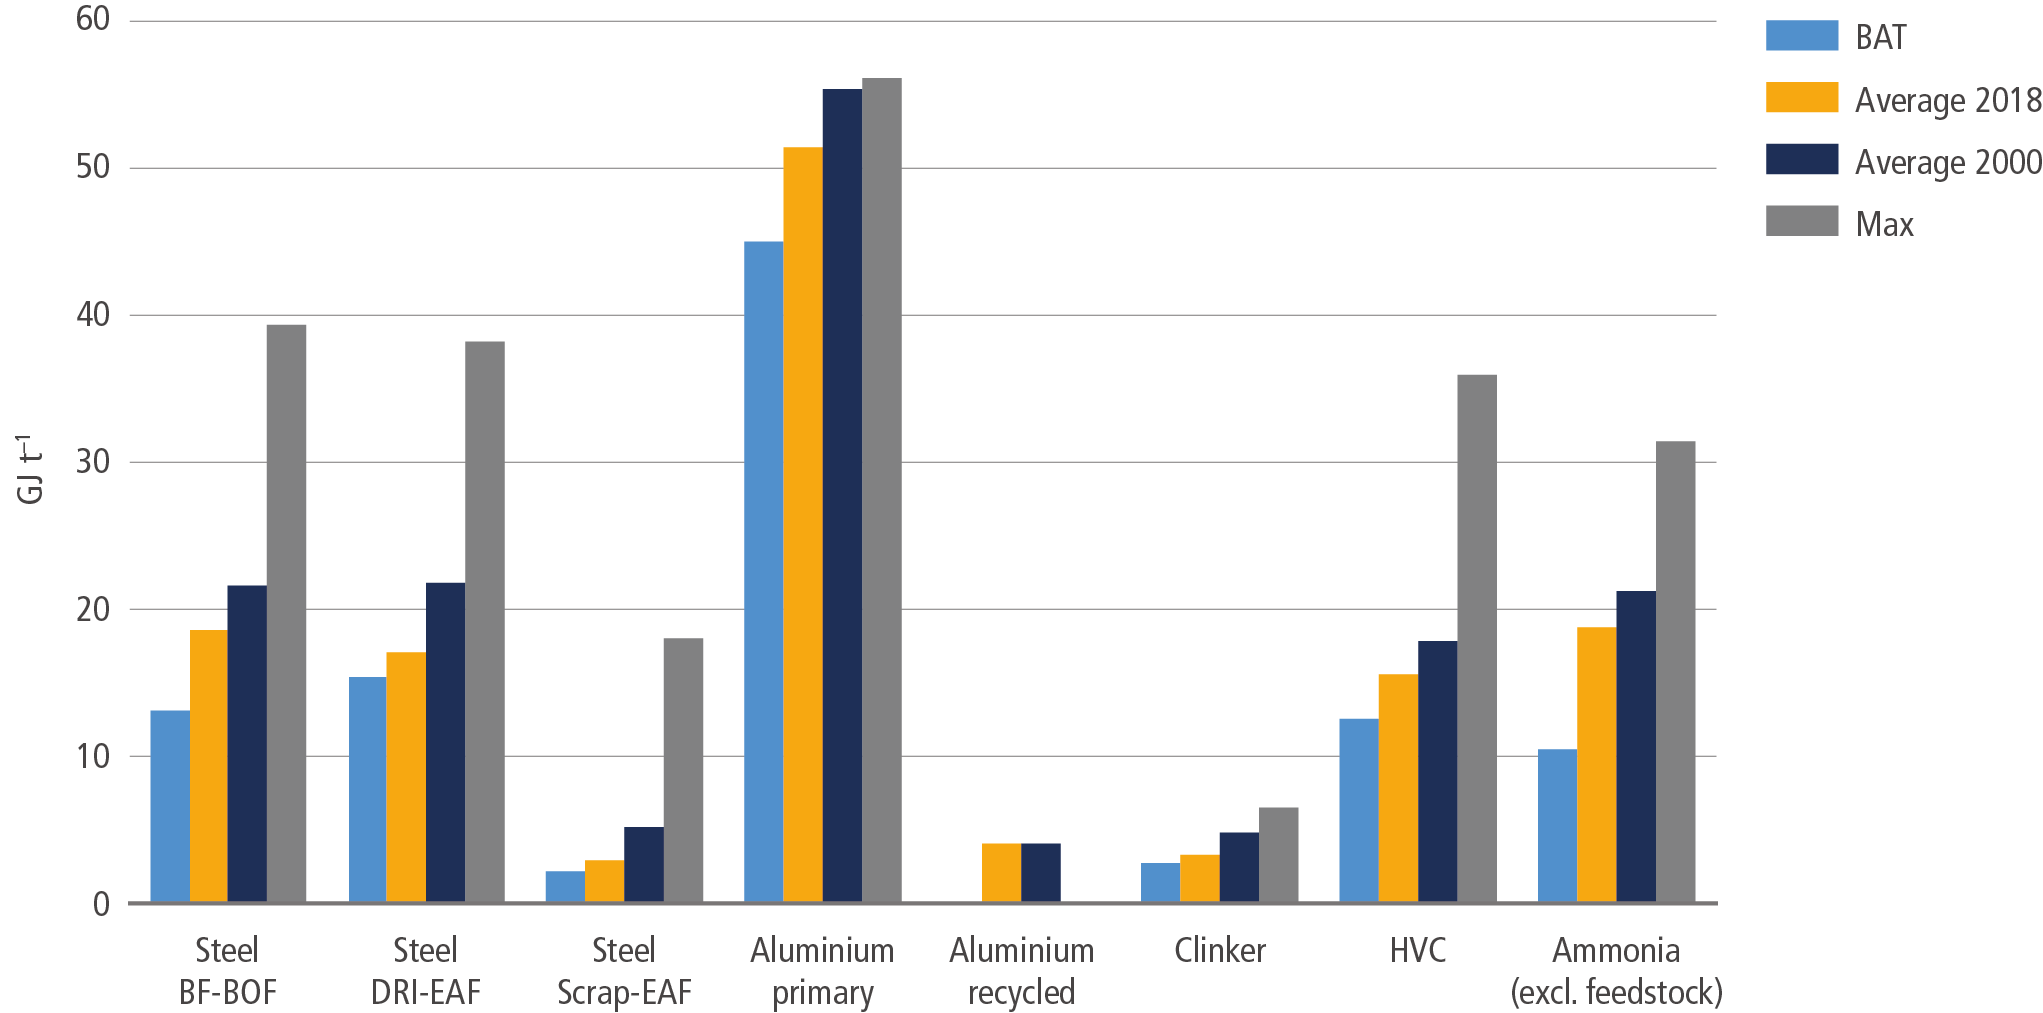
Circular economy (CE) is another effective approach to mitigate industrial GHG emissions and has been widely promoted worldwide since the fourth IPCC assessment report (AR4). From an industrial point of view, CE focuses on closing the loop for materials and energy flows by incorporating policies and strategies for more efficient energy, materials and water consumption, while emitting minimal waste to the environment (Geng et al. 2013). Moving away from a linear mode of production (sometimes referred to as an ‘extract-produce-use-discard’ model), CE promotes the design of durable goods that can be easily repaired, with components that can be reused, remanufactured, and recycled (Wiebe et al. 2019). In particular, since CE promotes reduction, reuse and recycling, a large amount of energy and GHG-intense virgin material processing can be reduced, leading to significant carbon emission reductions. For example, in the case of aluminium, the energy efficiency of primary production is relatively close to best available technology (Figure 11.8), while switching to production using recycled materials requires only about 5% as much energy (Section 11.4.1.4). However, careful evaluation is needed from a lifecycle perspective since some recycling activities may be energy- and emission-intensive, for example, the chemical recycling of plastics (Section 11.4.1.3).

Figure 11.8 | Energy efficiency indicators for basic material production. Energy accounting is based on final energy use. Sectoral boundaries for steel are as defined in IEA (2020c).Sources: calculated based on UNIDO (2010); Saygin et al. (2011); Hasanbeigi et al. (2012); Moya and Pardo (2013); Napp et al. (2014); WBCSD (2016); IEA (2017, 2018b); IEA and WBCSD (2018); IEA (2019b, 2020c); Crijns-Graus et al. (2020); IEA (2020b); International Aluminium Institute (2020).
As one systemic approach, CE can be seen as conducted at different levels, namely, at the micro level (within a single company, such as process integration and cleaner production), meso level (between three or more companies, such as industrial symbiosis or eco‐industrial parks) and macro level (cross‐sectoral cooperation, such as urban symbiosis or a regional eco‐industrial network). Each level requires different tools and policies, such as CE-oriented incentive and tax policies (macro level), and eco-design regulations (micro level). This section is focused on industry and a broader discussion of the CE concept is found in Box 12.2 and Section 5.3.4.2.
Micro level: More firms have begun to implement the concept of CE, particularly multi-national companies, since they believe that multiple benefits can be obtained from CE efforts, and it has become common across sectors (D’Amato et al. 2019). Typical CE tools and policies at this level include cleaner production, eco-design, environmental labelling, process synthesis, and green procurement. For instance, leading chemical companies are incorporating CE into their industrial practices, for example, through the design of more recyclable plastics, a differentiated and market-driven portfolio of resins, films and adhesives that deliver a total package that is more sustainable, cost-efficient and capable of meeting new packaging and plastics preferences. Problematically, at the same time the plastics industry is improving recyclability, it has, for example, been expanding into markets without recycling capacity (Mah 2021). Similarly, automakers are pursuing strategies to increase the portion of new vehicles that are fully recyclable when they reach the end of life, with increasing ambitions for using recycled material, largely motivated by end-of-life vehicle regulations. This will require networks that are available to collect and sort all the materials in vehicles, and policy incentives to do it (Wiebe et al. 2019; Soo et al. 2021).
Meso level: Industrial parks first appeared in Manchester, UK, at the end of the 19th century and they have been implemented in industrialised countries for maximising energy and material efficiency, which also has merit for CO2-emissions reduction, as stated in AR5. Industrial parks reduce the cost of infrastructure and utilities by concentrating industrial activities in planned areas, and are typically founded around large, long-term anchor companies. Complementary industries and services provided by industrial parks can entail diversified effects on the surrounding region and stimulate regional development (Huang et al. 2019a). This is crucial for small and medium enterprises (SMEs) because they often lack access to information and funds for sophisticated technologies.
Typical CE tools and policies at this level include sustainable supply chains and industrial symbiosis. A common platform for sharing information and enhancing communication among industrial stakeholders through the application of information and telecommunication technologies is helpful for facilitating the creation of industrial symbiosis. The main benefit of industrial symbiosis is the overall reduction of both virgin materials and final wastes, as well as reduced/avoided transportation costs from by-product exchanges among tenant companies, which can specifically help small- and medium-sized enterprises to improve their growth and competitiveness. From a climate perspective, this indicates significant industrial emission mitigation since the extraction, processing of virgin materials and the final disposal of industrial wastes are more energy intensive. Also, careful site selection of such parks can facilitate the use of renewable energy. Due to these advantages, eco-industrial parks have been actively promoted, especially in East Asian countries, such as China, Japan and the Republic of Korea (South Korea), where national indicators and governance exist (Geng et al. 2019). For instance, the successful implementation of industrial symbiosis at Dalian Economic and Technological Development Zone has achieved significant co-benefits, including GHG-emission reduction, economic and social benefits, and improved ecosystem functions (Liu et al. 2018). Another case at Ulsan industrial park, South Korea, estimated that 60,522 tonnes of CO2 were avoided annually through industrial symbiosis between two companies (Kim et al. 2018b). The case of China shows the great potential of implementing these measures, estimating 111 million tonnes of CO2 equivalent will be reduced in 213 national-level industrial parks in 2030 compared with 2015 (Guo et al. 2018). As such, South Korea’s national eco-industrial park project has reduced over 4.7 million tonnes of CO2 equivalent through their industrial symbiosis efforts (Park et al. 2019). Meso-level CE solutions have been identified as essential for industrial decarbonisation (Section 11.4.3). Moreover, waste prevention as the top of the so-called ‘waste hierarchy’ can be promoted on the meso level for specific materials or product systems. For instance, the European Environment Agency published a report on plastic waste prevention approaches in all 28 EU-member states (Wilts and Bakas 2019). However, challenges exist for industrial symbiosis activities, such as inter-firm contractual uncertainties, the lack of synergy infrastructure, and the regulations that hamper reuse and recycling. Therefore, necessary legal reforms are needed to address these implementation barriers.
Macro level: The macro level uses both micro- and meso-level tools within a broader policy strategy, addressing the specific challenge of CE as a cross-cutting policy (Wilts et al. 2016). More synergy opportunities exist beyond the boundary of one industrial park. This indicates the necessity of scaling up industrial symbiosis to urban symbiosis. Urban symbiosis is defined as the use of by-products (waste) from cities as alternative raw materials for energy sources for industrial operations (Sun et al. 2017). It is based on synergistic opportunity arising from geographic proximity through the transfer of physical sources (waste materials) for environmental and economic benefits. Japan is the first country to promote urban symbiosis. For instance, the Kawasaki urban symbiosis efforts can save over 114,000 tonnes of CO2 emissions annually (Ohnishi et al. 2017). Another simulation study indicates that Shanghai (the largest Chinese city) has the potential to save up to 16.8 MtCO2 through recycling all the available wastes (Dong et al. 2018). As such, the simulation of urban-energy-symbiosis networks in Ulsan, South Korea, indicates that 243,396 tCO2–1 yr –1 emission and USD48 million yr –1 fuel cost can be saved (Kim et al. 2018a). Moreover, Wiebe et al. (2019) estimate that the adoption of the CE can lead to a significantly lower global material extraction compared to a baseline. Their global results range from a decrease of about 27% in metal extraction to 8% in fossil fuel extraction and use, 8% in forestry products, and about 7% in non-metallic minerals, indicating significant climate change benefits. A macro-perspective calculation on the circulation of iron in Japan’s future society shows that CO2 emissions from the steel sector can be reduced by 56% as per the following assumptions: the amount recovered from social stock is the same as the amount of inflow, and all scrap was used domestically, and the export of steel products is halved (LCS 2018). A key challenge is to go beyond ensuring proper waste management to setting metrics, targets and incentives to preserve the incorporated value in specific waste streams. Estimations for Germany have shown that despite recycling rates of 64% for all solid-waste streams, these activities only lead to a resource-use reduction of only 18% (Steger et al. 2019). In general, the identification of the most appropriate CE method for different countries requires understanding and information exchange on background conditions, local policies and myriad other factors influencing material flows from the local up to the global level (Tapia Carlos et al. 2019). Also, an information platform should be created at the national level so that all the stakeholders can share their CE technologies and expertise, information (such as materials/energy/water consumption data), and identify the potential synergy opportunities.
11.3.4Energy Efficiency
Energy efficiency in industry is an important mitigation option and central in keeping 1.5°C within reach (IPCC SR1.5). It has long been recognised as the first mitigation option in industry (Yeen Chan and Kantamaneni 2016; Nadel and Ungar 2019; IEA 2021a). It allows reduction of the necessary scale of deployment for low-carbon energy supplies and associated mitigation costs (Energy Transitions Commission 2018). The efficiency potentials are greatest in the non-energy-intensive industries and are often relatively limited in energy-intensive ones, such as steel (Pardo and Moya 2013; Kuramochi 2016; Arens et al. 2017). Deep decarbonisation in these subsectors requires fundamental process changes but energy efficiency remains important to reduce costs and the need for low-carbon energy supplies.
Below, we focus mainly on the technical progress and on new options that are reflected in the literature since AR5 and refer the reader there for a broader and deeper treatment of energy efficiency. Digitalisation and the development of industrial high-temperature heat pumps are two notable technology developments that can facilitate energy efficiency improvements.
Industrial energy efficiency can be improved through multiple technologies and practices (Tanaka 2011; Fawkes et al. 2016; Lovins 2018; Crijns-Graus et al. 2020; IEA 2020a). There are two parallel processes in improvement of specific energy consumption (SEC): progress in energy-efficient BAT and moving the SEC of industrial plants towards BAT. Both slow down as theoretical thermodynamic minimums are approached (Gutowski et al. 2013). For the last several decades the focus has been on effective spreading of BAT technologies through application of policies for worldwide diffusion of energy-saving technologies (Section 11.6). As a result the SEC for many basic primary materials is approaching BAT and there are signs that energy efficiency improvements have been slowing down over recent decades (IEA 2019d, 2020a, 2021a) (Figure 11.8).
11.3.4.1Heat-use Energy Efficiency Improvement
While about 10% of global GHG emissions originate from combustion to produce high-temperature heat for basic material production processes (Sandalow et al. 2019), limited efforts have been made to decarbonise heat production. There is still a large potential for using various grades of waste heat and the development of high-temperature heat pumps facilitates its use. NEDO (2019) applies a ‘Reduce, Reuse, and Recycle’ concept for improved energy efficiency, and we use this frame our discussion of heat efficiency.
Reduce refers to reducing heat needs via improved thermal insulation, for example, where porous type insulators have been developed with thermal conductivity half of what is traditionally achieved by heat-resistant bricks under conditions of high compressive strength (Fukushima and Yoshizawa 2016). Reuse refers to waste heat recovery. A study for the EU identified a waste heat potential of about 300 TWh yr –1, corresponding to about 10% of total energy use in industry. About 50% of this was below 200°C, about 25% at temperatures 200°C–500°C, and 25% at temperatures of 500°C and above (Papapetrou et al. 2018). A survey conducted in Japan showed that 9% of the input energy is lost as waste heat, of which heat below 199°C accounts for 68% and that below 149°C was 29% (NEDO 2019). McBrien et al. (2016) identified that in the steel sector process heat recovery presently saves 1.8 GJ per tonne of hot rolled steel, while integrated across all production processes heat recovery with conventional heat exchange could save 2.5 GJ t –1, and it scales up to 3.0 GJ t –1 using an alternative heat exchange that recovers energy from hot steel. High-temperature industrial heat pumps represent a new and important development for upgrading waste heat and at the same time they facilitate electrification. One recent example is a high-temperature heat pump that can raise temperatures up to 165°C at a coefficient of performance (COP) of 3.5 by recovering heat from unused hot water (35°C–65°C) (Arpagaus et al. 2018). Commercially available heat pumps can deliver 100°C–150°C but at least up to 280°C is feasible (Zühlsdorf et al. 2019). Mechanical vapour recompression avoids the loss of latent heat by condensation, then it acts as a highly efficient heat pump with a 5–10 COP (Philibert 2017a).
Waste heat to power (WHP), or Recycle in NEDO’s terms, is also an under-utilised option. For example, a study for the cement, glass and iron industries in China showed that current technology enables only 7–13% of waste heat to be used for power generation. With improved technologies, potentially 40–57% of waste heat with temperatures above 150°C could be used for power generation via heat recovery. Thermal power fluctuations can be a challenge and negatively affect the operation and economic feasibility of heat recovery power systems such as steam and/or organic Rankine cycle. In such cases, latent heat storage technology and intermediate storage units may be applied (Jiménez-Arreola et al. 2018). The development of thermoelectric conversion materials that produce power from unused heat and energy harvested from a higher temperature environment is also progressing, with several possible applications in industrial processes (Gayner and Kar 2016; Jood et al. 2018; Lv et al. 2018; Ohta et al. 2018). A potential early application in industry is to power wireless sensors, a niche that uses microwatts or milliwatts, and avoid power cables (Champier 2017).
11.3.4.2 Smart Energy Management
Energy management systems to reduce energy costs in an integrated and systematic manner were first developed in the 1970s, mainly in low-energy-resource countries, for example, by establishing energy managers and institutionalising management targets (Tanaka 2011). Strategic energy management has since then evolved and been promoted through the establishment of dedicated organisational infrastructures for energy-use optimisation, such as ISO-50001 which specifies the requirements for establishing, implementing, maintaining, and improving an energy management system (Biel and Glock 2016; Tunnessen and Macri 2017). Digitalisation, sometimes referred to as Industry 4.0, facilitates further improvements in process control and optimisation through technology development involving sensors, communications, analytics, digital twins, machine learning, virtual reality, and other simulation and computing technologies (Rogers 2018), all of which can improve energy efficiency. One example is combustion control systems, where big data analysis of factors affecting boiler efficiency, operation optimisation and load forecasting have shown that it can lead to energy savings of 9% (Wang et al. 2017).
Smart energy systems with real-time monitoring allow for optimisation of innovative technologies, energy demand response, balancing of energy supply and demand including that on real-time pricing, and product quality management, and prediction and reduction of idle time for workers and robots (ERIA 2016; Pusnik et al. 2016; ISO 2018; Legorburu and Smith 2018; Ferrero et al. 2020; Nimbalkar et al. 2020). The IEA estimated that smart manufacturing could deliver 15 EJ in energy savings between 2014 and 2030 (IEA 2019d). Smart manufacturing systems that integrate manufacturing intelligence in real time through the entire production operation have not been yet widely spread in the industry. Examples have been demonstrated and integrated in real operation in the electrical appliance assembly industry (Yoshimoto 2016). Combining process controls and automation allows cost optimisation and improved productivity (Edgar and Pistikopoulos 2018).
11.3.5Electrification and Fuel Switching
The principle of electrification and fuel switching as a GHG mitigation strategy is that industries, to the extent possible, switch their end uses of energy from a high GHG intensity energy carrier to a lower or zero intensity one, including both its direct and indirect production and end-use GHG emissions. In general, and non-exclusively, this implies a transition from coal (about 0.09 tCO2GJ–1 on combustion), refined petroleum products (about 0.07 tCO2GJ–1), and natural gas (about 0.05 tCO2GJ–1) to biofuels, direct solar heating, electricity, hydrogen, ammonia, or net zero synthetic hydrocarbon fuels. Switching to these energy carriers is not necessarily lower emitting, however; how they are made matters.
Fuel switching has already been observed to reduce direct combustion CO2 emissions in many jurisdictions. There are significant debates about the net effect of upstream fossil fuel production and fugitive emissions, but observers have noted that in the case of US power generation it would take a leakage rate of about 2.7% from natural gas production to undo the direct fuel switching from coal mitigation effect, and the value is likely higher in most cases (Alvarez et al. 2012; Hausfather 2015). Coal mine methane emissions are also estimated to be substantially higher than previously assessed (Kholod et al. 2020). Alvarez et al. (2018) estimated US fugitive emissions (not including the Permian) at 2.3% of supply, 60% more than previously estimated, while recent Canadian papers indicate fugitive emissions are at least 50% more than reported (Chan et al. 2020; MacKay et al. 2021). However, given the potential for energy supply infrastructure lock-in effects (Tong et al. 2019), purely fossil fuel to fossil fuel switching is a limited and potentially dangerous strategy unless it is used very carefully and in a limited way.
Biofuels come in many forms, including ones that are nearly identical to fossil fuels but sourced from biogenic sources. Solid biomass, either direct from wood chips, lignin or processed pellets, is the most commonly used renewable fuel in industry today and is occasionally used in cement kilns and boilers. Biomethane, biomethanol, and bioethanol are all commercially made today using fermentation and anaerobic digestion techniques and are mostly ‘drop-in’ compatible with fossil fuel equivalents. In principle they cycle carbon in and out of the atmosphere, but their lifecycle GHG intensities are typically not GHG neutral due to land-use changes, soil carbon depletion, fertiliser use, and other dynamics (Hepburn et al. 2019), and are highly case specific. Most commercial biofuel feedstocks come from agricultural (e.g., corn) and food waste sources, and the feedstock is limited; to meet higher levels of biomass use a transition to using higher cellulose feedstocks like straw, switchgrass and wood waste, available in much larger quantities, must be fully commercialised and deployed. Significant efforts have been made to make ethanol from cellulosic biomass, which promises much higher quantities, lower costs, and lower intensities, but commercialisation efforts, with a few exceptions, have largely not succeeded (Padella et al. 2019). The IEA estimates, however, that up to 20% of today’s fossil methane use, including by industry, could be met with biomethane (IEA 2020g) by 2040, using a mixture of feedstocks and production techniques. Biofuel use may also be critical for producing negative emissions when combined with carbon capture and storage (i.e., bioenergy with carbon capture and storage – BECCS). Most production routes for biofuels, biochemicals and biogas generate large side streams of concentrated CO2 which is easily captured, and which could become a source of negative emissions (Sanchez et al. 2018) (Section11.3.6). Finally, it should be noted that biofuel combustion can, if inadequately controlled, have substantial negative local air quality effects, with implications for SDGs 3, 7 and 11.
There is a large identified potential for direct solar heating in industry, especially in regions with strong solar insolation and sectors with lower heat needs (<180°C), for example, food and beverage processing, textiles, and pulp and paper (Schoeneberger et al. 2020). The key challenges to adoption are site and use specificity, capital intensity, and a lack of standardised mass manufacturing for equipment and a supply chain to provide them.
Switching to electricity for end uses, or ‘direct electrification’, is a highly discussed strategy for net zero industrial decarbonisation (Lechtenböhmer et al. 2016; Palm et al. 2016; Åhman et al. 2017; Axelson et al. 2018; Bataille et al. 2018a; Davis et al. 2018; UKCCC 2019b; Material Economics 2019). Electricity is a flexible energy carrier that can be made from many forms of primary energy, with high potential process improvements in terms of end-use efficiency (Eyre 2021), quality and process controllability, digitisability, and no direct local air pollutants (McMillan et al. 2016; Jadun et al. 2017; Deason et al. 2018; Mai et al. 2018). The net-GHG effect of electrification is contingent on how the electricity is made, and because total output increases can be expected, for full effect it should be made with a very low GHG intensity primary source (i.e., <50 g CO2 kWh –1: e.g., hydroelectricity, nuclear energy, wind, solar photovoltaics, or fossil fuels with 95+% carbon capture and storage (IPCC 2014)). This has strong implications for the electricity sector and its generation mix when the goal is a net-zero-emissions electricity system. Despite their falling costs, progressively higher mixes of variable wind and solar on a given grid will require support from grid flexibility sources, including demand response, more transmission, storage on multiple time scales, or firm low-to-negative emissions generation sources (e.g., nuclear energy, hydrogen fuel cells or turbines, biofuels, fossil or biofuels with CCS, and geothermal) to moderate costs (Jenkins et al. 2018; Sepulveda et al. 2018; Williams et al. 2021). Regions that may be slower to reduce the GHG intensity of their electricity production will likely need to consider more aggressive use of other measures, like energy and material efficiency or bioenergy.
The long-term potential for full-process electrification is a very sector-by-sector and process-by-process phenomenon, with differing energy and capacity needs, load profiles, stock turnover, capacity for demand response, and characteristics of decision-makers. Industrial electrification is most viable in the near term in cases with: minimal retrofitting and rebuild in processes; with relatively low local electricity costs; where the degree of process complexity and process integration is more limited and extensive process re-engineering would not be required; where combined heat and power is not used; where induction heating technologies are viable; and where process heating temperatures are lower (Deason et al. 2018).
For these reasons, lighter, manufacturing-orientated industries are more readily electrifiable than heavier industry like steel, cement, chemicals and other sectors with high heat and feedstock needs. Steam boilers, curing, drying and small-scale process heating, with typically lower maximum heat temperature needs (<200°C–250°C) are readily electrifiable with appropriate fossil-fuel-to-electricity price ratios (accounting for capital costs and efficiencies), and direct induction and infrared heating are available for higher temperature needs. These practices are uncommon outside regions with ample hydroelectric power due to the currently relatively low cost of coal, natural gas and heating oil, and especially when there is no carbon combustion cost. Madeddu et al. (2020) argue up to 78% of Europe’s industrial energy requirements are electrifiable through existing commercial technologies. In contrast, Mai et al. (2018) saw only a moderate industrial heat supply electrification in their high-electrification scenario for the US. Electrification has also been explored in: raw and recycled steel (Fischedick et al. 2014 b; Vogl et al. 2018); ammonia (Bazzanella and Ausfelder 2017; Philibert 2017a); and chemicals (Palm et al. 2016; Bazzanella and Ausfelder 2017). While most chemical production of feedstock chemicals (e.g., H2, NH3, CO, CH3OH, C2H4, C2H6 and C2H5OH) is done thermo-catalytically today, it is feasible to use direct electrocatalytic production, by itself or in combination with utilisation of previously captured carbon sources if a fossil fuel feedstock is used, or well-known bio-catalytic (e.g., fermentation) and thermo-catalytic processes (Bazzanella and Ausfelder 2017; De Luna et al. 2019; Kätelhön et al. 2019). It may even be commercially possible to electrify cement sintering and calcination through plasma or microwave options (Material Economics 2019).
Increased electrification of industry will result in increased overall demand for electricity. For example, 75 TWh of electricity was used by steel in the EU in 2015 (out of the 1000 TWh total used by industry), Material Economics (2019), varying between their new process, circularity and CCUS scenarios, projects increased demand to 355 (+373%), 214 (+185%) and 238 (+217%) TWh. These values are consistent with Vogl et al. (2018), which projects a tripling of electricity demand in the German or Swedish steel industries if hydrogen-direct reduced iron and electric arc furnace steel-making (DRI EAFs) replaces BF-BOFs. Material Economics (2019) was conservative with its use of electricity in chemical production, making preferential use of biofeedstocks and some CCUS, and electricity demand still rose from 118 TWh to 510, 395 and 413 TWh in their three scenarios. Bazzanella and Ausfelder (2017), exploring deeper reductions from the chemical sector using more electrochemistry, projected scenarios with higher electricity demands of 960–4900 TWh (140% of the projected available clean electricity at the time) with maximum electricity use. In counterpoint, however, with revised wind capabilities and costs, the IEA (2019e) Offshore Wind Outlook indicates that ten times the current EU electricity use could be produced if necessary. Greater use of electro-catalytic versus thermo-catalytic chemistry, as projected by De Luna et al. (2019), could greatly reduce these electricity needs, but the technology readiness levels are currently low. Finally, the UKCCC (2019b), which focused primarily on CCS for industry in its ‘Further Ambition’ scenario (the UK currently consumes about 300 TWh), in its supplementary ‘Further Electrification’ scenario projects an additional 300 TWh for general electrolysis needs and another 200 TWh for synthetic fuel production.
While it has been demonstrated that almost any heating end use can be directly electrified, this would imply very high instantaneous thermal loads for blast furnace-basic oxygen furnace (BF-BOF) steel production, limestone calcination for cement and lime production, and other end uses where flame-front (1000°C–1700°C) temperatures are currently needed. This indicates a possible need for another energy carrier to minimise instantaneous generation and transmission needs. These needs can be met at varying current and potential future costs using: bioliquids or gases hydrogen, ammonia, or net zero synthetic hydrocarbons or alcohols.
Broadly speaking, hydrogen can contribute to a cleaner energy system in two ways: (i) existing applications of hydrogen (e.g., nitrogen fertiliser production, refinery upgrading) can use hydrogen produced using alternative, cleaner production methods; (ii) new applications can use low-GHG hydrogen as an alternative to current fuels and inputs, or as a complement to the greater use of electricity in these applications. In these cases – for example, in transport, heating, industry (e.g., hydrogen-direct reduced iron and steel production) and electricity – hydrogen can be used in its pure form, or be converted to hydrogen-based fuels, including ammonia, or synthetic net zero hydrocarbons and alcohols such as methane or methanol (IEA 2019f). The IEA states that hydrogen could be used to help integrate more renewables, including by enhancing storage options and ‘exporting sunshine and wind’ from places with abundant resources; decarbonise steel, chemicals, trucks, ships and planes; and boost energy security by diversifying the fuel mix and providing flexibility to balance grids (IEA 2019f).
Around 70 Mt yr –1 of pure hydrogen is produced today: 76% from natural gas and 23% from coal, resulting in emissions of roughly 830 MtCO2 yr –1 in 2016/17 (IEA 2019f), or 4.7% of global industrial direct and indirect emissions (waste excluded;Table 11.1). Fuels refining (about 410 MtCO2 yr –1) and production of ammonia (420 MtCO2 yr –1) largely dominate its uses. Another 45 Mt hydrogen is being produced along with other gases, on purpose or as by-products, and used as fuel, to make methanol or as a chemical reactant (IEA 2019f). Very low and potentially zero GHG (depending on the energy source) hydrogen can be made via: electrolysis separation of water into hydrogen and oxygen (Glenk and Reichelstein 2019), also known as ‘green H2’; electrothermal separation of water, as done in some nuclear plants (Bicer and Dincer 2017); partial oxidation of coal or naphtha or steam/auto methane reforming (SMR/ATR) combined with CCS (Leeson et al. 2017), or ‘blue H2’; methane pyrolysis, where the hydrogen and carbon are separated thermally and the carbon is left as a solid (Abbas and Wan Daud 2010; Ashik et al. 2015), or via biomass gasification (Ericsson 2017), which could be negative emissions if the CO2 from the gasification process is sequestered. All these processes would in turn need to be run using very low or zero GHG energy carriers for the resulting hydrogen to also be low in GHG emissions.
Ammonia production, made from hydrogen and nitrogen using the Haber-Bosch process, is the most voluminous chemical produced from fossil fuels, being used as feedstock for nitrogen fertilisers and explosives, as well as a cleanser, a refrigerant, and for other uses. Most ammonia is made today using methane as the hydrogen feedstock and heat source but has been made using electrolysis-based hydrogen in the past, and there are several announced investments to resume doing so. If ammonia is used as a combustion fuel, care must be taken to avoid N2O as a GHG and NOx in general as a local air pollutant.
Hydrogen can also be combined with low-to-zero net GHG carbon (Section11.3.6) and oxygen and made into methane, methanol and other potential net zero synthetic hydrocarbonsand alcohol energy carriers using methanation, steam reforming and Fischer-Tropsch processes, all of which can provide higher degrees of storable and shippable high-temperature energy using known industrial processes in novel combinations (Bataille et al. 2018a; Davis et al. 2018). If the hydrogen and oxygen is accessed via electrolysis, the terms ‘power-to-fuel’ or ‘e-fuels’ are often used (Ueckerdt et al. 2021). Given their carbon content, if used as fuels, their carbon will eventually be oxidised and emitted as CO2 to the atmosphere. This makes their net-GHG intensity dependent on the carbon source (Hepburn et al. 2019), with recycled fossil fuels, biocarbon and direct air capture carbon all having very different net-CO2 impacts – see section 11.3.6 on CCS and CCU for elaboration.
Box 11.1 | Hydrogen in Industry
The‘hydrogen economy’ is a long-touted vision for the energy and transport sectors, and one that has gone through hype-cycles since the energy crises in the 1970s (Meltonet al. 2016). The widely varying visions of hydrogen futures have mainly been associated with fuel cells in vehicles, small-scale decentralised cogeneration of heat and electricity, and to a certain extent energy storage for electricity (Eameset al. 2006; Syniak and Petrov 2008). However, nearly all hydrogen currently produced is used in industry, mainly for hydrotreating in oil refineries, to produce ammonia, and in other chemical processes, and it is mostly made using fossil fuels.
In the context of net zero emissions, new visions are emerging in which hydrogen has a central role to play in decarbonising industry. Near-term industrial applications for hydrogen include feeding it into ammonia production for fertilisers, while a more novel application would be as a replacement for coal as the reductant in steel-making, being piloted by the HYBRIT project in Sweden 2020–2021, and many companies have initiated hydrogen steel-making projects. As shown in Sections11.3.5 and 11.3.6, there are many other potential applications of hydrogen, some of which are still relatively unexplored. Hydrogen can also be used to produce various lower-GHG hydrocarbons and alcohols for fuels and chemical feedstocks using carbon from biogenic sources or direct air capture of CO2 (Ericsson 2017; Huang et al. 2020).
The geographical distribution of the potential for hydrogen from electrolysis powered by renewables like solar and wind, nuclear electrothermally produced hydrogen, and hydrogen from fossil gas with CCS may reshape where heavy industry is located, how value chains are organised, and what gets transported in international shipping (Bataille 2020a; Gielen et al. 2020; Bataille et al. 2021a; Saygin and Gielen 2021). Regions with bountiful renewables resources, nuclear, or methane co-located with CCS geology may become exporters of hydrogen or hydrogen carriers such as methanol and ammonia, or home to the production of iron and steel, organic platform chemicals, and other energy-intensive basic materials. This in turn may generate new trade patterns and needs for bulk transport.
11.3.6CCS, CCU, Carbon Sources, Feedstocks, and Fuels
Carbon is an important and highly flexible building block for a wide range of fuels, organic chemicals and materials including methanol, ethanol, olefins, plastics, textiles, and wood and paper products. In this chapter we define CCS as requiring return of CO2 from combustion or process gases or ambient air to the geosphere for geological time periods (i.e., thousands of years) (IPCC 2005; IEA 2009; Bruhn et al. 2016; IEA 2019g). CCU is defined as being where carbon (as CO or CO2) is captured from one process and reused for another, reducing emissions from the initial process, but is then potentially but not necessarily released to the atmosphere in following processes (Bruhn et al. 2016; Detz and van der Zwaan 2019; Tanzer and Ramírez 2019). In both cases the net effect on atmospheric emissions depends on the initial source of the carbon, be it from a fossil fuel, from biomass, or from direct air capture (Cuéllar-Franca and Azapagic 2015; Hepburn et al. 2019) and the duration of storage or use, which can vary from days to millennia.
While CCS and CCU share common capture technologies, what happens to the CO2 and therefore the strategies that will employ them can be very different. CCS can help maintain near-CO2 neutrality for fossil CO2 that passes through the process, with highly varying partially negative emissions if the source is biogenic (Hepburn et al. 2019), and fully negative emissions if the source is air capture, all not considering the energy used to drive the above processes. CCS has been covered in other IPCC publications at length, for example, IPCC (2005), and in most mitigation-oriented assessments since, for example, the IEA’s Energy Technology Perspectives (ETP) 2020 and Net Zero scenario reports (IEA 2021a, 2020a). The potentials and costs for CCS in industry vary considerably due to the diversity of industrial processes (Leeson et al. 2017), as well as the volume and purity of different flows of CO2 (Naims 2016); Kearns et al. (2021) provide a recent review. As a general rule it is not possible to capture all the CO2 emissions from an industrial plant. To achieve zero or negative emissions, CCS would need to be combined with some use of sustainably sourced biofuel or feedstock, or the remaining emissions would need to be offset by carbon dioxide removal (CDR) elsewhere.
For concentrated CO2 sources (e.g., cleaning of wellhead formation gas to make it suitable for the pipeline network, hydrogen production using steam methane reforming, ethanol fermentation, or from combustion of fossil fuels with oxygen in a nitrogen-free environment, i.e., ‘oxycombustion’) CCS is already amenable to commercial oil and gas reinjection techniques used to eliminate hydrogen sulphide gas and brines at prices of USD10–40 tCO2-eq –1 sequestered (Wilson et al. 2003; Leeson et al. 2017). Most currently operating CCS facilities take advantage of concentrated CO2 flows, for example, from formation gas cleaning on the Snoevit and Sleipner platforms in Norway, from syngas production for the Al Reyadah DRI steel plant in Abu Dhabi, and from SMR hydrogen production on the Quest upgrader in Alberta. Since concentrated process CO2 emissions are often exempted from existing cap and trade systems, these opportunities for CCS have largely gone unexploited. Many existing projects partially owe their existence to the utilisation of the captured CO2 for enhanced oil recovery, which in many cases counts as both CCS and CCU because of the permanent nature of the CO2 disposal upon injection if sealed properly (Mac Dowell et al. 2017). There are several industrial CCS strategies and pilot projects working to take advantage of the relative ease of concentrated CO2 disposal (e.g., LEILAC for limestone calcination process emissions from cement production, HISARNA direct oxycombustion smelting for steel) (Bataille 2020a). An emerging option for storing carbon is methane pyrolysis by which methane is split into hydrogen and solid carbon that may subsequently be stored (Schneider et al. 2020).
There are several post-combustion CCS projects underway globally (IEA 2019g), generally focused on energy production and processing rather than industry. Their costs are higher but evolving downward – Giannaris et al. (2020) suggest USD47 tCO2–1 for a follow-up 90% capture power generation plant based on learnings from the Saskpower Boundary Dam pilot – but crucially these costs are higher than implicit and explicit carbon prices almost everywhere, resulting in limited investment and learning in these technologies. A key challenge with all CCS strategies, however, is building a gathering and transport network for CO2, especially from dispersed existing sites; hence most pilot projects are built near EOR/geological storage sites, and the movement towards industrial clustering in the EU and UK (UKCCC 2019b), and as suggested in IEA (2019f).
In the case of CCU, CO and CO2 are captured and subsequently converted into valuable products (e.g., building materials, chemicals and synthetic fuels) (Styring et al. 2011; Bruhn et al. 2016; Artz et al. 2018; Brynolf et al. 2018; Daggash et al. 2018; Breyer et al. 2019; Kätelhön et al. 2019; Vreys et al. 2019). CCU has been envisioned as part of the ‘circular economy’ but conflicting expectations on CCU and its association or not with CCS leads to different and contested framings (Palm and Nikoleris 2021). The duration of the CO2 storage in these products varies from days to millennia according to the application, potentially but not necessarily replacing new fossil, biomass or direct air capture feedstocks, before meeting one of several possible fates: permanent burial, decomposition, recycling or combustion, all with differing GHG implications. While the environmental assessment of CCS projects is relatively straightforward, however, this is not the case for CCU technologies. The net-GHG mitigation impact of CCU depends on several factors (e.g., the capture rate, the energy requirements, the lifetime of utilisation products, the production route that is substituted, and associated room for improvement along the traditional route) and has to be determined by lifecycle CO2 or GHG analysis (e.g., Nocito and Dibenedetto 2020; and Bruhn et al. 2016). For example, steel-mill gases containing carbon monoxide and carbon dioxide can be used as feedstock together with hydrogen for producing chemicals. In this way, the carbon originally contained in the coke used in the blast furnace is used again, or cascaded, and emissions are reduced but not brought to zero. If fossil-sourced CO2 is only reused once and then emitted, the maximum reduction is 50% (Tanzer and Ramírez 2019). The logic of using steel-mill CO and CO2 could equally be applied to gasified biomass, however, with a far lower net-GHG footprint, likely negative, which CCU fed by fossil fuels cannot be if end-use combustion is involved.
Partly because of the complexity of the lifecycle analysis accounting, the literature on CCU is not always consistent in terms of the net-GHG impacts of strategies. For example, Artz et al. (2018), focused not just on GHG mitigation but multi-attribute improvements to chemical processes from reutilisation of CO2, suggests the largest reduction in the absolute amount of GHGs from CO2 reutilisation could be achieved by the coupling of highly concentrated CO2 sources with carbon-free hydrogen or electrons from low GHG power in so called ‘power-to-fuel’ scenarios. From the point of view of maximising GHG mitigation using surplus ‘curtailed’ renewable power, however, Daggash et al. (2018) instead indicates the best use would be for direct air capture and CCS. These results depend on what system is being measured, and what the objective is.
There are several potential crucial transitional roles for synthetic hydrocarbons and alcohols (e.g., methane, methanol, ethanol, ethylene, diesel and jet fuel) constructed using fossil, biomass or direct carbon capture (DAC) and CCU (Breyer et al. 2015; Dimitriou et al. 2015; Sternberg and Bardow 2015; Fasihi et al. 2017; Bataille et al. 2018a; Bataille 2020a). They can allow reductions in the GHG intensity of high-value legacy transport, industry and real estate that currently runs on fossil fuels but cannot be easily or readily retrofitted. They can be used by existing long-lived energy and feedstock infrastructure, transport and storage, which can compensate for seasonal supply fluctuations and contribute to enhancing energy security (Ampelli et al. 2015). Finally, they can reduce the GHG intensity of end uses that are very difficult to run on electricity, hydrogen or ammonia (e.g., long-haul aviation). However, their equivalent mitigation cost today would be very high (USD960–1440 tCO2-eq –1), with the potential to fall to USD24–324 tCO2-eq –1) with commercial economies of scale, with very high uncertainty (Hepburn et al. 2019; IEA 2020a; Ueckerdt et al. 2021).
A very large and important uncertainty is the long-term demand for hydrocarbon and alcohol fuels (whether fossil-, biomass- or DAC-based), chemical feedstocks (e.g., methanol and ethylene) and materials, and competition for biomass feedstock with other priorities, including agriculture, biodiversity and other proximate land-use needs, as well as need for negative emissions through BECCS. The current global plastics production of around 350 Mt yr –1 is almost entirely based on petroleum feedstock and recycling rates are very low. If this or future demand were to be 100% biomass-based it would require tens of exajoules of biomass feedstock (Meys et al. 2021). If demand can be lowered and recycling increased (mechanical as well as chemical) the demand for biomass feedstock can be much lower (Material Economics 2019). Promising routes in the short-term would be to utilise CO2 from anaerobic digestion for biogas and fermentation for ethanol in the production of methane or methanol (Ericsson 2017); methanol can be converted into ethylene and propylene in a methanol-to-olefins process and used in the production of plastics (Box 11.2). New process configurations where hydrogen is integrated into biomass conversion routes to increase yields and utilise all carbon in the feedstock are relatively unexplored (Ericsson 2017; De Luna et al. 2019).
There are widely varying estimates of the capacity of CCU to reduce GHG emissions and meet the net zero objective. According to Hepburn et al. (2019), the estimated potential for the scale of CO2 utilisation in fuels varies widely, from 1 to 4.2 GtCO2 yr –1, reflecting uncertainties in potential market penetration, requiring carbon prices of around USD40 to 80 tCO2–1, increasing over time. The high end represents a future in which synthetic fuels have sizeable market shares, due to cost reductions and policy drivers. The low end – which is itself considerable – represents very modest penetration into the methane and fuels markets, but it could also be an overestimate if CO2-derived products do not become cost competitive with alternative clean energy vectors such as hydrogen or ammonia, or with direct sequestration. Brynolf et al. (2018) indicates that a key cost variable will be the cost of electrolysers for producing hydrogen. Kätelhön et al. (2019) estimate that up to 3.5 GtC yr –1 could be displaced from chemical production by 2030 using CCU, but this would require clean electricity equivalent to 55% of estimated global power production, at the same time other sectors’ demand would also be rising. Mac Dowell et al. (2017) suggest that while CCU, and specifically CO2-based enhanced oil recovery, may be an important economic incentive for early CCS projects (up to 4–8% of required mitigation by 2050), it is unlikely the chemical conversion of CO2 for CCU will account for more than 1% of overall mitigation.
Finally, there is another class of CCU activities associated with carbonation of alkaline industrial wastes (including iron and steel slags, coal fly ash, mining and mineral processing wastes, incinerator residues, cement and concrete wastes, and pulp and paper mill wastes) using waste or atmospheric CO2. Given the large volume of alkaline wastes produced by industry, capture estimates are as high as 4 GtCO2 yr −1 (Cuéllar-Franca and Azapagic 2015; Ebrahimi et al. 2017; Kaliyavaradhan and Ling 2017; Pasquier et al. 2018; Huang et al. 2019c; Pan et al. 2020; Zhang et al. 2020) However, as some alkaline wastes are already used directly as supplementary cementitious materials to reduce clinker-to-cement ratios, and their abundant availability in the future is questionable (e.g., steel blast furnace slag and coal fly ash), there will be a strong competition between mitigation uses (Section 11.4.2), and the potential for direct removal by carbonation is estimated at about 1 GtCO2 yr −1 (Renforth 2019).
The above CCU literature has identified that there may be a highly unpredictable competition between fossil, biogenic and direct air capture carbon to provide highly uncertain chemical feedstock, material and fuel needs. Fossil waste carbon will likely initially be plentiful but will add to net atmospheric CO2 when released. Biogenic carbon is variably, partially net-negative, but the available stock will be finite and compete with biodiversity and agriculture needs for land. Direct air capture carbon will require significant amounts of low-GHG electricity or methane with high-capture rate CCS (Keith et al. 2018). There are clearly strong interactive effects between low-carbon electrification, switching to biomass, hydrogen, ammonia, synthetic hydrocarbons via CCU, and CCS.
11.3.7 Strategy Interactions and Integration
In this section we conceptually address interactions between service demand, service product intensity, product material efficiency, energy efficiency, electrication and fuel switching, CCU and CCS, and what conflicts and synergies may exist. Post AR5 a substantial literature has emerged, see Rissman et al. (2020), that addresses integrated and interactive technical deep decarbonisation pathways for GHG-intense industrial sectors, and how they interact with the rest of the economy (Denis-Ryan et al. 2016; Åhman et al. 2017; Wesseling et al. 2017; Axelson et al. 2018; Davis et al. 2018; Bataille et al. 2018a; Bataille 2020a). It is a common finding across this literature and a related scenario literature (Energy Transitions Commission 2018; Material Economics 2019; UKCCC 2019a,b; IEA 2019b, 2020a; CAT 2020; IEA 2021a) that deep decarbonisation of industry requires integrating all available options. There is no ‘silver bullet’ and so all behavioural and technological options have to be mobilised, with more emphasis required on the policy mechanisms necessary to engage a challenging transition in the coming decades in highly competitive, currently GHG-intense, price-sensitive sectors with long-lived capital stock (Wesseling et al. 2017; Bataille et al. 2018a; Bataille 2020a), discussed in the final section of this chapter.
While the strategies are not sequential and interact strongly, we discuss them in the order given. Reduced demand through reduced service demand and product intensity per service unit (Grubler et al. 2018; van Vuuren et al. 2018) reduces the need for the next six strategies. Greater material efficiency (see earlier sections) reduces the need for the next five, and so on – see Figure 11.9 above.
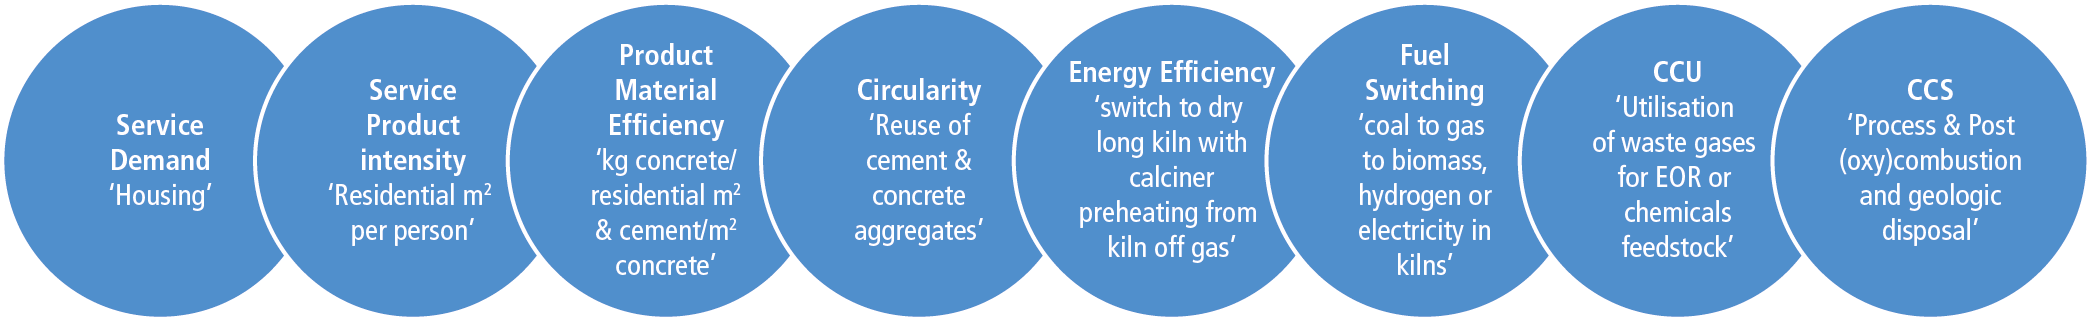
Figure 11.9 | Fully interactive, non-sequential strategies for decarbonising industry.
Circular economy introduces itself throughout, but mainly at the front end when designing materials and processes to be more materially efficient, efficient in use, and easy to recycle, and at the back end, when a material or product’s services life has come to end, and it is time for recycling or sustainable disposal (Murray et al. 2017; Korhonen et al. 2018). The entire chain’s potential will be maximised when these strategies are designed in ahead of time instead of considered on assembly, or as a retrofit (Allwood et al. 2012; Gonzalez Hernandez et al. 2018a; IEA 2019b; Material Economics 2019; Bataille 2020a). For example, when designing a building: (i) Is the building shell, interior mass and ducting orientated for passive heating and cooling, and can the shell and roof have building-integrated solar PV or added easily, with hard-to-retrofit wiring already incorporated? (ii) Are steel and high-quality concrete only used where really needed (i.e., for shear, tension and compression strength), can sections be prefabricated off-site, can other materials be substituted, such as wood? (iii) Can the interior fittings be built with easy-to-recycle plastics or other sustainably disposable materials (e.g., wood)? (iv) Can this building potentially serve multiple purposes through its anticipated lifetime, are service conduits oversized and easy to access for retrofitting? (v) When it is time to be taken apart, can pieces be reused, and all componnents recycled at high purity levels, for example, can all the copper wiring be easily be found and removed, are the steel beams clearly tagged with their content? The answers to these questions will be very regionally and site specific, and require revision of educational curricula for the entire supply chain, as well as revision of building codes.
Energy efficiency is a critical strategy for net zero transitions and enabling clean electrification (IEA 2021a). Improving the efficiency of energy services provision reduces the need for material intensive energy supply, energy storage, CCU and CCS infrastructure, and limits generation and transmission expansion to reduce an ever-higherdemand, with associated generation, transmission, and distribution losses. Using electricity efficiently can help reduces peak demand and the need for peaking plants (currently often powered by fossil fuels), and energy storage systems.
Electrification and final energy efficiency are deeply entangled, because switching to electricity from fossil fuels in most cases improves GJ for GJ end-use energy efficiency: resistance heaters are almost 100% efficient, heat pumps can be 300–400% efficient, induction melting can improve mixing and temperature control, and electric vehicle motors typically translate 90–95% of input electricity to motor drive in contrast to 35–45% for a large, modern internal combustion engine. Overall, the combined effect could be 40% lower global final energy demand assuming renewable electricity is used (Eyre 2021).
There are potentially complicated physical and market fuel switching relationships between low-GHG electricity, bioliquids and gases, hydrogen, ammonia, and synthetic hydrocarbons constructed using CCU, with remaining CO2 potentially being disposed of using CCS. Whether or not they compete for a wide range of end uses and primary demand needs will be regional and whether or not infrastructure is available to supply them. Regions with less than optimal renewable energy resources, or not sufficient to meet growing needs, could potentially indirectly import them as liquid or compressed hydrogen, ammonia or synthetic hydrocarbon feedstocks made in regions with abundant resources (Armijo and Philibert 2020; Bataille 2020a). Large-scale CCU and CCS applications need additional basic materials to build corresponding infrastructure and energy to operate it, thus reducing overall material and energy efficiencies.
There are different roles for different actors in relation to the different mitigation strategies (exemplified in Table 11.2), with institutions and supply chains developed to widely varying levels, for example, while energy efficiency is a relatively mature strategy with an established supply chain, material efficiency is not.
Table 11.2| Examples of the potential roles of different actors in relation to different mitigation strategies indicating the importance of engaging a wide set of actors across all mitigat ion strategies.
Sectors | Demand control measures (DM) | Materials efficiency (ME) | Circular economy | Energy efficiency | Electrification, hydrogen and fuel switching | CCU | CCS |
Architectural and engineering firms | Build awareness on the material demand implications of e.g., building codes, urban planning and infrastructure. | Education of designers, architects and engineers, etc. Develop design tools. Map material flows. | Design and build for e.g., repurpose, reuse and recycle. Improve transparency on volumes and flows. | Maintain high expertise, knowledge sharing, transparency, and benchmarking. | Support innovation. Share best practice. Design for dynamic demand response for grid balancing. | Develop allocation rules, monitoring and transparency. Coordination and collaboration across sectors. | Transparency, monitoring and labelling. Coordination and collaboration for transport and disposal infrastructure. |
Industry and service sector | Digital solutions to reduce office space and travel. Service-oriented business models for lower product demand. | Design for durability and light weight. Minimise industry scrap. | Design for reuse and recycling. Use recycled feedstock and develop industrial symbiosis. | Maintain energy management systems. | Develop and deploy new technologies in production, engage with lead markets. | Develop new technologies. Engage in new value chains and collaborations for sourcing carbon. | Plan for CCS where possible and phase-out of non-retrofittable plants where necessary. |
International bodies | Best practice sharing. Knowledge building on demand options. | Progressivity in international standards (e.g., ISO). | Transparency and regulation around products, waste handling, trade, and recycling. | Maintain efforts for sharing good practice and knowledge. | Coordinate innovation efforts, technology transfer, lead markets, and trade policies. | Coordinate and develop accounting and standards. Ensure transparency. | Align regulation to facilitate export, transport, and storage. |
Regional and national government, and cities | Reconsider spatial planning and regulation that has demand implications. | Procurement guidelines and better indicators. Standards and building codes. | Regulation on product design (e.g., Ecodesign Directive). Collect material-flow data. | Continue energy efficiency policies such as incentives, standards, labels, and disclosure requirements. | R&D and electricity infrastructure. Policy strategies for making investment viable (including carbon pricing instruments). | Align regulation to facilitate implementation and ensure accountability for emissions. | Develop regulation and make investment viable. Resolve long-term liabilities. |
Civil society and consumer organisations | Information and advocacy related to social norms. | Strengthen lobby efforts and awareness around e.g., planned obsolescence. | Engage in standards, monitoring and transparency. | Monitor progress. | Information on embodied emissions. Assess renewable electricity and grid expansion. | Develop standards and accounting rules. | Ensure transparency and accountability. |
11.4 Sector Mitigation Pathways and Cross-sector Implications
This section continues the discussion of the various mitigation options and strategy elements introduced in Section11.3 and makes them explicit for the most relevant industry sectors. For the various sectors, Section11.4.1 concludes with a tabular overview of key technologies and processes, their technology readiness level (TRL), potential timing of market penetration, mitigation potential and assessment of associated mitigation costs.
An integrated sequencing of mature short-term actions and less mature longer-term actions is crucial to avoid lock-in effects. Temporal implementation and discussion of the general quantitative role of the different options to achieve net zero emissions in the industrial sectors is core to the second part of the section (Section 11.4.2), where industry-wide mitigation pathways are analysed. This comprises the collection and discussion of mitigation scenarios available in the literature with a high technological resolution for the industry sector in addition to a set of illustrative global and national GHG mitigation scenarios selected from chapters 3 and 4, representing different GHG mitigation ambitions and different pathways to achieve certain mitigation targets. Comparing technology-focused sector-based scenarios with more top-down-oriented scenario approaches allows for a reciprocal assessment of both perspectives and helps to identify robust elements for the transformation of the sector. Comparison of real-world conditions within the sector (e.g., industry structure and logics, investment cycles, market behaviour, power, and institutional capacity) and the transformative pathways described in the scenarios helps researchers, analysts, governments, and all stakeholders understand the need not only for technological change, but for structural (e.g., new value chains, markets, infrastructures, and sectoral couplings) and behavioural (e.g., design practices and business models) change at multiple levels.
When undergoing a transformative process, it is obvious that interactions occur within the sector but also on a cross-sectoral basis. Relevant interactions are identified and discussed in the third and fourth part of the subsection. Changes are induced along the whole value chain, i.e., switching to an alternative (climate-friendly, e.g., low-GHG hydrogen-based) steel-making process has substantial impacts on the value chain, associated sub-suppliers, and electricity and coal outputs. In addition, cross-sectoral interactions are discussed. This includes feedback loops with other end-use chapters, for example, higher material demand through market penetration of some GHG mitigation technologies or measures (e.g., insulation materials for buildings, steel for windmills) and lower demand through others (e.g., less steel for fossil fuel extraction, transport and processing), or substantial additional demand of critical materials (e.g., the widely varying demands for copper, lithium, nickel, cobalt and rare earths for producing windmills, solar panels, and batteries). Generally, if consumption- (or behaviour-) driven additional material demand creates scarcity it becomes important to increase efforts on material efficiency, substitution, recycling/reuse, and sustainable consumption patterns.
11.4.1 Sector-specific Mitigation Potential and Costs
Based on the general discussion of strategies across industry in Section 11.3, this subsection focuses on the sector perspective and provides insights into the sector-specific mitigation technologies and potentials. As industry is comprised of many different subsectors, the discussion here has its focus on the most important sources of GHG emissions, that is, steel, cement and concrete, as well as chemicals, before other sectors are discussed.
11.4.1.1 Steel
For the period leading up to 2020, in terms of end-use allocation globally, approximately 40% of steel is used for structures, 20% for industrial equipment, 18% for consumer products, 13% for infrastructure, and 10% for vehicles (Bataille 2020b). The global production of crude steel increased by 41% between 2008 and 2020 (World Steel Association 2021) and its GHG emissions, depending on the scope covered, is 3.7–4.1 GtCO2-eq. It represented 20% of total global direct industrial emissions in 2019 accounting for coke oven and blast furnace gases use (Crippa et al. 2021; Lamb et al. 2021; Minx et al. 2021; Olivier and Peters 2018; World Steel Association 2021; IEA 2020a) (Figure 11.4 and Table 11.1). Steel production can be divided into primary production based on iron ore and secondary production based on steel scrap. The blast furnace-basic oxygen furnace route (BF-BOF) is the main primary steel route globally, while the electric arc furnace (EAF) is the preferred process for the less energy and emissions-intensive melting and alloying of recycled steel scrap. The direct reduced iron (DRI) route is a lesser-used route that replaces BFs for reducing iron ore, usually followed by an EAF. In 2019, 73% of global crude steel production was produced in BF-BOFs, while 26% was produced in EAFs, a nominal 5.6% of which is DRI (World Steel Association 2021).
An estimated 15% energy efficiency improvement is possible within the BF-BOF process (Figure 11.8). Several options exist for deep-GHG emissions reductions in steel-production processes (Fischedick et al. 2014 b; Leeson et al. 2017; Axelson et al. 2018; Vogl et al. 2018; Bataille 2020a; Holappa 2020; Rissman et al. 2020; Fan and Friedmann 2021; Wang et al. 2021).Each could reduce specific CO2 emissions of primary steel production by 80% or more relative to today’s dominant BF-BOF route if input streams are based on carbon-free energy and feedstock sources or if they deploy high-capture CCS:
•Increasing the share of the secondary route can bring down emissions quickly and potential emissions savings are significant, from a global average 2.3 tCO2–1 per tonne steel in BF-BOFs down to 0.3 (or less) tCO2–1 per tonne steel in EAFs (Pauliuk et al. 2013a; Zhou et al. 2019), the latter depending on scrap preheating and electricity GHG intensity. However, realising this potential is dependent on the availability of regional and global scrap supplies and requires careful sorting and scrap management, especially to eliminate copper contamination (Daehn et al. 2017). There is significant uncertainty about how much new scrap will be available and usable (Xylia et al. 2018; IEA 2019b; Wang et al. 2021). Most steel is recycled already; the gains are mainly to be made in quality (i.e., separation from contaminants like copper). End-of-life scrap availability and its contribution to steel production will increase as in use stock saturates in many countries (Xylia et al. 2016).
•BF-BOFs with CCU or CCS. Abdul Quader et al. (2016) and Fan and Friedmann (2021) indicate that it would be difficult to retrofit BF-BOFs beyond 50% capture, which is insufficient for long-term emission targets but may be useful in some cases for avoiding cumulative emissions where other options are not available. However, BF-BOFs need their furnaces relined every 15–25 years (IEA 2021a; Vogl et al. 2021b), at a cost of 80–100% of a new build, and this would be an opportunity to build a new facility designed for 90%+ capture (e.g., fewer CO2 outlets). This would depend upon access to transport to geology appropriate for CCS.
•Methane-based syngas (hydrogen and carbon monoxide) direct reduced iron (DRI) with CCS. Most DRI facilities currently use a methane-based syngas of H2 and CO as both reductant and fuel (some use coal). A syngas DRI-EAF steel-making facility has been operating in Abu Dhabi since 2016 that captures carbon emitted from the DRI furnace (where it is a co-reductant with hydrogen) and sends it to a nearby oil field for enhanced oil recovery.
•Hydrogen-based direct reduced iron (H-DRI) is based on the already commercialised DRI technology but using only hydrogen as the reductant; pure hydrogen has already been used commercially by Circored in Trinidad 1999–2008. The reduction process of iron ore is typically followed by an EAF for smelting. During a transitional period, DRI could start with methane or a mixture of methane and hydrogen as some of the methane (≤30% hydrogen can be substituted with green or blue hydrogen without the need to change the process). If the hydrogen is produced based on carbon-free sources, this steel-production process can be nearly CO2 neutral (Vogl et al. 2018).
•In the aqueous electrolysis route (small-scale piloted as Siderwin during the EU ULCOS programme), the iron ore is bathed in an electrolyte solution and an electric current is used to remove the oxygen, followed by an electric arc furnace for melting and alloying.
•In the moltenoxide electrolysis route, an electric current is used to directly reduce and melt the iron ore using electrolysis in one step, followed by alloying. These processes both promise a significant increase in energy efficiency compared with the direct reduced iron (DRI) and blast furnace routes (Cavaliere 2019). If the electricity used is based on carbon-free sources, this steel-production process can be nearly CO2 neutral. Both processes would require supplemental carbon, but this is typically only up to 0.05% per tonne steel, with a maximum of 2.1%. Aqueous electrolysis is possible with today’s electrode technologies, while molten oxide electrolysis would require advances in high-temperature electrodes.
•TheHIsarna® process is a new type of coal-based smelting reduction process, which allows certain agglomeration stages (coking plant, sintering/pelletising) to be dispensed with. The iron ore, with a certain amount of steel scrap, is directly reduced to pig iron in a single reactor. This process is suitable to be combined with CCS technology because of its relatively easy to capture and pure CO2 exhaust gas flow. CO2 emission reductions of 80% are believed to be realisable relative to the conventional blast furnace route (Abdul Quader et al. 2016). The total GHG balance also depends on further processing in a basic oxygen furnace or in an EAF. The HIsarna process was small-scale piloted under the EU ULCOS program.
•Hydrogen co-firingin BF-BOFs can potentially reduce emission by 30–40%, referring to experimental work by the Course50 projects and Thyssen Krupp, but coke is required to maintain stack integrity beyond that.
Reflecting the different conditions at existing and potential future plant sites, when choosing one of the above options a combination of different measures and structural changes (including electricity, hydrogen and CCU or CCS infrastructure needs) will likely be necessary in the future to achieve deep reductions in CO2 emissions of steel production.
In addition, increases in material efficiency (e.g., more targeted steel use per vehicle, building or piece of infrastructure) and increases in the intensity of product use (e.g., sharing cars instead of owning them) can contribute significantly to reduce emissions by reducing the need for steel production. The IEA (2019b) suggested that up to 24% of cement and 40% of steel demand could be plausibly reduced through strong material efficiency efforts by 2060. Potential material efficiency contribution for the EU is estimated to be much higher – 48% (Material Economics 2019). Recycling would cut the average CO2 emissions per tonne of steel produced by 60% (Material Economics 2019), but globally by 2050 secondary steel production is limited to 40–56% in various scenarios (IEA 2019b), with 46% in the IEA (2021a) and up to 56% in 2050 in Xylia et al. (2016). It may scale up to 68% by 2070 (Xylia et al. 2016). CCU and more directly CCS are other options to reduce GHG emissions but depend on the full lifecycle net GHGs that can be allocated to the process (Section 11.3.6). Bio-based fuels can also substitute for some of the coal input, but due to other demands for biomass this strategy is likely to be limited to specific cases.
Abatement costs for these strategies vary considerably from case to case and for each a plausible cost range is difficult to establish; compare this with Table 11.3 (Fischedick et al. 2014 b; Leeson et al. 2017; Axelson et al. 2018; Vogl et al. 2018; Fan and Friedmann 2021; Wang et al. 2021). A key point is that while cost of production increases are significant, the effect on final end uses is typically very small (Rootzén and Johnsson 2016), with significant policy consequences (see Section 11.6 on public and private lead markets for cleaner materials).
Table 11.3 | Technological potentials and costs for deep decarbonisation of basic industries. Percentages of maximum reduction are multiplicative, not additive.
Sector | Current intensity (tCO2-eq t –1) | Potential GHG reduction | NASA TRL | Cost per tonne CO2-eq (USD2019 tCO2-eq –1 for percentage of emissions) ? = unknown | Year available, assuming policy drivers |
Iron and steel | |||||
Current intensity – all steel (worldsteel) | 1.83 | ||||
Current intensity – ~BF-BOF/Best BF-BOF and NG-DRI (with near-zero GHG electricity) | 2.3/1.8 and 0.7 | ||||
Current intensity – EAF (depends on electricity intensity & pre-heating fuel) | ≥0 | Up to 99% | |||
Material efficiency (IEA 2019 ‘Material Efficiency…’) | Up to 40% | 9 | Subject to supply chain building codes and education | Today | |
More recycling; depends on available stock, recycling network, quality of scrap, availability of DRI for dilution | Highly regional, growing with time | 9 | Subject to logistical, transport, sorting and recycling equipment costs | Today | |
BF-BOF with top gas recirculation and CCU/Sa | 60% | 6–7 | USD70–130 t –1 | 2025–2030 | |
Syngas (H2& CO) DRI EAF with concentrated flow CCU/S | ≥ 90% | 9 | ≥USD40 t –1 | Today | |
Hisarna with concentrated CO2 capture b | 80–90% | 7 | USD40–70 t –1 | 2025 | |
Hydrogen DRI EAFc– fossil hydrogen with CCS is in operation, electrolysis-based hydrogen scheduled for 2026 | Up to 99% | 7 | USD39–79 t –1 and USD46 MWh –1d | 2025 | |
Aqueous (e.g., SIDERWIN) or Molten Oxide (e.g., Boston Metals) Electrolysis (MOE)e | Up to 99% | 3–5 | ? | 2035–2040 | |
Cement and concrete | |||||
Current intensity, about 60% is limestone calcination | 0.55 | ||||
Building design to minimise concrete (IEA 2019b, 2020a) | Up to 24% | 9 | Low, education, design and logistics related | 2025 | |
Alternative lower-GHG fuels, e.g., waste (biofuels and hydrogen, see above) | 40% | 9 | Cost of alt. fuels | Today | |
CCUS for process heating & CaCO3 calcination CO2(e.g., LEILAC, possible retrofit)f | 99% calc., ≤90% heat | 5–7 | ≤USD40t –1 calc. ≤USD120t –1 heat | 2025 | |
Clinker substitution (e.g., limestone + calcined clays)g | 40–50% | 9 | Near zero, education, logistics, building code revisions | Today | |
Use of multi-sized and well-dispersed aggregates d | Up to 75% | 9 | Near zero | Today | |
Magnesium or ultramafic cements d | Negative? | 1–4 | ? | 2040 | |
Aluminium and other non-ferrous metals | |||||
Current Al intensity, from hydro- to coal-based electricity production. 1.5 tCO2 are produced by graphite electrode decay | 1.5 t –1+ electricity required (i.e., 10 t –1 (NG) to 18 t –1 (coal)) | ||||
Inert electrodes and green electricity h | 100% | 6–7 | Relatively low | 2024 | |
Hydro/electrolytic smelting (with CO2CCUS if necessary) | Up to 99% | 3–9 | Ore-specific | <2030 | |
Chemicals (see also cross-cutting feedstocks above)i | |||||
Catalysis of ammonia from low-/zero-GHG hydrogen H2 | 1.6 (NG), 2.5 (naptha), 3.8 (coal) | ≤99% | 9 | Cost of H2 | Today |
Electrocatalysis: CH4, CH3OH, C2H5OH, CO, olefins j | Up to 99% | 3 | Cost: elec., H2, COx | 2030 | |
Catalysis of olefins from: (m)ethanol, H2 and COx directly | 9% | 9, 3 | Cost: H2 and COx | <2030 | |
End-use plastics, mainly CCUS and recycling | 1.3–4.2, about 2.4 | 94% | 5–6 | USD150–240 t –1 | 2030? |
Pulp and paper | |||||
Full biomass firing, including lime kilns | 60–75% | 9 | About USD50 t –1 | Today | |
Other manufacturing | |||||
Electrification using current tech (boilers, 90°C–140°C heat pumps | 99% | 9 | Cost: elec. vs NG | 2025 | |
Using new tech (induction, plasma heating) | 99% | 3–6 | 2025 | ||
Cross-cutting (CCUS, H2, net zero CoOxHyfuels/feedstocks) | |||||
CCUS of post-combustion CO2 diluted in nitrogen e | Up to 90% | 6–7 | ≤USD120 t –1 | 2025 | |
CCUS of concentrated CO2e | 99% | 9 | ≤USD40 t –1 | Today | |
H2 production: steam or auto-thermal CH4 reforming with CCSe | SMR ≤90% ATR >90% | 6*, 9** | 56% @≤USD40 t –1 chem**, ≤USD120 heat*,+20%/kg | ≤2025 | |
H2 production: coal with CCUSe | ≤90% | 6 | 25–50% per H2 kg –1 | ≤2025 | |
H2 production: alkaline or PEM electrolysis k | 99% | 9 | About USD50 t –1 or <USD20–30 MWh –1 | Today | |
H2 production: reversible solid oxide fuel electrolysis j | 99% | 6–8 | About 40USD t –1 or <USD40 MWh –1 | 2025 | |
H2 production: CH4 pyrolysis or catalytic cracking l | 99% | 5 | ? | 2030? | |
Hydrogen as CH4 replacement | ≤10% | 9 | See above | Today | |
Biogas or liquid replacement hydrocarbons | 60–90% | 9 | Biomass USD per GJ–1; ≥USD50 t –1, uncertain | Today | |
Anaerobic digestion/fermentation: CH4, CH3OH and C2H5OHm | Up to –99% | 9 | Biomass cost | Today | |
Methane or methanol from H2 and COx (CCUS for excess). Maximum –50% reduction if C source is FF | 50–99% | 6–9 | Cost: H2 and COx | Today | |
850°C woody biomass gasification with CCS for excess carbon: CO, CO2, H2, H2O, CH4, C2H4 and C6H6n | Could be negative | 7–8 | About USD50–75 t –1, uncertain | Today | |
Direct air capture for short- and long-chain CoOxHyo | Up to 99% | 3 | Cost: E, H2, COx about USD94–232 t –1 | ≤2030 | |
aData for CCS costs for steel-making: Birat (2012); Leeson et al. (2017); and Axelson et al. (2018).
bData for Hisarna: Axelson et al. (2018).
cData for hydrogen DRI electric arc furnaces: Fischedick et al. (2014b) and Vogl et al. (2018).
dConverted from EUR2018 34–68 t –1 and EUR2018 40 MWh –1.
eData for Molten Oxide Electrolysis (also known as SIDERWIN): Fischedick et al. 2014 b and Axelson et al. 2018. The TRLs differ by source, the value provided is from Axelson et al. (2018), based on UCLOS SIDERWIN.
f Data for making hydrogen from SMR and ATR with CCUS: Leeson et al. (2017); Moore (2017); and IEA (2019f). The cost of CCS disposal of concentrated sources of CO2 at USD15–40 tCO2-eq –1 is well established as commercial for direct or EOR purposes and is based on the long-standing practice of disposing of hydrogen sulphide and oil brines underground: Wilson et al. (2003) and Leeson et al. (2017). There is a wide variance, however, in estimated tCO2-eq –1 break-even prices for industrial post-combustion capture of CO2 from sources highly diluted in nitrogen (e.g., Leeson et al. (2017) at USD60–170 tCO2-eq –1), but most fall under USD120 tCO2-eq –1.
gData for clinker substitution and use of well-mixed and multi-sized aggregates: Fechner and Kray 2012; Lehne and Preston 2018; and Habert et al. 2020).
hRio Tinto, Alcoa and Apple have partnered with the governments of Québec and Canada to form a coalition to commercialise inert as opposed to sacrificial graphite electrodes by 2024, thereby making the standard Hall-Héroult process very low emissions if low-carbon electricity is used.
iData and other information: Bazzanella and Ausfelder (2017); Axelson et al. (2018); IEA (2018a); De Luna et al. (2019); and Philibert (2017b,a).
j See De Luna et al. (2019) for a state-of-the-art review of electrocatalysis, or direct recombination of organic molecules using electricity and catalysts.
kData for hydrogen production from electrolysis: Bazzanella and Ausfelder (2017); Philibert (2017a); Philibert (2017b); IEA (2019f); and Armijo and Philibert (2020).
lData for methane pyrolysis to make hydrogen: Abbas and Wan Daud (2010). Data for hydrogen production from methane catalytic cracking: Amin et al. (2011) and Ashik et al. (2015).
mData for anaerobic digestion or fermentation for the production of methane, methanol and ethanol: De Luna et al. (2019).
nData for woody biomass gasification: Li et al. (2019) and van der Meijden et al. (2011).
oData on direct air capture of CO2: Keith et al. (2018) and Fasihi et al. (2019).
11.4.1.2Cement and Concrete
The cement sector is regarded as a sector where mitigation options are especially narrow (Energy Transitions Commission 2018; Habert et al. 2020). Cement is used as the glue to hold together sand, gravel and stone aggregates to make concrete, the most consumed manufactured substance globally. The production of cement has been increasing faster than the global population since the middle of the last century (Scrivener et al. 2018). Despite significant improvements in energy efficiency over the last couple of decades (e.g., a systematic move from wet to dry kilns with calciner preheaters feeding off the kilns), the direct emissions of cement production (the sum of energy and process emissions) are estimated to be 2.1–2.5 GtCO2-eq in 2019 or 14–17% of total global direct industrial GHG emissions (Lehne and Preston 2018; Bataille 2020a; Sanjuán et al. 2020; Crippa et al. 2021; Hertwich 2021; Lamb et al. 2021) (Figure 11.4). Typically, about 40% of these direct emissions originate from process heating (e.g., for calcium carbonate (limestone) decomposition into calcium oxide at 850°C or higher, directly followed by combination with cementitious materials at about 1450°C to make clinker), while 60% are process CO2 emissions from the calcium carbonate decomposition (Kajaste and Hurme 2016; IEA and WBCSD 2018; Andrew 2019). Some of the CO2 is reabsorbed into concrete products and can be seen as avoided during the decades-long life of the products; estimates of this flux vary between 15 and 30% of the direct emissions (Stripple et al. 2018; Andersson et al. 2019; Schneider 2019; Cao et al. 2020; GCCA 2021a). Some companies are mixing CO2 into hardening concrete, both to dispose of the CO2 and more importantly reduce the need for binder (Lim et al. 2019).
One of the simplest and most effective ways to reduce cement and concrete emissions is to make stronger concrete through better mixing and aggregate sizing and dispersal; poorly and well-made concrete can vary in strength by a factor of four for a given volume (Fechner and Kray 2012; Habert et al. 2020). This argues for a refocus of the market away from ‘one size fits all’, often bagged cements to professionally mixed clinker, cementitious material and filler mixtures appropriate to the needs of the end use.
Architects, engineers and contractors also tend to overbuild with cement because it is cheap as well as corrosion- and water-resistant. Buildings and infrastructure can be purposefully designed to minimise cement use to its essential uses (e.g., compression strength and corrosion-resistance), and replace its use with other materials (e.g., wood, stone and other fibres) for non-essential uses. This could reduce cement use by 20–30% (Imbabi et al. 2012; Brinkerhoff and GLDNV 2015; D’Alessandro et al. 2016; Lehne and Preston 2018; IEA 2019b; Shanks et al. 2019; Habert et al. 2020).
Because so much of the emissions from concrete come from the limestone calcination to make clinker, anything that reduces use of clinker for a given amount of concrete reduces its GHG intensity. While 95% Portland cement is common in some markets, it is typically not necessary for all end-use applications, and many markets will add blast furnace slag, coal fly ash, or natural pozzolanic materials to replace cement as supplementary cementitious materials; 71% was the global average clinker content of cement in 2019 (IEA 2020a). All these materials are limited in volume, but a combination of roughly two to three parts ground limestone and one part specially selected, calcined clays can also be used to replace clinker (Fechner and Kray 2012; Lehne and Preston 2018; Habert et al. 2020). Local building codes determine what mixes of cementitious materials are allowed for given uses and would need to be modified to allow these alternative mixtures where appropriate.
Ordinary Portland cement process CO2 emissions cannot be avoided or reduced through the use of non-fossil energy sources. For this reason, CCS technology, which could capture just the process emissions (e.g., the EU LEILAC project, which concentrates the process emissions from the limestone calciner, see following paragraph) or both the energy and process-related CO2 emissions, is often mentioned as a potentially important element of an ambitious mitigation strategy in the cement sector. Different types of CCS processes can be deployed, including post-combustion technologies such as amine scrubbing and membrane-assisted CO2-liquefation, oxycombustion in a low-to-zero nitrogen environment (full or partial) to produce a concentrated CO2 stream for capture and disposal, or calcium-looping (Dean et al. 2011). The IEA puts cement CCS technologies at the technology readiness level (TRL) 6–8 (IEA 2020h). These approaches have different strengths and weaknesses concerning emission abatement potential, primary energy consumption, costs and retrofittability (Hills et al. 2016; Gardarsdottir et al. 2019; Voldsund et al. 2019). Use of biomass energy combined with CCS has the possibility of generating partial negative emissions, with the caveats introduced in Section11.3.6 (Hepburn et al. 2019).
The energy-related emissions of cement production can also be reduced by using bioenergy solids, liquids or gases (TRL 9) (IEA and WBCSD 2018), hydrogen or electricity (TRL 4 according to IEA (2020h)) for generating the high-temperature heat at the calciner – hydrogen and bioenergy co-burning could be complementary due to their respective fast-vs-slow combustion characteristics. In an approach pursued by the LEILAC research project, the calcination process step is carried out in a steel vessel that is heated indirectly using natural gas (Hills et al. 2017). The LEILAC approach makes it possible to capture the process-related emissions in a comparatively pure CO2 stream, which reduces the energy required for CO2 capture and purification. This technology (LEILAC in combination with CCS) could reduce total furnace emissions by up to 85% compared with an unabated, fossil fuelled cement plant, depending on the type of energy sources used for heating (Hills et al. 2017). In principle, the LEILAC approach allows the eventual potential electrification of the calciner by electrically heating the steel enclosure instead of using fossil burners.
In the long run, if some combination of material efficiency, better mixing and aggregate sizing, cementitious material substitution and 90%+ capture CCS with supplemental bioenergy are not feasible in some regions or at all to achieve near-zero emissions, alternatives to limestone-based ordinary Portland cement may be needed. There are several highly regional alternative chemistries in use that provide partial reductions (Fechner and Kray 2012; Lehne and Preston 2018; Habert et al. 2020), for example, carbonatable calcium silicate clinkers, and there have been pilot projects with magnesium-oxide-based cements, which could be negative emissions. Lower carbon cement chemistries are not nearly as widely available as limestone deposits (Material Economics 2019), and would require new materials testing protocols, codes, pilots and demonstrations.
Any substantial changes in cement and concrete material efficiency or production decarbonisation, however, will require comprehensive education and continuing re-education for cement producers, architects, engineers, contractors and small, non-professional users of cements. It will also require changes to building codes, standards, certification, labeling, procurement, incentives, and a range of polices to help create the market will be needed, as well as those for information disclosure, and certification for quality. Even an end-of-pipe solution like CCS will require infrastructure for transport and disposal. Abatement costs for these strategies vary considerably from case to case and for each a plausible cost range is difficult to establish, but they are summarised in Table 11.3 from the following literature and other sources (Wilson et al. 2003; Fechner and Kray 2012; Leeson et al. 2017; Moore 2017; Lehne and Preston 2018; IEA 2019f; Habert et al. 2020).
11.4.1.3Chemicals
The chemical industry produces a broad range of products that are used in a wide variety of applications. The products range from plastics and rubbers to fertilisers, solvents, and specialty chemicals such as food additives and pharmaceuticals. The industry is the largest industrial energy user and its direct emissions were about 1.1–1.7 GtCO2-eq or about 10% of total global direct industrial emissions in 2019 (Olivier and Peters 2018; IEA 2019f; Crippa et al. 2021; Lamb et al. 2021; Minx et al. 2021) (Figure 11.4 and Table 11.1). With regard to energy requirements and CO2 emissions, ammonia, methanol, olefins, and chlorine production are of great importance (Boulamanti and Moya Rivera 2017). Ammonia is primarily used for nitrogen fertilisers, methanol for adhesives, resins, and fuels, whereas olefins and chlorine are mainly used for the production of polymers, which are the main components of plastics.
Technologies and process changes that enable the decarbonisation of chemicals production are specific to individual processes. Although energy efficiency in the sector has steadily improved over the past decades (Boulamanti and Moya Rivera 2017; IEA 2018a) (Figure 11.8), a significant share of the emissions is caused by the need for heat and steam in the production of primary chemicals (Bazzanella and Ausfelder 2017) (Box 11.2). This energy is currently supplied almost exclusively through fossil fuels which could be substituted with bioenergy, hydrogen, or low or zero carbon electricity, for example, using electric boilers or high-temperature heat pumps (Bazzanella and Ausfelder 2017; Thunman et al. 2019; Saygin and Gielen 2021). The chemical industry has among the largest potentials for industrial energy demand to be electrified with existing technologies, indicating the possibility for a rapid reduction of energy-related emissions (Madeddu et al. 2020).
The production of ammonia causes most CO2 emissions in the chemical industry, about 30% according to the IEA (2018a) and nearly one third according to Crippa et al. (2021), Lamb et al. (2021) and Minx et al. (2021). Ammonia is produced in a catalytic reaction between nitrogen and hydrogen – the latter most often produced through natural gas reforming (Stork et al. 2018; Material Economics 2019) and in some regions through coal gasification, which has several times higher associated CO2 emissions. Future low-carbon options include hydrogen from electrolysis using low- or zero-carbon energy sources (Philibert 2017a), natural gas reforming with CCS, or methane pyrolysis, a process in which methane is transformed into hydrogen and solid carbon (Bazzanella and Ausfelder 2017; Material Economics 2019; (Section 11.3.5 and Box 11.1). Electrifying ammonia production would lead to a decrease in total primary energy demand compared to conventional production, but a significant efficiency improvement potential remains in novel synthesis processes (Wang et al. 2018; Faria 2021). Combining renewable energy sources and flexibility measures in the production process could allow for low-carbon ammonia production on all continents (Fasihi et al. 2021). Steam cracking of naphtha and natural gas liquids for the production of olefins (i.e., ethylene, propylene and butylene), and other high-value chemicals is the second most CO2-emitting process in the chemical industry, accounting for another almost 20% of the emissions from the subsector (IEA 2018a). Future lower-carbon options include electrifying the heat supply in the steam cracker as described above, although this will not remove the associated process emissions from the cracking reaction itself or from the combustion of the by-products. Further in the future, electrocatalysis of carbon monoxide, methanol, ethanol, ethylene and formic acid could allow direct electric recombination of waste chemical products into new intermediate products (De Luna et al. 2019).
A ranking of key emerging technologies with likely deployment dates from the present to 2025 relevant for the chemical industry identified different carbon capture processes together with electrolytic hydrogen production as being of very high importance to reach net zero emissions (IEA 2020a). Methane pyrolysis, electrified steam cracking, and the biomass-based routes for ethanol-to-ethylene and lignin-to-BTX were ranked as being of medium importance. While macro-level analyses show that large-scale use of carbon circulation through CCU is possible in the chemical industry as primary strategy, it would be very energy intensive and the climate impact depends significantly on the source of and process for capturing the CO2 (Artz et al. 2018; Kätelhön et al. 2019; Müller et al. 2020). Significant synergies can be found when combining circular CCU approaches with virgin carbon feedstocks from biomass (Bachmann et al. 2021; Meys et al. 2021).
In a net zero world carbon will still be needed for many chemical products, but the sector must also address the lifecycle emissions of its products which arise in the use phase, for example, CO2 released from urea fertilisers, or at the end of life, for example, the incineration of waste plastics which was estimated to emit 100 Mt globally in 2015 (Zheng and Suh 2019). Reducing lifecycle emissions can partly be achieved by closing the material cycles starting with material and product design planning for reuse, remanufacturing, and recycling of products – ending up with chemical recycling which yields recycled feedstock that substitutes virgin feedstocks for various chemical processes (Rahimi and García 2017; Smet and Linder 2019).However, the chemical recycling processes which are most well-studied are pyrolytic processes which are energy intensive and have significant losses of carbon to off-gases and solid residues (Dogu et al. 2021; Davidson et al. 2021). They are thus associated with significant CO2 emissions, which can even be larger in systems with chemical recycling than energy recovery (Meys et al. 2020). Further, the products from many pyrolytic chemical recycling processes are primarily fuels, which then in their subsequent use will emit all contained carbon as CO2 (Vollmer et al. 2020). Achieving carbon neutrality would thus require this CO2 either to be recirculated through energy-consuming synthesis routes or to be captured and stored (Geyer et al. 2017; Lopez et al. 2018; Material Economics 2019; Thunman et al. 2019). As all chemical products are unlikely to fit into chemical recycling systems, CCS can be used to capture and store a large share of their end-of-life emissions when combined with waste combustion plants or heat-demanding facilities like cement kilns (Leeson et al. 2017; Tang and You 2018).
Reducing emissions involves demand-side measures, for example, efficient end use, materials efficiency and slowing demand growth, as well as recycling where possible to reduce the need for primary production. The following strategies for primary production of organic chemicals which will continue to need a carbon source are key in avoiding the GHG emissions of chemical products throughout their lifecycles:
Recycled feedstocks: Chemical recycling of plastics unsuitable for mechanical recycling was already mentioned. Through pyrolysis of old plastics, both gas and a naphtha-like pyrolysis oil can be generated, a share of which could replace fossil naphtha as a feedstock in the steam cracker (Honus et al. 2018a,b). Alternatively, waste plastics could be gasified and combined with low-carbon hydrogen to a syngas, for example, the production and methanol and derivatives (Lopez et al. 2018; Stork et al. 2018). Other chemical recycling options include polymer selective chemolysis, catalytic cracking, and hydrocracking (Ragaert et al. 2017). Carbon losses and process emissions must be minimised and it may thus be necessary to combine chemical recycling with CCS to reach near-zero emissions (Thunman et al. 2019; Smet and Linder 2019; Meys et al. 2021).
Biomass feedstocks: Substituting fossil carbon at the inception of a product lifecycle for carbon from renewable sources processed in designated biotechnological processes (Lee et al. 2019; Hatti-Kaul et al. 2020) using specific biomass resources (Isikgor and Becer 2015) or residual streams already available (Abdelaziz et al. 2016). Routes with thermochemical and catalytic processes, such as pyrolysis and subsequent catalytic upgrading, are also available (Jing et al. 2019).
Synthetic feedstocks: Carbon captured with direct air capture or from point sources (bioenergy, chemical recycling, or during a transition period from industrial-processes-emitting fossil CO2) can be combined with low-GHG hydrogen into a syngas for further valorisation (Kätelhön et al. 2019). Thus, low-carbon methanol can be produced and used in methanol-to-olefins/aromatics (MTO/MTA) processes, substituting the steam cracker (Gogate 2019) or Fischer-Tropsch processes could produce synthetic hydrocarbons.
Reflecting the diversity of the sector, the listed options can only be illustrative. The above-listed strategies all rely on low-carbon energy to reach near-zero emissions. In considering mitigation strategies for the sector it will be key to focus on those for which there is a clear path towards (close to) zero emissions, with high (carbon) yields over the full product value chain and minimal fossil resource use for both energy and feedstocks (Saygin and Gielen 2021), with CCU and CCS employed for all remnant carbon flows. The necessity of combining mitigation approaches in the chemicals industry with low-carbon energy was recently highlighted in an analysis (Figure 11.10) which showed how the combined use of different recycling options, carbon capture, and biomass feedstocks was most effective at reducing global lifecycle emissions from plastics (Meys et al. 2021). While most of the chemical processes for doing all the above are well known and have been used commercially at least partly, they have not been used at large scale and in an integrated way. In the past, external conditions (e.g., availability and price of fossil feedstocks) have not set the necessary incentives to implement alternative routes and to avoid emitting combustion- and process-related CO2 emissions to the atmosphere. Most of these processes will very likely be more costly than using fossil fuels and full-scale commercialisation would require significant policy support and the implementation of dedicated lead markets (Wesseling et al. 2017; Bataille et al. 2018a; Material Economics 2019; Wyns et al. 2019). As in other subsectors, abatement costs for the various strategies vary considerably across regions and products, making it difficult to establish a plausible cost range for each (Bazzanella and Ausfelder 2017; Philibert 2017a; Philibert 2017b; Axelson et al. 2018; IEA 2018a; De Luna et al. 2019; Saygin and Gielen 2021).

Figure 11.10 Feedstock supply and waste treatment in a scenario with a combination of mitigation measures in a pathway for low-carbon plastics. Source: From Meys et al., “Achieving net-zero greenhouse gas emission plastics by a circular carbon economy”. Science, 374(6563), 71–76, DOI: 10.1126/science.abg9853. Reprinted with permission from AAAS.
Box 11. 2 | Plastics andClimate Change
The global production of plastics has increased rapidly over the past 70 years, with a compound annual growth rate (CAGR) of 8.4%, about 2.5 times the growth rate for global GDP (Geyeret al. 2017) and higher than other materials since 1970 (IEA 2019b). Global production of plastics is now more than 400 million tonnes, including synthetic fibres (IEA 2019b) The per capita use of plastics is still up to 20 times higher in developed countries than in developing countries with low signs of saturation and the potential for an increased use is thus still very large (IEA 2018a). Plastics is the largest output category from the petrochemical industry, which as a whole currently uses about 14% of petroleum and 8% of natural gas (IEA 2018a). Forecasts for plastic production assuming continued growth at recent rates of about 3.5% point towards a doubled production by 2035, following record-breaking investments in new and increased production capacity based on petroleum and gas in recent years (CIEL 2017; Bauer and Fontenit 2021). IEA forecasts show that even in a world where transport demand for oil falls considerably by 2050 from the current about 100 mbpd, feedstock demand for chemicals will rise from about 12 mbpd to 15–18 mbpd (IEA 2019b). Projections for increasing plastic production as well as petroleum use, together with the lack of investments in breakthrough low-emission technologies, do not align with necessary emission reductions.
About half of the petroleum that goes into the chemical industry is used for producing plastics, and a significant share of this is combusted or lost in the energy-intensive production processes, primarily the steam cracker. GHG emissions from plastic production depend on the feedstock used (ethane-based production is associated with lower emissions than naphtha-based), the type of plastic produced (production of simple polyolefins is associated with lower emissions than more complex plastics such as polystyrene), and the contextual energy system (e.g., the GHG intensity of the electricity used) but weighted averages have been estimated to be 1.8 tCO2-eq t –1 for North American production (Daniel Posen et al. 2017) and 2.3 tCO2-eq t –1 for European production (Material Economics 2019). In regions more dependent on coal electricity production the numbers are likely to be higher, and several times higher for chemical production using coal as a feedstock – coal-based MTO has seven times higher emissions than olefins from steam cracking (Xiang et al. 2014). Coal-based plastic and chemicals production has over the past decade been developed and deployed primarily in China (Yang et al. 2019). The production of plastics was thus conservatively estimated to emit 1085 MtCO2-eq yr –1 in 2015 (Zheng and Suh 2019). Downstream compounding and conversion of plastics was estimated to emit another 535 MtCO2-eq yr –1, while end-of-life treatment added 161 MtCO2-eq yr –1. While incineration of plastic waste was the cause of only 5% of global plastic lifecycle emissions, in regions with waste-to-energy infrastructures this share is significantly larger, for example, 13% of lifecycle emissions in Europe (Ive Vanderreydt et al. 2021). The effective recycling rate of plastics remains low relating to a wide range of issues such as insufficient collection systems, sorting capacity, contaminants and quality deficiencies in recycled plastics, design of plastics integrated in complex products such as electronics and vehicles, heterogenous plastics used in packaging, and illegal international trade.
11.4.1.4Other Industry Sectors
The other big sources of direct global industrial combustion and process CO2 emissions are light manufacturing and industry (9.7% in 2016), non-ferrous metals like aluminium (3.1%), pulp and paper (1.1%), and food and tobacco (1.9%) (Bataille 2020a; Crippa et al. 2021; Lamb et al. 2021).
Light manufacturing and industry represent a very diverse sector in terms of energy service needs (e.g., motive power, ventilation, drying, heating, compressed air, etc.) and it comprises both small and large plants in different geographical contexts. Most of the direct fossil fuel use is for heating and drying, and it can be replaced with low-GHG electricity through direct resistance, high-temperature heat pumps and mechanical vapour recompression, induction, infrared, or other electrothermal processes (Lechtenböhmer et al. 2016; Bamigbetan et al. 2017). Madeddu et al. (2020) argue up to 78% of Europe’s industrial energy requirements are electrifiable through existing commercial technologies and 99% with the addition of new technologies currently under development. Direct solar heating is possible for low temperature needs (<100°C) and concentrating solar for higher temperatures. Commercially available heat pumps can deliver 100°C–150°C but at least up to 280°C is feasible (Zühlsdorf et al. 2019). Plasma torches using electricity can be used where high temperatures (>1000°C) are required, but hydrogen, biogenic or synthetic combustible hydrocarbons (methane, methanol, ethanol, LPG, etc.) can also be used (Bataille et al. 2018a).
There is also a large potential for energy savings through cascading in industrial clusters similar to the one at Kalundborg, Denmark. Waste heat can be passed at lower and lower temperatures from facility to facility or circulated as low-grade steam or hot water, and boosted as necessary using heat pumps and direct heating. Such geographic clusters would also enable lower-cost infrastructure for hydrogen production and storage as well as CO2 gathering, transport and disposal (IEA 2019f).
Demand for aluminium comes from a variety of end uses where a reasonable cost, light-weight metal is desirable. It has historically been used in aircraft, window frames, strollers, and beverage containers. As fuel economy has become more desirable and design improvements have allowed crush bodies made of aluminium instead of steel, aluminium has become progressively more attractive for cars. Primary aluminium demand is total demand (100 Mt yr –1 in 2020) net of manufacturing waste reuse (14% of virgin and recycled input) and end-of-life recycling (about 20% of what reaches market). Primary aluminium consumption rose from under 20 Mt yr –1 in 1995 to over 66 Mt primary ingot production in 2020 (International Aluminium Institute change to 2021c). The International Aluminium Institute (2021a) expects total aluminium consumption to reach 150–290 Mt yr –1 by 2050 with primary aluminium contributing 69–170 Mt and secondary recycled 91–120 Mt (as in-use stock triples or quadruples). The OECD forecasts increases in demand by 2060 for primary aluminium to 139 Mt yr –1 and for secondary aluminium to 71 Mt yr –1 (OECD 2019a). Primary (as opposed to recycled) aluminium is generally made in a two-stage process, often geographically separated. In the first stage aluminium oxide is extracted from bauxite ore (often with other trace elements) using the Bayer hydrometallurgical process, which requires up to 200°C heat when sodium hydroxide is used to leach the aluminium oxide, and up to 1000°C for kilning. This is followed by electrolytic separation of the oxygen from the elemental aluminium using the Hall-Héroult process, by far the most energy-intense part of making aluminium. This process has large potential emissions from the electricity used (12.5 MWh per tonne aluminium BAT, 14–15 MWh per tonne average). From bauxite mine to aluminium ingot, reported total global average emissions are between 12 and 17.6 tCO2-eq per tonne of aluminium, depending on estimates and assumptions made 22 (Saevarsdottir et al. 2020). About 10% of this, 1.5 tonnes of direct CO2 per tonne of aluminium are currently emitted as the graphite electrodes are depleted and combine with oxygen, and if less than optimal conditions are maintained, perfluorocarbons can be emitted with widely varying GHG intensity, up to the equivalent of 2 tCO2-eq per tonne of aluminium. PFC emissions, however, have been greatly reduced globally and almost eliminated in well-run facilities. Aluminium, if it is not contaminated, is highly recyclable and requires 1/20 of the energy required to produce virgin aluminium; increasing aluminium recycling rates from the 20–25% global average is a key emissions reduction strategy (Haraldsson and Johansson 2018).
The use of low- and zero-GHG electricity (e.g., historically from hydropower) can reduce the indirect emissions associated with making aluminium. A public-private partnership with financial support from the province of Québec and the Canadian federal government has recently announced a fundamental modification to the Hall-Héroult process by which the graphite electrode process emissions can be eliminated by substitution of inert electrodes. This technology is slated to be available in 2024 and is potentially retrofittable to existing facilities (Saevarsdottir et al. 2020).
Smelting and otherwise processing of other non-ferrous metals like nickel, zinc, copper, magnesium and titanium with less overall emissions have relatively similar emissions reduction strategies (Bataille and Stiebert 2018): (i) Increase material efficiency; (ii) Increase recycling of existing stock; (iii) Pursue ore-extraction processes (e.g., hydro- and electro-metallurgy) that allow more use of low-carbon electricity as opposed to pyrometallurgy, which uses heat to melt and separate the ore after it has been crushed. These processes have been used occasionally in the past but have generally not been used due to the relatively inexpensive nature of fossil fuels.
The pulp and paper industry (PPI) is a small net-emitter of CO2, assuming the feedstock is sustainably sourced (Chapter 7), but it has large emissions of biogenic CO2 from feedstock (700–800 Mt yr –1) (Tanzer et al. 2021). It includes pulp mills, integrated pulp and paper mills, and paper mills using virgin pulpwood and other fibre sources, residues and co-products from wood products manufacturing, and recycled paper as feedstock. Pulp mills typically have access to bioenergy in the chemical pulping processes to cover most or all of heat and electricity needs, for example, through chemicals recovery boilers and steam turbines in the kraft process. Mechanical pulping mainly uses electricity for energy; decarbonisation thus depends on grid emission factors. With the exception of the lime kiln in kraft pulp mills, process temperature needs are typically less than or equal to 150°C to 200°C, mainly steam for heating and drying. This means that this sector can be relatively easily decarbonised through continued energy efficiency, fuel switching and electrification, including use of high-temperature heat pumps (Ericsson and Nilsson 2018). Electrification of pulp mills could, in the longer term, make bio-residues currently used internally for energy, available as a carbon source for chemicals (Meys et al. 2021). The PPI also has the capabilities, resources and knowledge, to implement these changes. Inertia is mainly caused by equipment turnover rates, relative fuel and electricity prices, and the profitability of investments.
A larger and more challenging issue is how the forestry industry can contribute to the decarbonisation of other sectors and how biogenic carbon will be used in a fossil-free society, for example, through developing the forest-based bioeconomy (Pülzl et al. 2014; Bauer 2018). In recent years the concept of biorefineries has gained increasing traction. Most examples involve innovations for taking by-products or diverting small streams to produce fuels, chemicals and bio-composites that can replace fossil-based products, but there is little common vision on what really constitutes a biorefinery (Bauer et al. 2017). Some of these options have limited scalability and the cellulose fibre remains the core product even in the relatively large shift from paper production to textiles fibre production.
Pulp mills have been identified as promising candidates for post-combustion capture and CCS (Onarheim et al. 2017), which could allow some degree of net-negative emissions. For deep decarbonisation across all sectors, notably switching to biomass feedstock for fuels, organic chemicals and plastics, the availability of biogenic carbon (in biomass or as biogenic CO2; Chapter 7) becomes an issue. A scenario where biogenic carbon is CCU as feedstock implies large demands for hydrogen, completely new value chains and more closed carbon loops, all areas which are as yet largely unexplored (Ericsson 2017; Meys et al. 2021).
11.4.1.5Overview of Estimates of Specific Mitigation Potential and Abatement Costs of Key Technologies and Processes for Main Industry Sectors
Climate-policy-related literature focusing on deep industrial emission reductions has expanded rapidly since AR5. An increasing body of research proposes deep decarbonisation pathways for energy-intensive industries (Figure 11.13). Bataille et al. (2018a) address the question of whether it is possible to reduce GHG emissions to very low, zero, or negative levels, and identifies preliminary technological and policy elements that may allow the transition, including the use of policy to drive technological innovation and uptake. Material Economics (2019), the IEA (2019b), the Energy Transitions Commission (2018) and Climate Action Tracker (CAT; 2020) take steps to identify pathways integrating energy efficiency, material efficiency, circular economy and innovative technologies options to cut GHG emissions across basic materials and value chains. The key conclusion is that net zero CO2 emissions from the largest sources (steel, plastics, ammonia, and cement) could be achieved by 2050 by deploying already available multiple options packaged in different ways (Davis et al. 2018; Material Economics 2019; UKCCC 2019b). The studies assume that for those technologies that have a kind of breakthrough technology status further technological development and significant cost reduction can be expected.
Table 11.3, modified from Bataille (2020a) and built from McMillan et al. (2016); Bazzanella and Ausfelder (2017); Philibert (2017a); Wesseling et al. (2017); Axelson et al. (2018); Bataille et al. (2018a) Davis et al. (2018); Energy Transitions Commission (2018); IEA (2019f, 2020c); Material Economics (2019); and UKCCC (2019b), presents carbon intensities that could be achieved by implementing mitigation options in major basic material industries, mitigation potential, estimates for mitigation costs, TRL and potential year of market introduction (Figure 11.13).
Table 11.3 acknowledges that for many carbon-intensive products a large variety of novel processes, inputs and practices capable of providing very deep emission reductions are already available and emerging. However, their application is subject to different economic and structural limitations, therefore in the scenarios assuming deep decarbonisation by 2050–2060 different technological mixes can be observed (Section 11.4.2).
While deep GHG emissions reduction potential is assessed for various regions, assessment of associated costs is limited to only a few regions; nevertheless those analyses may be illustrative at the global scale. UKCCC (2019b) provides costs assessments for different industrial subsectors (Table 11.3) for the UK. They provide three ranges: core, more ambitious, and when energy and material efficiency are limited. The core options range from 2–85 GBP2019 tCO2-eq –1 (e.g., reduction in GHG emissions by about 50% by 2050 applying energy efficiency (EE), ME, CCS, biomass and electrification). The more ambitious options are estimated at 32–119 GBP2019 tCO2-eq –1 (e.g., 90% emissions reduction via widespread deployment of hydrogen, electrification or bioenergy for stationary industrial heat/combustion). Finally, costs range from 33–299 GBP tCO2-eq –1 when energy and material efficiency are limited.
In Material Economics (2019), costs are provided for separate technologies and subsectors, and also by pathways, each including new industrial processes, circular economy and CCS components in different proportions, allowing for the transition to net zero industrial emission in the EU by 2050. That means that the study provides information about the three main mid- to long-term options which could enable a wide abatement of GHG emissions. Given different electricity-price scenarios, average abatement costs associated with the circular economy-dominated pathway are: 12–75 EUR2019 tCO2-eq –1; for the carbon capture-dominated pathway 79 EUR2019 tCO2-eq –1; and for the new processes-dominated scenario 91 EUR2019 tCO2-eq –1. Consequently, net-zero-emission pathways are about 3–25% costlier compared to the baseline (Material Economics 2019). According to the Energy Transitions Commission (2018), cement decarbonisation would cost on average USD110–130 tCO2–1 depending on the cost scenario. Rootzén and Johnsson (2016) state that CO2 avoidance costs for the cement industry vary from 25 to 110 EUR tCO2–1, depending on the capture option considered and on the assumptions made with respect to the different cost items involved. According to the Energy Transitions Commission (2018), steel can be decarbonised on average at USD60 tCO2–1, with highly varying costs depending on low-carbon electricity prices.
For customers of final products, information on the potential impact of supply-side decarbonisation on final prices may be more useful than that of CO2 abatement costs. A different approach has been developed to assess the costs of mitigation by estimating the potential impacts of supply-side decarbonisation on final product prices. Material Economics (2019) shows that with deep decarbonisation, depending on the pathway, steel costs grow by 20–30%; plastics by 20–45%; ammonia by 15–60%; and cement (not concrete) by 70–115%. While these are large and problematic cost increases for material producers working with low margins in a competitive market, final end-use product price increases are far less, for example, a car becomes 0.5% more expensive, supported by both Rootzén and Johnsson (2016) and the Energy Transitions Commission (2018). For comparison, Rootzén and Johnsson (2017) found that decarbonising cement-making, while doubling the cost of cement, would add <1% to the costs of a residential building; the Energy Transitions Commission (2018) found concrete would be 10–30% more expensive, adding USD15,000 or 3% to the price of a house including land value. Finally, the IEA (2020a) estimated the impact on end-use prices are rather small, even in a net zero scenario; they find price increases of 0.2% for a car and 0.6% for a house, based on higher costs for steel and cement respectively.
Thus, the price impact scales down going across the value chain and might be acceptable for a significant share of customers. However, it has to be reflected that the cumulative price increase could be more significant if several different zero-carbon materials (e.g., steel, plastics and aluminium) in the production process of a certain product have to be combined, indicating the importance of material efficiency being applied along with production decarbonisation.
Box 11. 5 | CircularEconomy Policy
The implementation of a circular economy relies on the operationalisation of the R-imperatives or strategies which extend from the original 3Rs: Reduce, Reuse and Recycle, with the addition of Refuse, Reduce, Resell/Reuse, Repair, Refurbish, Remanufacture, Repurpose, Recycle, Recover (energy), Re-mine and more (Reikeet al. 2018). The R implementation strategies are diverse across countries (Ghiselliniet al. 2016; Kalmykovaet al. 2018) but, in practice, the lower forms of retention of materials, such as recycling and recover (energy), often dominate. The lack of policies for higher retention of material use such as Reduce, Reuse, Repair and Remanufacture is due to institutional failures, lack of coordination and lack of strong advocates (Gonzalez Hernandezet al. 2018a).
Policies addressing market barriers to circular business development need to demonstrate that circular products meet quality performance standards, ensure that the full environmental costs are reflected in market prices and foster market opportunities for circular products exchange, notably through industrial symbiosis clusters and trading platforms (Kirchherret al. 2018; OECD 2019a; Hartleyet al. 2020; Hertwich 2020). Policy levels span from micro (such as consumer or company) to meso (eco-industrial parks) and macro (provinces, regions and cities) (Genget al. 2019). The creation of eco-industry parks (‘industrial clusters’) has been encouraged by governments to facilitate waste exchanges between facilities, where by-products from one industry are used as a feedstock to
Box 11.5
another (Ding and Hua 2012; Jiao and Boons 2014; Shi and Yu 2014; Tianet al. 2014; Winanset al. 2017). Systematic assessment of wastes and resources is carried out to assess possible exchange between different supply chains and identify synergies of waste streams that include metal scraps, waste plastics, water heat, bagasse, paper, wood scraps, ash, sludge and others (Ding and Hua 2012; Shi and Yu 2014).
The development of data collection and indicators is nascent and need to ramp up to quantify the impacts and provide evidence to improve circular economy and materials efficiency policies. Policymakers need to leverage the potential socio-economic opportunities of transitioning to circular economies (Llorente-González and Vence 2020), which shows positive GDP growth and job creation by shifting to more labour-intensive recycling plants and repair services than resource-extraction activities (WRAP and Alliance Green 2015; Cambridge Econometrics et al. 2018). The International Labour Organization estimates that worldwide employment would grow by 0.1% by 2030 under a circular economy scenario (ILO 2018). However questions remain if the type of jobs created are concentrated in low-wage labour-intensive circular activities which may need targeted policy instruments to improve working conditions (Llorente-González and Vence 2020).
11.4.2Transformation Pathways
To discuss the general role and temporal implementation of the different options for achieving a net zero GHG emissions industry, mitigation pathways will be analysed. This starts with showing the results of IAM-based scenarios followed by specific studies which provide much higher technological resolution and allow a much deeper look into the interplay of different mitigation strategies. The comparison of more technology-focused sector-based scenarios with top-down-oriented scenarios provides the opportunity for a reciprocal assessment across different modelling philosophies and helps to identify robust elements for the transformation of the sector. Only some of the scenarios available in the literature allow for at least rough estimates of the necessary investments and give direction about relevant investment cycles and potential risks of stranded or depreciated assets. In some specific cases cost comparisons can be translated into expected difference costs not only for the overall sector, but also for relevant materials or even consumer products.
11.4.2.1Central Results From (Top-down) Scenarios Analysis and Illustrative Mitigation Pathways Discussion
Chapter 3 conducted a comprehensive analysis of scenarios based on IAMs. The resulting database comprises more than 1000 model-based scenarios published in the literature. The scenarios span a broad range along temperature categories from rather baseline-like scenarios to the description of pathways that are compatible with the 1.5°C target. Comparative discussion of scenarios allows some insights with regard to the relevance of mitigation strategies for the industry sector (Figure 11.11).

Figure 11.11 Industrial final energy (top left), CO2 emissions (top middle), energy intensity (bottom left), carbon intensity (top right), share of electricity (bottom middle), and share of gases (bottom right). Energy intensity is final energy per unit of GDP. Carbon intensity is CO2 emissions per EJ of final energy. The first four indicators are indexed to 2019, where values less than 1 indicate a reduction. Industrial-sector CO2 emissions include fuel-combustion emissions only. Boxes indicate the interquartile range, the median is shown with a horizontal black line, while vertical lines show the 5 to 95% interval. Source: data are from the AR6 database; only scenarios that pass the vetting criteria are included (Section 3.2).
The main results from the Chapter 3 analysis from an industry perspective are:
•While all scenarios show a decline in energy and carbon intensity over time, final energy demand and associated industry-related CO2 emissions increase in many scenarios. Only ambitious scenarios (category C1) show significant reduction in final energy demand in 2030, more or less constant demand in 2050, but increasing demand in 2100, driven by growing material use throughout the 21st century. While carbon intensity shrinks over time, energy related CO2-emissions decline after 2030 even in less ambitious scenarios, but particularly in those pursuing a temperature increase below 2°C. Reduction of CO2 emissions in the sector are achieved through a combination of technologies which includes nearly all options that have been discussed in this chapter (Sections 11.3 and 11.4.1). However, there are big differences with regard to the intensity by which the various options are implemented in the scenarios. This is particularly true for CCS for industrial applications and material efficiency and material demand management (i.e., service demand, service product intensity). The latter options are still under-represented in many global IAMs.
•There are only a few scenarios which allow net-negative CO2 emissions for the industry for the second half of the century, while most scenarios assessed (including the majority of 1.5°C scenarios) end up with still significant positive CO2 emissions. In comparison to the whole system most scenarios expect a slower decrease of industry-related emissions.
•There is a great – up to a factor of two – difference in assumptions about the GHG mitigation potential associated with different carbon cost levels between IAMs and sector-specific industry models. Consequently, IAMs pick up mitigation options slower or later (or not at all) than models which are more technologically detailed. Due to their top-down perspective IAMs to date have not been able to represent the high complexity of industries in terms of the broad variety of technologies and processes (particularly circularity aspects) and to fully reflect the dynamics of the sector. In addition, as energy and carbon price elasticities are still not completely understood, primarily cost-driven models have their limitations. However, there are several ongoing activities to bring more engineering knowledge and technological details into the IAM models (Kermeli et al. 2021).
In addition to the more aggregated discussion, the IAMs illustrative mitigation pathways (IMPs) allow a deeper look into the transformation pathways related to the scenarios. For the illustrative mitigation pathways (IMPs) approach, sets of scenarios have been selected which represent different levels of GHG mitigation ambitions, scenarios which rely on different key strategies or even exclude some mitigation options, represent delayed actions or SDG-oriented pathways. For more detailed information about the selection see Section 3.3.2. Figure 11.12 compares for a selected number of key variables the results of IMPs and puts them in the context of the whole sample of IAMs scenario results for three temperature categories.
Figure 11.12 | Comparison of industry-sector-related CO2 emissions (including process emissions), final energy demand, share of electricity and hydrogen in the final energy mix, and industrial carbon capture and storage (CCS) for different mitigation scenarios representing illustrative mitigation pathways and the full sample of integrated assessment models (IAM) scenario results for three temperature categories (figure based on scenario database). Indicators in the Illustrative Mitigation Pathways (lines) and the 5–95% range of reference, 1.5°C and 2°C scenarios (shaded areas). The selected IMPs reflect the following characteristics: opportunities for reducing demand (IMP-LD; low demand), the role of deep renewable energy penetration and electrification (IMP-Ren; renewables), extensive use of carbon dioxide removal (CDR) in the industry and the energy sectors to achieve net-negative emissions (IMP-Neg), insights into how shifting development can lead to deep emission reductions and achieve sustainable development goals (IMP-SP; shifting pathways), and insights into how slower short-term emissions reductions can be compensated by very fast emission reductions later on (IMP-GS; gradual strengthening). Furthermore, two scenarios were selected to illustrate the consequences of current policies and pledges; these are CurPol (Current Policies) and ModAct (Moderate Action), and are referred to as Pathways Illustrative of Higher Emissions. Source: data are from the AR6 database; only scenarios that pass the vetting criteria are included (Section 3.2).
With growing mitigation ambition final energy demand is significantly lower in comparison of a current policy pathway (CurPol) and a scenario that explores the impact of further moderate actions (ModAct). Based on the underlying assumptions, scenarios IMP-SP and IMP-LD are characterised by the lowest final energy demand, triggered by high energy efficiency improvement rates as well as additional demand side measures, while a scenario with extensive use of CDR in the industry and the energy sectors to achieve net-negative emissions (IMP-Neg) leads to a significant increase in final energy demand. Scenario IMP-GS represents a pathway where mitigation action is gradually strengthened by 2030 compared to pre-COP 26 Nationally Determined Contributions (NDCs) shows the lowest final energy demand. All ambitious IMPs show substantially increasing contributions from electricity, with electricity’s end-use share more than doubling for some of them by 2050 and more than tripling by 2100. The share of hydrogen shows a flatter curve for many scenarios, reaching 5% (IMP-Ren) in 2050 and up to 20% in 2100 for some scenarios (Ren, LD). Those scenarios that have a strong focus on renewable energy electrification show high shares of hydrogen in the sector. In comparison to sector-specific and national studies which show typically a range between 5 and 15% by 2050, many IAM IMPs expect hydrogen to play a less important role. Results for industrial CCS show a broad variety of contributions, with the GS scenario (where hydrogen is not relevant as a mitigation option) representing the upper bound to 2050, with almost 2 GtCO2 yr –1 captured and stored by 2050. Beyond 2050 the upper bound is associated with scenario IMP-Neg associated with extensive use of CDR in the industry and energy sectors to achieve net-negative emissions in the second half of the century – more than 6 GtCO2 yr –1 is captured and stored in 2100 (this represents roughly 60% of 2018 direct CO2 emissions of the sector).
11.4.2.2In-depth Discussion and ‘Reality’ Check of Pathways From Specific Sector Scenarios
Since AR5 a number of studies providing a high technological level of detail for the industry sector have been released which describe how the industry sector can significantly reduce its GHG emissions until the middle of the century. Many of these studies try to specifically reflect the particular industry sector characteristics and barriers that hinder industry to follow an optimal transformation pathway. They vary in respect to different characteristics. In respect to their geographical scope, some studies analyse the prospects for industry sector decarbonisation on a global level (IEA 2017 a; Energy Transitions Commission 2018; Grubler et al. 2018; IEA 2020a, 2019b, 2020c; Tchung-Ming et al. 2018); regional level, for example, European Commission (2018) and Material Economics (2019); or country level – studies for China, from where most industry-related emissions come (e.g., Zhou et al. 2019). 23 In regard to sectoral scope, some studies include the entire industry sector, while others focus on selected GHG emission intensive sectors, such as steel, chemicals and/or concrete. Most of the scenarios focus solely on CO2 emissions, that is non-CO2 emissions of the industrial sector are neglected. 24
Industry sector mitigation studies also differ in regard to whether they develop coherent scenarios or whether they focus on discussing and analysing selected key mitigation strategies, without deriving full energy and emission scenarios. Coherent scenarios are developed in IEA (2017); Energy Transitions Commission (2018); Grubler et al. (2018); Tchung-Ming et al. (2018); IEA (2019b, 2020a,c); IEA (2021a); and IRENA (2021) on the global level, and in Climact (2018); European Commission (2018); and Material Economics (2019) on the European level. Recent literature analysing selected key mitigation strategies, for example IEA (2019b) and Material Economics (2019) has focused either exclusively or to a large extent on analysing the potential of materials efficiency and circular economy measures to reduce the need for primary raw materials relative to a business-as-usual development. The IEA (2021a, 2020a) also provides deep insights in to single mitigation strategies for the industry sector, particularly the role of CCS. The following discussion mainly concentrates on scenarios from the IEA. It has to be acknowledged that they only represent a small segment of the huge scenario family (see the scenario database in Chapter 3), but this approach enables to show the chronological evolution of scenarios coming from the same institution, using the same modelling approach (which allows a technology-rich analytical backcasting approach), but reflect additional requests that emerge over time (Table 11.5). In the 2DS scenario from the ‘Energy Technology Perspectives (ETP)’ study (IEA 2017), which intends to describe in great technological detail how the global energy system could transform by 2060 so as to be in line with limiting global warming to below 2°C, total CO2 emissions are 74% lower in 2060 than in 2014, while only 39% lower in the industry sector. The Beyond 2°C Scenario (B2DS) of the same study intends to show how far known clean energy technologies (including those that lead to negative emissions) could go if pushed to their practical limits, allowing the future temperature increase to be limited to ‘well below’ 2°C and lowering total CO2 emissions by 100% by 2060 and by 75% relative to 2014 in the industry sector.
Technologies penetration assumed in the CTS scenario by 2060 allows for an industrial emission cut of 45% from 2017 levels and a 50% cut against projected 2060 emissions in the Reference Technology Scenario (RTS) from the same study (IEA 2019b), similar to IEA’s 2DS scenario. Energy efficiency improvements and deployment of BATs contribute 46% to cumulative emission reduction in 2018–2060, while fuel switching (15%), material efficiency (19%) and deployment of innovative processes (20%) provide the rest. IEA (2020a,c) which continues the Energy Technology Perspectives series include the new Sustainable Development Scenario (SDS) to describe a trajectory for emissions consistent with reaching global ‘net zero’ CO2 emissions by around 2070. 25 In 2070 the net zero balance is reached through a compensation of the remaining CO2 emissions (fossil fuel combustion and industrial processes still lead to around 3 GtCO2) by a combination of BECCS and to a lesser degree direct air capture and storage. In IEA (2020c) the Faster Innovation Case (FIC) shows a possibility to reach a net zero emissions level globally already in 2050, assuming that technology development and market penetration can be significantly accelerated. Innovation plays a major role in this scenario as almost half of all the additional emissions reductions in 2050 relative to the reference case would be from technologies that are in an early stage of development and have not yet reached the market today (IEA 2020c). The most ambitious IEA scenario NZE2050 (IEA 2021a) describes a pathway reaching net zero emissions at system level by 2050. With 0.52 GtCO2 industry-related CO2 emissions (including process emissions) it ends up 94% below 2018 levels in 2050. Remaining emissions in the industry sector have to be compensated by negative emissions (e.g., via DAC).
Two studies complement the discussion of the IEA scenarios and are related to the IEA database. 26 The ETC Supply Side scenario builds on the ETP 2017 study, investigating additional emission reduction potentials in the emissions-intensive sectors such as heavy industry and heavy-duty transport so as to be able to reach net zero emissions by the middle of the century. The LED scenario (Grubler et al. 2018) also builds on the ETP 2017 study, but focuses on the possible potential of very far-reaching efforts to reduce future material demand.
A comparison of the different mitigation scenarios shows that they depend on how individual mitigation strategies in the industry sector (Figure 11.13) are assessed. The use of CCS, for example, is in many scenarios assessed as very important, while other scenarios indicate that ambitious mitigation levels can be achieved without CCS in the industry sector. CCS plays a major role in the B2DS scenario (3.2 GtCO2 in 2050), the ETC Supply Side scenario (5.4 GtCO2 in 2050) and the IEA (2020a, 2021a) scenarios (e.g., 2.8 Gt CO2 in NZE2050 in 2050, roughly one half of the captured CO2 is related to cement production), while it is explicitly excluded in the LED scenario. In the latter scenario, on the other hand, considerable emission reductions are assumed to be achieved by far-reaching reductions in material demand relative to a baseline development. In other words, the analysed scenarios also suggest that to reach very strong emission reductions from the industry sector either CCS needs to be deployed to a great extent or considerable material demand reductions will need to be realised. Such demand reductions only play a minor role in the 2DS scenario and no role in the ETC Supply Side scenario. The SDS described in IEA (2020a) provides a pathway where both CCS and material efficiency contribute significantly. In SDS material efficiency is a relevant factor in several parts of industry, explicitly steel, cement, and chemicals. Combining the different material efficiency options including a substantial part lifetime extension (particularly of buildings) leads to 29% less steel production by 2070, 26% less cement production, and 25% less chemicals production respectively in comparison to the reference line used in the study (Stated Policy Scenario: STEPS). Sector- or subsector-specific analysis supports the growing role of material efficiency. For the global chemical and petrochemical sector, Saygin and Gielen (2021) point out that circular economy (including recycling) has to cover 16% of the necessary reduction that is needed for the implementation of a 1.5°C scenario.
Figure 11.13 | Potentials and costs for zero-carbon mitigation options for industry and basic materials: CIEL– carbon intensity of electricity for indirect emissions; EE – energy efficiency; ME – material efficiency; Circularity – material flows (clinker substituted by coal fly ash, blast furnace slag or other by-products and waste, steel scrap, plastic recycling, etc. ); FeedCI – feedstock carbon intensity (hydrogen, biomass, novel cement, natural clinker substitutes); FSW+El – fuel switch and processes electrification with low-carbon electricity. Ranges for mitigation options are shown based on bottom-up studies for grouped technologies packages, not for single technologies. In circles, contribution to mitigation from technologies based on their readiness are shown for 2050 (2040) and 2070. Direct emissions include fuel combustion and process emissions. Indirect emissions include emissions attributed to consumed electricity and purchased heat. For basic chemicals only methanol, ammonia and high-value chemicals are considered. The total for industry doesn’t include emissions from waste. Base values for 2020 for direct and indirect emissions were calculated using 2019 GHG emission data (Crippa et al. 2021) and data for materials production from World Steel Association (2020a) and IEA (2021d). Negative mitigation costs for some options like Circularity are not reflected. Data from sources: Pauliuk et al. (2013a); Fawkes et al. (2016); WBCSD (2016); Bazzanella and Ausfelder (2017); IEA (2018a, 2019b,g,h, 2020a,c, 2021a); Lehne and Preston (2018); Scrivener et al. (2018); EUROFER (2019); Friedmann et al. (2019); Material Economics (2019); Sandalow et al. (2019); CAT (2020); CEMBUREAU (2020); Gielen et al. (2020); Habert et al. (2020); World Steel Association (2020b); Bataille (2020a); GCCA (2021a); and Saygin and Gielen (2021).
In all scenarios, the relevance of biomass and electricity in industrial final energy demand increases, especially in the more ambitious scenarios NZE2050, SDS, ETC Supply Side and LED. While in all scenarios, electrification becomes more and more important, hydrogen or hydrogen-derived fuels, on the other hand, do not contribute to industrial final energy demand by the middle of the century in 2DS and B2DS, while LED (1% final energy share in 2050) and particularly ETC Supply Side (25% final energy share in 2050) consider hydrogen or hydrogen-derived fuels as a significant option. In the updated IEA scenarios hydrogen and hydrogen-based fuels already play a more important role. In the SDS share in industry, final energy is around 10% (IEA 2020a) and in the Faster Innovation Case around 12% (IEA 2020c) in 2050. In the latter case this is based on the assumption that by 2050 on average each year 22 hydrogen-based steel plants come into operation (IEA 2020c). In SDS around 60% of the hydrogen is produced on-site via water electrolysis while the remaining 40% is generated in fossil fuel plants (methane reforming) coupled with CCS facilities. In the NZE2050 scenario biomass/biomethane (13%/3%), hydrogen (3%), natural gas with CCUS (4%), and coal with CCUS (4%) are responsible for 27% of the final energy demand of the sector. This is much more than in 2018, starting here from roughly 6% (only biomass). Direct use of electricity still plays a bigger role in the analysis, as share of electricity increases in NZE2050 from 22% in 2018 to 28% in 2030 and 46% in 2050 (with 15% a part of the electricity is used to produce hydrogen). This is reflecting the effect that since the publication of older IEA reports more direct electric applications for the sector become available. In NZE2050 approximately 25% of total heat used in the sector is electrified directly with heat pumps or indirectly with synthetic fuels already by 2030.
For B2DS it is assumed that most of the available abatement options in the industry sector are pushed to their feasible limits. That leads to cumulative direct CO2 emissions reductions compared to 2DS which come from: energy efficiency improvements and BAT deployment (42%), innovative processes and CCS (37%), switching to lower carbon fuels and feedstocks (13%), and material efficiency strategies in manufacturing processes (8%). Energy efficiency improvements are particularly important in the first time period.
The IEA World Energy Outlook indicates energy efficiency improvement in the 2020 to 2030 period as a major basis to switch from STEPS (stated policies) to the SDS (net zero emissions by 2070) pathway (IEA 2020i, 2021c). For many energy-intensive industries annual efficiency gains have to be almost doubled (e.g., from 0.6% yr –1 to 1.0% yr –1 for cement production) to contribute sufficiently to the overall goal. If net zero CO2 emissions should be achieved already by 2050 as pursued in the NZE2050 scenario (IEA 2020i, 2021c) further accelerating energy efficiency improvements are necessary (e.g., for cement, annual efficiency gains of 1.75%), leading to the effect that in 2030 many processes are implemented closely to their technological limits. In total, sector final energy demand can be held nearly constant at 2018 levels until 2050 and decoupled from product demand growth.
The comparative analysis leads to the point that the relevance of individual mitigation strategies in different scenarios depends not only on a scenario’s level of ambition. Instead, implicit or explicit assumptions about: (i) the costs associated with each strategy, (ii) future technological progress and availability of individual technologies, and (iii) the future public or political acceptance of individual strategies are likely to be main reasons for the observed differences between the analysed scenarios. For many energy-intensive products, technologies capable of deep emission cuts are already available. Their application is subject to different economic and resources constraints (incremental investment needs, product prices escalation, requirements for escalation of new low-carbon power generation). To fully exploit potential availability of carbon-free energy sources (e.g., electricity or hydrogen and related derivates) is a fundamental prerequisite and marks the strong interdependencies between the industry and the energy sector.
Assessment of the scenario literature allows to conclude that under specific conditions strong CO2-emission reductions in the industry sector by 2050–2070 and even net-zero-emission pathways are possible. However, there is no consensus on the most plausible or most desirable mix of key mitigation strategies to be pursued. In addition it has to be stressed that suitable pathways are very country-specific and depend on the economic structure, resource potentials, technological competences, and political preferences and processes of the country or region in question (Bataille 2020a).
There is a consensus among the scenarios that a significant shift is needed from a transition process in the past mainly based on marginal (incremental) changes (with a strong focus on energy efficiency efforts) to one based on transformational change. To limit the barriers that are associated with transformational change, besides overcoming the valley of death for technologies or processes with breakthrough character, it is required to carefully identify structural change processes which are connected with substantial changes of the existing system (including the whole process chain). This has to be done at an early stage and has to be linked with considerations about preparatory measures which are able to flank the changes and to foster the establishment of new structures (Section 11.6). The right sequencing of the various mitigation options and building appropriate bridges between the different strategies are important. Rissman et al. (2020) proposes three phases of technologies deployment for the industry sector: (i) energy/material efficiency improvement (mainly incremental) and electrification in combination with demonstration projects for new technologies potentially important in subsequent phases (2020–2035), (ii) structural shifts based on technologies which reach maturity in phase (i) such as CCS and alternative materials (2035–2050), (iii) widespread deployment for technologies that are nascent today like molten oxide electrolysis-based steel-making. There are no strong boundaries between the different phases and all phases have to be accompanied by effective policies like R&D programmes and market pull incentives.
Taking the steel sector as an illustrative example, sector-specific scenarios examining the possibility to reach GHG reduction beyond 80% (CAT 2020; Bataille et al. 2021b; IEA 2021a; Vogl et al. 2021b) indicate that robust measures comprise direct reduction of iron (DRI) with hydrogen in combination with efforts to further close the loops and increase availability of scrap metal (reducing the demand for primary steel). As hydrogen-based DRI might not be a fully mature technology before 2030 (depending on further developments of the policy framework and technological progress), risk of path dependencies has to be taken into consideration when reinvestments in existing production capacities will be required in the coming years. For existing plants, implementation of energy efficiency measures (e.g., utilisation of waste heat, improvement of high-temperature pumps) could build a bridge for further mitigation measures but have only limited unexhausted potential. As many GHG mitigation measures are associated with high investment costs and missing operating experience, a step-by-step implementing process might be an appropriate strategy to avoid investment leakage (given the mostly long operation times, investment cycles have to be used so as not to miss opportunities) and to gain experience. In the case of steel, companies can start with the integration of a natural gas-based direct reduced iron furnace feeding the reduced iron to an existing blast furnace, blending and later replacing the natural gas by hydrogen in a second stage, and later transitioning to a full hydrogen DRI EAF or molten oxide electrolysis EAF, all without disturbing the local upstream and downstream supply chains.
It is worth mentioning the flexibility of implementing transformational changes not the least depends on the age profile and projected longevity of existing capital stock, especially the willingness to accept the intentional or market-based stranding of high GHG intensity investments. This is a relevant aspect in all producing countries, but particularly in those countries with a rather young industry structure (i.e., comparative low age of existing facilities on average). Tong et al. (2019) suggest that in China, using the survival rate as a proxy, less than 10% of existing cement or steel production facilities will reach their end of operation time by 2050. Vogl et al. (2021b) argue that the mean blast furnace campaign is considerably shorter than used in Tong et al.(2019), at only 17 years between furnace relining, which suggests there is more room for retrofitting with clean steel major process technologies than generally assumed. Bataille et al. (2021b) found if very low carbon intensity processes were mandatory starting in 2025, given the lifetimes of existing facilities, major steel process lifetimes of up to 27 years would still make a full retrofit cycle with low-carbon processes possible. 27
In general, early adoption of new technologies plays a major role. Considering the long operation time (lifetime) of industrial facilities (e.g., steel mills and cement kilns) early adoption of new technologies is needed to avoid lock-in. For the SDS 2020 scenario, the IEA (2020h) calculated the potential cumulative reduction of CO2 emissions from the steel, cement and chemicals sector to be around 57 GtCO2 if production technology is changed at its first mandatory retrofit, typically 25 years, rather than at 40 years (typical retrofitted lifetime) (Figure 11.14). Net zero pathways require that the new facilities are based on zero- or near-zero emissions technologies from 2030 onwards (IEA 2021c).
Another important finding is that material efficiency and demand management are still not well represented in the scenario literature. Besides IEA (2020a) two of the few exceptions are Material Economics (2019) for the EU and Zhou et al. (2019) for China. Zhou et al. (2019) describe a consistent mitigation pathway (Reinventing Fire scenario) for China where in 2050 CO2 emissions are at a level 42% below 2010 emissions. Around 13% of the reduction is related to less material demand, mainly based on extension of building and infrastructure lifetime, as well as reduction of material losses in the production process and application of higher quality materials particularly high-quality cement (Zhou et al. 2019). For buildings and cars, Pauliuk et al. (2021) analysed the potential role of material efficiency and demand management strategies on material demand to be covered by the industry sector.
For the four subsectors in industry with high emissions, Table 11.5 shows results from Material Economics (2019) for the EU. The combination of circularity, material and energy efficiency, fossil and waste fuels mix, electrification, hydrogen, CCS and biomass use varies from scenario to scenario with none of these options ignored, but trade-offs are required.
Table 11.5 | Contribution to emission reduction of different mitigation strategies for net zero emissions pathways (range represents three different pathways for the industry sector in Europe; each related scenario focuses on different key strategies). 27
Steel | Plastics | Ammonia | Cement | |
Contribution to emission reduction (%) (range represents the three different pathways of the study) | ||||
Circularity | 5–27 | 15-28 | 13–22 | 10–44 |
Energy efficiency | 5–23 | 2–9 | 25–84 | 1–5 |
Fossil fuels and waste fuels | 9–41 | 0–27 | 0–51 | |
Decarbonised electricity | 36–59 | 16–22 | 29–71 | |
Biomass for fuel or feedstock | 5–9 | 18–22 | 0–9 | |
End-of-life plastic | 16–35 | |||
CCS | 5–34 | 0–31 | 0–57 | 29–79 |
Required electrification level | ||||
Growth of electricity demand (times compared with 2015) | 3–5 | 3–4 | 2–5 | |
Investments and production costs escalation | ||||
Investment needs growth (% versus BAU) | 25–65 | 122–199 | 6–26 | 22–49 |
Cost of production (% versus BAU) | +2–20 | +20–43 | +15–111 | +70–115 |
Source: Material Economics (2019).
The analysis of net zero emission pathways requires significantly higher investments compared to business as usual (BAU): 25–65% for steel, 6–26% for ammonia, 22–49% for cement, and with 122–199% the highest number for plastics (Material Economics 2019).
While sector-specific cost analyses are rare in general, there are scenarios indicating that pathways to net zero CO2 emissions in the emissions-intensive sectors can be realised with limited additional costs. According to the Energy Transitions Commission (2018), deep decarbonisation from four major industry subsectors (plastics, steel, aluminium and cement) is achievable on a global level with cumulative incremental capital investments (2015–2050) limited to about 0.1% of aggregate GDP over that period. UKCCC (2019a) assesses that total incremental costs (compared to a theoretical scenario with no climate change policy action at all) for cutting industrial emissions by 90% by 2050 is 0.2% of expected 2050 UK GDP (UKCCC 2019a). The additional investment is 0.2% of gross fixed capital formation (Material Economics 2019). The IEA (2020a) indicates the required annual incremental global investment in heavy industry is approximately 40 billion 2019USD yr –1 moving from STEPS to the SDS scenario (2020–2040), rising to USD55 billion yr –1 (2040–2070), effectively 0.05–0.07% of global annual GDP today.
Finally, a new literature is emerging, based on the new sectoral electrification, hydrogen- and CCS- based technologies listed in previous sections, considering the possibility of rearranging standard supply and process chains using regional and international trade in intermediate materials like primary iron, clinker and chemical feedstocks, to reduce global emissions by moving production of these materials to regions with large and inexpensive renewable energy potential or CCS geology (Bataille 2020a; Gielen et al. 2020; Bataille et al. 2021a; Saygin and Gielen 2021).
In a sequence of sectoral- and industry-wide figures above (Figure 11.13), it is shown – starting in the present on the left and moving through 2050 to 2070 on the right, how much separate mitigation strategies can contribute and how they are integrated in the literature to reach near-zero emissions. For cement, steel and primary chemicals GHG intensities are presented, and for all industry absolute GHG emissions are displayed. Effects of the following mitigation strategies are reflected: energy efficiency, material efficiency, circularity/recycling, feedstock carbon intensity, fuel switching, CCU and CCS. Contributions of technologies split by their readiness for 2050 and 2070 are provided along with ranges of mitigation costs for achieving near-zero emissions for each strategy, accompanied by ranges of associated basic materials cost escalations and driven by these final products’ prices increments.
Table 11.4 | Perspectives on industrial sector mitigation potential (comparison of different IEA scenarios).
Reduction of direct CO2 emissions | Scenario assumptions a | IEA (2017, 2020c,i, 2021a) | IEA (2020a,c) | |||
2030 | 2050 | 2060 | 2050 | 2070 | ||
Baseline direct emissions from industrial sector | ||||||
Reference Technology Scenario (RTS) | Industry sector improvements in energy consumption and CO2 emissions are incremental, in line with currently implemented and announced policies and targets. | 9.8 GtCO2 | 10.4 GtCO2 | 9.7 GtCO2 | ||
Emissions reduction potential | ||||||
2°C Scenario (2DS) | Assumes the decoupling of production in industry from CO2-emissions growth across the sector that would be compatible with limiting the rise in global mean temperature to 2°C by 2100. | –7% vs 2014a –20% vs RTSb | –39% vs 2014b –50% vs RTSb | |||
Beyond 2°C Scenario (B2DS) | Pushes the available CO2 abatement options in industry to their feasible limits in order to aim for the ‘well below 2°C’ target. | –28% vs 2014 –38% vs RTS | –75% vs 2014 –80% vs RTS | |||
Clean Technology Scenario (CTS) | Strong focus on clean technologies. Energy efficiency and deployment of BATs contribute 46% to cumulative emission reduction in 2018–2060; fuel switch –15%; material efficiency – 19%; deployment of innovative processes – 20%. | 5 Gt CO2 or –45% vs 2017 level and –50% from 2060 RTS level | ||||
Sustainable Development Scenario 2020 (SDS 2020) | Leads to net zero emissions globally by 2070. Remaining emissions in some sectors (including industry) in 2070 will be compensated by negative emissions in other areas (e.g., through BECCS and DAC). | ~ 4.0 GtCO2 | ~ 0.6 GtCO2 | |||
Net zero emissions (NZE, 2021) | Net zero emissions across all sectors are reached already by 2050. | –23% (i.e., 2.1 GtCO2) vs 2018. | –94% (i.e., 8.4 GtCO2) vs 2018 | |||
Faster Innovation Case (FIC) | Achieves net-zero emissions status already by 2050 based on accelerated development and market penetration of technologies which have currently not yet reached the market. | 0.8 Gt CO2 (mainly steel and chemical industry) | ||||
aBased on bottom-up technology modelling of five energy-intensive industry subsectors (cement, iron and steel, chemicals and petrochemicals, aluminium, and pulp and paper).
bIndustrial direct CO2 emissions reached 8.3 GtCO2in 2014, 24% of global CO2 emissions.
Source: IEA (2017, 2019b, 2020a, 2020c,i, 2021a).
11.4.3 Cross-sectoral Interactions and Societal Pressure on Industry
Mitigation involves greater integration and coupling between sectors. This is widely recognised, for example, in the case of electrification of transport (Sections 6.6.2 and 10.3.1), but it has been less explored for industrial decarbonisation. Industry is a complex web of subsectors and intersectoral interaction and dependence, with associated mitigation opportunities and co-benefits and costs (OECD 2019b; Mendez-Alva et al. 2021). Implementation of the mitigation options assessed in Section 11.3 will result in new sectoral couplings, value chains, and business models but also in the phasing out of old ones. Notably, electrification in industry, hydrogen and sourcing of non-fossil carbon involves profound changes to how industry interacts with electricity systems and how industrial subsectors interact. For example, the chemicals and forestry industries will become much more coupled if various forms of biogenic carbon become an important feedstock for plastics (Figure 11.10). Clinker substitution with blast furnace slag in the cement industry is a well-established way of reducing CO2 emissions (Fechner and Kray 2012), but this slag will no longer be available if blast furnaces are phased out. Furthermore, additional material demand resulting from mitigation in other sectors, as well as adaptation and the importance of material efficiency improvements, are issues that have attracted increasing attention since AR5 (IEA 2019b; Bleischwitz 2020; Hertwich et al. 2020). How future material will be affected under different climate scenarios is underexplored and typically not accounted for in modelling (Bataille et al. 2021a).
Using industrial waste heat for space heating, via district heating, is an established practice that still has a large potential with large quantities of low-grade heat being wasted (Fang et al. 2015). For Denmark it is estimated that 5.1% of district heating demand could be met with waste heat (Bühler et al. 2017) and for four towns studied in Austria 3–35% of total heat demand could be met (Karner et al. 2016). A European study shows that temporal heat demand flexibility could allow for up to 100% utilisation of excess heat from industry (Karner et al. 2018). A study of a Swedish chemicals complex estimated that 30–50% of excess heat generated on-site could be recovered with payback periods below three years (Eriksson et al. 2018).
A European study found that most of the industrial symbiosis or clustering synergies today are in the chemicals sector with shared streams of energy, water, and carbon dioxide (Mendez-Alva et al. 2021). For future mitigation, the UKCCC (2019b) finds that industrial clustering may be essential for achieving the necessary efficiencies of scale and to build the infrastructure needed for industrial electrification; carbon capture, transport and disposal; hydrogen production and storage; heat cascading between industries and to other potential heat users (e.g., residential and commercial buildings).
With increasing shares of renewable electricity production there is a growing interest in industrial demand response, storage and hybrid solutions with on-site PV and combined heat and power (CHP) (Shoreh et al. 2016; Scheubel et al. 2017; Schriever and Halstrup 2018). With future industrial electrification, and in particular with hydrogen used as reduction agent in iron-making or as feedstock in the chemicals industry, the level of interaction between industry and power systems becomes very high. Large amounts of coking coal, or oil and gas as petrochemical energy and feedstock, are then replaced by electricity. For example, Meys et al. (2021) estimates a staggering future electricity demand of 10,000 TWh in a scenario for a net zero emissions plastics production of 1100 Mt in 2050 (see Section11.3.5 for other estimates of electricity demand). Much of this electricity is used to produce hydrogen to allow for CCU and this provides a very large potential flexible demand if electrolysers are combined with hydrogen storage. Vogl et al. (2018) describe how hydrogen DRI and EAF steel plants can be highly flexible in their electricity demand by storing hydrogen or hot-briquetted iron and increasing the share of scrap in EAF. The IEA (2019f) Future of Hydrogen report suggests that hydrogen production and storage networks could be in locations with already existing hydrogen production and storage, for example, chemical industries, and that these could be ideal for system load balancing and demand response, and in the case of district heating systems – for heat cascading.
The climate awareness that investors, shareholders, and customers demand from companies has been increasing steadily. It is reflected in the growing number of environmental management, carbon footprint accounting, benchmarking and reporting schemes (e.g., the Carbon Disclosure Project, Task Force on Climate-Related Financial Disclosures, Environmental Product Declarations, and others, e.g., Qian et al. 2018) requiring companies to disclose both direct and indirect GHG emissions, and creating explicit (for regulatory schemes) as well as implicit GHG liabilities. This requires harmonised and widely accepted methods for environmental and carbon footprint accounting (Bashmakov et al. 2021b). From an investor perspective there are both physical risks (e.g., potential damages from climate change to business) and transition risks (e.g., premature devaluation of assets driven by new policies and technologies deployment and changes in public and private consumer preferences (NGFS 2019a)). Accompanied by reputational risks this leads to increased attention to Sustainable and Responsible Investment (SRI) principles and increased demands from investors, consumers and governments on climate and sustainability reporting and disclosure (NGFS 2019b). For example, Japan’s Keidanren promotes a scheme by different industries to reduce GHG through the global value chain, including material procurement, product-use stages, and disposal, regardless of geographical origin, with provided quantitative visualisation (Keidanren (Japan Business Federation) 2018). The EU adopted a non-financial disclosure directive in 2014 (Kinderman 2020) and a Taxonomy for Sustainable Finance in 2019 (Section 15.6.1).
11.4.4Links to Climate Change and Adaptation
Sectors that are particularly vulnerable to climate change include agriculture, forestry, fisheries and aquaculture, and their downstream processing industries (Bezner et al. 2021). Many of the energy-intensive industries are located based on access to fresh water (e.g., pulp and paper) or sea transport (e.g., petrochemicals). Risks of major concern for industry include disrupted supply chains and energy supplies due to extreme weather events, as well as risks associated with droughts, floods with dirty water, sea level rise and storm surges (Dodman et al. 2021). Adaptation measures may in turn affect the demand for basic materials (e.g., steel and cement), for example, increased demand to build sea walls and protect infrastructure, but we have not found any estimates of the potential demand. Increased heat stress is unsafe for outdoor labourers and can reduce worker productivity, for example, in outdoor construction, resource extraction and waste handling (Ranasinghe et al. 2021).
11.5Industrial Infrastructure, Policy, and Sustainable Development Goal Contexts
11.5.1Existing Industry Infrastructures
Countries are at different stages of different economic development paths. Some are already industrialised, while developing and emerging economies are on earlier take-off stages or accelerated growth stages and have yet to build the basic infrastructure needed to allow for basic mobility, housing, sanitation, and other services (Section11.2.3). The available in-use stock of material per capita and in each country therefore differs significantly, and transition pathways will require a different mix of strategies, depending on each country’s material demand to build, maintain, and operate stock of long-lived assets. Industrialised economies have much greater opportunities for reusing and recycling materials, while emerging economies have greater opportunities to avoid carbon lock-in. The IEA projected that more than 90% of the additional 2050 production of key materials will originate in non-OECD countries (IEA 2017). As incomes rise in emerging economies, the industry sector will grow in tandem to meet the increased demand for the manufactured goods and raw materials essential for infrastructure development. The energy and feedstocks needed to support this growth are likely to constitute a large portion of the increase in the emerging economies’ GHG emissions in the future unless new low-carbon pathways are identified and promoted.
Emissions are typically categorised by the territory, subsector or group of technologies from which they emanate. An alternative subdivision is that between existing sources that will continue to generate emissions in the future, and those that are yet to be built (Erickson et al. 2015). The rate of emissions from existing assets will eventually tend to zero, but in a timeframe that is relevant to existing climate and energy goals, the cumulative contribution to emissions from existing infrastructure and equipment is likely to be substantial. Aside from the magnitude of the contribution, the distinction between emissions from existing and forthcoming assets is instructive because of the difference in approach to mitigation that may be necessary or desirable in each instance to avoid getting locked into decades of highly carbon-intensive operations (Lecocq and Shalizi 2014).
Details of the methodologies to assess ‘carbon lock-in’ or ‘committed emissions’ differ across studies but the core components of the approaches adopted are common to each: an account of the existing level of emissions for the scope being assessed is established; this level is projected forward with a stylised decay function that is informed by assessments of the current age and typical lifetimes of the underlying assets. From this, a cumulative emissions estimate is calculated. The future emissions intensity of the operated assets is usually assumed to remain constant, implying that nothing is done to retrofit with mitigating technologies (e.g., carbon capture) or alter the way in which the plant is operated (e.g., switching to an alternative fuel or feedstock). While the quantities of emissions derived are often referred to as ‘committed’ or ‘locked-in’, their occurrence is of course dependent on a suite of economic, technology and policy developments that are highly uncertain.
Data on the current age profile and typical lifetimes of emissions-intensive industrial equipment are difficult to procure and verify and most of the studies conducted in this area contain little detail on the global industrial sector. Two recent studies are exceptions, both of which cover the global energy system, but contain detailed and novel analysis on the industrial sector (Tong et al. 2019; IEA 2020a). Tong et al. (2019) use unit-level data from China’s Ministry of Ecology and Environment to obtain a more robust estimate of the age profile of existing capacity in the cement and iron and steel sectors in the country. The IEA (2020a) uses proprietary global capacity datasets for the iron and steel, cement and chemicals sectors, and historic energy consumption data for the remaining industry sectors as a proxy for the rate of historic capacity build-up.
Both studies come to similar estimates on the average age of cement plants and blast furnaces in China of around 10–12 years old, which are the figures for which they have overlapping coverage. Both studies also use the same assumption of the typical lifetime of assets in these sectors of 40 years, whereas the IEA (2020a) study uses 30 years for chemical sector assets and 25 years for other industrial sectors. The studies come to differing estimates of cumulative emissions by 2050 from the industry sector; 196 GtCO2 in the IEA (2020a) study, and 162 GtCO2 in the Tong et al. (2019) study. This difference is attributable to a differing scope of emissions, with the IEA (2020a) study including industrial process emissions (which for the cement sector in particular are substantial) in addition to the energy-related emissions quantities accounted for in the Tong et al. (2019) study. After correcting for this difference in scope, the emissions estimates compare favourably.
The IEA (2020a) study provides supplementary analysis for the industry sector, examining the impact of considering investment cycles alongside the typical lifetimes assumed in its core analysis of emissions from existing industrial assets. For three heavy industry sectors – iron and steel, cement, and chemicals – the decay function applied to emissions from existing assets is re-simulated using a 25-year investment cycle assumption (Figure 11.14). This is 15 years shorter than the typical lifetimes assumed for assets in the iron and steel and cement sectors, and five years shorter than that considered for the chemical sector. The shorter timeframe for the investment cycle is a simplified way of representing the intermediate investments that are made to extend the life of a plant, such as the re-lining of a blast furnace, which can occur multiple times during the lifetime of an installation. These investments can often be similar in magnitude to that of replacing the installation, and they represent key points for intervention to reduce emissions. The findings of this supplementary analysis are that around 40%, or 60 GtCO2, could be avoided by 2050 if near-zero emissions options are available to replace this capacity, or units are retired, retrofitted or refurbished in a way that significantly mitigates emissions (e.g., retrofitting carbon capture, or fuel or process switching to utilise bioenergy or low-carbon hydrogen).
Figure 11.14 |CO2 emissions from existing heavy industrial assets in the NZE. Source: International Energy Agency (2021), Net Zero by 2050, IEA, Paris.
As this review was being finalised several papers were released that somewhat contradict the Tong et al. (2010) results (Bataille et al. 2021b; Vogl et al. 2021b). Broadly speaking, these papers argue that while high-emitting facilities may last for a long time, be difficult to shut down early, and are inherent to local boarder supply chains, individual major processes that are currently highly GHG intense, such as blast furnaces and basic oxygen smelters, could be retired and replaced during major retrofits on much shorter time cycles of 15 to 25 years.
The cost of retrofitting or retiring a plant before the end of its lifetime depends on plant-specific conditions as well as a range of economic, technology and policy developments. For industrial decarbonisation it may be a greater challenge to accelerate the development and deployment of zero-emission technologies and systems than to handle the economic costs of retiring existing assets before end of life. The ‘lock-in’ also goes beyond the lifetime of key process units, such as blast furnaces and crackers, since they are typically part of large integrated plants or clusters with industrial symbiosis, as well as infrastructures with feedstock storage, ports, and pipelines. Individual industrial plants are often just a small part of a complex network of many facilities in an industrial supply chain. In that sense, current assessments of ‘carbon lock-in’ rely on simplifications due to the high the complexity of industry.
Conditions are also subsector and context specific in terms of mitigation options, industry structures, markets, value chains and geographical location. For example, the hydrogen steel-making joint venture in Sweden involves three different companies headquartered in Sweden (in mining, electricity and steel-making, respectively), two of which are state-owned, with a shared vision and access to iron ore, fossil-free electricity and high-end steel markets (Kushnir et al. 2020). In contrast, chemical clusters may consist of several organisations that are subsidiaries to large multinational corporations with headquarters across the world, that also compete in different markets. Even in the presence of a local vision for sustainability this makes it difficult to engage in formalised collaboration or get support from headquarters (Bauer and Fuenfschilling 2019).
Furthermore, it is relevant to consider also institutional and behavioural lock-in (Seto et al. 2016). On one side, existing high-emitting practices may be favoured through formal and informal institutions (e.g., regulations and social norms or expectations, respectively), for example, around building construction and food packaging. On the other side, mitigation options may face corresponding institutional barriers. Examples include how cars are conventionally scrapped (i.e., crushed, leading to copper contamination of steel) rather than being dismantled, or slow permitting procedures for new infrastructure and industrial installations for reducing emissions.
11.5.2Current Industrial and Broader Policy Context
The basic motivation for industrial policy historically has been economic development and wealth creation. Industrial policy can be progressive and promote new developments or be protective to help infant or declining industries. It may also involve the phase-out of industries, including efforts to retrain workers and create new jobs. Industrial policy is not one policy intervention but rather the combined effects of many policy instruments that are coordinated towards an industrial goal. Industrial policies can be classified as being either vertical or horizontal depending on whether singular sectors or technologies are targeted (e.g., through R&D, tariffs and subsidies) or the whole economy (e.g., education, infrastructure, and general tax policies). The horizontal policies are not always thought of as industrial policy, although taking a broad view, including policy coordination and institution building, is important for industrial policy to be effective (see e.g., Andreoni and Chang 2019).
In the past ten years there has been increasing interest and attention to industrial policy. One driver is the desire to retain industry or re-industrialise in regions within Europe and North America where industry has a long record of declining shares of GDP. The need for economic growth and poverty eradication is a key driver in developing countries. An important aspect is the need to meet the ‘dual challenge of creating wealth for a growing population while staying within planetary boundaries’ (Altenburg and Assman 2017). The need for industrial policy that supports environmental goals and green growth has been analysed by Rodrik (2014); Aiginger (2014); Warwick (2013); and Busch et al. (2018). Similar ideas are taken up in OECD reports on green growth (OECD 2011) and system innovation (OECD 2015). However, these approaches to green industrial policy and innovation tend to focus on opportunities for manufacturing industries to develop through new markets for cleaner technologies. They rarely include explicit attention to the necessity of zero emissions and the profound changes in production, use and recycling of basic materials that this entails. This may also involve the phase-out or repurposing of industries that currently rely on fossil fuels and feedstock.
The policy implications of zero emissions for heavy industries are relatively unexplored, although some analyses in this direction are available (e.g., Åhman et al. 2017; Philibert 2017a; Wesseling et al. 2017; Bataille et al. 2018a; Wyns et al. 2019; Bataille 2020a; Fan and Friedmann 2021). For industry, there has been a long time focus on energy efficiency policies through voluntary and negotiated agreements, energy management and audit schemes, and various programmes targeting industry (Fischedick et al. 2014 a). Since AR5, interest in circular economy policies has increased and they have become more prevalent across regions and countries, including the EU, China, USA., Japan and Brazil (e.g., McDowall et al. 2017; Ranta et al. 2018; Geng et al. 2019). For electrification and CCUS, efforts are nascent and mainly focused on technology development and demonstrations. Policies for demand reduction and materials efficiency are still relatively unexplored (e.g., Pollitt et al. 2020 and IEA 2019b). Since zero emissions in industry is a new governance challenge it will be important to build awareness and institutional capacity in industrialised as well as developing countries.
In the context of climate change policy, it is fair to say that industry has so far been sheltered from the increasing costs that decarbonisation may entail. This is particularly true for the energy- and emissions-intensive industries where cost increases and lost competitiveness may lead to carbon leakage (i.e., that industry relocates to regions with less stringent climate policies). Heavy industries typically pay no or very low energy taxes and where carbon pricing exists (e.g., in the European Trading Scheme) they are sheltered through free allocation of emission permits and potentially compensated for resulting electricity price increases. For example, Okereke and McDaniels (2012) show how the European steel industry was successful in avoiding cost increases and how information asymmetry in the policy process was important for that purpose.
11.5.3Co-benefits of Mitigation Strategies and Sustainable Development Goals
The deployment of climate change mitigation strategies is primarily influenced by its costs and potential, but also by other broader sustainable development factors such as the Sustainable Development Goals (SDGs). Mitigation actions therefore are to be considered through the prism of impacts on achieving other economic, social and environmental goals. Those impacts are classified as co-benefits when they are positive or as risk when they are negative. Co-benefits can serve as additional drivers, while risks can inhibit the deployment of available mitigation options. Actions taken to mitigate climate change have direct and indirect interactions with SDGs, both positive (synergies) or negative (trade-offs) (Fuso Nerini et al. 2019).
Given the wide range of stakeholders involved in climate actions and their (often contradictory) interests and priorities, the nature of co-benefits and risk can affect decision-making processes and the behaviour of stakeholders (Labella et al. 2020). Co-benefits form an important driver supporting the adoption of mitigation strategies, yet are commonly overlooked in policymaking. Karlsson et al. (2020), based on a review of 239 peer-reviewed articles concluded that diverse co-benefit categories, including air, soil and water quality, diet, physical activity, biodiversity, economic performance, and energy security, are prevalent in the literature.
11.5.3.1 Sustainable Development Goals Co-benefits Through Material Efficiency and Demand Reduction
Material efficiency, an important mitigation option (SDG 13, climate action) for heavy industries, is yet to be fully acknowledged and leveraged (Gonzalez Hernandez et al. 2018a; Sudmant et al. 2018; Dawkins et al. 2019). Material efficiency directly addresses SDG 12 (responsible production and consumption) but also provides opportunities to reduce the pressures and impacts on environmental systems (SDG 6, clean water and sanitation) (Olivetti and Cullen 2018). Exploiting material efficiency usually requires new business models and provides potential co-benefits of increased employment and economic opportunities (SDG 8, decent work and economic growth).
Material efficiency also provides co-benefits through infrastructural development (SDG 9, industry, innovation and infrastructure) (Mathews et al. 2018) to support the wide range of potential material efficiency strategies including light-weighting, reusing, remanufacturing, recycling, diverting scrap, extending product lives, using products more intensely, improving process yields, and substituting materials (Allwood et al. 2011). Worrell et al. (2016) also emphasises how material efficiency improvements, in addition to limiting the impacts of climate change help deliver sustainable production and consumption co-benefits through environmental stewardship. Binder and Blankenberg (2017) and Dhandra (2019) show that sustainable consumption is positively related to life satisfaction and subjective well-being (SDG 3), and Guillen-Royo (2019) adds positive associations with happiness and life satisfaction.
The reduction in excessive consumption and demand for products and services generates a reduction in post-consumption waste and so enhances clear water and sanitation (SDG 6) (Govindan 2018; Minelgaitė and Liobikienė 2019), and reduces waste along product supply chains and lifecycles (SDG 12) (Genovese et al. 2017; UNSD 2020). At the risk side there are possible reductions of employment, incomes, sales taxes from the material extraction and processing activities, considered as excessive for sustainable consumption (Thomas 2003).
11.5.3.2 Sustainable Development Goals Co-benefits From Circular Economy and Industrial Waste
While the circular economy concept first emerged in the context of waste avoidance, resource depletion, closed-loop recycling, etc., it has now evolved as a tool for a broader systemic national policy due to its potential wider benefits (Geng et al. 2013). It represents new circular business models that encourage design for reuse and to improve material recovery and recycling, and so represents a departure from the traditional linear production and consumption systems (with landfilling at the end), with a wide range of potential co-benefits to a wide range of SDGs (Guo et al. 2016; Genovese et al. 2017; Schroeder et al. 2019; UNSD 2020).
Genovese et al. (2017) articulates the advantages from an environmental and responsible consumption and production point of view (SDG 12). Many studies have outlined new business models based on the circular economy that foster sustainable economic growth and the generation of new jobs (SDG 8) (Antikainen and Valkokari 2016), as well as global competitiveness and innovation in business and the industrial sector (Pieroni et al. 2019), such as its potential synergies with industry 4.0 (Garcia-Muiña et al. 2018).
Following a review of the literature, Schroeder et al. (2019) identified linkages between circular economy practices and SDGs based on a relationship scoring system, and highlighted that such SDGs as SDG 6 (clean water and sanitation), SDG 7 (affordable and clean energy), SDG 8 (decent work and economic growth), SDG 12 (responsible consumption and production), and SDG 15 (life on land) all strongly benefit from circular economy practices. With the potential to impact on all stages of the value chain (micro, meso and macro level of the economy), circular economy has also been identified as a key industrial strategy to managing waste across sectors.
Chatziaras et al. (2016) highlights the co-benefit to SDG 7 (affordable and clean energy) resulting from waste-derived fuel for the cement industry. Through the management of industrial waste using circular economy practices, studies such as Geng et al. (2012) and Bonato and Orsini (2017) have pointed out co-benefits to SDGs beyond clear environmental and economic benefits, highlighting how it also benefits SDG 3 and 11 through improved social relations between industrial sectors and local societies, and improved public environmental awareness and public health levels.
11.5.3.3 Sustainable Development Goals Co-benefits From Energy Efficiency
Beyond the very direct links between energy and climate change, reliable, clean, and affordable energy (SDG 7) presents a cross-cutting issue, central to all SDGs and fundamental to development, and energy efficiency enables its provision by reducing the direct supply and necessary infrastructure required. Energy efficiency improvements can be delivered through multiple technical options and tested policies, delivering energy and resource savings simultaneously with other socio-economic and environmental co-benefits. At the macro level, this includes enhancement of energy security (SDG 16, peace, justice and strong institutions) delivered through clean low-carbon energy systems (Fankhauser and Jotzo 2018). Much of the literature, including Sari and Akkaya (2016), Allan et al. (2017) and Garrett-Peltier (2017), points out that energy efficiency improvements deliver superior employment opportunities (SDG 8 – decent work and economic growth), while a limited number of studies have reported that it can negatively impact employment in fuel supply sectors (Costantini et al. 2018).
Many studies report that energy efficiency improvements are essential for supporting overall economic growth, contributing to positive changes in multi-factor productivity (SDGs 8 and 9 – decent work and economic growth and industry, innovation, and infrastructure) (Lambert et al. 2014; Bataille and Melton 2017; Rajbhandari and Zhang 2018; Bashmakov 2019; Stern 2019) through industrial innovation (SDG 9) (Kang and Lee 2016), with some dissent (e.g., Mahmood and Ahmad 2018). Improved energy efficiency against a background of growing energy prices helps industrial plants stay competitive (Bashmakov and Myshak 2018). Energy efficiency allows continued economic growth under strong environmental regulation. Given that energy efficiency measures reduce the combustion of fossil fuels it leads to reduced air pollution at industrial sites (Williams et al. 2012) and better indoor comfort at working places.
Since less energy supply infrastructure is needed in cities and less energy is needed to produce materials such as cement and concrete, and metals, energy efficiency indirectly supports ‘sustainable cities and communities’ (SDG 11) (Di Foggia 2018). In addition, energy efficiency in industry reflects achievements in meeting SDG 12 (responsible consumption and production).
11.5.3.4 Sustainable Development Goals Co-benefits From Electrification and Fuel Switching
A key, generally underappreciated SDG benefit of electrification is improved urban and indoor air quality (at working places as well) and associated health benefits (SDG 3) from clean electrification (SDG 7) of industrial facilities (IEA 2016). With energy being such an important cross-cutting issue to sustainable development, some SDGs, such as SDGs 1, 3, 4 and 5 (Harmelink et al. 2018) are co-beneficiaries to using electrification and fuel switching as a climate action mitigation option.
11.5.3.5 Sustainable Development Goals Co-benefits from Carbon Capture and Utilisation, and Carbon Capture and Storage
CCU and CCS have been identified as playing key roles in the transition of industry to net zero. Advancements in the development and deployment of both CCS and CCU foster climate action (SDG 13). Other co-benefits for CCS include control of non-CO2 pollutants (SDG 3), direct foreign investment and know-how (SDG 9), enhanced oil recovery from existing resources, and diversified employment prospects and skills (SDG 8) (Bonner 2017). For CCU, the main co-benefit related contributions are expected within the context of energy transition processes, and in societal advancements that are linked to technological progress (Olfe-Kräutlein 2020). Therefore, the expectations are that the deployment of CCU technologies would have least potential for meeting the SDG targets relating to society/people, compared with the anticipated contributions to the pillars of ecology and economy.
These mitigation options carry a large number of risks as well. The high cost of the capture and storage process not only limit the technology penetration, but also make energy and products more expensive (risk to SDG 7), potential leaks from undersea or underground CO2 storages carries risks for achieving SDGs 6, 14 and 15. While there are economic costs involved with the deployment of CCS and CCU (Bataille et al. 2018a), there are also significant economic and developmental costs associated with taking no action, because of the potential negative impact of climate change. CCS and CCU have been argued as providing public good (Bergstrom and Ty 2017) and co-benefits to key SDGs (Schipper et al. 2011). On the other hand, Fan et al. (2018) among others have noted the potential lock-in of existing energy structures due to CCS. Refer to Table 17.1 for CCS and CCU co-benefits with respect to other sector chapters.
11.6Policy Approaches and Strategies
Industrial decarbonisation is technically possible on the mid-century horizon, but requires scale up of technology development and deployment, multi-institutional coordination, and sectoral and national industrial policies with detailed subsectoral and regional mitigation pathways and transparent monitoring and evaluation processes (Åhman et al. 2017; Wesseling et al. 2017; Bataille et al. 2018a; Rissman et al. 2020; Nilsson et al. 2021). Transitions of industrial systems entail innovations, plant and technology phase-outs, changes across and within existing value chains, new sectoral couplings, and large investments in enabling electricity, hydrogen, and other infrastructures. Low-carbon transitions are likely to be contested, non-linear and require a multi-level perspective policy approach that addresses a large spectrum of social, political, cultural and technical changes as well as accompanying phase-out policies, and involve a wide range of actors, including civil society groups, local authorities, labour unions and industry associations e(Geels et al. 2017; Rogge and Johnstone 2017; Yamada and Tanaka 2019; Koasidis et al. 2020). See also Cross-Chapter Box 12.
Deployment of the mitigation options presented in this chapter (Sections11.3 and 11.4) needs support from a mix of policy instruments including: GHG pricing coupled with border adjustments or other economic signals for trade-exposed industries; robust government support for research, development, and deployment; energy, material and emissions standards; recycling policies; sectoral technology roadmaps; market pull policies; and support for new infrastructure (Figure 11.15) ( Flanagan et al. 2011; Rogge et al. 2017; Bataille et al. 2018a; Tvinnereim and Mehling 2018; Creutzig 2019; Bataille 2020a; Rissman et al. 2020). The combination of the above will depend on specific sectoral market barriers, technology maturity, and local political and social acceptance (Hoppmann et al. 2013; Rogge and Reichardt 2016). Industrial decarbonisation policies need to be innovative and definitive about net zero CO2 emissions to trigger the level of investment needed for the profound changes in production, use and recycling of basic materials needed (Nilsson et al. 2021). Inclusive and transparent governance that assesses industry decarbonisation progress, monitors innovation and accountability, and provides regular recommendations for policy adjustments is also important for progressing (Mathy et al. 2016; Bataille 2020a).
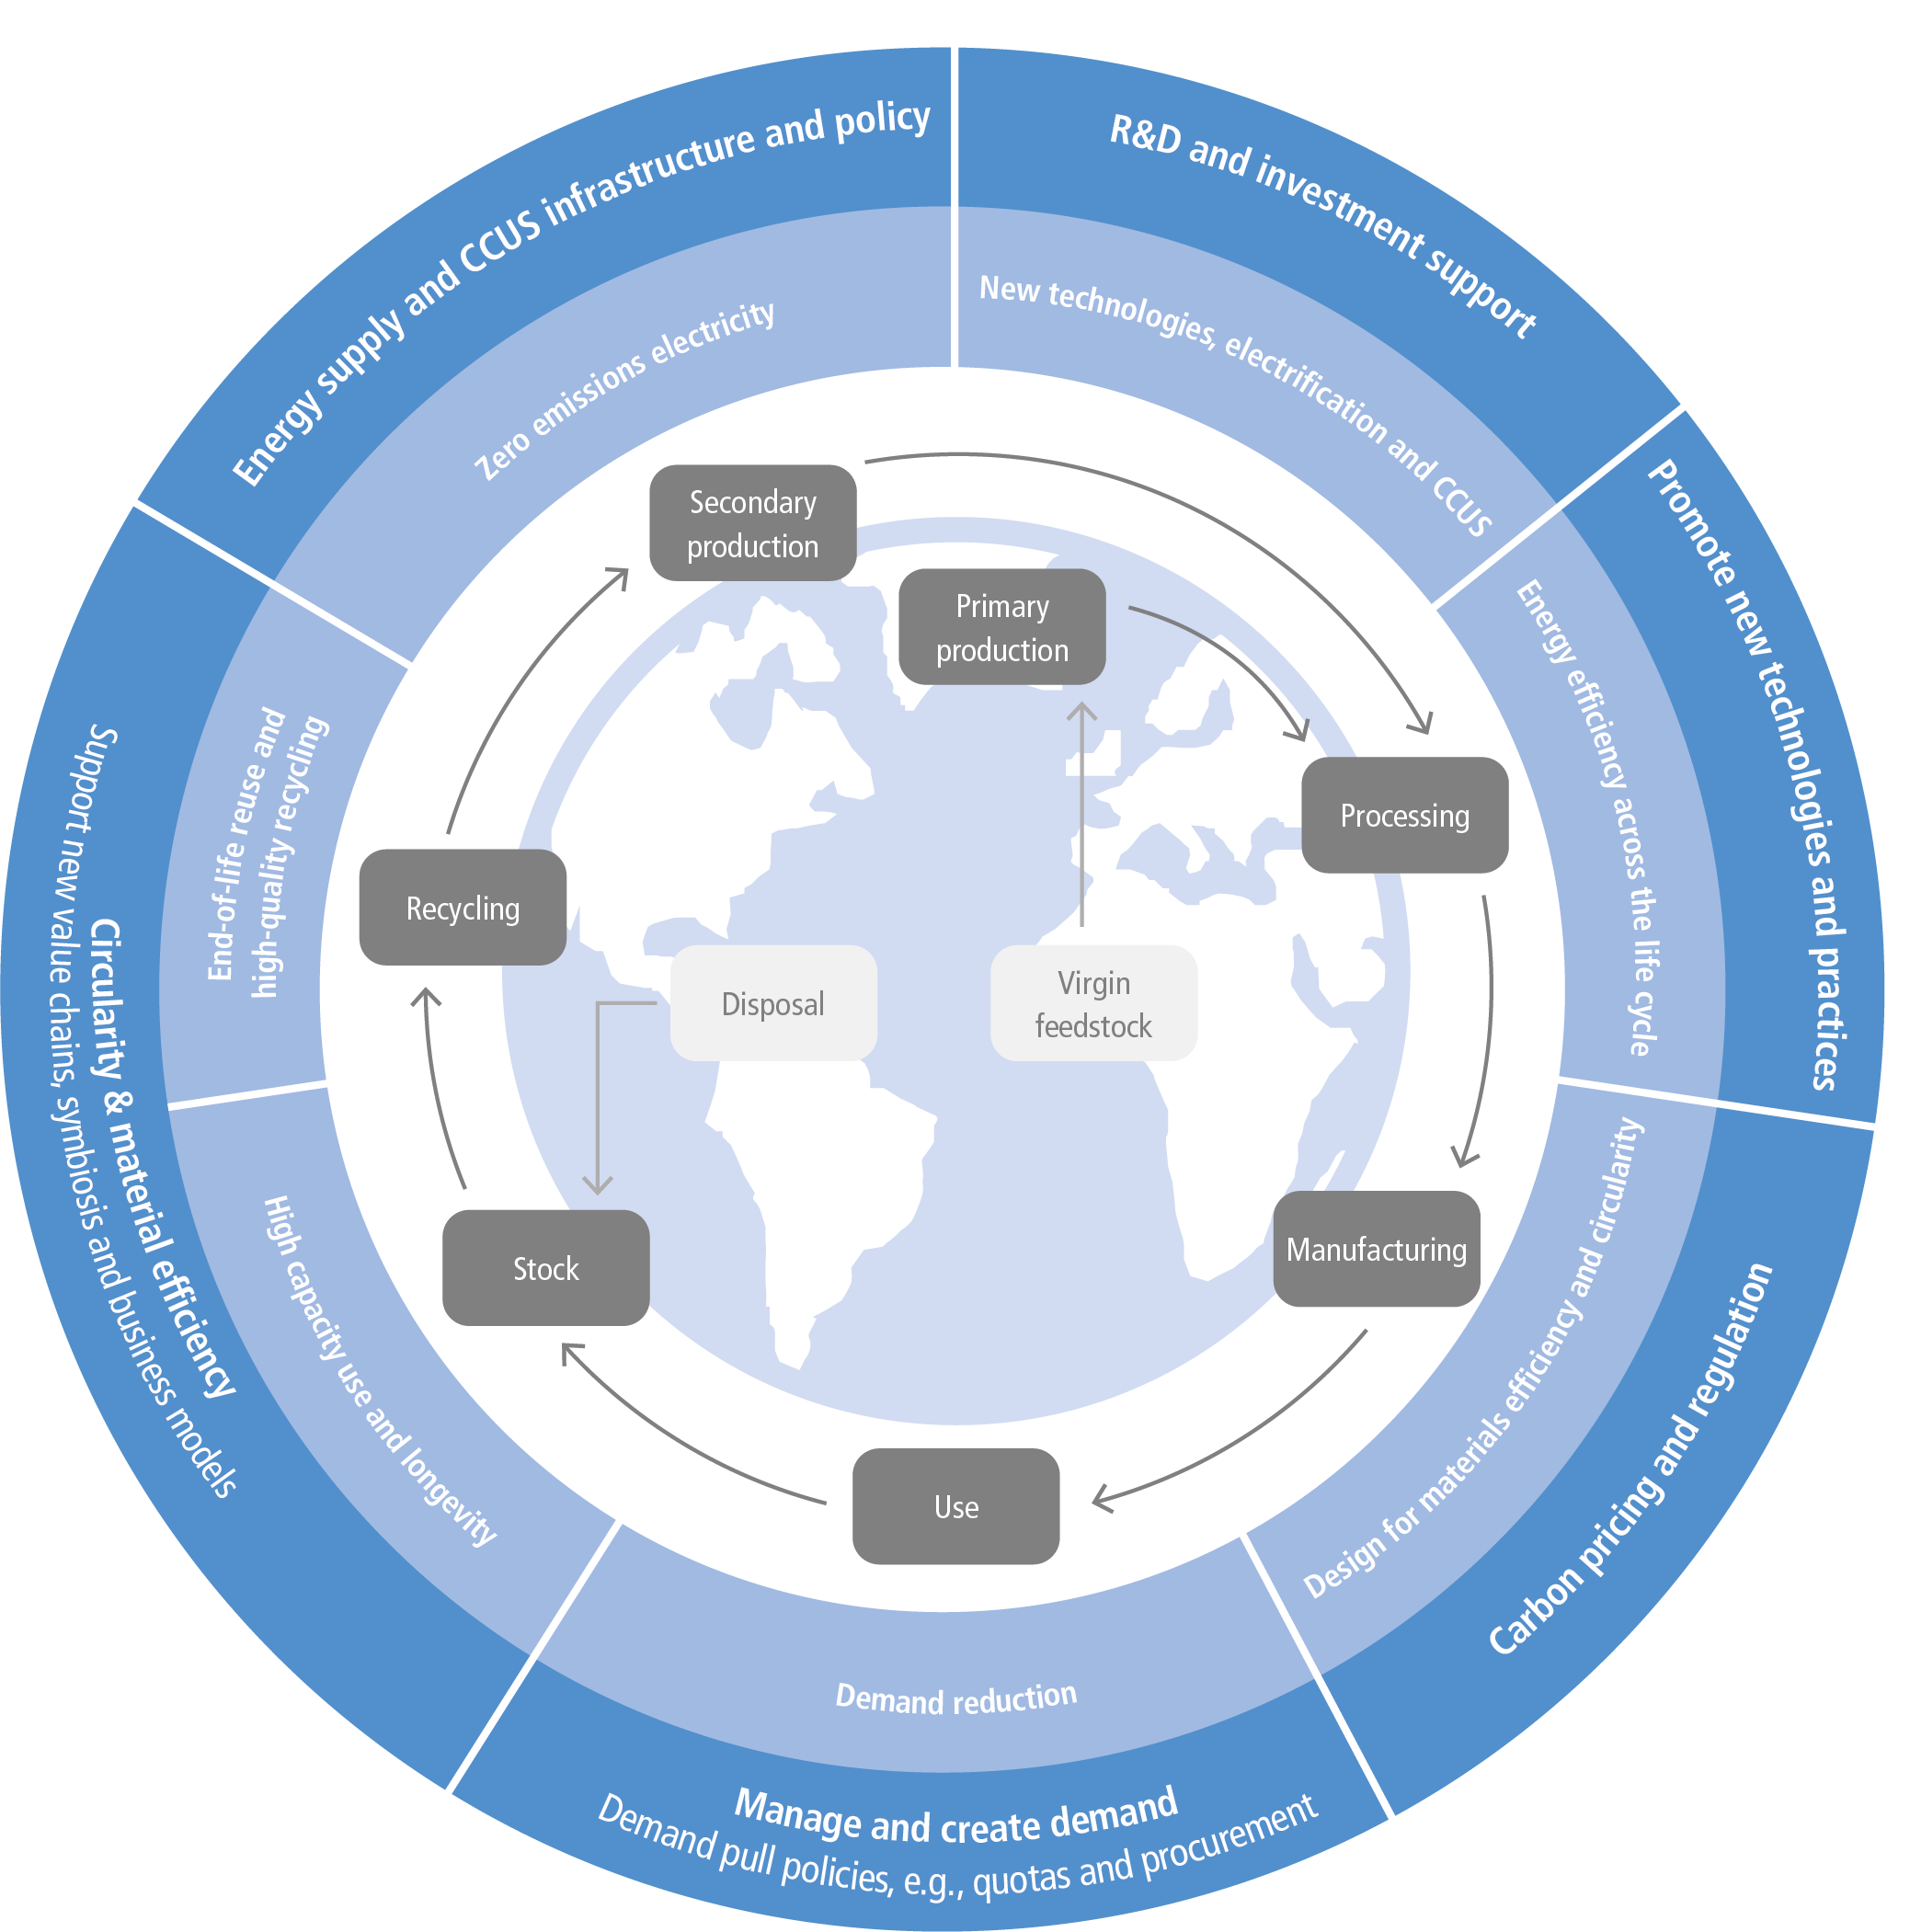
Figure 11.15 | Schematic figure showing the lifecycle of materials (green), mitigation options (light blue) and policy approaches (dark blue).
The level of policy experience and institutional capacity needed varies widely across the mitigation options. In many countries, energy efficiency is a well-established policy field with decades of experience from voluntary and negotiated agreements, regulations, standards, energy audits, and demand-side management (DSM) programmes (see AR5), but there are also many countries where the application of energy efficiency policy is absent or nascent (see AR5) (Tanaka 2011; Fischedick et al. 2014 a; García-Quevedo and Jové-Llopis 2021; Saunders et al. 2021). The application of DSM and load flexibility will also need to grow with electrification and renewable energy integration.
Materials efficiency and circular economy are not well understood from a policy perspective and were for a long time neglected in low-GHG industry roadmaps although they may represent significant potential (Allwood et al. 2011; Gonzalez Hernandez et al. 2018b; IEA 2019b, 2020a; Calisto Friant et al. 2021; Polverini 2021). Material efficiency is also neglected in products design, architectural and civil engineering education, infrastructure and building codes, and urban planning (Section 5.6) (Braun et al. 2018; Orr et al. 2019). For example, the overuse of steel and concrete in construction is well documented but policies or strategies (e.g., design guidelines or regulation) for improving the situation are lacking (Dunant et al. 2018; Shanks et al. 2019). Various circular economy solutions are gaining interest from policymakers with examples such as regulations and economic incentives for repair and reuse, initiatives to reduce planned obsolescence, and setting targets for recycling. Barriers that policies need to address are often specific to the different material loops (e.g., copper contamination for steel and lack of technologies or poor economics for plastics).
There is also a growing interest from policymakers in electrification and fuel switching but the focus has been mainly on innovation and on developing technical production-side solutions rather than on creating markets for enabling demand for low-carbon products, although the concept of green public procurement is gaining traction. The situation is similar for CCU and CCS. Low-carbon technologies adoption represents an additional cost to producers, and this must be handled through fiscal incentives like tax benefits, GHG pricing, green subsidies, regulation and permit procedures. For example, the 45Q tax credit provides some incentives to reduce investor risk for CCS and attract private investment in the USA (Ochu and Friedmann 2021).
Since industrial decarbonisation is only recently emerging as a policy field there is little international collaboration on facilitation (Oberthür et al. 2021). Given that most key materials markets are global and competitive, unless there is much greater global governance to contribute to the decarbonisation of GHG-intensive industry through intergovernmental and transnational institutions it is questionable that the world will achieve industry decarbonisation by 2050.
As GHG pricing, through GHG taxes or cap and trade schemes, has remained a central avenue for climate policy, this section begins with a review of how the industrial sector has been concerned with these instruments. The rest of the section is then structured into five key topics, following insights on key failures that policy must address to enable and support large-scale transformations as well as the need for complementary mixes of policies to achieve this goal (Weber and Rohracher 2012; Rogge and Reichardt 2016; Grillitsch et al. 2019). The section describes how the need to focus on long-term transitions rather than incremental changes can be managed through the planning and strategising of transition pathways; discusses the role of research, development, and innovation policy; highlights the need for enabling low-carbon demand and market creation; reflects on the necessity of establishing and maintaining a level of knowledge and capacity in the policy domain about the industrial transition challenge; and points to the critical importance of coherence across geographical and policy contexts. The section concludes with a reflection on how different groups of actors needs to take up different parts of the responsibility for mitigating climate change in the industrial sector.
11.6.1GHG Prices and GHG Markets
Internalising the cost of GHG emissions in consumer choices and producer investment decisions has been a major strategy promoted by economists and considered by policymakers to mitigate emissions cost-effectively and to incentivise low-GHG innovations in a purportedly technology neutral way (Stiglitz et al. 2017; Boyce 2018). In the absence of a coordinated effort, individual countries, regions and cities have implemented carbon-pricing schemes. As of 23 August 2021, 64 carbon schemes have been implemented or are scheduled by law for implementation, covering 22.5% of global GHG emissions (World Bank 2020), 35 of which are carbon taxes, primarily implemented on a national level and 29 of which are emissions trading schemes, spread across national and sub-national jurisdictions.
Assessments of pricing mechanisms show generally that they lead to reduced emissions, even in sectors that receive free allocation such as industry (Martin et al. 2016; Haites et al. 2018; Narassimhan et al. 2018; Metcalf 2019; Bayer and Aklin 2020). However, questions remain as to whether these schemes can bring emissions down fast enough to reach the Paris Agreement goals (Boyce 2018; Tvinnereim and Mehling 2018; World Bank Group 2019). Most carbon prices are well below the levels needed to motivate investments in high-cost options that are needed to reach net zero emissions (Section 11.4.1.5). Among the 64 carbon-price schemes implemented worldwide today, only nine have carbon prices above USD40 (World Bank 2020). These are all based in Europe and include EU Emissions Trading System (ETS) (above USD40 since March 2021), Switzerland ETS, and seven countries with carbon taxes. Furthermore, emissions-intensive and trade-exposed (EITE) industries are typically allowed exemptions and receive provisions that shelter them from any significant cost increase in virtually all pricing schemes (Haites 2018). These provisions have been allocated due to concerns about loss of competitiveness and carbon leakage which result from relocation and increased imports from jurisdictions with no, or weak, GHG emission regulations (Branger and Quirion 2014a; Branger and Quirion 2014b; Jakob 2021a). Embodied emissions in international trade accounts for one quarter of global CO2 emissions in 2015 (Moran et al. 2018) and has increased significantly over the past few decades, representing a significant challenge to competitiveness related to climate policy. CBAM, or CBA are trade-based mechanisms designed to ‘equalise’ the carbon costs for domestic and foreign producers. They are increasingly being considered by policymakers to address carbon leakage and create a level playing field for products produced in jurisdiction with no, or lower, carbon price (Mehling et al. 2019; Markkanen et al. 2021). On 14 July 2021, the European Commission adopted a proposal for a CBAM that requires importers of aluminium, cement, iron and steel, electricity and fertiliser to buy certificates at the ETS price for the emissions embedded in the imported products (European Commission 2021; Mörsdorf 2021). CBAMs should be crafted very carefully, to meet technical and legal challenges (Jakob et al. 2014; Sakai and Barrett 2016; Rocchi et al. 2018; Cosbey et al. 2019; Joltreau and Sommerfeld 2019; Pyrka et al. 2020). Technical challenges arise because estimating the price adjustment requires reliable data on the GHG content of products imported as well as a clear understanding of the climate policy implications from the countries of imports. Application of pricing tools in industry requires standardisation (benchmarking) of carbon-intensity assessments at products, installations, enterprises, countries, regions, and the global level. The limited number of existing benchmarking systems are not yet harmonised and thus not able to fulfill this function effectively. This limits the scope of products that can potentially be covered by CBAM-type policies (Bashmakov et al. 2021a).
Legal challenges arise because CBAM can be perceived as a protectionist measure violating the principle of non-discrimination under the regulations of the World Trade Organization (WTO). However the absence of GHG prices can also been perceived as a subsidy for fossil fuel-based production (Stiglitz 2006; Al Khourdajie and Finus 2020; Kuusi et al. 2020). Another argument supporting CBAM implementation is the possibility to induce low-GHG investment in non-regulated regions (Cosbey et al. 2019).
Thus far, California is the only jurisdiction that has implemented CBA tariffs applied on electricity imports from neighbouring states and provides insights on how a CBA can work in practice by using ‘default’ GHG emissions intensity benchmarks (Fowlie et al. 2021). CBAM is an approach likely to be applied first to a few selected energy-intensive industries that are at risk of carbon leakage, as the EU is considering. The implementation of CBA needs to balance applicability versus fairness of treatment. An option recently proposed is an individual adjustment mechanism to give companies exporting to the EU the option to demonstrate their actual carbon intensity (Mehling and Ritz 2020). Any CBAMs will have to comply with multilaterally agreed rules under the WTO Agreements to be implemented.
The adoption of CBAM by different countries may evolve into the formation of a climate club where countries would align on specific elements of climate regulation (e.g., primary iron or clinker intensity) to facilitate implementation and incentivise countries to join (Nordhaus 2015; Hagen and Schneider 2021; Tagliapietra and Wolff 2021a,b). However, not all countries have the same abilities to report, adapt and transition to low-carbon production. The implications of CBAMs on trade relationships should be considered to avoid country divide and separation from a common goal of global decarbonisation (Michaelowa et al. 2019; Kuusi et al. 2020; Banerjee 2021; Eicke et al. 2021; Bashmakov 2021). The globalisation of markets and the fragmentation of supply chains complicates the assignment of responsibility for GHG emissions mitigations related to trade (Jakob et al. 2021). Production-based carbon-price schemes minimise the incentives for downstream carbon abatement due to the imperfect pass through of carbon costs and therefore overlook demand-side solutions such as material efficiency (Skelton and Allwood 2017; Baker 2018). An alternative approach is to set the carbon pricing downstream on the consumption of carbon-intensive materials, whether they are imported or produced locally (Neuhoff et al. 2015, 2019; Munnings et al. 2019). However, implementation of consumption-based GHG pricing is also challenged by the need of product GHG traceability and enforcement transaction costs (Jakob et al. 2014; Munnings et al. 2019). Hybrid approaches are also considered (Neuhoff et al. 2015; Bataille et al. 2018a; Jakob et al. 2021). The efficacy of GHG prices to achieve major industry decarbonisation has been challenged by additional real world implementation problems, such as highly regionally fragmented GHG markets (Boyce 2018; Tvinnereim and Mehling 2018) and the difficult social acceptance of price increases (Bailey et al. 2012; Raymond 2019). The higher GHG prices likely needed to incentivise industry to adopt low-GHG solutions pose social equity issues and resistance (Grainger and Kolstad 2010; Bataille et al. 2018b; Hourcade et al. 2018; Huang et al. 2019b; Wang et al. 2019). GHG pricing is also associated with promoting mainly incremental low-cost options and not investments in radical technical change or the transformation of socio-technical systems (Grubb et al. 2014; Vogt-Schilb et al. 2018; Stiglitz 2019; Rosenbloom et al. 2020). Transparent and strategic management of cap-and-trade proceeds toward inclusive decarbonisation transition that support high abatement cost options can contribute toward easing these shortcomings (Carl and Fedor 2016; Raymond 2019). In California, Senate Bill 535 (De León, Statutes of 2012) require that at least a quarter of the proceeds go to projects that provide a benefit to disadvantaged communities (California Climate Investments 2020).
Clear and firm emission reduction caps towards 2050 are essential for sending strong signals to businesses. However, many researchers recognise that complementary policies must be developed to set current production and consumption patterns toward a path consistent with achieving the Paris Agreement goals as cap-and-trade or carbon taxes are not enough (Schmalensee and Stavins 2017; Vogt-Schilb and Hallegatte 2017; Bataille et al. 2018b; Kirchner et al. 2019). In this broader policy context, proceeds from pricing schemes can be used to support the deployment of options with near-term abatement costs that are too high to be incentivised by the prevailing carbon price, but which show substantial cost-reduction potential with scale and learning, and to ensure a just transition (Wang and Lo 2021).
11.6.2Transition Pathways Planning and Strategies
Decarbonising the industry sector requires transitioning how material and products are produced and used today to development pathways that include the strategies outlined in Sections 11.3 and 11.4 and Figure 11.15. Such broad approaches require the development of transition planning that assesses the impacts of the different strategies and considers local conditions and social challenges that may result from conflicts with established practices and interests, with planning and strategies directly linked to these challenges.
Governments have traditionally used voluntary agreements or mandatory energy or emission reduction targets to achieve emission reduction for specific emission-intensive sectors (e.g., UK Climate Change Agreements; India Performance, Achieve and Trade scheme). Sector visions, roadmaps and pathways combined with a larger context of socio-economic goals, with clear objectives and policy direction, are needed for every industrial sector to achieve decarbonisation and at the time of writing they are emerging for some sectors. Grillitsch et al. (2019b) working from the socio-technical transitions literature, focuses on the need for maintaining ‘directionality’ for innovation (e.g., towards net zero transformation), the capacity for iterative technological and policy ‘experimentation’ and learning, ‘demand articulation’ (e.g., engagement of material efficiency and high value circularity), and ‘policy coordination’ as four main framing challenges. Wesseling et al. (2017b) bridges from the socio-technical transitions literature to a world more recognisable by executives and engineers, composed of structural components that include actors (e.g., firms, trade associations, government, research organisations, consumers, etc.), institutions (e.g., legal structures, norms, values and formal policies or regulations), technologies (e.g., facilities, infrastructure) and system interactions.
Several studies (Åhman et al. 2017; Bataille et al. 2018a; Material Economics 2019; Wyns et al. 2019) offer detailed transition plans using roughly the same five overarching strategies: (i) policies to encourage material efficiency and high quality circularity; (ii) ‘supply push’ R&D and early commercialisation as well as ‘demand pull’ to develop niche markets and help emerging technologies cross ‘the valley of death’; (iii) GHG pricing or regulations with competitiveness provisions to trigger innovation and systemic GHG reduction; (iv) long-run, low-cost finance mechanisms to enable investment and reduce risk; (v) infrastructure planning and construction (e.g. CO2 transport and disposal, electricity and hydrogen transmission and storage), and institutional support (e.g., labour market training and transition support; electricity market reform). Wesseling et al. (2017b) and (Bataille et al. 2018a) further add a step to conduct ongoing stakeholder engagements, including stakeholders with effective ‘veto’ power (i.e., firms, unions, government, communities, indigenous groups), to share and gather information, educate, debate, and build consensus for a robust, politically resilient policy package. This engagement of stakeholders can also bring on new supply chain collaborations and bridge the cost pass-through challenge (e.g., the Swedish HYBRIT steel project, or the ELYSIS consortium, with plans to bring fully commercialised inert electrodes for bauxite electrolysis to market by 2024).
Detailed sectoral roadmaps that assess the technical, economic, social and political opportunities and provide a clear path to low-GHG development are needed to guide policy designs. For example, the German state of North Rhine Westphalia passed a Climate Process Law that resulted in the adoption of a Climate Protection Plan that set subsector targets through a transparent stakeholder engagement process based on scenario development and identification of low-GHG options (Lechtenböhmer et al. 2015), see Box 11.3. Another example is the UK set of Industrial Decarbonisation and Energy Efficiency Roadmaps to 2050 as well as the UK Strategic Growth Plan, which are accompanied by Action Plans for each energy-intensive subsector.
Box 11.3 | IN4Cl imate NRW – Initiative for a Climate-friendly Industry in North Rhine-Westphalia (NRW)
IN4Climate NRW (www.in4climate.nrw) was launched in September 2019 by the state government of North Rhine-Westphalia (IN4climate.NRW 2019) as a platform for collaboration between representatives from industry, science and politics. IN4climate.NRW offers a common space to develop innovative strategies for a carbon-neutral industrial sector, bringing together different perspectives and competencies.
North Rhine-Westphalia is Germany’s industrial heartland. Around 19% of North Rhine-Westphalia’s GHGs have their origin in the industry sector. Consequently, the sector bears a particular responsibility when it comes to climate protection, but the state is also a source of high-quality jobs and export value. The NRW government understands that the state’s current competitive advantage can only be maintained if the regional industry positions itself as a front runner for becoming GHG-neutral.
In working together across different branches (more than 30 companies representing mainly steel, cement, chemical, aluminium industry, refineries and energy utilities) and enabling a direct interaction between industry and government officials, IN4Climate provides a benefit to the participating companies. People from the different areas are working together in so-called innovation teams and underlying working groups with a self-organised process of setting their milestones and working schedule while reflecting long-term needs as well as short-term requirements based on political or societal discussions.
The innovation teams aim to identify and set concrete impulses for development and implementation of breakthrough technologies, specify necessary infrastructures (e.g., for hydrogen production, storage and transport) and appropriate policy settings (i.e., integrated state, national and European policy mix). They also include an attempt to create a discourse between the public and the industry sectors as a kind of sounding board for the early detection of barriers and obstacles.
Box 11.3
The initiative has been successful so far, for example, having developed a clear vision for a hydrogen strategy and an associated policy framework as well as a broader decarbonisation strategy for the whole sector. It is present at the national level as well as at the European level. Being successful and unique, IN4Climate is useful as a blueprint for other regions and is often visited by companies and administration staff from other German states.
It is particularly the so far missing intensive and dedicated cooperation across industrial subsectors that can be seen as a success factor. Facing substantial transformation needs associated with structural changes and infrastructure challenges, very often solutions can’t be provided and realised by a single sector but need cooperation and coordination. Even more, chicken-and-egg problems like the construction of new infrastructures (e.g., for hydrogen and CO2 disposal) require cooperation and new modes of collaboration. IN4Climate provides the necessary link for this.
11.6.3Technological Research, Development, and Innovation
Policies for research, development, and innovation (RDI) for industry are present in most countries but it is only recently, and mainly in developed countries, that decarbonisation of emissions-intensive industries has been prioritised (Åhman et al. 2017; Nilsson et al. 2021). Emission-intensive industries are characterised by large dominant actors and mature process technologies with high fixed cost, long payback times and low profit margins on the primary production side of the value chain. Investments in RDI are commonly low and aimed at incremental improvements to processes and products (Wesseling et al. 2017).
11.6.3.1Applied Research
Investing in RDI for low-GHG process emissions is risky and uncompetitive in the absence of convincing climate policy. Research investment should be guided by assessing options, technology readiness levels, and roadmaps towards technology demonstration and commercialisation. The potential GHG and environmental implications need to be assessed early on to assess the sustainability implications and to direct research needs (Yao and Masanet 2018; Zimmerman et al. 2020). Strategic areas for RDI can be focused on a set of possible process options for producing basic materials using fossil-free energy and feedstock, or CCU and CCS (Sections11.3.5 and 11.3.6). Policies to enhance RDI include public funding for applied research, technological and business model experimentation, pilot and demonstration projects, as well as support for education and training – which further have the positive side effect of leading to spill-overs and network effects through labour market mobility and collaboration (Nemet et al. 2018). Innovative business models will not emerge if the transition is not considered along the full value chain with a focus on materials efficiency, circularity, and new roles for industry in a transitioning energy system, including possibly providing demand response for electricity through designed-in flexibility, for example, by combining electrolysis hydrogen production with substantial storage (Vogl et al. 2018).
Fostering collaborative innovation across sectors through the support of knowledge sharing and capabilities building is important as mitigation options involve new or stronger sectoral couplings (Tönjes et al. 2020). One example is linking chemicals to forestry in the upscaling of forest bio-refineries, although it has proven to be difficult to engage a diverse group of actors in such collaborations (Karltorp and Sandén 2012; Bauer et al. 2018). Heterogeneous collaboration and knowledge exchange can be encouraged through conscious design of RDI programs and by supporting network initiatives involving diverse actor groups (Van Rijnsoever et al. 2015; Söderholm et al. 2019).
11.6.3.2Policy Support From Demonstration to Market
Applied research is relatively inexpensive compared to piloting, demonstrations, and early commercialisation, and arguably a lot of it has already been done for the key technologies that need to climb the technology readiness ladder (see Table 11.3). This includes electricity and hydrogen-based processes, electro-thermal technologies, high-temperature heat pumps, catalysis, lightweight building construction, low embodied carbon construction materials, etc. Demonstration to market strategies can be particularly successful when the complete supply chain is considered. A prominent example of such an integrated supply chain approach is the UK Offshore Wind Accelerator Project. Coordinated by the UK Carbon Trust and working with wind turbine manufacturers, the project looked across the potential supply chain for floating offshore wind and identified what components manufacturers could innovate and produce by themselves, and where there were gaps beyond the capability of any one firm. This process led to several key areas of work where the government and firms could work together; once the concepts were piloted and proven, the firms went back into a competitive mode. The project illustrates the potential importance of third parties, including government, in creating platforms and opportunities for cross-industry exchange and collaboration (Tönjes et al. 2020).
Pilot and demonstration projects funded through public-private partnerships contributes to risk mitigation for industries and helps inform on the feasibility, performance, costs and environmental impacts of decarbonisation technologies. Most countries already maintain government research and deployment programs. For example, Horizon Europe has a total budget of 95.5 billion EUR (USD117 billion) for 2021–2027, of which 30% will be directed to green technology research. The EU has conducted several demonstration projects for emission-intensive industries, such as the Ultra-Low Carbon Steel (ULCOS) project (Abdul Quader et al. 2016), which led to several small-scale pilots that are now going to larger-scale firm pilots (e.g., HISARNA, HYBRIT and SIDERWIN). Supported by the EU, several cement firms are working together on the cement LEILAC project, where a new form of limestone calciner is being developed to concentrate the process CO2 emerging from quicklime production (about 60% of cement emissions) for eventual utilisation or geological storage (as one of many options for cement, see for example, Plaza et al. 2020). If LEILAC works, it is conceivable that existing cement plants globally that are located near CCS opportunities could have their emissions reduced by 60% with one major retrofit of the kiln.
Once a technology has been demonstrated with scale-up potential, the next stage is commercialisation. This is a very expensive stage, where costs are not yet compensated by revenue (see, e.g., Åhman et al. 2018 and Nemet et al. 2018). The H-DRI, SIDERWIN and LEILAC examples are all at the stage of scaling up. Given the resource requirement, a diversified portfolio of investors and support is required to share the risk. LEILAC includes several firms, as did the UK Offshore Wind Accelerator. Government funds are also required and could be refunded in the future through an equity position, royalty or tax. Fast-growing economies, which are adding new industrial capacity, can provide opportunities to pilot, demonstrate and scale up new technologies, as shown by the rapid expansion of electric vehicle and solar panel production in China, which contributed to driving down costs (Nemet 2019; Hsieh et al. 2020; Jackson et al. 2021).
Finally, large capital flows towards deployment of low-GHG solutions will not materialise without a growing demand for low-carbon materials and products that allows business opportunities. Policy will thus be needed to support the first niche markets which are essential for refining new decarbonised technologies, troubleshooting, and for building manufacturing economies of scale. Market creation does however go beyond the nurturing, shielding, and empowerment of early niches (Smith and Raven 2012; Raven et al. 2016) and must also consider how to significantly reshape existing markets to create space for decarbonised solutions and crowd out fossil-based ones (Mazzucato 2016).
11.6.4Market Pull
The perception of an increasing durable demand for low-GHG products induces manufacturers to invest in decarbonisation strategies (Olatunji et al. 2019). Policies can support and accelerate this process by creating niche markets, stimulating demand for low-carbon products through procurement and financing and by addressing informational and other market barriers.
11.6.4.1Public Procurement
Governments spend a large portion of their budget on the provision of products and material through infrastructure development, general equipment, and miscellaneous goods. The OECD estimates that an average of 30% of general government expenditure goes to public procurements in OECD countries, representing 12.6% of GDP, which makes government a powerful market actor (OECD 2021). Public procurement can therefore create a significant market pull and be used to pursue strategic environmental goals (Ghisetti 2017). Local, regional and national authorities can use their purchasing power to create niche markets and to guarantee demand for low-GHG products and material (Wesseling and Edquist 2018; Muslemani et al. 2021). In some cases, governments will have to adapt government procurement policies that are not well suited for the procurement of products and services that focus on the decarbonisation benefits and longer-term procurement commitments of emissions-reducing technologies and projects (Ghisetti 2017). Implementation can be challenged by the complexity of criteria, the lack of credible information to check GHG intensities and the added time needed for selection (Geng and Doberstein 2008; Testa et al. 2012; Bratt et al. 2013; Zhu et al. 2013; Cheng et al. 2018; Liu et al. 2019b). To ease these hurdles, the EU commission has developed environmental criteria that can be directly inserted in tender documents (Igarashi et al. 2015; European Commission 2016). These criteria are voluntary, and the extent of their application varies across public authorities (Michelsen and de Boer 2009; Bratt et al. 2013; Testa et al. 2016). In the Netherlands, companies achieving a desirable certification level under the national CO2Performance Ladder obtain a competitive advantage in public procurement (Rietbergen and Blok 2013; Rietbergen et al. 2015). Globally, many countries have implemented green product procurement or sustainable procurement following Sustainable Development Goal (SDG) 12 – ‘Responsible consumption and production’ (UNEP 2017). Public procurement is also developing at sub-national levels. For example, the state of California in the United States of America passed the Buy Clean California Act (AB 262) that establishes maximum acceptable global warming potentials for eligible steel and glass construction materials for public procurement (USGBC-LA 2018) (Box 11.4).
Box 11.4 | Buy CleanCalifornia Act
In October 2017, California passed Assembly Bill (AB) 262, the Buy Clean California Act, a new law requiring state-funded building projects to consider the global warming potential (GWP) of certain construction materials during procurement. The goal of AB 262 is to use California’s substantial purchasing power to buy low-carbon products. Such low-carbon public procurement will directly reduce emissions by using lower-carbon products, and indirectly by sending a market signal to manufacturers to reduce their emissions in order to stay competitive in California.
The bill requirements are two-pronged: as of January 2020, manufacturers of eligible materials must submit a facility-specific environmental product declaration (EPD), and the eligible materials must demonstrate (through submitted EPDs) GWP below the product-specific compliance limits defined by the state Department of General Services (DGS), which will regulate policy implementation. The eligible materials include structural steel, carbon steel rebar, flat glass, and mineral wool insulation. In January 2021, the DGS published maximum acceptable GWP limits for each product category set at the industry average of facility-specific GWP for each material. Beginning 1 July 2021, awarding authorities were required to verify GWP compliance for all eligible materials (USGBC-LA 2018; DGS 2020).
Prior to adoption of the Buy Clean California Act, the California Department of Transportation (Caltrans) had been evaluating the use of lifecycle assessment and EPDs in evaluating materials. In addition to the materials specified in Buy Clean California Act (noted above), the Caltrans project includes materials used extensively in transportation (concrete, asphalt, and aggregate). Also, the California High-Speed Rail project had begun using EPDs as part of its procurement process. The High-Speed Rail Sustainability Report states that the construction projects will: (i) require EPDs for construction materials including steel products and concrete mix designs, and (ii) require ‘optimized lifecycle scores for major materials’ and include additional strategies to reduce impacts across the life cycle of the project (Simonen et al. 2019).
Several other states such as Washington, Minnesota, Oregon, Colorado, New York and New Jersey are developing similar types of Buy Clean regulations (Simonen et al. 2019; BGA 2020).
11.6.4.2Private Procurement
The number of companies producing sustainability reports has increased rapidly over the last decade (Jackson and Belkhir 2018) and so has the number of pledges to carbon neutrality announced. This trend has mainly been driven by consumer concerns, investor requests, and as a business strategy to gain a competitive advantage (Higgins and Coffey 2016; Ibáñez-Forés et al. 2016; Koberg and Longoni 2019). For example, Apple and the governments of Québec and Canada are the financier and lead market maker in the Elysis consortium to bring inert electrodes to market for bauxite smelting to make zero-GHG aluminium. Aluminium is a very small fraction of the cost of a laptop or smartphone, so even expensive low-emissions aluminium adds to Apple’s brand at very little cost per unit sold. Some countries are also requiring corporate to report their emissions. For example, the French government requires companies with 500 or more employees and financial institutions to report Corporate Social Responsibility (CSR) and disclose publicly Scope 1 (direct emissions), Scope 2 (indirect emissions from purchased electricity) and Scope 3 (emissions from supply chain impacts and consumer usage and end-of-life recycling practices) emissions (Mason et al. 2016).
The most common climate mitigation strategies used by corporates are to set emissions reduction targets in line with the Paris Agreement goals through science-based targets (SBTs) and to develop internal carbon pricing (Kuo and Chang 2021). The SBT initiative records that 338 SBT companies reduced their emissions by 302 MtCO2-eq between 2015 and 2019 (SBTi 2021). As of August 2021, 858 companies had set SBT and over 2000 companies across the world currently use internal carbon pricing with a median internal carbon price of USD25 per metric tonne of CO2-eq (Bartlett et al. 2021). The most determined companies have developed internal GHG abatement strategies that incorporate their supply chains’ emissions (Martí et al. 2015; Gillingham et al. 2017; Tost et al. 2020) and design procurement contracts that encourage or require their suppliers to also improve their product GHG footprint (Liu et al. 2019a). For many corporations, the emissions impact within their supply chain far exceeds their operations direct emissions (CDP 2019). Therefore, the opportunities to reduce emissions through purchasing goods and services from the supply chain (Scope 3) have much greater potentials than from direct emissions.
However, these trends have to be approached with caution as some of the emissions reductions are not direct emissions reductions from companies’ operations, instead often from offset projects of varying quality (Chrobak 2021). There is a lack of consistency and comparability in the way firms are reporting emissions, which limits the possibilities to assess companies’ actual ambition and progress (Sullivan and Gouldson 2012; Burritt and Schaltegger 2014; Liu et al. 2015; Rietbergen et al. 2015; Blanco et al. 2016). More research is needed to assess the current impacts of corporate voluntary climate actions and if these efforts meet the Paris Agreement’s goals (Rietbergen et al. 2015; Wang and Sueyoshi 2018). It will be critically important that the international corporate accounting frameworks, standards, and related guidance (e.g., GHG Protocol) be maintained and improved to reflect evolving needs in the global market and to allow for comparison of objectives and progress.
11.6.4.3GHG Content Certifications
The development of GHG labels corresponds to a growing demand from consumers desiring information about the climate impacts of their consumption (Darnall et al. 2012; Tan et al. 2014; Feucht and Zander 2018). GHG labels fill this information gap by empowering consumers’ purchasing decisions and creating higher value for low-GHG products and materials (Vanclay et al. 2011; Cohen and Vandenbergh 2012). The willingness to pay for lower-GHG products has been found to be positive but to depend on socio-economic consumer characteristics, cultural preferences and the product considered (Shuai et al. 2014; de-Magistris and Gracia 2016; Tait et al. 2016; Li et al. 2017; Feucht and Zander 2018). Companies and governments that favour low-GHG products and who are seeking to achieve environmental, social, and governance (ESG) goals also need readily available and reliable information about the GHG content of products and materials they purchase and produce (Long and Young 2016; Munasinghe et al. 2016).
Numerous methodologies have been developed by public and private organisations to meet the needs for credible and comparable environmental metrics at the product and organisation levels. Most follow lifecycle assessment standards as described in ISO 14040 and ISO 14044, ISO 14067 for climate change footprint only and ISO 14025 (2006) for environmental product declarations (EPD), but the way system boundaries are applied in practice varies (Wu et al. 2014; Liu et al. 2016). Adoption has been challenged by the complexity and the profusion of applications which contribute to confuse stakeholders (Gadema and Oglethorpe 2011; Guenther et al. 2012; Brécard 2014). The options of applying different system boundaries and allocation principles involve value judgements that in turn influence the results (Tanaka 2008; Finnveden et al. 2009; McManus et al. 2015; Overland 2019). A more systematic and coordinated international approach based on transparent and reliable data and methodologies is needed to induce global low-GHG market development (Pandey et al. 2011; Darnall et al. 2012; Tan et al. 2014).
Within the context of GHG content certifications and EPD development, more transparency is needed to increase international comparability and to validate claims to meet consumers demand for low-GHG material and products (Rangelov et al. 2021). Greater automation, publicly available reference databases, benchmarking systems and increased stakeholder collaboration can also support the important role of conveying credible emissions information between producers, traders and consumers.
11.6.4.4Performance Standards and Codes
Policymakers can set minimum performance standards or maximum emission content specifications through legislation to increase the use of low-GHG materials and products by mandating the adoption of low-GHG production and construction processes while requiring material and resource efficiency aspects.
Construction of buildings represented 11% of energy and process-related CO2 emissions globally in 2018 (IEA and UNEP 2019 ). The share of embodied emissions in construction is increasing as building energy efficiency is improving and energy supply is decarbonised (Chastas et al. 2016). As a result, jurisdictions are increasingly considering new requirements in building codes to reduce embodied emissions. This is the case of France’s new building code which is shifting from a thermal regulation (RT 2012) to an environmental regulation (RE 2020) to include embodied GHG LCA metrics for encouraging use of low-GHG building materials (Ministère de la Transition écologique et solidaire 2018; Schwarz et al. 2020). The 2018 International Green Construction Code (IGCC) provides technical requirements that can be adopted by jurisdictions for encouraging low-GHG building construction, which also covers minimum longevity and durability of structural, building envelope, and hardscape materials (Art. 1001.3.2.3) (Celadyn 2014). Low-GHG building rating systems, such as LEEDs, are voluntary standards which include specific requirements on material resources in their rating scale. Trade-offs between energy performance achievement and material used in building construction needs to be further assessed and considered as low-GHG building code requirements develop. Local governments can also lead the way by adopting standards for construction. This is the case of the county of Marin in California which specifies maximum embodied carbon in kgCO2-eq m –3 and maximum ordinary Portland cement content in lbs/yd 3 for different levels of concrete compressive strength (Marin County 2021).
Governments are also turning their attention to developing standards to increase the durability of products and materials by requiring options for maintenance, reparability, reusability, upgradability, recyclability and waste handling. For example, the EU Ecodesign Directive includes new requirements for manufacturers to make available for a minimum of seven to 10 years spare parts to repair household equipment (Talens Peiró et al. 2020; Calisto Friant et al. 2021; Nikolaou and Tsagarakis 2021). The European Commission plans to widen the resource efficiency requirements beyond energy-related products to cover products such as textiles and furniture as well as high-impact intermediary products such as steel, cement and chemicals in a new sustainable product policy legislative initiative. (Domenech and Bahn-Walkowiak 2019; Llorente-González and Vence 2019; European Commission 2020; Polverini 2021).
Further research is needed to understand how different international and national frameworks, codes, and standards that focus on emissions can work in unison to amplify their mutually desired outcomes. Building performance and market instrument trading frameworks recognised globally do not always incentivise the same outcomes due to the differences in market approach. LCA metrics are a useful tool to help assess optimal options for ultimate emission reduction objectives (Röck et al. 2020; Shadram et al. 2020).
11.6.4.5Financial Incentives
Fossil-free basic materials production will often lead to higher costs of production, for example, 20–40% more for steel, 70–115% more for cement, and potentially 15–60% for chemicals (Material Economics 2019). There is a nascent literature on what are effectively material ‘feed-in-tariffs’ to bridge the commercialisation ‘valley of death’ (Wilson and Grubler 2011) of early development of low-GHG materials (Bataille et al. 2018a; Neuhoff et al. 2018; Sartor and Bataille 2019; Wyns et al. 2019). Renewable electricity support schemes have typically been price-based (e.g., production subsidies and feed-in-tariffs) or volume-based (e.g., quota obligations and certificate schemes) and both principles can be applied when thinking about low-GHG materials. Auction schemes are typically used for larger-scale projects, for example, offshore wind parks.
Based on how feed-in-tariffs worked, a contract for difference (CfD) could guarantee a minimum and higher-than-market price for a given volume of early low-GHG materials. CfDs could be based on a minimum effective GHG price reflecting parity with the costs of current higher-emitting technologies, or directly on the higher base capital and operating costs for a lower-GHG material (Richstein 2017; Chiappinelli et al. 2019; Sartor and Bataille 2019; Vogl et al. 2021a). CfDs can also be offered through low-GHG material procurement where an agreed price offsets the incremental cost of buying low-GHG content product or material. Private firms, by themselves or collectively, can also guarantee a higher than market price for low-GHG materials from their supplier for marketing purposes (Bataille et al. 2018a; Bataille 2020a). Reverse auctions (by which the lowest bidder gets the production subsidy) for low-GHG materials is also an option but it remains to be analysed and explored. While these financial incentive schemes have been implemented for renewable energy, their application to incentivise and support low-GHG material production have yet to be developed and implemented. The German government is currently developing a draft law which will allow companies that commit to cut GHG emissions by more than half using innovative technologies to bid for 10-year CfDs with a guaranteed price for low-carbon steel, chemical and cement products (Agora Energiewende and Wuppertal Institut 2019; BMU 2021).
New and innovative financial market contracts for basic materials that represent low-carbon varieties of conventional materials are emerging. This is the case of aluminium for which quantity of low-GHG production already exist in countries where hydroelectric power is a common power source. Market developments will allow for low-GHG aluminium to trade at a premium rate as demand develops. For example, Harbor Aluminium has launched a green aluminium spot premium at the end of October 2019 and the London Metal Exchange has introduced a ‘green aluminium’ spot exchange contract. (LME 2020; Das 2021).
11.6.4.6Extended Producer Responsibility
Extended producer responsibility (EPR) systems are increasingly used by policymakers to require producers to take responsibility for the end life of their outputs and to cover the cost of recycling of materials or otherwise responsibly managing problematic wastes (Kaza et al. 2018). According to the OECD, there are about 400 EPR systems in operation worldwide, three quarters of which have been established over the last two decades. One third of EPR systems cover small consumer electronic equipment, followed by packaging and tyres (each 17%), vehicles, lead-acid batteries and a range of other products (OECD 2016).
While the economic value of some discarded materials such as steel, paper and aluminium is generally high enough to justify the cost and efforts of recycling, at current rates of 85%, above 60%, and 43%, respectively (Graedel et al. 2011; Cullen and Allwood 2013), others like plastic or concrete have a much lower re-circularity value (Graedel et al. 2011). Most plastic waste ends up in landfills or dumped in the environment, with 9% recycled and 12% incinerated globally (Geyer et al. 2017; UNEP 2018). Collected waste plastics from OECD countries were largely exported to China until a ban in 2018 required OECD countries to review their practices (Qu et al. 2019). EPR schemes may thus need to be strengthened to actually achieve a reduced use of virgin GHG-intensive materials. The potential for re-circularity of unreacted cement and aggregates in concrete is increasing as new standards and requirement develops. For example, concrete fines are now standardised as a new cement constituent in the European standardisation CEN/TC 51 – ‘cements and construction limes’.
11.6.5Knowledge and Capacity
It is important that government bodies, academia and other actors strengthen their knowledge and capacities for the broad transformational changes envisioned for industry. In Japan, industry has been voluntarily working on GHG reduction, under the Framework of Keidanren’s Commitment to a Low-carbon Society since 2009. Government and scientific experts regularly review their commitments and discuss results, monitoring methods, and reconsidering goals. Industry federations/associations can obtain advice in the follow-up meetings from other industries and academics. The energy and transport sectors have decades of building institutions and expertise, whereas industrial decarbonisation is largely a new policy domain. Most countries have experience in energy efficiency policies, some areas of research and innovation, waste management, regulations for operational permits and pollution control, worker safety and perhaps fuel switching. There is less experience with market demand pull policies although low-GHG public procurement is increasingly being tested. Circular economy policies are evolving but potential policies for managing material demand growth are less understood. Material efficiency policies through, for example, product standards or regulation against planned obsolescence are nascent but relatively unexplored (Gonzalez Hernandez et al. 2018a).
All this argues for active co-oversight, management and assessment by government, firms, sector associations and other actors, in effect the formation of an active industrial policy that includes decarbonisation in its broader mandate of economic and social development (OECD 2019b; Bataille 2020a). This could draw from the quadruple helix innovation model, which considers the role of government, universities, the private sector, the natural environment and social systems to foster collaboration in innovation (Carayannis and Campbell 2019; Durán-Romero et al. 2020). Important aspects of governance include mechanisms for monitoring, transparency, and accountability. It may involve the development of new evaluation approaches, including a greater focus on ex ante evaluations and assessment of, for example, readiness and capacities, rather than ex post evaluations of outcomes. Such organisational routines for learning have been identified as a key aspect of policy capacity to govern evolutionary processes (Karo and Kattel 2018; Kattel and Mazzucato 2018). Although many governments have adopted ideas of focusing resources on the mission or challenge of climate change mitigation, comparisons between Western and East Asian contexts show significant differences in the implementation of governance structures (Karo 2018; Mazzucato et al. 2020; Wanzenböck et al. 2020). Overall, improved knowledge and stronger expertise is important also to handle information asymmetries and the risk of regulatory capture.
11.6.6Policy Coherence and integration
Industrial net zero transitions, while technically feasible, involve not just a shift in production technology but major shifts in demand, material efficiency, circularity, supply chain structure and geographic location, labour training and adaptation, finance, and industrial policy. This transition must also link decarbonisation to larger environmental and social goals (e.g,. air and water quality, low-GHG growth, poverty alleviation, sustainable development goals) (OECD 2019b).
Although there is little evidence of carbon leakage so far it will be ever more important to strive for coherence in climate and trade policies as some countries take the lead in decarbonising internationally traded basic materials (Jakob 2021b). At the time of writing the previously academic debate on this issue is shifting to real policymaking through debates and negotiations around carbon border adjustment (Section 11.6.1) and sectoral agreements or climate clubs (Nordhaus 2015; Åhman et al. 2017; Jakob 2021a; Nilsson et al. 2021). The climate and trade policy integration should also consider what is sometimes called positive leakage, that is that heavy industry production moves to where it is easier to reach zero emissions. As a result, policy should go beyond border measures to include, for example, international technology cooperation and transfer and development of shared lead markets.
Energy-intensive production steps may move where clean resources are most abundant and relatively inexpensive (Gielen et al. 2020; Bataille et al. 2021a). For example, steel-making has historically located itself near iron ore and coal resources whereas in the future it may be located near iron ore and zero-GHG electricity or close to carbon storage sites (Fischedick et al. 2014 b; Vogl et al. 2018; Bataille 2020a). This indicates large changes in industrial and supply chain structure, with directly associated needs for employment and skills. Some sectors will grow, and some will shrink, with differing skill needs. Each new workforce cohort needs the general specific skill to provide the employment that is needed at each stage in the transition, implicating a need for coordination with policies for education and retraining.
Depending on what mixes of deep decarbonisation strategies are followed in a given region (e.g., material efficiency, electrification, hydrogen, biomass, CCU and CCS), infrastructure will need to be planned, financed and constructed. The UKCCC Net Zero Technical Report describes the infrastructure needs for achieving net zero GHG in the UK by 2050 for every sector of the economy (UKCCC 2019b). Transportation would be facilitated with pipelines or ships to allow transfer of captured CO2 for utilisation and disposal, and associated institutional frameworks (IEAGHG 2021). Electrification will require market design and transmission to support increased generation, transmission, and flexible demand. Hydrogen, CCU, and CCS will require significant new or adapted infrastructure. Hydrogen and CO2 pipelines, and expanded electricity transmission, have natural monopoly characteristics which are normally governed and planned by national and regional grid operators and their regulators. Industrial clustering (also known as eco-parks), such as those planned in Rotterdam (Netherlands) and Teeside (UK), would allow more physical and cost-effective sharing of electricity, CCU, CCS, and hydrogen infrastructure but is dependent on physical planning, permitting, and infrastructure policies.
Costing analysis (Chapter 15) indicates an increased upfront need for financial capital which requires policies to encourage long-term, patient capital that reflects society’s preferences for investment in industrial decarbonisation and the minimum 10 or more years horizon before there are significant new commercially available processes.
All the above indicate the need for general industrial policy as part of a coherent general economic, taxation, investment, employment and social policy for climate change mitigation (Wesseling et al. 2017; Bataille et al. 2018a; Wyns et al. 2019; Nilsson et al. 2021).
11.6.7Roles and Responsibilities
While all climate policy requires topic-specific adaptive governance for long-term effectiveness (Mathy et al. 2016), deep decarbonisation of heavy industry has special governance challenges, different from those for the electricity, transport or buildings sectors (Åhman et al. 2017; Wesseling et al. 2017; Bataille et al. 2018a). Competition is strong, investments are rare, capital intensive and very ‘lumpy’. In an atmosphere where transformative innovation is required the process is very capital-focused with non-diversifiable risks unless several companies are involved. There are significant infrastructure needs for electricity, hydrogen, and CCS and CCU. Given there is no ‘natural’ market for low-emissions materials, there is a need to manage both the supply and demand sides of the market, especially in early phase through lead supplier and markets. Finally, there is a very high probability of surprises and substantial learning, which could affect policy choice, direction, and stringency.
Different types of actors thus have to play different but coordinated roles and responsibilities in developing, supporting, and implementing policies for an industrial transition. Table 11.6 below shows how the different core parts of integrated policymaking for an industrial transition may depend on efforts from different actors groups and highlights the responsibility of these actor groups in developing a progressive and enabling policy context for the transition. This includes policymakers at local, national, and international arenas as well as civil society organisations, industry firms, and interest organisations.
Table 11.6 | Examples of the potential roles of different actors in key policy and governance areas for a low-GHG transition to indicate the importance of agency and wide stakeholder engagement in the governance of industrial decarbonisation.
Actors | Direction: planning and strategising pathways to net zero | Innovation: RD&D for new technologies and other solutions | Market creation: create and shape demand-pull for various solutions | Knowledge and capacity: build institutional capacity across various actors | Coherence: establish international and national policy coherence |
International bodies and multilateral collaboration | More attention to industry in NDCs. Monitor progress and identify gaps. Develop international roadmaps. | Include heavy industry decarbonisation in technology cooperation (e.g., Mission Innovation). | International standards, benchmarking systems, and GHG labels. Allow for creation and protection of lead markets. | Support knowledge building and sharing on industrial decarbonisation. | Align other conventions and arenas (e.g., WTO) with climate targets and include heavy industry transitions in negotiations. |
Regional and national government and cities | Require net zero strategies in permitting. Set targets and facilitate roadmaps at various levels. Sunset clauses and phase-out agreements for polluting plants. | Experimentation for recycling, materials efficiency, and demand management. Hydrogen, electrification, and other infrastructure. | Public procurement for innovation and lead markets. Green infrastructure investments. | Develop policy expertise for industrial transformation. Support and facilitate material efficiency and circular solutions through design standards, building codes, recycling, and waste policy. | Support vertical policy coherence (i.e., international, national, city level). |
Civil society | Monitor and evaluate leaders and laggards. Support transparency. | Engage in responsible innovation programs, experimentation, and social innovation. | Progressive labelling, standards and criteria for low emissions materials and products (e.g., LCA-based), including updating. | Engage in policy processes and build capacity on industrial decarbonisation. Support consumer information and knowledge. | Monitor and support policy coherence and coordination across policy domains (trade, climate, waste, etc.). |
Industrial sectors and associations | Adopt net zero emissions targets, roadmaps, and policy strategies for reaching them. Assess whole value chains, scope 3 emissions and new business models. | Share best practice. Coordination and collaboration. Efficient markets for new technology (e.g., licensing). | Work across (new) value chains to establish lead markets for low emissions materials as well as for materials efficiency and circularity. | Education and retraining for designers, engineers, architects, etc. Information sharing and transparency to reduce information asymmetry. | Coordination across policy domains (trade, climate, waste, etc.). Explore sectoral couplings, new value chains and location of heavy industry. |
Corporations and companies | Set zero emissions targets and develop corporate- and plant-level roadmaps for reaching targets. | Lead and participate in R&D, pilots, and demonstrations. Increase and direct R&D efforts at reaching net zero. | Marketing and procurement of low-emissions materials and products. Include Scope 3 emissions to assess impact and mitigation strategies. | Engage in value chains for increased recycling and materials efficiency. Build knowledge and capacity for reorientation and transformation. | MNCs avoid race to the bottom, and strategically account for high carbon price as part of transition strategy. |
11.7Knowledge Gaps
An increasing body of research proposes deep decarbonisation pathways for energy-intensive industries including mitigation options such as materials efficiency, circular economy and new primary processes. These options are under-represented in climate change scenario modelling and integrated assessment models, some of which do not even reflect evolution of demand for basic materials, which is a key driver behind energy consumption and GHG emissions in the industrial sector. As a result, no agreement is reached so far between bottom-up and top-down studies on the effectiveness and costs for many promising mitigation options, their respective roles, sequencing and packaging within various mitigation pathways.
A significant shift is needed from the transition process of the past mainly based on marginal and incremental changes, with a strong focus on energy efficiency efforts, to one grounded in transformational change where there is limited knowledge of how to implement such change effectively.
There is a knowledge gap on comparable, comprehensive, and detailed quantitative information on costs and potentials associated with the mitigation options for deep decarbonisation in industry, as cost estimates are not often comparable due to the regional or country focus, differences in costs metrics, currencies, discount rates, and energy prices across studies and regions.
A very large and important uncertainty is the availability of biomass for deep decarbonisation pathways due to competition for biomass feedstock with other priorities and the extent to which electrification can reduce the demand for bioenergy in the industry, transport and energy sectors.
CCS and CCU are important mitigation options in industry, for which the potentials and costs vary considerably depending on the diversity of industrial processes, the volume and purity of carbon dioxide flows, the energy requirements, the lifetime of utilisation products and the production route.
The effectiveness of mitigation policies in industry is poorly known, as so far the sector has largely been sheltered from the impacts of climate policy due to the concerns of competitiveness and carbon leakage. There is a lack of integration of material efficiency and circularity with energy and climate policies which partly results from the inadequacy of monitored indicators to inform policy debates and set targets, a lack of high-level political focus, a history of strong industrial lobbying, uncoordinated policy across subsectors and institutions, and the sequential nature of decision-making along supply chains.
Industry as a whole is a very complex web of sectors, subsectors and inter-sectoral interactions and dependence, with diverse associated mitigation opportunities and co-benefits and costs. Additional knowledge is needed to understand sectoral interactions in the transformation processes.
Industrial climate mitigation policy is supplemental to many other policy instruments developed to reach multiple industrial goals, for the range of stakeholders with their interest and priorities reflecting the assessment of co-benefits and risk and affecting decision-making processes and behaviour of stakeholders. Better knowledge is needed to identify the co-benefits for the adoption of climate change mitigation strategies.
Frequently Asked Questions (FAQs)
FAQ 11.1 | What are the key options to reduce industrial emissions?
Industry has a diverse set of greenhouse gas (GHG) emission sources across subsectors. To decarbonise industry requires that we pursue several options simultaneously. These include energy efficiency, materials demand management, improving materials efficiency, more circular material flows, electrification, as well as carbon capture and utilisation (CCU) and carbon capture and storage (CCS). Improved materials efficiency and recycling reduces the need for primary resource extraction and the energy-intensive primary processing steps. Future recycling may include chemical recycling of plastics if quality requirements make mechanical recycling difficult. One approach, albeit energy intensive, is to break down waste plastics to produce new monomer building blocks, potentially based on biogenic carbon and hydrogen instead of fossil feedstock. Hydrogen can also be used as a reduction agent instead of coke and coal in ironmaking. Process emissions from cement production can be captured and stored or used as feedstock for chemicals and materials. Electricity and hydrogen needs can be very large but the potential for renewable electricity, possibly in combination with other low carbon options, is not a limiting factor.
FAQ 11.2 | How costly is industrial decarbonisation and will there be synergies or conflicts with sustainable development?
In most cases and in early stages of deployment, decarbonisation through electrification or CCS will make the primary production of basic materials such as cement, steel, or polyethylene more expensive. However, demand management, energy and materials efficiency, and more circular material flows can dampen the effect of such cost increases. In addition, the cost of energy-intensive materials is typically a very small part of the total price of products, such as an appliance, a bottle of soda or a building, so the effect on consumers is very small. Getting actors to pay more for zero-emission materials is a challenge in supply chains with a strong focus on competitiveness and cutting costs, but it is not a significant problem for the broader economy. Reduced demand for services such as square metres of living space or kilometres of car travel is an option where material living standards are already high. If material living standards are very low, increased material use is often needed for more sustainable development. The options of materials and energy efficiency, and more circular material flows, generally have synergies with sustainable development. Increased use of electricity, hydrogen, CCU and CCS may have both positive and negative implications for sustainable development and thus require careful assessment and implementation for different contexts.
FAQ 11.3 | What needs to happen for a low-carbon industry transition?
Broad and sequential policy strategies for industrial development and decarbonisation that pursue several mitigation options at the same time are more likely to result in resource-efficient and cost-effective emission reductions. Industrial decarbonisation is a relatively new field and thus building capacity for industrial transition governance is motivated. For example, policy to support materials efficiency or fundamental technology shifts in primary processes is less developed than energy efficiency policy and carbon pricing. Based on shared visions or pathways for a zero-emission industry, industrial policy needs to support development of new technologies and solutions as well as market creation for low- and zero-emission materials and products. This implies coordination across several policy domains including research and innovation, waste and recycling, product standards, digitalisation, taxes, regional development, infrastructure, public procurement, permit procedures and more to make the transition to a carbon neutral industry. International competition means that trade rules must be evolved to not conflict with industrial decarbonisation. Some local and regional economies may be disadvantaged from the transition which can motivate re-education and other support.
References
Abbas, H.F. and Wan Daud, W.M.A., 2010: Hydrogen production by methane decomposition: A review. Int. J. Hydrogen Energy, 35(3) , 1160–1190, doi:10.1016/j.ijhydene.2009.11.036.
Abdelaziz, O.Y. et al., 2016: Biological valorization of low molecular weight lignin. Biotechnol. Adv. , 34(8) , 1318–1346, doi:10.1016/j.biotechadv.2016.10.001.
Abdul Quader, M.,S. Ahmed, S.Z. Dawal, and Y. Nukman, 2016: Present needs, recent progress and future trends of energy-efficient Ultra-Low Carbon Dioxide (CO2) Steelmaking (ULCOS) program. Renew. Sustain. Energy Rev. , 55, 537–549, doi:10.1016/j.rser.2015.10.101.
Acworth, W., C. Kardish, and K. Kellner, 2020: Carbon Leakage and Deep Decarbonization: Future-proofing. Carbon Leakage Protection. ICAP, Berlin, Germany, 76 pp.
Agora Energiewende, and Wuppertal Institut, 2019: Climate-Neutral Industry. Key technologies and policy options for steel, chemicals and cement . Executive Summary.
Åhman, M., L.J. Nilsson, and B. Johansson, 2017: Global climate policy and deep decarbonization of energy-intensive industries. Clim. Policy, 17(5) , 634–649, doi:10.1080/14693062.2016.1167009.
Åhman, M., J.B. Skjaerseth, and P.O. Eikeland, 2018: Demonstrating climate mitigation technologies: An early assessment of the NER 300 programme. Energy Policy, 117, 100–107, doi:10.1016/j.enpol.2018.02.032.
Aiginger, K., 2014: Industrial Policy for a sustainable growth path. Vienna, Austria, 33 pp. https://www.oecd.org/economy/Industrial-Policy-for-a-sustainable-growth-path.pdf .
Al Khourdajie, A. and M. Finus, 2020: Measures to enhance the effectiveness of international climate agreements: The case of border carbon adjustments. Eur. Econ. Rev. , 124, 103405, doi:10.1016/j.euroecorev.2020.103405.
Allan, G., P. McGregor, and K. Swales, 2017: Greening regional development: employment in low-carbon and renewable energy activities. Reg. Stud. , 51(8) , 1270–1280, doi:10.1080/00343404.2016.1205184.
Allwood, J.M., 2018: Unrealistic techno-optimism is holding back progress on resource efficiency. Nat. Mater. , 17(12) , 1050–1051, doi:10.1038/s41563-018-0229-8.
Allwood, J.M., M.F. Ashby, T.G. Gutowski, and E. Worrell, 2011: Material efficiency: A white paper. Resour. Conserv. Recycl. , 55(3) , 362–381, doi:10.1016/j.resconrec.2010.11.002.
Allwood, J.M. et al., 2012: Sustainable materials: With both eyes open. 1st ed. UIT Cambridge, UK, 410 pp.
Altenburg, T. and C. Assman, 2017: Green Industrial Policy: Concepts, Policies, Country Experiences. Geneva, Switerland, Bonn, Germany, 221 pp. https://www.unido.org/sites/default/files/files/2017-12/green_industrial_policy_book.pdf .
Alvarez, R.A., S.W. Pacala, J.J. Winebrake, W.L. Chameides, and S.P. Hamburg, 2012: Greater focus needed on methane leakage from natural gas infrastructure. Proc. Natl. Acad. Sci. , 109(17) , 6435–6440, doi:10.1073/pnas.1202407109.
Alvarez, R.A. et al., 2018: Assessment of methane emissions from the U.S. oil and gas supply chain. Science, 361(6398) , pp 186–188, doi:10.1126/science.aar7204.
Amin, A.M., E. Croiset, and W. Epling, 2011: Review of methane catalytic cracking for hydrogen production. Int. J. Hydrogen Energy, 36(4) , 2904–2935, doi:10.1016/j.ijhydene.2010.11.035.
Ampelli, C., S. Perathoner, and G. Centi, 2015: CO2 utilization: an enabling element to move to a resource- and energy-efficient chemical and fuel production. Philos. Trans. R. Soc. A Math. Phys. Eng. Sci. , 373(2037) , doi:10.1098/rsta.2014.0177.
Andersson, R., H. Stripple, T. Gustafsson, and C. Ljungkrantz, 2019: Carbonation as a method to improve climate performance for cement based material. Cem. Concr. Res. , 124 (July), 105819, doi:10.1016/j.cemconres.2019.105819.
Andreoni, A. and H.J. Chang, 2019: The political economy of industrial policy: Structural interdependencies, policy alignment and conflict management. Struct. Change Econ. Dyn. , 48, 136–150, doi:10.1016/j.strueco.2018.10.007.
Andrew, R.M., 2019: Global CO2 emissions from cement production, 1928–2018. Earth Syst. Sci. Data, 11(4) , 1675–1710, doi:10.5194/essd-11-1675-2019.
Antikainen, M. and K. Valkokari, 2016: A Framework for Sustainable Circular Business Model Innovation. Technol. Innov. Manag. Rev. , 6(7) , 5–12, doi:10.22215/timreview/1000.
Arens, M., E. Worrell, W. Eichhammer, A. Hasanbeigi, and Q. Zhang, 2017: Pathways to a low-carbon iron and steel industry in the medium-term – the case of Germany. J. Clean. Prod. , 163, 84–98, doi:10.1016/j.jclepro.2015.12.097.
Armijo, J. and C. Philibert, 2020: Flexible production of green hydrogen and ammonia from variable solar and wind energy: Case study of Chile and Argentina. Int. J. Hydrogen Energy, 45(3) , 1541–1558, doi:10.1016/j.ijhydene.2019.11.028.
Arpagaus, C., F. Bless, M. Uhlmann, J. Schiffmann, and S.S. Bertsch, 2018: High temperature heat pumps: Market overview, state of the art, research status, refrigerants, and application potentials. Energy, 152, 985–1010, doi:10.1016/j.energy.2018.03.166.
Arto, I. and E. Dietzenbacher, 2014: Drivers of the growth in global greenhouse gas emissions. Environ. Sci. Technol. , 48(10) , 5388–5394, doi:10.1021/es5005347.
Artz, J. et al., 2018: Sustainable Conversion of Carbon Dioxide: An Integrated Review of Catalysis and Life Cycle Assessment. Chem. Rev. , 118(2) , 434–504, doi:10.1021/acs.chemrev.7b00435.
Ashby, M., 2012: Materials and the Environment: Eco-informed Material Choice: 2nd ed. Elsevier/Butterworth-Heinemann, Amsterdam, the Netherlands, Boston, USA 616 pp.
Ashik, U.P.M., W.M.A. Wan Daud, and H.F. Abbas, 2015: Production of greenhouse gas free hydrogen by thermocatalytic decomposition of methane – A review. Renew. Sustain. Energy Rev. , 44, 221–256, doi:10.1016/j.rser.2014.12.025.
Axelson, M., I. Robson, G. Khandekar, and T. Wyns, 2018: Breaking through: Industrial Low-CO2 Technologies on the Horizon. Brussels, Belgium, 92 pp. www.ies.be/Breaking-Through_Report_13072018.
Azevedo, J.M.C., A. CabreraSerrenho, and J.M. Allwood, 2018: Energy and material efficiency of steel powder metallurgy. Powder Technol. , 328, 329–336, doi:10.1016/j.powtec.2018.01.009.
Bachmann, M. et al., 2021: Renewable carbon feedstock for polymers: Environmental benefits from synergistic use of biomass and CO2. Faraday Discuss. , 230(0) , 227–246, doi:10.1039/d0fd00134a.
Bailey, I., I. MacGill, R. Passey, and H. Compston, 2012: The fall (and rise) of carbon pricing in Australia: A political strategy analysis of the carbon pollution reduction scheme. Env. Polit. , 21(5), 691–711, doi:10.1080/09644016.2012.705066.
Baker, L., 2018: Of embodied emissions and inequality: Rethinking energy consumption. Energy Res. Soc. Sci. , 36, 52–60, doi:10.1016/j.erss.2017.09.027.
Bamigbetan, O., T.M. Eikevik, P. Nekså, and M. Bantle, 2017: Review of vapour compression heat pumps for high temperature heating using natural working fluids. Int. J. Refrig. , 80, 197–211, doi:10.1016/j.ijrefrig.2017.04.021.
Banerjee, S., 2021: Conjugation of border and domestic carbon adjustment and implications under production and consumption-based accounting of India’s National Emission Inventory: A recursive dynamic CGE analysis. Struct. Change Econ. Dyn. , 57, 68–86, doi:10.1016/j.strueco.2021.01.007.
Barrett, J. et al., 2013: Consumption-based GHG emission accounting: a UK case study. Clim. Policy, 13(4) , 451–470, doi:10.1080/14693062.2013.788858.
Bartlett, N., T. Coleman, and S. Schmidt, 2021: Putting a Price on Carbon. The state of internal carbon pricing by corporates globally. 23 pp. CDP, London, UK.
Bashmakov, I. and A. Myshak, 2018: “Minus 1” and Energy Costs Constants: Sectorial Implications. J. Energy, 2018, 1–24, doi:10.1155/2018/8962437.
Bashmakov, I. et al., 2021a: CBAM: Implications for the Russian economy Center for Energy Efficiency - XXI Moscow. Moscow, Russia, 22 pp.
Bashmakov, I.A., 2019: Energy efficiency and economic growth. Vopr. Ekon. , 2019(10) , 32–63, doi:10.32609/0042-8736-2019-10-32-63.
Bashmakov, I.A., 2021: Greenhouse gas emissions caused by global steel industry: the past, the present and the future. Ferr. Metall. Bull. Sci., Tech. Econ. Inf. , 77(8) , 882–901, doi:10.32339/0135-5910-2021-9-1071-1086.
Bashmakov, I.A., D.O. Skobelev, K.B. Borisov, and T.V. Guseva, 2021b: Benchmarking systems for greenhouse gases specific emissions in steel industry. Ferr. Metall. Bull. Sci., Tech. Econ. Inf. , 77 (9), 1071–1086, doi:10.32339/0135-5910-2021-9-1071-1086.
Bataille, C., 2020a: Physical and policy pathways to net-zero emissions industry. WIRES Wiley Interdiscip. Rev. , e633(2) , doi:10.1002/wcc.633.
Bataille, C., 2020b: Low and zero emissions in the steel and cement industries: Barriers, technologies and policies. 42 pp. OECD Green Growth Papers, No. 2020/02, OECD Publishing, Paris.
Bataille, C. and N. Melton, 2017: Energy efficiency and economic growth: A retrospective CGE analysis for Canada from 2002 to 2012. Energy Econ. , 64, 118–130, doi:10.1016/j.eneco.2017.03.008.
Bataille, C., and S. Stiebert, 2018: The transition toward very low carbon heavy industry in the Canadian context: Detailed technical and policy analysis and recommendations for the iron & steel, chemicals, forestry products & packaging, and base metal mining & processing sectors. Phase IIof the Canadian Heavy Industry Deep Decarbonization Project. The Industrial Gas Users Association (IGUA). 84 pp.
Bataille, C. et al., 2018a: A review of technology and policy deep decarbonization pathway options for making energy intensive industry production consistent with the Paris Agreement. J. Clean. Prod. , 187, 960–973, doi:10.1016/j.jclepro.2018.03.107.
Bataille, C., C. Guivarch, S. Hallegatte, J. Rogelj, and H. Waisman, 2018b: Carbon prices across countries. Nat. Clim. Change, 8(8) , 648–650, doi:10.1038/s41558-018-0239-1.
Bataille, C., L. Nilsson, and F. Jotzo, 2021a: Industry in a net-zero emissions world – uprooting of supply chains, broader policy thinking, and how to model it all. Energy Strateg. Rev. (in press)
Bataille, C., S. Steibert, and F.G.N. Li, 2021b: Global facility level net-zero steel pathways: technical report on the first scenarios of the Net-zero Steel Project , Paris, France, 34 pp.
Bauer, F., 2018: Narratives of biorefinery innovation for the bioeconomy: Conflict, consensus or confusion?Environ. Innov. Soc. Transitions, 28, 96–107, doi:10.1016/j.eist.2018.01.005.
Bauer, F. and L. Fuenfschilling, 2019: Local initiatives and global regimes – Multi-scalar transition dynamics in the chemical industry. J. Clean. Prod. , 216, 172–183, doi:10.1016/j.jclepro.2019.01.140.
Bauer, F. and G. Fontenit, 2021: Plastic dinosaurs – Digging deep into the accelerating carbon lock-in of plastics. Energy Policy, 156, 112418, doi:10.1016/j.enpol.2021.112418.
Bauer, F., L. Coenen, T. Hansen, K. McCormick, and Y.V. Palgan, 2017: Technological innovation systems for biorefineries: a review of the literature. Biofuels, Bioprod. Biorefining, 11 (3), 534–548, doi:10.1002/bbb.1767.
Bauer, F., T. Hansen and H. Hellsmark, 2018: Innovation in the bioeconomy–dynamics of biorefinery innovation networks. Technol. Anal. Strateg. Manag. , 30(8) , 935–947, doi:10.1080/09537325.2018.1425386.
Bayer, P. and M. Aklin, 2020: The European Union Emissions Trading System reduced CO2 emissions despite low prices. Proc. Natl. Acad. Sci. U. S. A. , 117(16) , 8804–8812, doi:10.1073/pnas.1918128117.
Bazzanella, A. M. and F. Ausfelder, 2017: Technology study: Low carbon energy and feedstock for the European Chemical Industry. 166 pp. DECHEMA Gesellschaft für Chemische Technik und Biotechnologie e.V. https://dechema.de/dechema_media/Technology_study_Low_carbon_energy_and_feedstock_for_the_European_chemical_industry-p-20002750.pdf .
Bergstrom, J.C. and D. Ty, 2017: Economics of Carbon Capture and Storage. In: Recent Advances in Carbon Capture and Storage, InTech. Recent Advances in Carbon Capture and Storage, DOI10.5772/62966, 266 pp.
Bezner Kerr, R., T. Hasegawa, R. Lasco, I. Bhatt, D. Deryng, A. Farrell, H. Gurney-Smith, H. Ju, S. Lluch-Cota, F. Meza, G. Nelson, H. Neufeldt, and P. Thornton, 2021: Food, fibre, and other ecosystem products. In: Climate Change 2022: Impacts, Adaptation and Vulnerability of Working Group II to the Sixth Assessment Report of the Intergovernmental Panel on Climate Change[H.-O. Pörtner, D.C. Roberts, M. Tignor, E.S. Poloczanska, K. Mintenbeck, A. Alegría, M. Craig, S. Langsdorf, S. Löschke, V. Möller, A. Okem, B. Rama (eds.)]. Cambridge University Press, Cambridge, UK and New York, NY, USA. In press.
BGA, 2020: BlueGreen Alliance | Buy Clean. https://www.bluegreenalliance.org/work-issue/buy-clean/ (Accessed November 29, 2020).
Bicer, Y. and I. Dincer, 2017: Life cycle assessment of nuclear-based hydrogen and ammonia production options: A comparative evaluation. Int. J. Hydrogen Energy, 42(33) , 21559–21570, doi:10.1016/j.ijhydene.2017.02.002.
Biel, K. and C.H. Glock, 2016: Systematic literature review of decision support models for energy-efficient production planning. Comput. Ind. Eng. , 101, 243–259, doi:10.1016/j.cie.2016.08.021.
Binder, M., and A.K. Blankenberg, 2017: Green lifestyles and subjective well-being: More about self-image than actual behavior?J. Econ. Behav. Organ. , 137, 304–323, doi:10.1016/j.jebo.2017.03.009.
BIR, 2020: World Steel Recycling in Figures2015–2019., Brussels, Belgium, 40 pp. Bureau of International Recycling, Brussels, Belgium.
Birat, J.P., 2012: Sustainability footprint of steelmaking byproducts. Ironmak. Steelmak. , 39(4) , 270–277, doi:10.1179/1743281211Y.0000000054.
Blanco, C., F. Caro and C.J. Corbett, 2016: The state of supply chain carbon footprinting: analysis of CDP disclosures by US firms. J. Clean. Prod. , 135, 1189–1197, doi:10.1016/J.JCLEPRO.2016.06.132.
Bleischwitz, R., 2020: Mineral resources in the age of climate adaptation and resilience. J. Ind. Ecol. , 24 (2), 291–299, doi:10.1111/jiec.12951.
Bleischwitz, R., V. Nechifor, M. Winning, B. Huang, and Y. Geng, 2018: Extrapolation or saturation – Revisiting growth patterns, development stages and decoupling. Glob. Environ. Change, 48, 86–96, doi:10.1016/j.gloenvcha.2017.11.008.
BMU, 2021: Eckpunkte für eine Förderrichtlinie Klimaschutzverträge zur Umsetzung des Pilotprogramms “Carbon Contracts for Difference.”5 pp. Bundesministerium für Umwelt, Naturschutz und nukleare Sicherheit (BMU)https://www.bmu.de/fileadmin/Daten_BMU/Download_PDF/Klimaschutz/ eckpunktepapier_klimaschutzvertraege_ccfd_bf.pdf .
Bonato, D. and R. Orsini, 2017: Urban Circular Economy: The New Frontier for European Cities’ Sustainable Development. In: Sustainable Cities and Communities Design Handbook: Green Engineering, Architecture, and Technology, Elsevier, Oxford, UK, Cambridge, USA. pp. 235–245.
Bonner, M., 2017: An exploration of the opportunities to promote carbon capture and storage (CCS) in the United Nations framework convention on Climate Change (UNFCCC). 19 pp. Docklands Australia. https://www.globalccsinstitute.com/archive/hub/publications/201643/1706-ccs-opportunities-unfccc-comms-fd.1-fina.pdf .
Boulamanti A., and J.A. Moya Rivera, 2017: Energy efficiency and GHG emissions: Prospective scenarios for the Chemical and Petrochemical Industry. 229 pp. European Commission, Joint Research Centre, Petten, The Netherlands.
Boyce, J.K., 2018: Carbon Pricing: Effectiveness and Equity. Ecol. Econ. , 150, 52–61, doi:10.1016/J.ECOLECON.2018.03.030.
BP, 2020: Statistical Review of World Energy. 65 pp. BP, London. https://www.bp.com/en/global/corporate/energy-economics/statistical-review-of-world-energy.html.
Branger, F. and P. Quirion, 2014a: Climate policy and the “carbon haven” effect. Wiley Interdiscip. Rev. Clim. Change, 5(1) , 53–71, doi:10.1002/wcc.245.
Branger, F., and P. Quirion, 2014b: Would border carbon adjustments prevent carbon leakage and heavy industry competitiveness losses? Insights from a meta-analysis of recent economic studies. Ecol. Econ. , 99, 29–39, doi:10.1016/j.ecolecon.2013.12.010.
Branger, F., P. Quirion, and J. Chevallier, 2016: Carbon leakage and competitiveness of cement and steel industries under the EU ETS: Much ado about nothing. Energy J. , 37(3) , 109–135, doi:10.5547/01956574.37.3.fbra.
Bratt, C., S. Hallstedt, K.-H. Robèrt, G. Broman, and J. Oldmark, 2013: Assessment of criteria development for public procurement from a strategic sustainability perspective. J. Clean. Prod. , 52, 309–316, doi:10.1016/J.JCLEPRO.2013.02.007.
Braun, A., P. Kleine-Moellhoff, V. Reichenberger, and S. Seiter, 2018: Case Study Analysing Potentials to Improve Material Efficiency in Manufacturing Supply Chains, Considering Circular Economy Aspects. Sustainability, 10(3) , 880, doi:10.3390/su10030880.
Brécard, D., 2014: Consumer confusion over the profusion of eco-labels: Lessons from a double differentiation model. Resour. Energy Econ. , 37, 64–84, doi:10.1016/j.reseneeco.2013.10.002.
Breyer, C., E. Tsupari, V. Tikka, and P. Vainikka, 2015: Power-to-Gas as an Emerging Profitable Business Through Creating an Integrated Value Chain. Energy Procedia, 73, 182–189, doi:10.1016/j.egypro.2015.07.668.
Breyer, C., M. Fasihi, C. Bajamundi, and F. Creutzig, 2019: Direct Air Capture of CO2: A Key Technology for Ambitious Climate Change Mitigation. Joule, 3(9) , 2053–2057, doi:10.1016/j.joule.2019.08.010.
Brinkerhoff, P. and GLDNV, 2015: Industrial Decarbonisation & Energy Efficiency Roadmaps to 2050: Cement . 94 pp. Report prepared for UK Department of Energy and Climate Change and Department for Business, Innovation and Skills. WSP and Parsons Brinckerhoff and DNV GL, New York, USA and Bærum, Norway. https://www.gov.uk/government/uploads/system/uploads/attachment_data/file/416674/Cement_Report.pdf .
Bruhn, T., H. Naims, and B. Olfe-Kräutlein, 2016: Separating the debate on CO2 utilisation from carbon capture and storage. Environ. Sci. Policy, 60, 38–43, doi:10.1016/j.envsci.2016.03.001.
Brynolf, S., M. Taljegard, M. Grahn, and J. Hansson, 2018: Electrofuels for the transport sector: A review of production costs. Renew. Sustain. Energy Rev. , 81, 1887–1905, doi:10.1016/j.rser.2017.05.288.
Bühler, F., S. Petrović, K. Karlsson, and B. Elmegaard, 2017: Industrial excess heat for district heating in Denmark. Appl. Energy, 205 (August), 991–1001, doi:10.1016/j.apenergy.2017.08.032.
Burritt, R. and S. Schaltegger, 2014: Accounting towards sustainability in production and supply chains. Br. Account. Rev. , 46(4) , 327–343, doi:10.1016/j.bar.2014.10.001.
Busch, J., T.J. Foxon, and P.G. Taylor, 2018: Designing industrial strategy for a low carbon transformation. Environ. Innov. Soc. Transitions, 29, 114–125, doi:10.1016/j.eist.2018.07.005.
Cabrera Serrenho, A., M. Drewniok, C. Dunant, and J.M. Allwood, 2019: Testing the greenhouse gas emissions reduction potential of alternative strategies for the English housing stock. Resour. Conserv. Recycl. , 144, 267–275, doi:10.1016/j.resconrec.2019.02.001.
California Climate Investments, 2020: Annual Report to the Legislature on California Climate Investments Using Cap-and-Trade Auction Proceeds, Sacramento, CA, 126 pp. https://ww2.arb.ca.gov/sites/default/files/auction- proceeds/2020_cci_annual_report.pdf .
Calisto Friant, M., W.J.V. Vermeulen, and R. Salomone, 2021: Analysing European Union circular economy policies: words versus actions. Sustain. Prod. Consum. , 27, 337–353, doi:10.1016/j.spc.2020.11.001.
Cambridge Econometrics, Trinomics and ICF, 2018: Impacts of circular economy policies on the labour market . 78 pp. https://www.camecon.com/wp-content/uploads/2019/01/Circular-Economy-DG-Env-final-report.pdf .
Cao, Z., L. Shen, A.N. Løvik, D.B. Müller, and G. Liu, 2017: Elaborating the History of Our Cementing Societies: An in-Use Stock Perspective. Environ. Sci. Technol. , 51(19) , 11468–11475, doi:10.1021/acs.est.7b03077.
Cao, Z. et al., 2018: A Probabilistic Dynamic Material Flow Analysis Model for Chinese Urban Housing Stock. J. Ind. Ecol. , 22(2) , 377–391, doi:10.1111/jiec.12579.
Cao, Z., G. Liu, S. Zhong, H. Dai, and S. Pauliuk, 2019: Integrating Dynamic Material Flow Analysis and Computable General Equilibrium Models for Both Mass and Monetary Balances in Prospective Modeling: A Case for the Chinese Building Sector. Environ. Sci. Technol. , 53 (1), 224–233, doi:10.1021/acs.est.8b03633.
Cao, Z. et al., 2020: The sponge effect and carbon emission mitigation potentials of the global cement cycle. Nat. Commun. , 11(1) , 3777, doi:10.1038/s41467-020-17583-w.
Carayannis, E.G. and D.F.J. Campbell, 2019: Smart Quintuple Helix Innovation Systems. Springer International Publishing, Cham, Switzerland, 51–54 pp.
Carl, J. and D. Fedor, 2016: Tracking global carbon revenues: A survey of carbon taxes versus cap-and-trade in the real world. Energy Policy, 96, 50–77, doi:10.1016/j.enpol.2016.05.023.
Carratù, M., B. Chiarini, and P. Piselli, 2020: Effects of European emission unit allowance auctions on corporate profitability. Energy Policy, 144, 111584, doi:10.1016/j.enpol.2020.111584.
CAT, 2020: Paris Agreement Compatible Sectoral Benchmark. 67 pp. https://climateactiontracker.org/documents/753/CAT_2020-07-10_Paris AgreementBenchmarks_FullReport.pdf .
Cavaliere, P., 2019: Electrolysis of Iron Ores: Most Efficient Technologies for Greenhouse Emissions Abatement. In: Clean Ironmaking and Steelmaking Processes, Springer International Publishing, Cham, Switzerland, pp. 555–576.
CDIAC, 2017: CDIAC Fossil-Fuel CO2Emissions. PA, USA. https://cdiac.ess-dive.lbl.gov/trends/emis/tre_glob_2014.html (Accessed December 20, 2019).
CDP, 2019: Cascading commitments: driving ambitious action through supply chain engagement . New York, USA, 39 pp. https://cdn.cdp.net/cdp-production/cms/reports/documents/000/004/072/original/CDP_Supply_Chain_Report_2019.pdf?1550490556. (Accessed December 16, 2019).
Celadyn, W., 2014: Durability of buildings and sustainable architecture. Working paper from Technical Transactions Architecture, 7-A, 17–26 pp.https://www.semanticscholar.org/paper/Durability-of-buildings-and-sustainable-Celadyn/b0ddee2a11b8fd6e573f804924d02f89ffbc7b7b
CEMBUREAU, 2020: Cementing the European Green Deal. Brussels, Belgium, 7 pp. https://cembureau.eu/media/kuxd32gi/cembureau-2050-roadmap_final-version_web.pdf .
Champier, D., 2017: Thermoelectric generators: A review of applications. Energy Convers. Manag. , 140, 167–181, doi:10.1016/j.enconman.2017.02.070.
Chan, E. et al., 2020: Eight-Year Estimates of Methane Emissions from Oil and Gas Operations in Western Canada Are Nearly Twice Those Reported in Inventories. Environ. Sci. Technol. , 54(23) , 14899–14909, doi:10.1021/acs.est.0c04117.
Chan, Y. and R. Kantamaneni, 2016: Study of Energy Efficiency and Energy Saving Potential in Industry and on Possible Policy Mechanisms. London, UK, 456 pp. https://energy.ec.europa.eu/system/files/2016-01/151201% 2520DG%2520ENER%2520Industrial%2520EE%2520study%2520-%2520final%2520report_clean_stc_0.pdf . (Accessed August 28, 2021).
Chastas, P., T. Theodosiou, and D. Bikas, 2016: Embodied energy in residential buildings-towards the nearly zero energy building: A literature review. Build. Environ. , 105, 267–282, doi:10.1016/j.buildenv.2016.05.040.
Chatziaras, N., C.S. Psomopoulos, and N.J. Themelis, 2016: Use of waste derived fuels in cement industry: a review. Manag. Environ. Qual. An Int. J. , 27 (2), 178–193, doi:10.1108/MEQ-01-2015-0012.
Cheng, W., A. Appolloni, A. D’Amato, and Q. Zhu, 2018: Green Public Procurement, missing concepts and future trends – A critical review. J. Clean. Prod. , 176, 770–784, doi:10.1016/J.JCLEPRO.2017.12.027.
Chiappinelli, O. et al., 2019: Inclusive transformation of the European materials sector. Climate Strategies, London, UK. 29 pp. https://climatestrategies.org/publication/inclusive-transformat ion-materials/.
Chrobak, U., 2021: Corporate Climate Pledges Pile Up—Will It Matter?Engineering, 7 (8), 1044–1046, doi:10.1016/j.eng.2021.06.011.
CIEL, 2017: How Fracked Gas, Cheap Oil, and Unburnable Coal are Driving the Plastics Boom., Washington, DC., 9 pp. https://www.ciel.org/wp-content/uploads/2017/09/Fueling-Plastics-How-Fracked-Gas-Cheap-Oil-and-Unburnable-Coal-are-Driving-the-Plastics-Boom.pdf .
Circle Economy, 2020: Circularity gap report 2020. The Hague, Netherlands, 69 pp. https://assets.website-files.com/5e185aa4d27bcf348400ed82/5e26 ead616b6d1d157ff4293_20200120%20-%20CGR%20Global%20- %20Report%20web%20single%20page%20-%20210x297mm%20-%20compressed.pdf . (Accessed December 18, 2020).
Climact, 2018: Net zero by 2050: from whether to how – zero emissions pathways to the Europe we want . The Hague, The Netherlands, 68 pp. https://europeanclimate.org/wp-content/uploads/2019/11/09-18-net-zero-by-2050-from-whether-to-how.pdf . (Accessed March 27, 2021).
Cohen, M.A., and M.P. Vandenbergh, 2012: The potential role of carbon labeling in a green economy. Energy Econ. , 34, S53–S63, doi:10.1016/J.ENECO.2012.08.032.
Cosbey, A.,S. Droege, C. Fischer, and C. Munnings, 2019: Developing Guidance for Implementing Border Carbon Adjustments: Lessons, Cautions, and Research Needs from the Literature. Rev. Environ. Econ. Policy, 13 (1), 3–22, doi:10.1093/reep/rey020.
Costantini, V., F. Crespi, and E. Paglialunga, 2018: The employment impact of private and public actions for energy efficiency: Evidence from European industries. Energy Policy, 119, 250–267, doi:10.1016/j.enpol.2018.04.035.
Craglia, M. and J. Cullen, 2020: Modelling transport emissions in an uncertain future: What actions make a difference?Transp. Res. Part D Transp. Environ. , 89, 102614, doi:10.1016/j.trd.2020.102614.
Creutzig, F., 2019: The Mitigation Trinity: Coordinating Policies to Escalate Climate Mitigation. One Earth, 1(1) , 76–85, doi:10.1016/j.oneear.2019.08.007.
Crijns-Graus, W., H. Yue, S. Zhang, K. Kermeli, and E. Worrell, 2020: Energy Efficiency Improvement Opportunities in the Global Industrial Sector. In: Encyclopedia of Renewable and Sustainable Materials, Elsevier, Oxford, UK and Cambridge, USA, pp. 377–388.
Crippa, M. et al., 2021: EDGAR v6.0 Greenhouse Gas Emissions. Eur. Comm. Jt. Res. Cent. [Dataset], doi:http://data.europa.eu/89h/97a67d67-c62e-4826-b873-9d972c4f670b.
Cuéllar-Franca, R.M. and A. Azapagic, 2015: Carbon capture, storage and utilisation technologies: A critical analysis and comparison of their life cycle environmental impacts. J. CO2Util. , 9, 82–102, doi:10.1016/j.jcou.2014.12.001.
Cullen, J. M. and J. M. Allwood, 2013: Mapping the global flow of aluminum: From liquid aluminum to end-use goods. Environ. Sci. Technol. , 47(7) , 3057–3064, doi:10.1021/es304256s.
D’Alessandro, A. et al., 2016: Innovative concretes for low-carbon constructions: a review. Int. J. Low-Carbon Technol. , 12(3), 289–309, doi:10.1093/ijlct/ctw013.
D’Amato, D., J. Korhonen, and A. Toppinen, 2019: Circular, Green, and Bio Economy: How Do Companies in Land-Use Intensive Sectors Align with Sustainability Concepts?Ecol. Econ. , 158 (January), 116–133, doi:10.1016/j.ecolecon.2018.12.026.
Daehn, K.E., A. Cabrera Serrenho, and J.M. Allwood, 2017: How Will Copper Contamination Constrain Future Global Steel Recycling?Environ. Sci. Technol. , 51(11) , 6599–6606, doi:10.1021/acs.est.7b00997.
Daggash, H.A. et al., 2018: Closing the carbon cycle to maximise climate change mitigation: power-to-methanol vs. power-to-direct air capture. Sustain. Energy Fuels, 2(6) , 1153–1169, doi:10.1039/C8SE00061A.
Daniel Posen, I., P. Jaramillo, A.E. Landis, and W. Michael Griffin, 2017: Greenhouse gas mitigation for U.S. plastics production: Energy first, feedstocks later. Environ. Res. Lett. , 12(3) , 034024, doi:10.1088/1748-9326/aa60a7.
Darnall, N., C. Ponting, and D.A. Vazquez-Brust, 2012: Why Consumers Buy Green. In: Green Growth: Managing the Transition to a Sustainable Economy, Springer Netherlands, Dordrecht, pp. 287–308.
Das, S., 2021: The quest for low carbon aluminum: Developing a sustainability index. Light Met. Age, 79(1) , 34–43.
Davidson, M.G., R.A. Furlong, and M.C. McManus, 2021: Developments in the life cycle assessment of chemical recycling of plastic waste – A review. J. Clean. Prod. , 293, 126163, doi:10.1016/j.jclepro.2021.126163.
Davis, S.J. et al., 2018: Net-zero emissions energy systems. Science. , 360 (6396), doi:10.1126/science.aas9793.
Dawkins, E. et al., 2019: Advancing sustainable consumption at the local government level: A literature review. J. Clean. Prod. , 231, 1450–1462, doi:10.1016/j.jclepro.2019.05.176.
de la Rue du Can, S. et al., 2019: Modeling India’s energy future using a bottom-up approach. Appl. Energy, 238, 1108–1125, doi:10.1016/J.APENERGY.2019.01.065.
De Luna, P. et al., 2019: What would it take for renewably powered electrosynthesis to displace petrochemical processes?Science, 364(6438) , eaav3506, doi:10.1126/science.aav3506.
de-Magistris, T. and A. Gracia, 2016: Consumers’ willingness-to-pay for sustainable food products: the case of organically and locally grown almonds in Spain. J. Clean. Prod. , 118, 97–104, doi:10.1016/J.JCLEPRO.2016.01.050.
Dean, C.C., J. Blamey, N.H. Florin, M.J. Al-Jeboori, and P.S. Fennell, 2011: The calcium looping cycle for CO2 capture from power generation, cement manufacture and hydrogen production. Chem. Eng. Res. Des. , 89(6) , 836–855, doi:10.1016/j.cherd.2010.10.013.
Deason, J., M. Wei, G. Leventis, S. Smith, and L. Schwartz, 2018: Electrification of buildings and industry in the United States. Berkeley, USA, 65 pp.http://eta-publications.lbl.gov/sites/default/files/electrification_of_buildings_and_industry_final_0.pdf . (Accessed March 27, 2021).
Denis-Ryan, A., C. Bataille, and F. Jotzo, 2016: Managing carbon-intensive materials in a decarbonizing world without a global price on carbon. Clim. Policy, 16(sup1) , S110–S128, doi:10.1080/14693062.2016.1176008.
De Smet, M. and M. Linder, 2019: A circular economy for plastics – Insights from research and innovation to inform policy and funding decisions. Brussels, Belgium, 239 pp. https://www.hbm4eu.eu/wp-content/uploads/ 2019/03/2019_RI_Report_A-circular-economy-for-plastics.pdf . (Accessed December 15, 2019).
Detz, R.J. and B. van der Zwaan, 2019: Transitioning towards negative CO2 emissions. Energy Policy, 133 (January), 110938, doi:10.1016/j.enpol.2019.110938.
DGS, 2020: Buy Clean California Act – Department of General Services (DGS), CA, USA. https://www.dgs.ca.gov/PD/Resources/Page-Content/Procurement-Division-Resources-List-Folder/Buy-Clean-California-Act . (Accessed October 29, 2021).
Dhandra, T.K., 2019: Achieving triple dividend through mindfulness: More sustainable consumption, less unsustainable consumption and more life satisfaction. Ecol. Econ. , 161, 83–90, doi:10.1016/j.ecolecon.2019.03.021.
Dhar, S., M. Pathak, and P.R. Shukla, 2020: Transformation of India’s steel and cement industry in a sustainable 1.5°C world. Energy Policy, 137, 111104, doi:10.1016/j.enpol.2019.111104.
Di Foggia, G., 2018: Energy efficiency measures in buildings for achieving sustainable development goals. Heliyon, 4(11) , e00953, doi:10.1016/j.heliyon.2018.e00953.
Dimitriou, I. et al., 2015: Carbon dioxide utilisation for production of transport fuels: process and economic analysis. Energy Environ. Sci. , 8(6) , 1775–1789, doi:10.1039/C4EE04117H.
Ding, J. and W. Hua, 2012: Featured chemical industrial parks in China: History, current status and outlook. Resour. Conserv. Recycl. , 63, 43–53, doi:10.1016/J.RESCONREC.2012.03.001.
Dodman, D., B. Hayward, M. Pelling, V. Castan Broto, W. Chow, E. Chu, R. Dawson, L. Khirfan, T. McPhearson, A. Prakash, Y. Zheng, and G. Ziervogel, 2022: Cities, Settlements and Key Infrastructure. In: Climate Change 2022: Impacts, Adaptation, and Vulnerability. Contribution of Working Group II to the Sixth Assessment Report of the Intergovernmental Panel on Climate Change[H.-O. Pörtner, D.C. Roberts, M. Tignor, E.S. Poloczanska, K. Mintenbeck, A. Alegría, M. Craig, S. Langsdorf, S. Löschke, V. Möller, A. Okem, B. Rama (eds.)]. Cambridge University Press, Cambridge, UK and New York, NY, USA. In press.
Dogu, O. et al., 2021: The chemistry of chemical recycling of solid plastic waste via pyrolysis and gasification: State-of-the-art, challenges, and future directions. Progress in Energy and Combustion Science, Vol. 84, 100901. doi.org/10.1016/j.pecs.2020.100901
Domenech, T. and B. Bahn-Walkowiak, 2019: Transition Towards a Resource Efficient Circular Economy in Europe: Policy Lessons From the EU and the Member States. Ecol. Econ. , 155, 7–19, doi:10.1016/j.ecolecon.2017.11.001.
Dong, H., Y. Geng, X. Yu, and J. Li, 2018: Uncovering energy saving and carbon reduction potential from recycling wastes: A case of Shanghai in China. J. Clean. Prod. , 205, 27–35, doi:10.1016/j.jclepro.2018.08.343.
Dunant, C.F., M.P. Drewniok, S. Eleftheriadis, J.M. Cullen, and J.M. Allwood, 2018: Regularity and optimisation practice in steel structural frames in real design cases. Resour. Conserv. Recycl. , 134, 294–302, doi:10.1016/j.resconrec.2018.01.009.
Durán-Romero, G. et al., 2020: Bridging the gap between circular economy and climate change mitigation policies through eco-innovations and Quintuple Helix Model. Technol. Forecast. Soc. Change, 160, 120246, doi:10.1016/j.techfore.2020.120246.
Eames, M., W. McDowall, M. Hodson, and S. Marvin, 2006: Negotiating contested visions and place-specific expectations of the hydrogen economy. Technol. Anal. Strateg. Manag. , 18(3–4) , 361–374, doi:10.1080/09537320600777127.
Ebrahimi, A. et al., 2017: Sustainable transformation of fly ash industrial waste into a construction cement blend via CO2 carbonation. J. Clean. Prod. , 156, 660–669, doi:10.1016/j.jclepro.2017.04.037.
Edgar, T.F. and E.N. Pistikopoulos, 2018: Smart manufacturing and energy systems. Comput. Chem. Eng. , 114, 130–144, doi:10.1016/j.compchemeng.2017.10.027.
Eicke, L., S. Weko, M. Apergi, and A. Marian, 2021: Pulling up the carbon ladder? Decarbonization, dependence, and third-country risks from the European carbon border adjustment mechanism. Energy Res. Soc. Sci. , 80, 102240, doi:10.1016/j.erss.2021.102240.
Ellis, J., D. Nachtigall, and F. Venmans, 2019: Carbon pricing and competitiveness: Are they at odds?OECD Publishing, Paris, France, 25 pp. (Accessed August 27, 2021).
Elshkaki, A., T.E. Graedel, L. Ciacci, and B.K. Reck, 2018: Resource Demand Scenarios for the Major Metals. Environ. Sci. Technol. , 52(5) , 2491–2497, doi:10.1021/acs.est.7b05154.
Energy Transitions Commission, 2018: Mission Possible: Reaching net-zero carbon emissions from harder-to-abate sectors by mid-century. London, UK, 171 pp. http://www.energy-transitions.org/sites/default/files/ETC_Mission Possible_FullReport.pdf . (Accessed March 27, 2021).
ERIA, 2016: Exploring Energy-Saving Potential for Industrial Sector Using Factory, Energy Management System. In: Study on the Advancement of the Energy Management System in the East Asia Summit Region ERIA Research Project Report 2015 17[Iida, Y., S. Inoue, and Y. Li, (eds.)], pp. 19–52.
Erickson, P., S. Kartha, M. Lazarus, and K. Tempest, 2015: Assessing carbon lock-in. Environ. Res. Lett. , 10(8) , 084023, doi:10.1088/1748-9326/10/8/084023.
Ericsson, K., 2017: Biogenic carbon dioxide as feedstock for production of chemicals and fuels: A techno-economic assessment with a European perspective. Environmental and Energy System Studies, Lund, Sweden, 47 pp. https://portal.research.lu.se/portal/en/publications/biogenic-carbon-dioxide-as-feedstock-for-production-of-chemicals-and-fuels(67d3a737-cf7c-4109-bc4f-a6346956d6a2).html. (Accessed March 27, 2021).
Ericsson, K. and L.J. Nilsson, 2018: Climate innovations in the paper industry: Prospects for decarbonisation. REINVENT project, Lund, Sweden, 33 pp. https://static1.squarespace.com/static/59f0cb986957da5faf64971e/t/5dc1acfb29bc520c15c858fc/1572973823092/%28updated%29D2.4+Climate+innovations+in+the+paper+industry.pdf . (Accessed March 27, 2021).
Eriksson, L., M. Morandin, and S. Harvey, 2018: A feasibility study of improved heat recovery and excess heat export at a Swedish chemical complex site. Int. J. Energy Res. , 42(4) , 1580–1593, doi:10.1002/er.3950.
EUROFER, 2019: Low Carbon Roadmap. Pathways to a CO2-neutral European Steel Industry., Brussels, Belgium, 18 pp. https://www.eurofer.eu/assets/Uploads/EUROFER-Low-Carbon-Roadmap-Pathways-to-a-CO2-neutral-European-Steel-Industry.pdf .
European Commission, 2016: Buying Green! A handbook on green public procurement. [Comprando verde! Un manual de Compras Públicas Verdes]. 3rd ed., Brussels, Belgium.
European Commission, 2018: A Clean Planet for all – A European long-term strategic vision for a prosperous, modern, competitive and climate neutral economy. Brussles, Belgium, 25 pp. https://eur-lex.europa.eu/legal-content/EN/TXT/PDF/?uri=CELEX:52018DC0773&from=EN. (Accessed December 15, 2019).
European Commission, 2020: A new Circular Economy Action Plan., Brussels, Belgium., 20 pp. https://eur-lex.europa.eu/legal-content/EN/TXT/ ?qid=1583933814386&uri=COM :2020:98:FIN.
European Commission, 2021: Proposal for a REGULATION OF THE EUROPEAN PARLIAMENT AND OF THE COUNCIL establishing a carbon border adjustment mechanism. Brussels, Belgium.
Eyre, N., 2021: From using heat to using work: reconceptualising the zero carbon energy transition. Energy Effic. , 14(7) , 77, doi:10.1007/s12053-021-09982-9.
Fan, J.-L., M. Xu, F. Li, L. Yang, and X. Zhang, 2018: Carbon capture and storage (CCS) retrofit potential of coal-fired power plants in China: The technology lock-in and cost optimization perspective. Appl. Energy, 229, 326–334, doi:10.1016/j.apenergy.2018.07.117.
Fan, Z. and S.J. Friedmann, 2021: Low-carbon production of iron and steel: Technology options, economic assessment, and policy. Joule, 5 (4), 829–862, doi:10.1016/j.joule.2021.02.018.
Fang, H., J. Xia, and Y. Jiang, 2015: Key issues and solutions in a district heating system using low-grade industrial waste heat. Energy, 86, 589–602, doi:10.1016/j.energy.2015.04.052.
Fankhauser, S. and F. Jotzo, 2018: Economic growth and development with low-carbon energy. Wiley Interdiscip. Rev. Clim. Change, 9(1) , e495, doi:10.1002/wcc.495.
Faria, J.A., 2021: Renaissance of ammonia synthesis for sustainable production of energy and fertilizers. Current Opinion in Green and Sustainable Chemistry, 29, 100466. 10.1016/j.cogsc.2021.100466.
Fasihi, M., D. Bogdanov, and C. Breyer, 2017: Long-Term Hydrocarbon Trade Options for the Maghreb Region and Europe—Renewable Energy Based Synthetic Fuels for a Net Zero Emissions World. Sustainability, 9 (2), 306, doi:10.3390/su9020306.
Fasihi, M., O. Efimova, and C. Breyer, 2019: Techno-economic assessment of CO2 direct air capture plants. J. Clean. Prod. , 224, 957–980, doi:10.1016/j.jclepro.2019.03.086.
Fasihi, M., R. Weiss, J. Savolainen, and C. Breyer, 2021: Global potential of green ammonia based on hybrid PV-wind power plants. Appl. Energy, 294, 116170, doi:10.1016/j.apenergy.2020.116170.
Fawkes, S., K. Oung, and D. Thorpe, 2016: Best Practices and Case Studies for Industrial Energy Efficiency Improvement – An Introduction for Policy Makers. Copenhagen, Denmark, 171 pp. https://europa.eu/capacity4dev/file/31409/download?token=kOYq7O5T.
Fechner, T. and C. Kray, 2012: Attacking location privacy. Proceedings of the 2012 ACM Conference on Ubiquitous Computing - UbiComp ’12, New York, NY, USA, ACM Press, 95–98.
Ferrero, R., M. Collotta, M.V. Bueno-Delgado, and H.C. Chen, 2020: Smart management energy systems in industry 4.0. Energies, 13 (2), 382, doi:10.3390/en13020382.
Feucht, Y. and K. Zander, 2018: Consumers’ preferences for carbon labels and the underlying reasoning. A mixed methods approach in 6 European countries. J. Clean. Prod. , 178, 740–748, doi:10.1016/J.JCLEPRO.2017.12.236.
Finnveden, G. et al., 2009: Recent developments in Life Cycle Assessment. J. Environ. Manage. , 91(1) , 1–21, doi:10.1016/j.jenvman.2009.06.018.
Fischedick, M., J. Roy, A. Abdel-Aziz, A. Acquaye, J.M. Allwood, J.-P. Ceron, Y. Geng, H. Kheshgi, A. Lanza, D. Perczyk, L. Price, E. Santalla, C. Sheinbaum, and K. Tanaka, 2014: Industry. In: Climate Change 2014: Mitigation of Climate Change. Contribution of Working Group III to the Fifth Assessment Report of the Intergovernmental Panel on Climate Change[Edenhofer, O., R. Pichs-Madruga, Y. Sokona, E. Farahani, S. Kadner, K. Seyboth, A. Adler, I. Baum, S. Brunner, P. Eickemeier, B. Kriemann, J. Savolainen, S. Schlömer, C. von Stechow, T. Zwickel and J.C. Minx (eds.)]. Cambridge University Press, Cambridge, UK and New York, NY, USA, pp. 739–810.
Fischedick, M., J. Marzinkowski, P. Winzer, and M. Weigel, 2014b: Techno-economic evaluation of innovative steel production technologies. J. Clean. Prod. , 84(1) , 563–580, doi:10.1016/j.jclepro.2014.05.063.
Flanagan, K., E. Uyarra, and M. Laranja, 2011: Reconceptualising the “policy mix” for innovation. Res. Policy, 40(5) , 702–713, doi:10.1016/j.respol.2011.02.005.
Fowlie, M., C. Petersen, and M. Reguant, 2021: Border Carbon Adjustments When Carbon Intensity Varies across Producers: Evidence from California. AEA Pap. Proc. , 111, 401–405, doi:10.1257/pandp.20211073.
Friedmann, J., Fan, Z and Tang, K. (2019): Low-Carbon Heat Solutions for Heavy Industry: Sources, Options, and Costs Today (Centre on Global Energy Policy). New York, NY, USA 98 pp.
Fukushima, M. and Y. I. Yoshizawa, 2016: Fabrication of highly porous honeycomb-shaped mullite-zirconia insulators by gelation freezing. Adv. Powder Technol. , 27 (3), 908–913, doi:10.1016/j.apt.2016.02.015.
Fuso Nerini, F. et al., 2019: Connecting climate action with other Sustainable Development Goals. Nat. Sustain, 2(8) , 674–680, doi:10.1038/s41893-019-0334-y.
Gadema, Z. and D. Oglethorpe, 2011: The use and usefulness of carbon labelling food: A policy perspective from a survey of UK supermarket shoppers. Food Policy, 36(6) , 815–822, doi:10.1016/J.FOODPOL.2011.08.001.
Gambhir, A. et al., 2017: The contribution of non-CO2 greenhouse gas mitigation to achieving long-term temperature goals. Energies, 10(5) , 602, doi:10.3390/en10050602.
Garcia-Muiña, F.E., R. González-Sánchez, A.M. Ferrari, and D. Settembre-Blundo, 2018: The paradigms of Industry 4.0 and circular economy as enabling drivers for the competitiveness of businesses and territories: The case of an Italian ceramic tiles manufacturing company. Soc. Sci. , 7(12) , 255, doi:10.3390/socsci7120255.
García-Quevedo, J. and E. Jové-Llopis, 2021: Environmental policies and energy efficiency investments. An industry-level analysis. Energy Policy, 156, 112461, doi:10.1016/j.enpol.2021.112461.
Gardarsdottir, S. et al., 2019: Comparison of Technologies for CO2Capture from Cement Production—Part 2: Cost Analysis. Energies, 12(3) , 542, doi:10.3390/en12030542.
Garrett-Peltier, H., 2017: Green versus brown: Comparing the employment impacts of energy efficiency, renewable energy, and fossil fuels using an input-output model. Econ. Model. , 61, 439–447, doi:10.1016/j.econmod.2016.11.012.
Gayner, C. and K. K. Kar, 2016: Recent advances in thermoelectric materials. Prog. Mater. Sci. , 83, 330–382, doi:10.1016/j.pmatsci.2016.07.002.
GCCA, 2021a: The GCCA 2050 Cement and Concrete Industry Roadmap for Net Zero Concrete. London, UK, 46 pp. https://gccassociation.org/concretefuture/wp-content/uploads/2021/10/GCCA-Concrete-Future-Roadmap-Document-AW.pdf . Accessed 1 November 2021.
GCCA, 2021b: GNR – GCCA in Numbers. https://gccassociation.org/sustainability-innovation/gnr-gcca-in-numbers/ (Accessed August 27, 2021).
Geels, F.W., B.K. Sovacool, T. Schwanen, and S. Sorrell, 2017: The Socio-Technical Dynamics of Low-Carbon Transitions. Joule, 1(3) , 463–479, doi:10.1016/j.joule.2017.09.018.
Geng, Y., and B. Doberstein, 2008: Greening government procurement in developing countries: Building capacity in China. J. Environ. Manage. , 88(4) , 932–938, doi:10.1016/J.JENVMAN.2007.04.016.
Geng, Y., J. Fu, J. Sarkis, and B. Xue, 2012: Towards a national circular economy indicator system in China: An evaluation and critical analysis. J. Clean. Prod. , 23(1) , 216–224, doi:10.1016/j.jclepro.2011.07.005.
Geng, Y., J. Sarkis, S. Ulgiati, and P. Zhang, 2013: Measuring China’s circular economy. Science, 340(6127) , 1526–1527, doi:10.1126/science.1227059.
Geng, Y., J. Sarkis, and R. Bleischwitz, 2019: How to globalize the circular economy. Nature, 565 (7738), 153–155, doi:10.1038/d41586-019-00017-z.
Genovese, A., A.A. Acquaye, A. Figueroa, and S.C.C.L. Koh, 2017: Sustainable supply chain management and the transition towards a circular economy: Evidence and some applications. Omega (UK) , 66, 344–357, doi:10.1016/j.omega.2015.05.015.
Gerbert, P. et al., 2018: Klimapfade für Deutschland (Climate paths for Germany). BCG and Prognos. Berlin, Germany, 286 pp. https://www.zvei.org/fileadmin/user_upload/Presse_und_MedienPublikationen/2018/ Januar/Klimapfade_fuer_Deutschland_BDI-Studie_/Klimapfade-fuer-Deutschland-BDI-Studie-12-01-2018.pdf . (Accessed December 18, 2019).
Geyer, R., J.R. Jambeck, and K.L. Law, 2017: Production, use, and fate of all plastics ever made. Sci. Adv. , 3(7) , doi:10.1126/sciadv.1700782.
Ghisellini, P., C. Cialani, and S. Ulgiati, 2016: A review on circular economy: the expected transition to a balanced interplay of environmental and economic systems. J. Clean. Prod. , 114, 11–32, doi:10.1016/J.JCLEPRO.2015.09.007.
Ghisetti, C., 2017: Demand-pull and environmental innovations: Estimating the effects of innovative public procurement. Technol. Forecast. Soc. Change, 125, 178–187, doi:10.1016/j.techfore.2017.07.020.
Giannaris, S., C. Bruce, B. Jacobs, W. Srisang, and D. Janowczyk, 2020: Implementing a second generation CCS facility on a coal fired power station – results of a feasibility study to retrofit SaskPower’s Shand power station with CCS. Greenh. Gases Sci. Technol. , 10(3) , 506–518, doi:10.1002/ghg.1989.
Gielen, D., D. Saygin, E. Taibi, and J. Birat, 2020: Renewables‐based decarbonization and relocation of iron and steel making: A case study. J. Ind. Ecol. , 24(5) , 1113–1125, doi:10.1111/jiec.12997.
Gillingham, K., S. Carattini, and D. Esty, 2017: Lessons from first campus carbon-pricing scheme. Nature, 551(7678) , 27–29, doi:10.1038/551027a.
Glenk, G. and S. Reichelstein, 2019: Economics of converting renewable power to hydrogen. Nat. Energy, 4(3) , 216–222, doi:10.1038/s41560-019-0326-1.
Gogate, M. R., 2019: Methanol-to-olefins process technology: current status and future prospects. Pet. Sci. Technol. , 37(5) , 559–565, doi:10.1080/10916466.2018.1555589.
Gonzalez Hernandez, A., S. Cooper-Searle, A.C.H. Skelton, and J.M. Cullen, 2018a: Leveraging material efficiency as an energy and climate instrument for heavy industries in the EU. Energy Policy, 120, 533–549, doi:10.1016/j.enpol.2018.05.055.
Gonzalez Hernandez, A., L. Paoli, and J.M. Cullen, 2018b: How resource-efficient is the global steel industry?Resour. Conserv. Recycl. , 133, 132–145, doi:10.1016/j.resconrec.2018.02.008.
Govindan, K., 2018: Sustainable consumption and production in the food supply chain: A conceptual framework. Int. J. Prod. Econ. , 195, 419–431, doi:10.1016/j.ijpe.2017.03.003.
Graedel, T.E. et al., 2011: Recycling rates of metals: a status report . Paris, France, 44 pp.
Graedel, T.E., E.M. Harper, N.T. Nassar, and B.K. Reck, 2015: On the materials basis of modern society. Proc. Natl. Acad. Sci. , 112(20) , 6295–6300, doi:10.1073/pnas.1312752110.
Grainger, C.A. and C.D. Kolstad, 2010: Who Pays a Price on Carbon?Environ. Resour. Econ. , 46(3) , 359–376, doi:10.1007/s10640-010-9345-x.
Grillitsch, M., T. Hansen, L. Coenen, J. Miörner, and J. Moodysson, 2019: Innovation policy for system-wide transformation: The case of strategic innovation programmes (SIPs) in Sweden. Res. Policy, 48(4) , 1048–1061, doi:10.1016/j.respol.2018.10.004.
Grubb, M., Hourcade J. and Neuhoff K., 2014: Planetary Economics. Routledge, Oxfordshire, UK, 548 pp.
Grubler, A. et al., 2018: A low energy demand scenario for meeting the 1.5°C target and sustainable development goals without negative emission technologies. Nat. Energy, 3(6) , 515–527, doi:10.1038/s41560-018-0172-6.
Guenther, M., C.M. Saunders, and P.R. Tait, 2012: Carbon labeling and consumer attitudes. Carbon Manag. , 3(5) , 445–455, doi:10.4155/cmt.12.50.
Guillen-Royo, M., 2019: Sustainable consumption and wellbeing: Does on-line shopping matter?J. Clean. Prod. , 229, 1112–1124, doi:10.1016/j.jclepro.2019.05.061.
Guo, B., Y. Geng, T. Sterr, L. Dong, and Y. Liu, 2016: Evaluation of promoting industrial symbiosis in a chemical industrial park: A case of Midong. J. Clean. Prod. , 135, 995–1008, doi:10.1016/j.jclepro.2016.07.006.
Guo, R. et al., 2021: Global CO2 uptake by cement from 1930 to 2019. Earth Syst. Sci. Data, 13(4) , 1791–1805, doi:10.5194/essd-13-1791-2021.
Guo, Y., J. Tian, N. Zang, Y. Gao, and L. Chen, 2018: The Role of Industrial Parks in Mitigating Greenhouse Gas Emissions from China. Environ. Sci. Technol. , 52(14) , 7754–7762, doi:10.1021/acs.est.8b00537.
Gutowski, T., D. Cooper, and S. Sahni, 2017: Why we use more materials. Philos. Trans. R. Soc. A Math. Phys. Eng. Sci. , 375(2095) , 20160368, doi:10.1098/rsta.2016.0368.
Gutowski, T.G., S. Sahni, J.M. Allwood, M.F. Ashby, and E. Worrell, 2013: The energy required to produce materials: Constraints on energy-intensity improvements, parameters of demand. Philos. Trans. R. Soc. A Math. Phys. Eng. Sci. , 371(1986) , 20120003, doi:10.1098/rsta.2012.0003.
Haberl, H. et al., 2021: Stocks, flows, services and practices: Nexus approaches to sustainable social metabolism. Ecol. Econ. , 182, 106949, doi:10.1016/j.ecolecon.2021.106949.
Habert, G. et al., 2020: Environmental impacts and decarbonization strategies in the cement and concrete industries. Nat. Rev. Earth Environ. , 1(11) , 559–573, doi:10.1038/s43017-020-0093-3.
Hagen, A. and J. Schneider, 2021: Trade sanctions and the stability of climate coalitions. J. Environ. Econ. Manage. , 109, 102504, doi:10.1016/j.jeem.2021.102504.
Haites, E., 2018: Carbon taxes and greenhouse gas emissions trading systems: what have we learned?Clim. Policy, 18(8) , 955–966, doi:10.1080/14693062.2018.1492897.
Haites, E. et al., 2018: Experience With Carbon Taxes And Greenhouse Gas Emissions Trading Systems. Duke Environmental Law & Policy Forum, Vol 29, pp 109–182.
Haraldsson, J. and M. T. Johansson, 2018: Review of measures for improved energy efficiency in production-related processes in the aluminium industry – From electrolysis to recycling. Renew. Sustainability. Energy Rev. , 93 (May), 525–548, doi:10.1016/j.rser.2018.05.043.
Harmelink, M., M. Beerepoot, and A. Puranasamriddhi, 2018: Energy Access projects and assessment of their Contribution to the Sustainable Development Goals: SDG1, SDG3, SDG4 and SDG5. Bangkok, Thailand, 56 pp. https://www.asia-pacific.undp.org/content/rbap/en/home/library/climate- and-disaster-resilience/energy-access-projects-and-SDG-benefits.html. (Accessed March 27, 2021).
Hartley, K., R. van Santen, and J. Kirchherr, 2020: Policies for transitioning towards a circular economy: Expectations from the European Union (EU). Resour. Conserv. Recycl. , 155, 104634, doi:10.1016/j.resconrec.2019.104634.
Hasanbeigi, A., L. Price, and E. Lin, 2012: Emerging energy-efficiency and CO2 emission-reduction technologies for cement and concrete production: A technical review. Renew. Sustainability. Energy Rev. , 16(8) , 6220–6238, doi:10.1016/j.rser.2012.07.019.
Hatti-Kaul, R., L.J. Nilsson, B. Zhang, N. Rehnberg, and S. Lundmark, 2020: Designing Biobased Recyclable Polymers for Plastics. Trends Biotechnol. , 38(1) , 50–67, doi:10.1016/j.tibtech.2019.04.011.
Hausfather, Z., 2015: Bounding the climate viability of natural gas as a bridge fuel to displace coal. Energy Policy, 86, 286–294, doi:10.1016/j.enpol.2015.07.012.
Heeren, N. and S. Hellweg, 2019: Tracking Construction Material over Space and Time: Prospective and Geo-referenced Modeling of Building Stocks and Construction Material Flows. J. Ind. Ecol. , 23(1) , 253–267, doi:10.1111/jiec.12739.
Hepburn, C. et al., 2019: The technological and economic prospects for CO2 utilization and removal. Nature, 575 (7781), 87–97, doi:10.1038/s41586-019-1681-6.
Hertwich, E., R. Lifset, S. Pauliuk, and N. Heeren, 2020: Resource Efficiency and Climate Change: Material Efficiency Strategies for a low-carbon Future. Paris, France, 155 pp.
Hertwich, E.G., 2020: Carbon fueling complex global value chains tripled in the period 1995–2012. Energy Econ. , 86, 104651, doi:10.1016/j.eneco.2019.104651.
Hertwich, E.G., 2021: Increased carbon footprint of materials production driven by rise in investments. Nat. Geosciences, 14(3) , 151–155, doi:10.1038/s41561-021-00690-8.
Hertwich, E.G. et al., 2019: Material efficiency strategies to reducing greenhouse gas emissions associated with buildings, vehicles, and electronics – A review. Environ. Res. Lett. , 14(4) , 043004, doi:10.1088/1748-9326/ab0fe3.
Higgins, C. and B. Coffey, 2016: Improving how sustainability reports drive change: a critical discourse analysis. J. Clean. Prod. , 136, 18–29, doi:10.1016/J.JCLEPRO.2016.01.101.
Hills, T., D. Leeson, N. Florin, and P. Fennell, 2016: Carbon Capture in the Cement Industry: Technologies, Progress, and Retrofitting. Environ. Sci. Technol. , 50(1) , 368–377, doi:10.1021/acs.est.5b03508.
Hills, T.P., M. Sceats, D. Rennie, and P. Fennell, 2017: LEILAC: Low Cost CO2Capture for the Cement and Lime Industries. Energy Procedia, 114 (July), 6166–6170.
Hilton, B. et al., 2018: Re-defining Value – The Manufacturing. Revolution. Remanufacturing, Refurbishment, Repair and Direct Reuse in the Circular Economy. Nairobi, Kenya, 267 pp.
Hoegh-Guldberg, O., D. Jacob, M. Taylor, M. Bindi, S. Brown, I. Camilloni, A. Diedhiou, R. Djalante, K.L. Ebi, F. Engelbrecht, J. Guiot, Y. Hijioka, S. Mehrotra, A. Payne, S.I. Seneviratne, A. Thomas, R. Warren, and G. Zhou, 2018: Impacts of 1.5°C Global Warming on Natural and Human Systems. In: Global Warming of 1.5°C. An IPCC Special Report on the impacts of global warming of 1.5°C above pre-industrial levels and related global greenhouse gas emission pathways, in the context of strengthening the global response to the threat of climate change, sustainable development, and efforts to eradicate poverty[Masson-Delmotte, V., P. Zhai, H.-O. Pörtner, D. Roberts, J. Skea, P.R. Shukla, A. Pirani, W. Moufouma-Okia, C. Péan, R. Pidcock, S. Connors, J.B.R. Matthews, Y. Chen, X. Zhou, M.I. Gomis, E. Lonnoy, T. Maycock, M. Tignor, and T. Waterfield eds.)]. Cambridge University Press, Cambridge, UK, and New York, NY, USA.
Holappa, L., 2020: A general vision for reduction of energy consumption and CO2 emissions from the steel industry. Metals (Basel). , 10(9) , 1–20, doi:10.3390/met10091117.
Hong, L. et al., 2016: Building stock dynamics and its impacts on materials and energy demand in China. Energy Policy, 94, 47–55, doi:10.1016/j.enpol.2016.03.024.
Honus, S., S. Kumagai, G. Fedorko, V. Molnár, and T. Yoshioka, 2018a: Pyrolysis gases produced from individual and mixed PE, PP, PS, PVC, and PET—Part I: Production and physical properties. Fuel, 221, 346–360, doi:10.1016/j.fuel.2018.02.074.
Honus, S., S. Kumagai, V. Molnár, G. Fedorko, and T. Yoshioka, 2018b: Pyrolysis gases produced from individual and mixed PE, PP, PS, PVC, and PET—Part II: Fuel characteristics. Fuel, 221, 361–373, doi:10.1016/j.fuel.2018.02.075.
Hoppmann, J., M. Peters, M. Schneider, and V.H. Hoffmann, 2013: The two faces of market support – How deployment policies affect technological exploration and exploitation in the solar photovoltaic industry. Res. Policy, 42(4) , 989–1003, doi:10.1016/j.respol.2013.01.002.
Horton, P.M., J.M. Allwood, and C. Cleaver, 2019: Implementing material efficiency in practice: A case study to improve the material utilisation of automotive sheet metal components. Resour. Conserv. Recycl. , 145, 49–66, doi:10.1016/j.resconrec.2019.02.012.
Hourcade, J.C., A. Pottier, and E. Espagne, 2018: Social value of mitigation activities and forms of carbon pricing. Int. Econ. , 155, 8–18, doi:10.1016/j.inteco.2018.06.001.
Hsieh, I.Y.L., M.S. Pan, and W.H. Green, 2020: Transition to electric vehicles in China: Implications for private motorization rate and battery market. Energy Policy, 144, 111654, doi:10.1016/j.enpol.2020.111654.
Huang, B. et al., 2019a: Review of the development of China’s Eco-industrial Park standard system. Resour. Conserv. Recycl. , 140, 137–144, doi:10.1016/j.resconrec.2018.09.013.
Huang, H. et al., 2019b: Emissions trading systems and social equity: A CGE assessment for China. Appl. Energy, 235, 1254–1265, doi:10.1016/J.APENERGY.2018.11.056.
Huang, H. et al., 2019c: Life-cycle assessment of emerging CO2 mineral carbonation-cured concrete blocks: Comparative analysis of CO2 reduction potential and optimization of environmental impacts. J. Clean. Prod. , 241, 118359, doi:10.1016/j.jclepro.2019.118359.
Huang, Z., G. Grim, J. Schaidle, and L. Tao, 2020: Using waste CO2 to increase ethanol production from corn ethanol biorefineries: Techno-economic analysis. Appl. Energy, 280, 115964, doi:10.1016/j.apenergy.2020.115964.
Ibáñez-Forés, V., B. Pacheco-Blanco, S.F. Capuz-Rizo, and M.D. Bovea, 2016: Environmental Product Declarations: Exploring their evolution and the factors affecting their demand in Europe. J. Clean. Prod. , 116, 157–169, doi:10.1016/j.jclepro.2015.12.078.
IEA, 2009: Technology roadmap: carbon capture and storage. International Energy Agency (IEA), Paris, France, 52 pp. https://www.iea.org/reports/technology-roadmap-carbon-capture-and-storage-2009. (Accessed March 27, 2021).
IEA, 2015: World Energy Outlook 2015. Paris, France, 700 pp. https://www.iea.org/reports/world-energy-outlook-2015. (Accessed March 27, 2021).
IEA, 2016: Energy and Air Pollution (Special Report). Paris, France, 266 pp. https://www.iea.org/reports/energy-and-air-pollution. (Accessed October 30, 2021).
IEA, 2017: Energy Technology Perspectives 2017. Paris, France, 438 pp.https://www.iea.org/reports/energy-technology-perspectives-2017. (Accessed December 15, 2019).
IEA, 2018a: The future of petrochemicals: towards more sustainable plastics and fertilisers. Paris, France, 66 pp. https://www.iea.org/reports/the-future-of-petrochemicals. (Accessed December 15, 2019).
IEA, 2018b: Energy Efficiency 2018. Analysis and outlooks to 2040. Paris, France, 170 pp. https://www.iea.org/reports/energy-efficiency-2018. (Accessed December 14, 2019).
IEA, 2019a: CO2 Emissions from Fuel Combustion online data service. data.iea.org/payment/products/115-co2-emissions-from-fuel-combustion-2018-edition.aspx. (Accessed December 20, 2020).
IEA, 2019b: Material efficiency in clean energy transitions. OECD, Paris, France, 158 pp. https://www.iea.org/reports/material-efficiency-in-clean-energy-transitions. (Accessed December 15, 2019).
IEA, 2019c: World Energy Outlook 2019. Paris, France, 807 pp. https://www.iea.org/reports/world-energy-outlook-2019. (Accessed December 16, 2019).
IEA, 2019d: Energy Efficiency 2019. Paris, France, 107 pp. https://www.iea.org/reports/energy-efficiency-2019. (Accessed December 19, 2020).
IEA, 2019e: Offshore Wind Outlook 2019. Paris, France, 96 pp. https://www.iea.org/reports/offshore-wind-outlook-2019. (Accessed December 23, 2019).
IEA, 2019f: The Future of Hydrogen. Paris, France, 199 pp. https://www.iea.org/reports/the-future-of-hydrogen. (Accessed December 21, 2019).
IEA, 2019g: Transforming industry through CCUS. Paris, France. 58 pp. https://www.iea.org/publications/reports/TransformingIndustrythroughCCUS/. (Accessed December 16, 2019).
IEA, 2019h: Putting CO2to use. Paris, France, 83 pp. https://www.iea.org/reports/putting-co2-to-use (Accessed December 23, 2020).
IEA, 2020a: Energy Technology Perspective 2020. Paris, France 397 pp.https://www.iea.org/reports/energy-technology-perspectives-2020 (Accessed September 23, 2020).
IEA, 2020b: Tracking industry 2020. https://www.iea.org/reports/tracking-industry-2020 (Accessed December 20, 2020).
IEA, 2020c: Iron and Steel Technology Roadmap Towards more sustainable steelmaking – Part of the Energy Technology Perspectives series. Paris, France, 187 pp. https://www.iea.org/reports/iron-and-steel-technology-roadmap. (Accessed October 29 2021).
IEA, 2020d: World energy balances and statistics. https://www.iea.org/data-and-statistics/data-product/world-energy-balances (Accessed October 29, 2021).
IEA, 2020e: Energy Efficiency 2020. Paris, France, 102 pp. https://www.iea.org/reports/energy-efficiency-2020 (Accessed December, 19, 2020).
IEA, 2020f: CO2 emissions from fuel combustion database. https://www.iea.org/reports/co2-emissions-from-fuel-combustion-overview (Accessed December 20, 2020).
IEA, 2020g: Outlook for biogas and biomethane. Paris, France, 91 pp. https://www.iea.org/reports/outlook-for-biogas-and-biomethane-prospects-for-organic-growth. (Accessed December, 19, 2020).
IEA, 2020h: Energy technology perspective special report – clean energy innovation. Paris, France, 182 pp. https://webstore.iea.org/download/direct/4022?fileName=Energy_Technology_Perspectives_2020_-_Special_Report_on_Clean_Energy_Innovation.pdf . (Accessed October, 23, 2020).
IEA, 2020i: World Energy Outlook 2020. Paris, France. 461 pp. https://www.iea.org/events/world-energy-outlook-2020. (Accessed March, 27, 2021).
IEA, 2021a: Net Zero by 2050: A Roadmap for the Global Energy Sector. Paris, France, 222 pp. https://www.iea.org/reports/net-zero-by-2050 (Accessed July, 19, 2021).
IEA, 2021b: CO2 Emissions from Fuel Combustion online data service. data.iea.org/payment/products/115-co2-emissions-from-fuel-combustion-2021-edition.aspx. (Accessed August 27, 2021).
IEA, 2021c: World Energy Outlook 2021. Paris, France, 383 pp. https://www.iea.org/reports/world-energy-outlook-2021. (Accessed November, 3, 2021).
IEA, 2021d: World energy balances. https://www.iea.org/data-and-statistics/data-product/world-energy-balances (Accessed October 29, 2020).
IEA and WBCSD, 2018: Technology roadmap – low-carbon transition in the cement industry. Paris, France, 61 pp. https://webstore.iea.org/download/direct/1008?fileName=TechnologyRoadmapLowCarbonTransitioninthe CementIndustry.pdf . (Accessed December, 15, 2019).
IEA and UNEP, 2019 : Global Status Report for Buildings and Construction. Paris, France, 41 pp. https://www.iea.org/reports/global-status-report-for-buildings-and-construction-2019 (Accessed January, 6, 2020).
IEAGHG, 2021: Exporting CO2for Offshore Storage – The London Protocol’s Export Amendment and Associated Guidelines and Guidance. Paris, France. 13 pp. https://www.club-co2.fr/files/2021/04/IEAGHG-2021-TR02-Exporting-CO2-for-Offshore-Storage-The-London-Protocol-s-Export-Amendment-and-Associated-Guidelines-and-Guidance.pdf . (Accessed Novemberr, 13, 2021).
Igarashi, M., L. de Boer, and O. Michelsen, 2015: Investigating the anatomy of supplier selection in green public procurement. J. Clean. Prod. , 108, 442–450, doi:10.1016/J.JCLEPRO.2015.08.010.
IIASA, 2018: PFU Database. https://www.iiasa.ac.at/web/home/research/researchPrograms/TransitionstoNewTechnologies/PFUDB.en.html (Accessed December 21, 2019).
ILO, 2018: World Employment and Social Outlook: Trends 2018. International Labour Organization (ILO), Geneva, Switzerland, 81 pp. https://www.ilo.org/wcmsp5/groups/public/---dgreports/---dcomm/---publ/documents/publication/wcms_615594.pdf . (Accessed December 20, 2020).
Imbabi, M.S., C. Carrigan, and S. McKenna, 2012: Trends and developments in green cement and concrete technology. Int. J. Sustain. Built Environ. , 1(2) , 194–216, doi:10.1016/j.ijsbe.2013.05.001.
IN4climate.NRW, 2019: IN4climate.NRW. https://www.in4climate.nrw/en/index/ (Accessed December 20, 2020).
International Aluminium Institute, 2020: World Aluminium Institute Database. https://international-aluminium.org/statistics/primary-aluminium-smelting-energy-intensity/ (Accessed December 20, 2020).
International Aluminium Institute, 2021a: Aluminium Cycle 2019.https://alucycle.international-aluminium.org/public-access/ (Accessed August 28, 2021).
International Aluminium Institute, 2021b: Aluminium Sector Greenhouse Gas Pathways to 2050. London, UK, 20 pp.
International Aluminium Institute, 2021c: International aluminum institute statistics. https://alucycle.international-aluminium.org/public-access/ (Accessed December 21, 2020).
IPCC, 2005: IPCC Special Report on Carbon Dioxide Capture and Storage. Prepared by Working Group III of the Intergovernmental Panel on Climate Change. [Metz, B., O. Davidson, H.C. De Coninck, M. Loos, and L.A. Meyer, (eds.)]. Cambridge University Press, Cambridge, UK and New York, NY, USA, 442 pp.
IPCC, 2014: Climate Change 2014: Mitigation of Climate Change. Contribution of Working Group III to the Fifth Assessment Report of the Intergovernmental Panel on Climate Change[Edenhofer, O., R. Pichs-Madruga, Y. Sokona, E. Farahani, S. Kadner, K. Seyboth, A. Adler, I. Baum, S. Brunner, P. Eickemeier, B. Kriemann, J. Savolainen, S. Schlömer, C. von Stechow, T. Zwickel and J.C. Minx (eds.)]. Cambridge University Press, Cambridge, UK and New York, NY, USA.
IPCC, 2018a: Global Warming of 1.5°C. An IPCC Special Report on the impacts of global warming of 1.5°C above pre-industrial levels and related global greenhouse gas emission pathways, in the context of strengthening the global response to the threat of climate change, sustainable development, and efforts to eradicate poverty[Masson-Delmotte, V., P. Zhai, H.-O. Pörtner, D. Roberts, J. Skea, P.R. Shukla, A. Pirani, W. Moufouma-Okia, C. Péan, R. Pidcock, S. Connors, J.B.R. Matthews, Y. Chen, X. Zhou, M.I. Gomis, E. Lonnoy, T. Maycock, M. Tignor, and T. Waterfield eds.)]. Cambridge University Press, Cambridge, UK, and New York, NY, USA.
IPCC, 2018b: Summary for Policymakers. In: Global Warming of 1.5°C. An IPCC Special Report on the impacts of global warming of 1.5°C above pre-industrial levels and related global greenhouse gas emission pathways, in the context of strengthening the global response to the threat of climate change, sustainable development, and efforts to eradicate poverty[Masson-Delmotte, V., P. Zhai, H.-O. Pörtner, D. Roberts, J. Skea, P.R. Shukla, A. Pirani, W. Moufouma-Okia, C. Péan, R. Pidcock, S. Connors, J.B.R. Matthews, Y. Chen, X. Zhou, M.I. Gomis, E. Lonnoy, T. Maycock, M. Tignor, and T. Waterfield eds.)]. Cambridge University Press, Cambridge, UK, and New York, NY, USA.
IRENA, 2021: World Energy Transitions Outlook: 1.5°C Pathway. Abu Dhabi, United Arab Emirates, 53 pp.
Isikgor, F.H. and C.R. Becer, 2015: Lignocellulosic biomass: a sustainable platform for the production of bio-based chemicals and polymers. Polym. Chem. , 6(25) , 4497–4559, doi:10.1039/c5py00263j.
ISO, 2018: ISO 50001 ENERGY MANAGEMENT. https://www.iso.org/iso-50001-energy-management.html (Accessed November 30, 2020).
Vanderreydt, I., Rommens, T., Tenhunen, A., Fogh Mortensen, L., and Tange, I., 2021: Greenhouse gas emissions and natural capital implications of plastics (including biobased plastics) — Eionet Portal. Flanders, Belgium, 59 pp. https://www.eionet.europa.eu/etcs/etc-wmge/products/greenhouse-gas-emissions-and-natural-capital-implications-of-plastics-including-biobased-plastics (Accessed August 28, 2021).
Jackson, J. and L. Belkhir, 2018: Assigning firm-level GHGE reductions based on national goals – Mathematical model and empirical evidence. J. Clean. Prod. , 170, 76–84, doi:10.1016/j.jclepro.2017.09.075.
Jackson, M.M., J.I. Lewis, and X. Zhang, 2021: A green expansion: China’s role in the global deployment and transfer of solar photovoltaic technology. Energy Sustain. Dev. , 60, 90–101, doi:10.1016/j.esd.2020.12.006.
Jadun, P. et al., 2017: Electrification futures study: end-use electric technology cost and performance projections through 2050. Golden, CO: National Renewable Energy Laboratory. NREL/TP-6A20-70485. 94 pp. https://www.nrel.gov/docs/fy18osti/70485.pdf . (Accessed December 22, 2019).
Jakob, M., 2021a: Why carbon leakage matters and what can be done against it. One Earth, 4(5) , 609–614, doi:10.1016/j.oneear.2021.04.010.
Jakob, M., 2021b: Climate policy and international trade – A critical appraisal of the literature. Energy Policy, 156 (July), 112399, doi:10.1016/j.enpol.2021.112399.
Jakob, M., J.C. Steckel, and O. Edenhofer, 2014: Consumption-versus production-based emission policies. Annu. Rev. Resour. Econ. , 6(1) , 297–318, doi:10.1146/annurev-resource-100913-012342.
Jakob, M., H. Ward, and J.C. Steckel, 2021: Sharing responsibility for trade-related emissions based on economic benefits. Glob. Environ. Change, 66, 102207, doi:10.1016/j.gloenvcha.2020.102207.
Jenkins, J.D., M. Luke, and S. Thernstrom, 2018: Getting to Zero Carbon Emissions in the Electric Power Sector. Joule, 2(12), 2498–2510, doi:10.1016/j.joule.2018.11.013.
Jiang, M. et al., 2019: Provincial and sector-level material footprints in China. Proc. Natl. Acad. Sci. U. S. A. , 116(52) , 26484–26490, doi:10.1073/pnas.1903028116.
Jiao, W. and F. Boons, 2014: Toward a research agenda for policy intervention and facilitation to enhance industrial symbiosis based on a comprehensive literature review. J. Clean. Prod. , 67, 14–25, doi:10.1016/J.JCLEPRO.2013.12.050.
Jiménez-Arreola, M. et al., 2018: Thermal power fluctuations in waste heat to power systems: An overview on the challenges and current solutions. Appl. Therm. Eng. , 134, 576–584, doi:10.1016/j.applthermaleng.2018.02.033.
Jing, Y., Y. Guo, Q. Xia, X. Liu, and Y. Wang, 2019: Catalytic Production of Value-Added Chemicals and Liquid Fuels from Lignocellulosic Biomass. Chem, 5(10) , 2520–2546, doi:10.1016/j.chempr.2019.05.022.
Joltreau, E. and K. Sommerfeld, 2019: Why does emissions trading under the EU Emissions Trading System (ETS) not affect firms’ competitiveness? Empirical findings from the literature. Clim. Policy, 19(4) , 453–471, doi:10.1080/14693062.2018.1502145.
Jood, P., M. Ohta, A. Yamamoto, and M.G. Kanatzidis, 2018: Excessively Doped PbTe with Ge-Induced Nanostructures Enables High-Efficiency Thermoelectric Modules. Joule, 2(7) , 1339–1355, doi:10.1016/j.joule.2018.04.025.
Kajaste, R. and M. Hurme, 2016: Cement industry greenhouse gas emissions – management options and abatement cost. J. Clean. Prod. , 112, 4041–4052, doi:10.1016/j.jclepro.2015.07.055.
Kaliyavaradhan, S.K. and T.-C. Ling, 2017: Potential of CO2 sequestration through construction and demolition (C&D) waste – An overview. J. CO2Util. , 20 (June), 234–242, doi:10.1016/j.jcou.2017.05.014.
Kalmykova, Y., M. Sadagopan, and L. Rosado, 2018: Circular economy – From review of theories and practices to development of implementation tools. Resour. Conserv. Recycl. , 135, 190–201, doi:10.1016/J.RESCONREC.2017.10.034.
Kang, D. and D.H. Lee, 2016: Energy and environment efficiency of industry and its productivity effect. J. Clean. Prod. , 135, 184–193, doi:10.1016/j.jclepro.2016.06.042.
Karlsson, M., E. Alfredsson, and N. Westling, 2020: Climate policy co-benefits: a review. Clim. Policy, 20(3) , 292–316, doi:10.1080/14693062.2020.1724070.
Karltorp, K. and B.A. Sandén, 2012: Explaining regime destabilisation in the pulp and paper industry. Environ. Innov. Soc. Transitions, 2, 66–81, doi:10.1016/j.eist.2011.12.001.
Karner, K., M. Theissing, and T. Kienberger, 2016: Energy efficiency for industries through synergies with urban areas. J. Clean. Prod. , 119 (2016), 167–177, doi:10.1016/j.jclepro.2016.02.010.
Karner, K., R. McKenna, M. Klobasa, and T. Kienberger, 2018: Industrial excess heat recovery in industry-city networks: a technical, environmental and economic assessment of heat flexibility. J. Clean. Prod. , 193, 771–783, doi:10.1016/j.jclepro.2018.05.045.
Karo, E., 2018: Mission-oriented innovation policies and bureaucracies in East Asia. Ind. Corp. Change, 27(5) , 867–881, doi:10.1093/icc/dty031.
Karo, E. and R. Kattel, 2018: Innovation and the State: Towards an Evolutionary Theory of Policy Capacity. In: Wu, X., Howlett, M., Ramesh, M. (eds)Policy Capacity and Governance, Studies in the Political Economy of Public Policy. Palgrave Macmillan, Cham, Switzerland, pp. 123–150. https://doi.org/10.1007/978-3-319-54675-9_6.
Kätelhön, A., R. Meys, S. Deutz, S. Suh, and A. Bardow, 2019: Climate change mitigation potential of carbon capture and utilization in the chemical industry. Proc. Natl. Acad. Sci. , 166(23) , 11187–11194, doi:10.1073/pnas.1821029116.
Kattel, R. and M. Mazzucato, 2018: Mission-oriented innovation policy and dynamic capabilities in the public sector. Ind. Corp. Change, 27(5) , 787–801, doi:10.1093/icc/dty032.
Kaza, S., L. Yao, P. Bhada-Tata, and F. Van Woerden, 2018: What a Waste 2.0: A Global Snapshot of Solid Waste Management to 2050. World Bank, Washington D.C., USA, 272 pp. https://openknowledge.worldbank.org/handle/10986/30317. (Accessed March 27, 2021).
Kearns, D., H. Liu, and C. Consoli, 2021: TECHNOLOGY READINESS AND COSTS OF CCS. GCCSI. Washington D.C., USA. www.globalccsinstitute.com/resources/multimedia-library/technology-readiness-and-costs-of-ccs/. Acccessed 28 August 2021.
Keidanren (Japan Business Federation), 2018: Contributing to Avoided Emissions the the Global Value Chain – A new approach to climate change measures by private actors. Tokyo, Japan, 71 pp. http://www.keidanren.or.jp/en/policy/vape/gvc2018.pdf . (Accessed March 27, 2021).
Keith, D.W., G. Holmes, D. St. Angelo, and K. Heidel, 2018: A Process for Capturing CO2 from the Atmosphere. Joule, 2(8) , 1573–1594, doi:10.1016/j.joule.2018.05.006.
Kermeli, K. et al., 2021: Improving material projections in Integrated Assessment Models: The use of a stock-based versus a flow-based approach for the iron and steel industry. Energy,Vol. 239122434, doi:10.1016/j.energy.2021.122434.
Kholod, N. et al., 2020: Global methane emissions from coal mining to continue growing even with declining coal production. J. Clean. Prod. , 256, 120489, doi:10.1016/j.jclepro.2020.120489.
Kim, H.W. et al., 2018a: Co-benefit potential of industrial and urban symbiosis using waste heat from industrial park in Ulsan, Korea. Resour. Conserv. Recycl. , 135, 225–234, doi:10.1016/j.resconrec.2017.09.027.
Kim, H.W., S. Ohnishi, M. Fujii, T. Fujita, and H. S. Park, 2018b: Evaluation and Allocation of Greenhouse Gas Reductions in Industrial Symbiosis. J. Ind. Ecol. , 22(2) , 275–287, doi:10.1111/jiec.12539.
Kinderman, D., 2020: The challenges of upward regulatory harmonization: The case of sustainability reporting in the European Union. Regul. Gov. , 14(4) , 674–697, doi:10.1111/rego.12240.
Kirchherr, J. et al., 2018: Barriers to the Circular Economy: Evidence From the European Union (EU). Ecol. Econ. , 150, 264–272, doi:10.1016/j.ecolecon.2018.04.028.
Kirchner, M., J. Schmidt, and S. Wehrle, 2019: Exploiting Synergy of Carbon Pricing and Other Policy Instruments for Deep Decarbonization. Joule, 3(4) , 891–893, doi:10.1016/j.joule.2019.03.006.
Koasidis, K. et al., 2020: The UK and German low-carbon industry transitions from a sectoral innovation and system failures perspective. Energies, 13(18) , 4994, doi:10.3390/en13194994.
Koberg, E. and A. Longoni, 2019: A systematic review of sustainable supply chain management in global supply chains. J. Clean. Prod. , 207, 1084–1098, doi:10.1016/J.JCLEPRO.2018.10.033.
Korhonen, J., A. Honkasalo, and J. Seppälä, 2018: Circular Economy: The Concept and its Limitations. Ecol. Econ. , 143, 37–46, doi:10.1016/j.ecolecon.2017.06.041.
Krausmann, F. et al., 2017: Global socioeconomic material stocks rise 23-fold over the 20th century and require half of annual resource use. Proc. Natl. Acad. Sci. U. S. A. , 114(8) , 1880–1885, doi:10.1073/pnas.1613773114.
Krausmann, F., C. Lauk, W. Haas, and D. Wiedenhofer, 2018: From resource extraction to outflows of wastes and emissions: The socioeconomic metabolism of the global economy, 1900–2015. Glob. Environ. Change, 52, 131–140, doi:10.1016/j.gloenvcha.2018.07.003.
Krausmann, F., D. Wiedenhofer, and H. Haberl, 2020: Growing stocks of buildings, infrastructures and machinery as key challenge for compliance with climate targets. Glob. Environ. Change, 61, 102034, doi:10.1016/j.gloenvcha.2020.102034.
Kuo, L. and B.-G. Chang, 2021: Ambitious corporate climate action: Impacts of science-based target and internal carbon pricing on carbon management reputation – Evidence from Japan. Sustain. Prod. Consum. , 27, 1830–1840, doi:10.1016/j.spc.2021.04.025.
Kuramochi, T., 2016: Assessment of midterm CO2 emissions reduction potential in the iron and steel industry: a case of Japan. J. Clean. Prod. , 132(132) , 81–97, doi:10.1016/j.jclepro.2015.02.055.
Kushnir, D., T. Hansen, V. Vogl, and M. Åhman, 2020: Adopting hydrogen direct reduction for the Swedish steel industry: A technological innovation system (TIS) study. J. Clean. Prod. , 242, 118185, doi:10.1016/j.jclepro.2019.118185.
Kuusi, T. et al., 2020: Carbon Border Adjustment Mechanisms and Their Economic Impact on Finland and the EU. Helsinki, Finland, 152 pp. http://urn.fi/URN:ISBN:978-952-287-922-6. (Accessed October 21, 2019).
Labella, Á., K. Koasidis, A. Nikas, A. Arsenopoulos, and H. Doukas, 2020: APOLLO: A Fuzzy Multi-criteria Group Decision-Making Tool in Support of Climate Policy. Int. J. Comput. Intell. Syst. , 13(1) , 1539, doi:10.2991/ijcis.d.200924.002.
Lamb, W.F. et al., 2021: A review of trends and drivers of greenhouse gas emissions by sector from 1990 to 2018. Environ. Res. Lett. , 16(7) , 073005, doi:10.1088/1748-9326/abee4e.
Lambert, J.G., C.A.S. Hall, S. Balogh, A. Gupta, and M. Arnold, 2014: Energy, EROI and quality of life. Energy Policy, 64, 153–167, doi:10.1016/j.enpol.2013.07.001.
LCS, 2018: Toward Future Low-Carbon Society using Scrap Iron Recycling (Vol. 2). Center for Low Carbin Society Strategy, Tokyo, Japan, 17 pp. https://www.jst.go.jp/lcs/pdf/fy2018-pp-18.pdf . (Accessed December, 15, 2019)
Lechtenböhmer, S. and M. Fischedick, 2020: An Integrated Climate-Industrial Policy as the Core of the European Green Deal in Brief . Wuppertal Institute, Wuppertal, Germany, 8 pp. https://epub.wupperinst.org/frontdoor/deliver/index/docId/7483/file/7483_Climate-Industrial-Policy.pdf . (Accessed March 27, 2021).
Lechtenböhmer, S., C. Schneider, M.Y. Roche, and S. Höller, 2015: Re-industrialisation and low-carbon economy-can they go together? Results from stakeholder-based scenarios for energy-intensive industries in the German state of North Rhine Westphalia. Energies, 8(10) , 11404–11429, doi:10.3390/en81011404.
Lechtenböhmer, S., L.J. Nilsson, M. Åhman, and C. Schneider, 2016: Decarbonising the energy intensive basic materials industry through electrification – Implications for future EU electricity demand. Energy, 115, 1623–1631, doi:10.1016/j.energy.2016.07.110.
Lecocq, F. and Z. Shalizi, 2014: The economics of targeted mitigation in infrastructure. Clim. Policy, 14(2) , 187–208, doi:10.1080/14693062.2014.861657.
Lee, S.Y. et al., 2019: A comprehensive metabolic map for production of bio-based chemicals. Nat. Catal. , 2(1) , 18–33, doi:10.1038/s41929-018-0212-4.
Leeson, D., P. Fennell, N. Shah, C. Petit, and N. Mac Dowell, 2017: A Techno-economic analysis and systematic review of carbon capture and storage (CCS) applied to the iron and steel, cement, oil refining and pulp and paper industries. Int. J. Greenh. Gas Control, 61 (June), 71–84, doi:10.1016/j.ijggc.2017.03.020.
Legorburu, G. and A.D. Smith, 2018: Energy modeling framework for optimizing heat recovery in a seasonal food processing facility. Appl. Energy, 229, 151–162, doi:10.1016/j.apenergy.2018.07.097.
Lehne, J. and F. Preston, 2018: Making Concrete Change Innovation in Low-carbon Cement and Concrete. Chatham House, London, UK. 122 pp.
Levi, P.G. and J.M. Cullen, 2018: Mapping Global Flows of Chemicals: From Fossil Fuel Feedstocks to Chemical Products. Environ. Sci. Technol. , 52(4) , 1725–1734, doi:10.1021/acs.est.7b04573.
Li, Q., R. Long and H. Chen, 2017: Empirical study of the willingness of consumers to purchase low-carbon products by considering carbon labels: A case study. J. Clean. Prod. , 161, 1237–1250, doi:10.1016/J.JCLEPRO.2017.04.154.
Li, S. et al., 2019: Recent advances in hydrogen production by thermo-catalytic conversion of biomass. Int. J. Hydrogen Energy, 44(28) , 14266–14278, doi:10.1016/j.ijhydene.2019.03.018.
Lim, T., B.R. Ellis, and S.J. Skerlos, 2019: Mitigating CO2 emissions of concrete manufacturing through CO2-enabled binder reduction. Environ. Res. Lett. , 14(11) , 114014, doi:10.1088/1748-9326/ab466e.
Liu, C., W. Chen, and J. Mu, 2019a: Retailer’s multi-tier green procurement contract in the presence of suppliers’ reference point effect. Comput. Ind. Eng. , 131, 242–258, doi:10.1016/j.cie.2019.03.013.
Liu, G., C.E. Bangs, and D. B. Müller, 2013: Stock dynamics and emission pathways of the global aluminium cycle. Nat. Clim. Change, 3(4) , 338–342, doi:10.1038/nclimate1698.
Liu, G. and D. B. Müller, 2013: Centennial evolution of aluminum in-use stocks on our aluminized planet. Environ. Sci. Technol. , 47(9) , 4882–4888, doi:10.1021/es305108p.
Liu, J., J. Xue, L. Yang, and B. Shi, 2019b: Enhancing green public procurement practices in local governments: Chinese evidence based on a new research framework. J. Clean. Prod. , 211, 842–854, doi:10.1016/J.JCLEPRO.2018.11.151.
Liu, M. et al., 2020: End-of-life passenger vehicles recycling decision system in China based on dynamic material flow analysis and life cycle assessment. Waste Manag. , 117, 81–92, doi:10.1016/j.wasman.2020.08.002.
Liu, T., Q. Wang, and B. Su, 2016: A review of carbon labeling: Standards, implementation, and impact. Renew. Sustain. Energy Rev. , 53, 68–79, doi:10.1016/J.RSER.2015.08.050.
Liu, Z. et al., 2015: Reduced carbon emission estimates from fossil fuel combustion and cement production in China. Nature, 524(7565) , 335–338, doi:10.1038/nature14677.
Liu, Z. et al., 2018: Co-benefits accounting for the implementation of eco-industrial development strategies in the scale of industrial park based on emergy analysis. Renew. Sustain. Energy Rev. , 81, 1522–1529, doi:10.1016/j.rser.2017.05.226.
Llorente-González, L.J. and X. Vence, 2019: Decoupling or “decaffing”? The underlying conceptualization of circular economy in the European union monitoring framework. Sustainability, 11(18) , 4898, doi:10.3390/su11184898.
Llorente-González, L.J., and X. Vence, 2020: How labour-intensive is the circular economy? A policy-orientated structural analysis of the repair, reuse and recycling activities in the European Union. Resour. Conserv. Recycl. , 162, 105033, doi:10.1016/j.resconrec.2020.105033.
LME, 2020: London Metal Exchange - Sustainability Discussion Paper. London, UK, 20 pp.
Long, T.B. and W. Young, 2016: An exploration of intervention options to enhance the management of supply chain greenhouse gas emissions in the UK. J. Clean. Prod. , 112, 1834–1848, doi:10.1016/J.JCLEPRO.2015.02.074.
Lopez, G. et al., 2018: Recent advances in the gasification of waste plastics. A critical overview. Renew. Sustain. Energy Rev. , 82, 576–596, doi:10.1016/j.rser.2017.09.032.
Lovins, A.B., 2018: How big is the energy efficiency resource?Environ. Res. Lett. , 13(9) , 090401, doi:10.1088/1748-9326/aad965.
Lundberg, S., P.O. Marklund, E. Strömbäck, and D. Sundström, 2015: Using public procurement to implement environmental policy: an empirical analysis. Environ. Econ. Policy Stud. , 17(4) , 487–520, doi:10.1007/s10018-015-0102-9.
Lv, S. et al., 2018: Study of different heat exchange technologies influence on the performance of thermoelectric generators. Energy Convers. Manag. , 156, 167–177, doi:10.1016/j.enconman.2017.11.011.
Mac Dowell, N., P.S. Fennell, N. Shah, and G.C. Maitland, 2017: The role of CO2 capture and utilization in mitigating climate change. Nat. Clim. Change, 7(4) , 243–249, doi:10.1038/nclimate3231.
MacKay, K. et al., 2021: Methane emissions from upstream oil and gas production in Canada are underestimated. Sci. Rep. , 11(1) , 8041, doi:10.1038/s41598-021-87610-3.
Maddison Project, 2018: Maddison Project Database. http://www.ggdc.net/maddison;https://datacatalog.worldbank.org/dataset/global-economic-monitor (Accessed December 20, 2019).
Madeddu, S. et al., 2020: The CO2 reduction potential for the European industry via direct electrification of heat supply (power-to-heat). Environ. Res. Lett. , 15 (12), 124004, doi:10.1088/1748-9326/abbd02.
Mah, A., 2021: Future-Proofing Capitalism: The Paradox of the Circular Economy for Plastics. Glob. Environ. Polit. , 21(2) , 121–142, doi:10.1162/glep_a_00594.
Mahmood, T. and E. Ahmad, 2018: The relationship of energy intensity with economic growth: Evidence for European economies. Energy Strateg. Rev. , 20, 90–98, doi:10.1016/j.esr.2018.02.002.
Mai, T.T. et al., 2018: Electrification Futures Study: Scenarios of Electric Technology Adoption and Power Consumption for the United States. Golden, CO, USA, 129 pp.
Marin County, 2021: Title 19 – MARIN COUNTY BUILDING CODE. A Codification of the General Ordinances of the County of Marin, California, Marin County, USA.
Markkanen, S. et al., 2021: On the Borderline: The EU CBAM and its place in the world of trade. Cambridge, UK, 73 pp.
Martí, J.M.C., J.S. Tancrez, and R.W. Seifert, 2015: Carbon footprint and responsiveness trade-offs in supply chain network design. Int. J. Prod. Econ. , 166, 129–142. doi:10.1016/j.ijpe.2015.04.016.
Martin, R., M. Muûls, and U.J. Wagner, 2016: The impact of the European Union emissions trading scheme on regulated firms: What is the evidence after ten years?Rev. Environ. Econ. Policy, 10(1) , 129–148, doi:10.1093/reep/rev016.
Mason, A., W. Martindale, A. Heath, and S. Chatterjee, 2016: French Energy Transition Law – Global Investor Briefing. PRI, London, UK. 15 pp. https://www.iigcc.org/resource/french-energy-transition-law-global-investor-briefing/. (Accessed October 2, 2021).
Material Economics, 2019: Industrial Transformation 2050: Pathways to net-zero emisisons from EU Heavy Industry. Cambridge, UK. 207 pp. https://materialeconomics.com/publications/industrial-transformation-2050. (Accessed December 14, 2019).
Mathews, J.A., H. Tan, and M. Hu, 2018: Moving to a Circular Economy in China: Transforming Industrial Parks into Eco-industrial Parks. Calif. Manage. Rev. , 60(3) , 157–181, doi:10.1177/0008125617752692.
Mathy, S., P. Criqui, K. Knoop, M. Fischedick, and S. Samadi, 2016: Uncertainty management and the dynamic adjustment of deep decarbonization pathways. Clim. Policy, 16(sup1) , S47–S62, doi:10.1080/14693062.2016.1179618.
Mayer, A. et al., 2019: Measuring Progress towards a Circular Economy: A Monitoring Framework for Economy‐wide Material Loop Closing in the EU28. J. Ind. Ecol. , 23(1) , 62–76, doi:10.1111/jiec.12809.
Mazzucato, M., 2016: From market fixing to market-creating: a new framework for innovation policy. Ind. Innov. , 23(2) , 140–156, doi:10.1080/13662716.2016.1146124.
Mazzucato, M., R. Kattel, and J. Ryan-Collins, 2020: Challenge-Driven Innovation Policy: Towards a New Policy Toolkit. J. Ind. Compet. Trade, 20(2) , 421–437, doi:10.1007/s10842-019-00329-w.
McBrien, M., A.C. Serrenho, and J.M. Allwood, 2016: Potential for energy savings by heat recovery in an integrated steel supply chain. Appl. Therm. Eng. , 103, 592–606, doi:10.1016/J.APPLTHERMALENG.2016.04.099.
McDowall, W. et al., 2017: Circular Economy Policies in China and Europe. J. Ind. Ecol. , 21(3) , 651–661, doi:10.1111/jiec.12597.
McManus, M. C. et al., 2015: Challenge clusters facing LCA in environmental decision-making – what we can learn from biofuels. Int. J. Life Cycle Assess. , 20(10) , 1399–1414, doi:10.1007/s11367-015-0930-7.
McMillan, C. et al., 2016: Generation and Use of Thermal Energy in the U.S. Industrial Sector and Opportunities to Reduce its Carbon Emissions. Denver, USA, 172 pp. http://www.nrel.gov/docs/fy17osti/66763.pdf . (Accessed March 27, 2021).
Mehling, M.A. and R.A. Ritz, 2020: Going beyond default intensities in an EU carbon border adjustment mechanism. Climate Strategies, London, UK. 23 pp.
Mehling, M.A., H. Van Asselt, K. Das, S. Droege, and C. Verkuijl, 2019: Designing Border Carbon Adjustments for Enhanced Climate Action. Am. J. Int. Law, 113(3) , 433–481, doi:10.1017/ajil.2019.22.
Melton, N., J. Axsen, and D. Sperling, 2016: Moving beyond alternative fuel hype to decarbonize transportation. Nat. Energy, 1(3) , 1–10, doi:10.1038/nenergy.2016.13.
Mendez-Alva, F., H. Cervo, G. Krese, and G. Van Eetvelde, 2021: Industrial symbiosis profiles in energy-intensive industries: Sectoral insights from open databases. J. Clean. Prod. , 314 (June), 128031, doi:10.1016/j.jclepro.2021.128031.
Meng, B., G.P. Peters, Z. Wang, and M. Li, 2018: Tracing CO2 emissions in global value chains. Energy Econ. , 73, 24–42, doi:10.1016/j.eneco.2018.05.013.
Metcalf, G.E., 2019: On the Economics of a Carbon Tax for the United Stat es. 405–484 pp.
Meys, R. et al., 2020: Towards a circular economy for plastic packaging wastes – the environmental potential of chemical recycling. Resour. Conserv. Recycl. , 162, 105010, doi:10.1016/j.resconrec.2020.105010.
Meys, R. et al., 2021: Achieving net-zero greenhouse gas emission plastics by a circular carbon economy. Science, 374(6563) , 71–76, doi:10.1126/science.abg9853.
Michaelowa, A., I. Shishlov, and D. Brescia, 2019: Evolution of international carbon markets: lessons for the Paris Agreement. Wiley Interdiscip. Rev. Clim. Change, 10(6) , 1–24, doi:10.1002/wcc.613.
Michelsen, O. and L. de Boer, 2009: Green procurement in Norway; a survey of practices at the municipal and county level. J. Environ. Manage. , 91(1) , 160–167, doi:10.1016/J.JENVMAN.2009.08.001.
Minelgaitė, A. and G. Liobikienė, 2019: Waste problem in European Union and its influence on waste management behaviours. Sci. Total Environ. , 667, 86–93, doi:10.1016/j.scitotenv.2019.02.313.
Ministère de la Transition écologique et solidaire, 2018: Projet de Stratégie Nationale Bas-Carbone – La transition écologique et solidaire vers la neutralité carbone. Copenhagen, Denmark, 151 pp.
Minx, J.C. et al., 2021: A comprehensive and synthetic dataset for global, regional, and national greenhouse gas emissions by sector 1970–2018 with an extension to 2019. Earth Syst. Sci. Data,13, 5213–5252,.https://doi.org/10.5194/essd-13-5213-2021.
Moore, J., 2017: Thermal Hydrogen: An emissions free hydrocarbon economy. Int. J. Hydrogen Energy, 42(17) , 12047–12063, doi:10.1016/j.ijhydene.2017.03.182.
Moran, D., A. Hasanbeigi, and C. Springer, 2018: The Carbon Loophole in Climate Policy. 65 pp. KGM & Associates Pty Ltd. and Global Efficiency Intelligence, LLC. Sydney, Australia and FL, USA.
Mörsdorf, G., 2021: A simple fix for carbon leakage? Assessing the environmental effectiveness of the EU carbon border adjustment. Energy Policy, 161112596, doi:10.1016/j.enpol.2021.112596.
Moya, J.A., and N. Pardo, 2013: The potential for improvements in energy efficiency and CO2 emissions in the EU27 iron and steel industry under different payback periods. J. Clean. Prod. , 52, 71–83, doi:10.1016/j.jclepro.2013.02.028.
Müller, D.B., T. Wang, and B. Duval, 2011: Patterns of iron use in societal evolution. Environ. Sci. Technol. , 45(1) , 182–188, doi:10.1021/es102273t.
Müller, L.J. et al., 2020: The carbon footprint of the carbon feedstock CO2. Energy Environ. Sci. , 13(9) , 2979–2992, doi:10.1039/d0ee01530j.
Munasinghe, M., P. Jayasinghe, V. Ralapanawe, and A. Gajanayake, 2016: Supply/value chain analysis of carbon and energy footprint of garment manufacturing in Sri Lanka. Sustain. Prod. Consum. , 5, 51–64, doi:10.1016/J.SPC.2015.12.001.
Munnings, C., W. Acworth, O. Sartor, Y.G. Kim, and K. Neuhoff, 2019: Pricing carbon consumption: synthesizing an emerging trend. Clim. Policy, 19(1) , 92–107, doi:10.1080/14693062.2018.1457508.
Murray, A., K. Skene, and K. Haynes, 2017: The Circular Economy: An Interdisciplinary Exploration of the Concept and Application in a Global Context. J. Bus. Ethics, 140(3) , 369–380, doi:10.1007/s10551-015-2693-2.
Muslemani, H., X. Liang, K. Kaesehage, F. Ascui, and J. Wilson, 2021: Opportunities and challenges for decarbonizing steel production by creating markets for ‘green steel’ products. J. Clean. Prod. , 315, 128127, doi:10.1016/J.JCLEPRO.2021.128127.
Nadel, S. and L. Ungar, 2019: Halfway There: Energy Efficiency Can Cut Energy Use and Greenhouse Gas Emissions in Half by 2050. ACEEE, Washington D.C., USA, 63 pp. https://www.aceee.org/sites/default/files/publications/researchreports/u1907.pdf . (Accessed August 28, 2021).
Naegele, H. and A. Zaklan, 2019: Does the EU ETS cause carbon leakage in European manufacturing?J. Environ. Econ. Manage. , 93, 125–147, doi:10.1016/j.jeem.2018.11.004.
Naims, H., 2016: Economics of carbon dioxide capture and utilization—a supply and demand perspective. Environ. Sci. Pollut. Res. , 23(22) , 22226–22241, doi:10.1007/s11356-016-6810-2.
Napp, T.A., A. Gambhir, T.P. Hills, N. Florin, and P. Fennell, 2014: A review of the technologies, economics and policy instruments for decarbonising energy-intensive manufacturing industries. Renew. Sustain. Energy Rev. , 30, 616–640, doi:10.1016/j.rser.2013.10.036.
Napp, T. A. et al., 2019: The role of advanced demand-sector technologies and energy demand reduction in achieving ambitious carbon budgets. Appl. Energy, 238 (April 2018), 351–367, doi:10.1016/j.apenergy.2019.01.033.
Narassimhan, E., K.S. Gallagher, S. Koester, and J.R. Alejo, 2018: Carbon pricing in practice: a review of existing emissions trading systems. Clim. Policy, 18(8) , 967–991, doi:10.1080/14693062.2018.1467827.
NEDO, 2019: Survey of waste heat in the industrial field. Kanagawa, Japan. 239 pp. http://www.thermat.jp/HainetsuChousa/HainetsuReport.pdf . (Accessed December 15, 2019).
Nemet, G.F., 2019: How solar energy became cheap: A model for low-carbon innovation. Routledge, Abingdon, Oxon, UK and New York, NY, USA, 238 pp.
Nemet, G.F., V. Zipperer, and M. Kraus, 2018: The valley of death, the technology pork barrel, and public support for large demonstration projects. Energy Policy, 119, 154–167, doi:10.1016/j.enpol.2018.04.008.
Neuhoff, K. et al., 2015: Inclusion of Consumption of Carbon Intensive Commodities in Carbon Pricing Mechanisms. 6 pp. Climate Strategies., London, UK. https://www.diw.de/documents/dokumentenarchiv/17/diw_01.c.523297.de/policy-brief-ioc.pdf (Accessed December, 23, 2019).
Neuhoff, K. et al., 2018: Filling gaps in the policy package to decarbonise production and use of materials. Berlin, Germany, 41 pp. https://climatestrategies.org/wp-content/uploads/2018/06/CS-DIW_report-designed-2.pdf . (Accessed December 16, 2019).
Neuhoff, K. et al., 2019: Building blocks for a climate-neutral European industrial sector. Climate Strategies. London, UK. 33 pp. https://climatestrategies.org/wp-content/uploads/2019/10/Building-Blocks-for-a-Climate-Neutral-European-Industrial-Sector.pdf . (Accessed October, 26, 2021).
NGFS, 2019a: A call for action: Climate change as a source of financial risk. NGFS. Paris, France. 39 pp. https://www.ngfs.net/sites/default/files/medias/documents/ngfs_first_comprehensive_report_-_17042019_0.pdf . (Accessed December, 15, 2019).
NGFS, 2019b: A sustainable and responsible investment guide for central banks’ portfolio management . NGFS. Paris, France. 39 pp. https://www.ngfs.net/sites/default/files/medias/documents/ngfs-a-sustainable-and-responsible-investment-guide.pdf . (Accessed December, 15, 2019).
Nikolaou, I.E. and K.P. Tsagarakis, 2021: An introduction to circular economy and sustainability: Some existing lessons and future directions. Sustain. Prod. Consum. , 28, 600–609, doi:10.1016/j.spc.2021.06.017.
Nilsson, L.J. et al., 2021: An industrial policy framework for transforming energy and emissions intensive industries towards zero emissions. Clim. Policy, 21(8) , 1053–1065, doi:10.1080/14693062.2021.1957665.
Nimbalkar, S. et al., 2020: Enhancing operational performance and productivity benefits in breweries through smart manufacturing technologies. J. Adv. Manuf. Process. , 2(4) , doi:10.1002/amp2.10064.
Nocito, F. and A. Dibenedetto, 2020: Atmospheric CO2 mitigation technologies: carbon capture utilization and storage. Curr. Opin. Green Sustain. Chem. , 21, 34–43, doi:10.1016/j.cogsc.2019.10.002.
Nordhaus, W., 2015: Climate clubs: Overcoming free-riding in international climate policy. Am. Econ. Rev. , 105(4) , 1339–1370, doi:10.1257/aer.15000001.
Oberle, B. et al., 2019: Global Resources Outlook 2019: Natural Resources for the Future We Want . Paris, France, 168 pp. https://www.resourcepanel.org/reports/global-resources-outlook. (Accessed March 27, 2021).
Oberthür, S.,G. Khandekar and T. Wyns, 2021: Global governance for the decarbonization of energy-intensive industries: Great potential underexploited. Earth Syst. Gov. , 8, 100072, doi:10.1016/j.esg.2020.100072.
Ochu, E.R., and S.J. Friedmann, 2021: CCUS in a net-zero U.S. power sector: Policy design, rates, and project finance. Electr. J. , 34(7) , 107000, doi:10.1016/j.tej.2021.107000.
OECD.Stat, 2019: OECD.Stat 2019. https://stats.oecd.org/Index.aspx?DataSet Code=IO_GHG_2019 (Accessed December 20, 2020).
OECD, 2011: Towards Green Growth. Paris, France, 24 pp. https://www.oecd.org/greengrowth/48012345.pdf . (Accessed December 15, 2019).
OECD, 2015: System Innovation: Synthesis Report . Paris, France, 101 pp. http://www.pte.pl/pliki/2/1/OECD System.pdf . (Accessed March 27, 2021).
OECD, 2016: Extended Producer Responsibility. OECD. Paris, France. 6 pp.
OECD, 2019a: Global Material Resources Outlook to 2060. OECD, Paris, France.210 pp.
OECD, 2019b: Moving to sustainable industrial production. In: Accelerating Climate Action: Refocusing Policies through a Well-being Lens, pp. 65–88.
OECD, 2021: Government at a Glance 2021. OECD, Paris, France, 281 pp.
Ohnishi, S., H. Dong, Y. Geng, M. Fujii, and T. Fujita, 2017: A comprehensive evaluation on industrial & urban symbiosis by combining MFA, carbon footprint and emergy methods – Case of Kawasaki, Japan. Ecol. Indic. , 73, 513–524, doi:10.1016/j.ecolind.2016.10.016.
Ohta, H., S.W. Kim, S. Kaneki, A. Yamamoto, and T. Hashizume, 2018: High Thermoelectric Power Factor of High-Mobility 2D Electron Gas. Adv. Sci. , 5(1) , 1700696, doi:10.1002/advs.201700696.
Okereke, C. and D. McDaniels, 2012: To what extent are EU steel companies susceptible to competitive loss due to climate policy?Energy Policy, 46, 203–215, doi:10.1016/j.enpol.2012.03.052.
Olatunji, O.O. et al., 2019: Competitive advantage of carbon efficient supply chain in manufacturing industry. J. Clean. Prod. , 238, 117937, doi:10.1016/j.jclepro.2019.117937.
Olfe-Kräutlein, B., 2020: Advancing CCU Technologies Pursuant to the SDGs: A Challenge for Policy Making. Front. Energy Res. , 8(198) , doi:10.3389/fenrg.2020.00198.
Olivetti, E.A., and J.M. Cullen, 2018: Toward a sustainable materials system. Science, 360(6396) , 1396–1398, doi:10.1126/science.aat6821.
Olivier, J.G J., and J.A.H.W., Peters, 2018: Trends in global CO2and total greenhouse gas emissions – 2018 report . The Hague, the Netherlands, 53 pp. https://www.pbl.nl/sites/default/files/downloads/pbl-2018-trends-in-global-co2-and-total-greenhouse-gas-emissons-2018-report_3125_0.pdf .
Onarheim, K., S. Santos, P. Kangas, and V. Hankalin, 2017: Performance and costs of CCS in the pulp and paper industry part 1: Performance of amine-based post-combustion CO2 capture. Int. J. Greenh. Gas Control, 59, 58–73, doi:10.1016/j.ijggc.2017.02.008.
Orr, J. et al., 2019: Minimising energy in construction: Practitioners’ views on material efficiency. Resour. Conserv. Recycl. , 140, 125–136, doi:10.1016/j.resconrec.2018.09.015.
Overland, I., 2019: The geopolitics of renewable energy: Debunking four emerging myths. Energy Res. Soc. Sci. , 49, 36–40, doi:10.1016/j.erss.2018.10.018.
Padella, M., A. O’Connell, and M. Prussi, 2019: What is still Limiting the Deployment of Cellulosic Ethanol? Analysis of the Current Status of the Sector. Appl. Sci. , 9(21) , 4523, doi:10.3390/app9214523.
Palm, E. and A. Nikoleris, 2021: Conflicting expectations on carbon dioxide utilisation. Technol. Anal. Strateg. Manag. , 33(2) , 217–228, doi:10.1080/09537325.2020.1810225.
Palm, E., L.J. Nilsson, and M. Åhman, 2016: Electricity-based plastics and their potential demand for electricity and carbon dioxide. J. Clean. Prod. , 129, 548–555, doi:10.1016/j.jclepro.2016.03.158.
Pan, S.Y. et al., 2020: CO2 mineralization and utilization by alkaline solid wastes for potential carbon reduction. Nat. Sustain. , 3(5) , 399–405, doi:10.1038/s41893-020-0486-9.
Pandey, D., M. Agrawal, and J.S. Pandey, 2011: Carbon footprint: current methods of estimation. Environ. Monit. Assess. , 178(1–4) , 135–160, doi:10.1007/s10661-010-1678-y.
Papapetrou, M., G. Kosmadakis, A. Cipollina, U. La Commare, and G. Micale, 2018: Industrial waste heat: Estimation of the technically available resource in the EU per industrial sector, temperature level and country. Appl. Therm. Eng. , 138, 207–216, doi:10.1016/j.applthermaleng.2018.04.043.
Pardo, N. and J.A. Moya, 2013: Prospective scenarios on energy efficiency and CO2 emissions in the European Iron and Steel industry. Energy, 54, 113–128, doi:10.1016/j.energy.2013.03.015.
Park, J., J.M. Park, and H.S. Park, 2019: Scaling-Up of Industrial Symbiosis in the Korean National Eco-Industrial Park Program: Examining Its Evolution over the 10 Years between 2005–2014. J. Ind. Ecol. , 23 (1), 197–207, doi:10.1111/jiec.12749.
Pasquier, L.-C., N. Kemache, J. Mocellin, J.-F. Blais, and G. Mercier, 2018: Waste Concrete Valorization; Aggregates and Mineral Carbonation Feedstock Production. Geosciences, 8(9) , 342, doi:10.3390/geosciences8090342.
Pauliuk, S., R.L. Milford, D.B. Müller, and J.M. Allwood, 2013a: The steel scrap age. Environ. Sci. Technol. , 47(7) , 3448–3454, doi:10.1021/es303149z.
Pauliuk, S., T. Wang, and D.B. Müller, 2013b: Steel all over the world: Estimating in-use stocks of iron for 200 countries. Resour. Conserv. Recycl. , 71, 22–30, doi:10.1016/j.resconrec.2012.11.008.
Pauliuk, S., G. Majeau-Bettez, and D.B. Müller, 2015: A general system structure and accounting framework for socioeconomic metabolism. J. Ind. Ecol. , 19(5) , 728–741, doi:10.1111/jiec.12306.
Pauliuk, S., N. Heeren, M.M. Hasan, and D.B. Müller, 2019: A general data model for socioeconomic metabolism and its implementation in an industrial ecology data commons prototype. J. Ind. Ecol. , 23(5) , 1016–1027, doi:10.1111/jiec.12890.
Pauliuk, S. et al., 2021: Global scenarios of resource and emission savings from material efficiency in residential buildings and cars. Nat. Commun. , 12(1) , 5097, doi:10.1038/s41467-021-25300-4.
Philibert, C., 2017a: Renewable Energy for Industry: From Green Energy to Green Materials and Fuels. IEA, Paris, France, 67 pp. https://www.iea.org/publications/insights/insightpublications/Renewable_Energy_for_Industry.pdf .
Philibert, C., 2017b: Producing ammonia and fertilizers: new opportunities from renewables. Renewable Energy Division, IEA. Paris, France, 6 pp. http://www.iea.org/media/news/2017/FertilizermanufacturingRenewables_1605.pdf .
Pieroni, M.P.P., T.C. McAloone, and D.C.A. Pigosso, 2019: Business model innovation for circular economy and sustainability: A review of approaches. J. Clean. Prod. , 215, 198–216, doi:10.1016/j.jclepro.2019.01.036.
Plaza, M.G., S. Martínez, and F. Rubiera, 2020: CO2 capture, use, and storage in the cement industry: State of the art and expectations. Energies, 13(21) , 5692, doi:10.3390/en13215692.
Pollitt, H., K. Neuhoff, and X. Lin, 2020: The impact of implementing a consumption charge on carbon-intensive materials in Europe. Clim. Policy, 20(sup1) , S74–S89, doi:10.1080/14693062.2019.1605969.
Polverini, D., 2021: Regulating the circular economy within the ecodesign directive: Progress so far, methodological challenges and outlook. Sustain. Prod. Consum. , 27, 1113–1123, doi:10.1016/j.spc.2021.02.023.
Pülzl, H., D. Kleinschmit, and B. Arts, 2014: Bioeconomy – an emerging meta-discourse affecting forest discourses?Scand. J. For. Res. , 29(4) , 386–393, doi:10.1080/02827581.2014.920044.
Pusnik, M., F. Al-Mansour, B. Sucic, and A.F. Gubina, 2016: Gap analysis of industrial energy management systems in Slovenia. Energy, 108, 41–49, doi:10.1016/j.energy.2015.10.141.
Pyrka, M., J. Boratyński, I. Tobiasz, R. Jeszke, and M. Sekuła, 2020: The Effects of the Implementation of the Border Tax Adjustment in the Context of More Stringent EU Climate Policy until 2030. Institute of Environmental Protection - National Research InstituteWarsaw, Poland, 48 pp.
Qian, W., J. Hörisch, and S. Schaltegger, 2018: Environmental management accounting and its effects on carbon management and disclosure quality. J. Clean. Prod. , 174, 1608–1619, doi:10.1016/j.jclepro.2017.11.092.
Qu, S. et al., 2019: Implications of China’s foreign waste ban on the global circular economy. Resour. Conserv. Recycl. , 144, 252–255, doi:10.1016/j.resconrec.2019.01.004.
Ragaert, K., L. Delva, and K. Van Geem, 2017: Mechanical and chemical recycling of solid plastic waste. Waste Manag. , 69, 24–58, doi:10.1016/j.wasman.2017.07.044.
Rahimi, A. and J. M. García, 2017: Chemical recycling of waste plastics for new materials production. Nat. Rev. Chem. , 1(6) , 0046, doi:10.1038/s41570-017-0046.
Rajbhandari, A. and F. Zhang, 2018: Does energy efficiency promote economic growth? Evidence from a multicountry and multisectoral panel dataset. Energy Econ. , 69, 128–139, doi:10.1016/j.eneco.2017.11.007.
Ranasinghe, R., A.C. Ruane, R. Vautard, N. Arnell, E. Coppola, F.A. Cruz, S. Dessai, A.S. Islam, M. Rahimi, D. Ruiz Carrascal, J. Sillmann, M.B. Sylla, C. Tebaldi, W. Wang, R. Zaaboul, 2021, 2021: Climate Change Information for Regional Impact and for Risk Assessment. In: Climate Change 2021: The Physical Science Basis. Contribution of Working Group I to the Sixth Assessment Report of the Intergovernmental Panel on Climate Change[Masson-Delmotte, V., P. Zhai, A. Pirani, S. L. Connors, C. Péan, S. Berger, N. Caud, Y. Chen, L. Goldfarb, M. I. Gomis, M. Huang, K. Leitzell, E. Lonnoy, J. B. R. Matthews, T. K. Maycock, T. Waterfield, O. Yelekçi, R. Yu and B. Zhou (eds.)]. Cambridge University Press, Cambridge, UK and New York, NY, USA.
Rangelov, M., H. Dylla, A. Mukherjee, and N. Sivaneswaran, 2021: Use of environmental product declarations (EPDs) of pavement materials in the United States of America (USA) to ensure environmental impact reductions. J. Clean. Prod. , 283, 124619, doi:10.1016/j.jclepro.2020.124619.
Ranta, V., L. Aarikka-Stenroos, P. Ritala, and S. J. Mäkinen, 2018: Exploring institutional drivers and barriers of the circular economy: A cross-regional comparison of China, the US, and Europe. Resour. Conserv. Recycl. , 135, 70–82, doi:10.1016/j.resconrec.2017.08.017.
Raven, R., F. Kern, B. Verhees, and A. Smith, 2016: Niche construction and empowerment through socio-political work. A meta-analysis of six low-carbon technology cases. Environ. Innov. Soc. Transitions, 18, 164–180, doi:10.1016/j.eist.2015.02.002.
Raymond, L., 2019: Policy perspective: Building political support for carbon pricing – Lessons from cap-and-trade policies. Energy Policy, 134, 110986, doi:10.1016/j.enpol.2019.110986.
Reike, D., W.J.V. Vermeulen, and S. Witjes, 2018: The circular economy: New or Refurbished as CE 3.0? — Exploring Controversies in the Conceptualization of the Circular Economy through a Focus on History and Resource Value Retention Options. Resour. Conserv. Recycl. , 135, 246–264, doi:10.1016/j.resconrec.2017.08.027.
Renforth, P., 2019: The negative emission potential of alkaline materials. Nat. Commun. , 10(1) , 1401, doi:10.1038/s41467-019-09475-5.
Richstein, J.C., 2017: Project-Based Carbon Contracts: A Way to Finance Innovative Low-Carbon Investments. DIW Berlin Discussion Paper No. 1714, 18 pp. doi.org/10.2139/ssrn.3109302
Rietbergen, M.G and K. Blok, 2013: Assessing the potential impact of the CO2Performance Ladder on the reduction of carbon dioxide emissions in the Netherlands. J. Clean. Prod. , 52, 33–45, doi:10.1016/j.jclepro.2013.03.027.
Rietbergen, M.G., A. Van Rheede, and K. Blok, 2015: The target-setting process in the CO2Performance Ladder: Does it lead to ambitious goals for carbon dioxide emission reduction?J. Clean. Prod. , 103, 549–561, doi:10.1016/j.jclepro.2014.09.046.
Rissman, J. et al., 2020: Technologies and policies to decarbonize global industry: Review and assessment of mitigation drivers through 2070. Appl. Energy, 266 (November 2019), 114848, doi:10.1016/j.apenergy.2020.114848.
Rocchi, P., M. Serrano, J. Roca, and I. Arto, 2018: Border Carbon Adjustments Based on Avoided Emissions: Addressing the Challenge of Its Design. Ecol. Econ. , 145, 126–136, doi:10.1016/j.ecolecon.2017.08.003.
Röck, M. et al., 2020: Embodied GHG emissions of buildings – The hidden challenge for effective climate change mitigation. Appl. Energy, 258, 114107, doi:10.1016/j.apenergy.2019.114107.
Rodrik, D., 2014: Green industrial policy. Oxford Rev. Econ. Policy, 30(3) , 469–491, doi:10.1093/oxrep/gru025.
Rogers, E., 2018: Integrating smart manufacturing and strategic energy management programs. In: ECEEE 2018 industry proceedings, Berlin, Germany, pp. 23–31.
Rogge, K.S. and K. Reichardt, 2016: Policy mixes for sustainability transitions: An extended concept and framework for analysis. Res. Policy, 45(8) , 1620–1635, doi:10.1016/j.respol.2016.04.004.
Rogge, K.S. and P. Johnstone, 2017: Exploring the role of phase-out policies for low-carbon energy transitions: The case of the German Energiewende. Energy Res. Soc. Sci. , 33, 128–137, doi:10.1016/j.erss.2017.10.004.
Rogge, K.S., F. Kern, and M. Howlett, 2017: Conceptual and empirical advances in analysing policy mixes for energy transitions. Energy Res. Soc. Sci. , 33 (October), 1–10, doi:10.1016/j.erss.2017.09.025.
Rootzén, J. and F. Johnsson, 2016: Paying the full price of steel – Perspectives on the cost of reducing carbon dioxide emissions from the steel industry. Energy Policy, 98, 459–469, doi:10.1016/j.enpol.2016.09.021.
Rootzén, J. and F. Johnsson, 2017: Managing the costs of CO2 abatement in the cement industry. Clim. Policy, 17(6) , 781–800, doi:10.1080/14693062.2016.1191007.
Rosenbloom, D., J. Markard, F.W. Geels, and L. Fuenfschilling, 2020: Why carbon pricing is not sufficient to mitigate climate change—and how “sustainability transition policy” can help. Proc. Natl. Acad. Sci. , 117(16) , 8664–8668.
Saevarsdottir, G., H. Kvande, and B.J. Welch, 2020: Aluminum Production in the Times of Climate Change: The Global Challenge to Reduce the Carbon Footprint and Prevent Carbon Leakage. JOM, 72(1) , 296–308, doi:10.1007/s11837-019-03918-6.
Sakai, M. and J. Barrett, 2016: Border carbon adjustments: Addressing emissions embodied in trade. Energy Policy, 92, 102–110, doi:10.1016/j.enpol.2016.01.038.
Samadi, S. and C. Barthel, 2020: Meta-Analysis of industry sector transformation strategies in German, European, and global deep decarbonization scenarios. ECEEE Industrial Summer Study Proceedings. , 445–455. https://epub.wupperinst.org/frontdoor/deliver/index/docId/7576/file/7576_Samadi.pdf
Sanchez, D.L., N. Johnson, S.T. McCoy, P.A. Turner, and K.J. Mach, 2018: Near-term deployment of carbon capture and sequestration from biorefineries in the United States. Proc. Natl. Acad. Sci. , 115(19) , 4875–4880, doi:10.1073/pnas.1719695115.
Sandalow, D. et al., 2019: Industrial heat decarbonization roadmap. ICCEF. Bonn, Germany, 75 pp. https://www.icef.go.jp/pdf/summary/roadmap/icef2019_roadmap.pdf . (Accessed March 27, 2021).
Sandberg, N.H. et al., 2016: Dynamic building stock modelling: Application to 11 European countries to support the energy efficiency and retrofit ambitions of the EU. Energy Build. , 132, 26–38, doi:10.1016/j.enbuild.2016.05.100.
Sanjuán, M.Á., C. Andrade, P. Mora, and A. Zaragoza, 2020: Carbon Dioxide Uptake by Cement-Based Materials: A Spanish Case Study. Appl. Sci. , 10(1) , 339, doi:10.3390/app10010339.
Sari, A. and M. Akkaya, 2016: Contribution of Renewable Energy Potential to Sustainable Employment. Procedia - Soc. Behav. Sci. , 229, 316–325, doi:10.1016/j.sbspro.2016.07.142.
Sartor, O., 2013: Carbon Leakage in the Primary Aluminium Sector: What Evidence after 6.5 Years of the EU ETS?Elsevier BV. Amsterdam, Netherlands 20 pp.
Sartor, O., and C. Bataille, 2019: IDDRI Policy Brief: Decarbonising basic materials in Europe: How Carbon Contracts-for-Difference could help bring breakthrough technologies to market . IDDRI. Paris, France. 16 pp. https://www.iddri.org/en/publications-and-events/study/decarbonising-basic-materials-europe. (Accessed March, 27, 2021).
Saunders, H.D. et al., 2021: Energy Efficiency: What Has Research Delivered in the Last 40 Years?Annu. Rev. Environ. Resour. , 46(1) , 135–165, doi:10.1146/annurev-environ-012320-084937.
Saussay, A. and M. Sato., 2018: The impacts of energy prices on industrial foreign investment location: evidence from global firm level data. Grantham Research on Climate Change and the Environment. London, UK. 63 pp.
Saygin, D. and D. Gielen, 2021: Zero-emission pathway for the global chemical and petrochemical sector. Energies, 14(13) , 3772, doi:10.3390/en14133772.
Saygin, D., E. Worrell, M.K. Patel, and D.J. Gielen, 2011: Benchmarking the energy use of energy-intensive industries in industrialized and in developing countries. Energy, 36(11) , 6661–6673, doi:10.1016/j.energy.2011.08.025.
SBTi, 2021: From Ambition To Impact: How Companies Are Reducing Emissions At Scale With Science-Based Targets. Science Based Targets Initiative (SBTi) Annual Progress Report, 2020. 76 pp. https://sciencebasedtargets.org/resources/files/SBTiProgressReport2020.pdf . (Accessed August, 21, 2021).
Scheubel, C., T. Zipperle, and P. Tzscheutschler, 2017: Modeling of industrial-scale hybrid renewable energy systems (HRES) – The profitability of decentralized supply for industry. Renew. Energy, 108, 52–63, doi:10.1016/j.renene.2017.02.038.
Schipper, L., E. Deakin, and C. McAndrews, 2011: Carbon Dioxide Emissions from Urban Road Transport in Latin America: CO2Reduction as a Co-Benefit of Transport Strategies. In: Rothengatter, W., Hayashi, Y., Schade, W. (eds) Transport Moving to Climate Intelligence. Transportation Research, Economics and Policy. Springer, New York, NY. pp. 111–127. https://doi.org/10.1007/978-1-4419-7643-7_8
Schmalensee, R. and R.N. Stavins, 2017: Lessons learned from three decades of experience with cap and trade. Rev. Environ. Econ. Policy, 11(1) , 59–79, doi:10.1093/reep/rew017.
Schneider, M., 2019: The cement industry on the way to a low-carbon future. Cem. Concr. Res. , 124, 105792, doi:10.1016/j.cemconres.2019.105792.
Schneider, S., S. Bajohr, F. Graf, and T. Kolb, 2020: State of the Art of Hydrogen Production via Pyrolysis of Natural Gas. ChemBioEng Rev. , 7(5) , 150–158, doi:10.1002/cben.202000014.
Schoeneberger, C.A. et al., 2020: Solar for industrial process heat: A review of technologies, analysis approaches, and potential applications in the United States. Energy, 206, 118083, doi:10.1016/j.energy.2020.118083.
Schriever, M. and D. Halstrup, 2018: Exploring the adoption in transitioning markets: Empirical findings and implications on energy storage solutions-acceptance in the German manufacturing industry. Energy Policy, 120, 460–468, doi:10.1016/j.enpol.2018.03.029.
Schroeder, P., K. Anggraeni, and U. Weber, 2019: The Relevance of Circular Economy Practices to the Sustainable Development Goals. J. Ind. Ecol. , 23(1) , 77–95, doi:10.1111/jiec.12732.
Schwarz, M., C. Nakhle, and C. Knoeri, 2020: Innovative designs of building energy codes for building decarbonization and their implementation challenges. J. Clean. Prod. , 248, 119260, doi:10.1016/j.jclepro.2019.119260.
Scott, K., J. Giesekam, J. Barrett, and A. Owen, 2019: Bridging the climate mitigation gap with economy‐wide material productivity. J. Ind. Ecol. , 23(4) , 918–931, doi:10.1111/jiec.12831.
Scrivener, K.L., V.M. John, and E.M. Gartner, 2018: Eco-efficient cements: Potential economically viable solutions for a low-CO2 cement-based materials industry. Cem. Concr. Res. , 114 (December), 2–26, doi:10.1016/j.cemconres.2018.03.015.
Sepulveda, N. A., J. D. Jenkins, F. J. de Sisternes, and R. K. Lester, 2018: The Role of Firm Low-Carbon Electricity Resources in Deep Decarbonization of Power Generation. Joule, 2(11) , 2403–2420, doi:10.1016/j.joule.2018.08.006.
Serrenho, A.C., Z.S. Mourão, J. Norman, J. M. Cullen, and J.M. Allwood, 2016: The influence of UK emissions reduction targets on the emissions of the global steel industry. Resour. Conserv. Recycl. , 107, 174–184, doi:10.1016/j.resconrec.2016.01.001.
Serrenho, A.C., J.B. Norman, and J.M. Allwood, 2017: The impact of reducing car weight on global emissions: The future fleet in Great Britain. Philos. Trans. R. Soc. A Math. Phys. Eng. Sci. , 375(2095) , 20160364, doi:10.1098/rsta.2016.0364.
Seto, K. C. et al., 2016: Carbon Lock-In: Types, Causes, and Policy Implications. Annu. Rev. Environ. Resour. , 41 (1), 425–452, doi:10.1146/annurev-environ-110615-085934.
Shadram, F., S. Bhattacharjee, S. Lidelöw, J. Mukkavaara, and T. Olofsson, 2020: Exploring the trade-off in life cycle energy of building retrofit through optimization. Appl. Energy, 269, 115083, doi:10.1016/j.apenergy.2020.115083.
Shanks, W. et al., 2019: How much cement can we do without? Lessons from cement material flows in the UK. Resour. Conserv. Recycl. , 141, 441–454, doi:10.1016/j.resconrec.2018.11.002.
Sharmina, M. et al., 2021: Decarbonising the critical sectors of aviation, shipping, road freight and industry to limit warming to 1.5–2°C. Clim. Policy, 21(4) , 455–474, doi:10.1080/14693062.2020.1831430.
Shell, 2018: Shell Scenarios Sky: Meeting the Goals of Paris Agreement . The Hague, the Netherlands, 69 pp. https://www.shell.com/energy-and-innovation/the-energy-future/scenarios/shell-scenario-sky.html. (Accessed December 23, 2019).
Shi, L. and B. Yu, 2014: Eco-industrial parks from strategic niches to development mainstream: The cases of China. Sustainability. , 6(9) , 6325–6331, doi:10.3390/su6096325.
Shoreh, M.H., P. Siano, M. Shafie-khah, V. Loia, and J.P.S. Catalão, 2016: A survey of industrial applications of Demand Response. Electr. Power Syst. Res. , 141, 31–49, doi:10.1016/j.epsr.2016.07.008.
Shuai, C.-M., L.-P. Ding, Y.-K. Zhang, Q. Guo, and J. Shuai, 2014: How consumers are willing to pay for low-carbon products? – Results from a carbon-labeling scenario experiment in China. J. Clean. Prod. , 83, 366–373, doi:10.1016/J.JCLEPRO.2014.07.008.
Simonen, K. et al., 2019: Buy Clean Washington Study. UW, WSU and CWU. Washington D.C., USA. 173 pp.
Skelton, A.C.H. and J.M. Allwood, 2017: The carbon price: a toothless tool for material efficiency?Philos. Trans. R. Soc. A Math. Phys. Eng. Sci. , 375(2095) , 20160374, doi:10.1098/rsta.2016.0374.
Smith, A. and R. Raven, 2012: What is protective space? Reconsidering niches in transitions to sustainability. Res. Policy, 41(6) , 1025–1036, doi:10.1016/j.respol.2011.12.012.
Söderholm, P. et al., 2019: Technological development for sustainability: The role of network management in the innovation policy mix. Technol. Forecast. Soc. Change, 138, 309–323, doi:10.1016/j.techfore.2018.10.010.
Soo, V.K. et al., 2021: The influence of end-of-life regulation on vehicle material circularity: A comparison of Europe, Japan, Australia and the US. Resour. Conserv. Recycl. , 168 (November 2020), 105294, doi:10.1016/j.resconrec.2020.105294.
Spangenberg, J.H. and S. Lorek, 2019: Sufficiency and consumer behaviour: From theory to policy. Energy Policy, 129, 1070–1079, doi:10.1016/j.enpol.2019.03.013.
Statista, 2021a: World steel production and scrap consumption 2020. https://www.statista.com/statistics/270835/world-steel-production-and-scrap-consumption/ (Accessed August 28, 2021).
Statista, 2021b: Global plastic production 1950–2020. https://www.statista.com/statistics/282732/global-production-of-plastics-since-1950/ (Accessed August 28, 2021).
Steger, S. et al., 2019: Stoffstromorientierte Ermittlung des Beitrags der Sekundärrohstoffwirtschaft zur Schonung von Primärrohstoffen und Steigerung der Ressourcenproduktivität . Dessau, Germany, 391 pp. https://www.umweltbundesamt.de/publikationen/stoffstromorientierte-ermittlung-des-beitrags-der. (Accessed December 15, 2019).
Stern, D., 2019: Routledge Handbook of Energy Economics. [Soytaş, U. and R. Sarı, (eds.)]. Routledge, London, UK.
Sternberg, A. and A. Bardow, 2015: Power-to-What? – Environmental assessment of energy storage systems. Energy Environ. Sci. , 8(2) , 389–400, doi:10.1039/C4EE03051F.
Stiglitz, J., 2006: A New Agenda for Global Warming. Econ. Voice, 3(7) , doi:10.2202/1553-3832.1210.
Stiglitz, J.E., 2019: Addressing climate change through price and non-price interventions. Eur. Econ. Rev. , 119, 594–612, doi:10.1016/j.euroecorev.2019.05.007.
Stiglitz, J.E. et al., 2017: Report of the High-Level Commission on Carbon Prices. World Bank. Washington D.C., USA. 61 pp, doi:10.7916/D8-W2NC-4103.
Stork, M., J. de Beer, N. Lintmeijer, and B. den Ouden, 2018: Chemistry for Climate: Acting on the need for speed. Roadmap for the Dutch Chemical Industry towards 2050. KL Utrecht, the Netherlands, 101 pp. https://www.vnci.nl/Content/Files/file/Downloads/VNCI_Routekaart-2050.pdf . (Accessed March 27, 2021).
Streeck, J., D. Wiedenhofer, F. Krausmann, and H. Haberl, 2020: Stock-flow relations in the socio-economic metabolism of the United Kingdom 1800–2017. Resour. Conserv. Recycl. , 161, 104960, doi:10.1016/j.resconrec.2020.104960.
Stripple, H., C. Ljungkrantz, T. Gustafsson, and R. Andersson, 2018: CO2uptake in cement-containing products. Background and calculation models for IPCC implementation. IVL. Stockholm, Sweden. 66 pp.
Styring, P., D. Jansen, H. Coninick, De, H. Reith, and K. Armstrong, 2011: Carbon Capture and Utilisation in the green economy. New York, USA, 60 pp. http://co2chem.co.uk/wp-content/uploads/2012/06/CCU in the green economy report.pdf. (Accessed March 27, 2021).
Sudmant, A., A. Gouldson, J. Millward-Hopkins, K. Scott, and J. Barrett, 2018: Producer cities and consumer cities: Using production- and consumption-based carbon accounts to guide climate action in China, the UK, and the US. J. Clean. Prod. , 176, 654–662, doi:10.1016/j.jclepro.2017.12.139.
Sullivan, R. and A. Gouldson, 2012: Does voluntary carbon reporting meet investors’ needs?J. Clean. Prod. , 36, 60–67, doi:10.1016/J.JCLEPRO.2012.02.020.
Sun, L. et al., 2017: Eco-benefits assessment on urban industrial symbiosis based on material flows analysis and emergy evaluation approach: A case of Liuzhou city, China. Resour. Conserv. Recycl. , 119, 78–88, doi:10.1016/j.resconrec.2016.06.007.
Sverdrup, H.U., D. Koca, and P. Schlyter, 2017: A Simple System Dynamics Model for the Global Production Rate of Sand, Gravel, Crushed Rock and Stone, Market Prices and Long-Term Supply Embedded into the WORLD6 Model. Biophys. Econ. Resour. Qual. , 2(2) , 8, doi:10.1007/s41247-017-0023-2.
Tagliapietra, S. and G.B. Wolff, 2021a: Form a climate club: United States, European Union and China. Nature, 591(7851) , 526–528, doi:10.1038/d41586-021-00736-2.
Tagliapietra, S. and G.B. Wolff, 2021b: Conditions are ideal for a new climate club. Energy Policy, 158, 112527, doi:10.1016/j.enpol.2021.112527.
Tait, P., C. Saunders, M. Guenther, and P. Rutherford, 2016: Emerging versus developed economy consumer willingness to pay for environmentally sustainable food production: a choice experiment approach comparing Indian, Chinese and United Kingdom lamb consumers. J. Clean. Prod. , 124, 65–72, doi:10.1016/J.JCLEPRO.2016.02.088.
Talens Peiró, L., D. Polverini, F. Ardente, and F. Mathieux, 2020: Advances towards circular economy policies in the EU: The new Ecodesign regulation of enterprise servers. Resour. Conserv. Recycl. , 154, 104426, doi:10.1016/j.resconrec.2019.104426.
Tan, M.Q.B., R.B.H. Tan, and H.H. Khoo, 2014: Prospects of carbon labelling – a life cycle point of view. J. Clean. Prod. , 72, 76–88, doi:10.1016/J.JCLEPRO.2012.09.035.
Tanaka, K., 2008: Assessment of energy efficiency performance measures in industry and their application for policy. Energy Policy, 36(8) , 2887–2902, doi:10.1016/j.enpol.2008.03.032.
Tanaka, K., 2011: Review of policies and measures for energy efficiency in industry sector. Energy Policy, 39(10) , 6532–6550, doi:10.1016/j.enpol.2011.07.058.
Tang, Y. and F. You, 2018: Multicriteria Environmental and Economic Analysis of Municipal Solid Waste Incineration Power Plant with Carbon Capture and Separation from the Life-Cycle Perspective. ACS Sustain. Chem. Eng. , 6(1) , 937–956, doi:10.1021/acssuschemeng.7b03283.
Tanzer, S.E. and A. Ramírez, 2019: When are negative emissions negative emissions?Energy Environ. Sci. , 12(4) , 1210–1218, doi:10.1039/c8ee03338b.
Tanzer, S.E., K. Blok, and A. Ramírez, 2021: Decarbonising Industry via BECCS: Promising Sectors, Challenges, and Techno-economic Limits of Negative Emissions. Curr. Sustain. Energy Reports, 8(4), 253–262, doi:10.1007/s40518-021-00195-3.
Tapia Carlos et al., 2019: Circular Economy and Territorial Consequences. Luxembourg, 84 pp. https://www.espon.eu/circular-economy.
Tchung-Ming, S., A. Diaz Vazquez, and K. Keramidas, 2018: Global Energy and Climate Outlook 2018: Greenhouse gas emissions and energy balances. JRC. Sevilla, Spain. 244 pp.
Testa, F., F. Iraldo, M. Frey, and T. Daddi, 2012: What factors influence the uptake of GPP (green public procurement) practices? New evidence from an Italian survey. Ecol. Econ. , 82, 88–96, doi:10.1016/J.ECOLECON.2012.07.011.
Testa, F., E. Annunziata, F. Iraldo, and M. Frey, 2016: Drawbacks and opportunities of green public procurement: An effective tool for sustainable production. J. Clean. Prod. , 112, 1893–1900, doi:10.1016/j.jclepro.2014.09.092.
Thiébaud, E., L.M. Hilty, M. Schluep, and M. Faulstich, 2017: Use, Storage, and Disposal of Electronic Equipment in Switzerland. Environ. Sci. Technol. , 51(8) , 4494–4502, doi:10.1021/acs.est.6b06336.
Thomas, V. M., 2003: Demand and Dematerialization Impacts of Second-Hand Markets: Reuse or More Use?J. Ind. Ecol. , 7(2) , 65–78, doi:10.1162/108819803322564352.
Thunman, H. et al., 2019: Circular use of plastics-transformation of existing petrochemical clusters into thermochemical recycling plants with 100% plastics recovery. Sustain. Mater. Technol. , 22, e00124, doi:10.1016/j.susmat.2019.e00124.
Tian, J., W. Liu, B. Lai, X. Li, and L. Chen, 2014: Study of the performance of eco-industrial park development in China. J. Clean. Prod. , 64, 486–494, doi:10.1016/J.JCLEPRO.2013.08.005.
Tong, D. et al., 2019: Committed emissions from existing energy infrastructure jeopardize 1.5°C climate target. Nature, 572(7769) , 373–377, doi:10.1038/s41586-019-1364-3.
Tönjes, A., K. Knoop, T. Lechtenböhmer, H. Mölter, and K. Witte, 2020: Dynamics of cross-industry low-carbon innovation in energy intensive industries. ECEEE Industrial Summer Study Proceedings. , 467–476. https://www.eceee.org/library/conference_proceedings/eceee_Industrial_Summer_Study/2020/6-deep-decarbonisation-of-industry/dynamics-of-cross-industry-low-carbon-innovation-in-energy-intensive-industries/. (Accessed March 27, 2021).
Tost, M., M. Hitch, S. Lutter, S. Feiel, and P. Moser, 2020: Carbon prices for meeting the Paris agreement and their impact on key metals. Extr. Ind. Soc. , 7(2) , 593–599, doi:10.1016/j.exis.2020.01.012.
Tunnessen, W. and D. Macri, 2017: Plant-level Goal and Recognition Programs as a Strategic Energy Management Tool. 2017 ACEEE Summer Study on Energy Efficiency in Industry, Denver, CO, USA, 176–187. https://www.aceee.org/files/proceedings/2017/data/polopoly_fs/1.3687835.1501159018!/fileserver/file/790245/filename/0036_0053_000055.pdf . (Accessed August 28, 2021).
Tvinnereim, E. and M. Mehling, 2018: Carbon pricing and deep decarbonisation. Energy Policy, 121, 185–189, doi:10.1016/j.enpol.2018.06.020.
U.S. Geological Survey, 2021: Mineral Commodity Summaries. Reston, VA, USA. 200 pp.
Ueckerdt, F. et al., 2021: Potential and risks of hydrogen-based e-fuels in climate change mitigation. Nat. Clim. Change, 11(5) , 384–393, doi:10.1038/s41558-021-01032-7.
UKCCC, 2019a: Net Zero: The UK’s contribution to stopping global warming. London, UK, 275 pp. https://www.theccc.org.uk/wp-content/uploads/2019/05/Net-Zero-The-UKs-contribution-to-stopping-global-warming.pdf .
UKCCC, 2019b: Net Zero Technical Report . London, UK, 302 pp. https://www.theccc.org.uk/publication/net-zero-technical-report/.
UN, 2015: World Population Prospects 2015. https://population.un.org/wpp/ ((Accessed December 20, 2020)).
UNEP, 2017: 2017 Global Review of Sustainable Public Procurement . Paris, France, 124 pp.
UNEP, 2018: Single-use plastics: A roadmap for sustainability. Nairobi, Kenya, 104 pp.
UNEP, 2019: Emissions Gap Report 2019. Paris, France. 81 pp. https://www.unenvironment.org/resources/emissions-gap-report-2019. (Accessed December 19, 2020).
UNEP, and IRP, 2020: Global Material Flows Database. https://www.resource panel.org/global-material-flows-database (Accessed December 20, 2020).
UNIDO, 2010: Global Industrial Energy Efficiency Benchmarking. An Energy Policy Tool. Vienna, Austria. 58 pp.
UNSD, 2020: Global indicator framework for the Sustainable Development Goals and targets of the 2030 Agenda for Sustainable Development . 21 pp. https://unstats.un.org/sdgs/indicators/Global Indicator Framework after 2020 review_Eng.pdf. (Accessed October 19, 2021).
USEPA, and ICF, 2012: Global Anthropogenic Non-CO2Greenhouse Gas Emissions: 1990–2030. Washington D.C., USA, 176 pp. https://www.epa.gov/sites/production/files/2016-08/documents/epa_global_nonco2_projections_dec2012.pdf . (Accessed December 15, 2019).
USGBC-LA, 2018: Buy Clean California – USGBC LA. https://usgbc-la.org/programs/buy-clean-california/ (Accessed October 29, 2021).
van der Meijden, C.M., L.P.L.M. Rabou, B.J. Vreugdenhil, and R. Smit, 2011: Large Scale Production of Bio Methane from Wood. The International Gas Union Research Conference IGRC, Seoul, South Korea, 16 ppftp://ftp.ecn.nl/pub/www/library/report/2011/m11098.pdf . (Accessed March, 27, 2021)
Van Ewijk, S., J.A. Stegemann, and P. Ekins, 2018: Global life cycle paper flows, recycling metrics, and material efficiency. J. Ind. Ecol. , 22(4) , 686–693, doi:10.1111/jiec.12613.
Van Rijnsoever, F.J., J. Van Den Berg, J. Koch, and M.P. Hekkert, 2015: Smart innovation policy: How network position and project composition affect the diversity of an emerging technology. Res. Policy, 44(5) , 1094–1107, doi:10.1016/j.respol.2014.12.004.
van Vuuren, D.P. et al., 2018: Alternative pathways to the 1.5°C target reduce the need for negative emission technologies. Nat. Clim. Change, 8(5) , 391–397, doi:10.1038/s41558-018-0119-8.
Vanclay, J.K. et al., 2011: Customer Response to Carbon Labelling of Groceries. J. Consum. Policy, 34(1) , 153–160, doi:10.1007/s10603-010-9140-7.
Vogl, V., M. Åhman, and L.J. Nilsson, 2018: Assessment of hydrogen direct reduction for fossil-free steelmaking. J. Clean. Prod. , 203, 736–745, doi:10.1016/j.jclepro.2018.08.279.
Vogl, V., M. Åhman, and L.J. Nilsson, 2021a: The making of green steel in the EU: a policy evaluation for the early commercialization phase. Clim. Policy, 21(1) , 78–92, doi:10.1080/14693062.2020.1803040.
Vogl, V., O. Olsson, and B. Nykvist, 2021b: Phasing out the blast furnace to meet global climate targets. Joule, 5(10) , 2646–2662, doi:10.1016/j.joule.2021.09.007.
Vogt-Schilb, A. and S. Hallegatte, 2017: Climate policies and nationally determined contributions: reconciling the needed ambition with the political economy. Wiley Interdiscip. Rev. Energy Environ. , 6(6) , e256, doi:10.1002/wene.256.
Vogt-Schilb, A., G. Meunier, and S. Hallegatte, 2018: When starting with the most expensive option makes sense: Optimal timing, cost and sectoral allocation of abatement investment. J. Environ. Econ. Manage. , 88, 210–233, doi:10.1016/j.jeem.2017.12.001.
Voldsund, M. et al., 2019: Comparison of technologies for CO2 capture from cement production—Part 1: Technical evaluation. Energies, 12(3) , 559, doi:10.3390/en12030559.
Vollmer, I. et al., 2020: Beyond Mechanical Recycling: Giving New Life to Plastic Waste. Angew. Chemie Int. Ed. , 59(36) , 15402–15423, doi:10.1002/anie.201915651.
Vreys, K., S. Lizin, M. Van Dael, J. Tharakan, and R. Malina, 2019: Exploring the future of carbon capture and utilisation by combining an international Delphi study with local scenario development. Resour. Conserv. Recycl. , 146, 484–501, doi:10.1016/j.resconrec.2019.01.027.
Wang, D.D., and T. Sueyoshi, 2018: Climate change mitigation targets set by global firms: Overview and implications for renewable energy. Renew. Sustain. Energy Rev. , 94, 386–398, doi:10.1016/j.rser.2018.06.024.
Wang, N., J.C.K. Lee, J. Zhang, H. Chen, and H. Li, 2018: Evaluation of Urban circular economy development: An empirical research of 40 cities in China. J. Clean. Prod. , 180, 876–887, doi:10.1016/j.jclepro.2018.01.089.
Wang, P. et al., 2021: Efficiency stagnation in global steel production urges joint supply- and demand-side mitigation efforts. Nat. Commun. , 12(1) , 2066, doi:10.1038/s41467-021-22245-6.
Wang, Q. et al., 2019: Distributional impact of carbon pricing in Chinese provinces. Energy Econ. , 81, 327–340, doi:10.1016/J.ENECO.2019.04.003.
Wang, W., C. Li, and S. Wang, 2017: Big data used in energy efficiency and load forecasting of heating boilers. 2017 36th Chinese Control Conference (CCC) , IEEE, 5638–5641.
Wang, X. and K. Lo, 2021: Just transition: A conceptual review. Energy Res. Soc. Sci. , 82, 102291, doi:10.1016/j.erss.2021.102291.
Wanzenböck, I., J.H. Wesseling, K. Frenken, M.P. Hekkert, and K.M. Weber, 2020: A framework for mission-oriented innovation policy: Alternative pathways through the problem–solution space. Sci. Public Policy, 47(4), 474–489doi:10.1093/scipol/scaa027.
Warwick, K., 2013: Beyond Industrial Policy: Emerging Issues and New Trends.OECD Paris, France.
WBCSD, 2016: Cement Industry Energy and CO2Performance. Getting the Numbers Right . Geneva, Switzerland. 20 pp. https://docs.wbcsd.org/2016/12/GNR.pdf . (Accessed December, 19, 2020).
Weber, K.M. and H. Rohracher, 2012: Legitimizing research, technology and innovation policies for transformative change: Combining insights from innovation systems and multi-level perspective in a comprehensive “failures” framework. Res. Policy, 41(6) , 1037–1047, doi:10.1016/j.respol.2011.10.015.
Wesseling, J.H., and C. Edquist, 2018: Public procurement for innovation to help meet societal challenges: A review and case study. Sci. Public Policy, 45(4) , 493–502, doi:10.1093/SCIPOL/SCY013.
Wesseling, J.H. et al., 2017: The transition of energy intensive processing industries towards deep decarbonization: Characteristics and implications for future research. Renew. Sustain. Energy Rev. , 79 (January), 1303–1313, doi:10.1016/j.rser.2017.05.156.
Wiebe, K.S., M. Harsdorff, G. Montt, M.S. Simas, and R. Wood, 2019: Global Circular Economy Scenario in a Multiregional Input-Output Framework. Environ. Sci. Technol. , 53(11) , 6362–6373, doi:10.1021/acs.est.9b01208.
Wiedenhofer, D., T. Fishman, C. Lauk, W. Haas, and F. Krausmann, 2019: Integrating Material Stock Dynamics Into Economy-Wide Material Flow Accounting: Concepts, Modelling, and Global Application for 1900–2050. Ecol. Econ. , 156, 121–133, doi:10.1016/j.ecolecon.2018.09.010.
Williams, C., A. Hasanbeigi, G. Wu, and L. Price, 2012: International Experiences with Quantifying the Co-Benefits of Energy-Efficiency and Greenhouse-Gas Mitigation Programs and Policies. Berkeley, CA, USA, 102 pp.
Williams, J.H. et al., 2021: Carbon‐Neutral Pathways for the United States. AGU Adv. , 2(1) , doi:10.1029/2020AV000284.
Wilson, C. and A. Grubler, 2011: Lessons from the history of technological change for clean energy scenarios and policies. Nat. Resour. Forum, 35(3) , 165–184, doi:10.1111/j.1477-8947.2011.01386.x.
Wilson, E.J., T.L. Johnson, and D.W. Keith, 2003: Regulating the Ultimate Sink: Managing the Risks of Geologic CO2 Storage. Environ. Sci. Technol. , 37(16) , 3476–3483, doi: https://doi.org/10. 1021/es021038+.
Wilts, H. and I. Bakas, 2019: Preventing plastic waste in Europe. Copenhagen, Denmark, 57 pp. https://www.eea.europa.eu/publications/preventing-plastic-waste-in-europe.
Wilts, H., N. von Gries, and B. Bahn-Walkowiak, 2016: From waste management to resource efficiency-the need for policy mixes. Sustainability. , 8(7) , 1–16, doi:10.3390/su8070622.
Winans, K., A. Kendall, and H. Deng, 2017: The history and current applications of the circular economy concept. Renew. Sustain. Energy Rev. , 68, 825–833, doi:10.1016/j.rser.2016.09.123.
World Bank, 2020: Carbon Pricing Dashboard | Up-to-date overview of carbon pricing initiatives. World Bank. https://carbonpricingdashboard.worldbank.org/ (Accessed October 26, 2021).
World Bank, 2021: World Bank Development Indicators. https://datatopics.worldbank.org/world-development-indicators/ (Accessed August 28, 2021).
World Bank Group, 2019: State and Trends of Carbon Pricing 2019. Washington, DC, USA, 94 pp.
World Steel Association, 2020a: Statistical yearbook2010–2020. Brussels, Belgium. 42 pp. https://www.worldsteel.org/steel-by-topic/statistics/steel-statistical-yearbook.html. (Accessed December, 19, 2020).
World Steel Association, 2020b: Steel’s contribution to a low carbon future and climate resilient societies. Brussels, Belgium. 6 pp. https://www.worldsteel.org/en/dam/jcr:7ec64bc1-c51c-439b-84b8-94496686b8c6/Position_paper_climate_2020_vfinal.pdf . (Accessed March, 27, 2021).
World Steel Association, 2021: World Steel in Figures 2021. Brussels, Belgium. 32 pp. https://www.worldsteel.org/en/dam/jcr:976723ed-74b3-47b4-92f6-81b6a452b86e/World%2520Steel%2520in%2520Figures%25202021.pdf . (Accessed August, 28, 2021).
Worrell, E., J. Allwood, and T. Gutowski, 2016: The Role of Material Efficiency in Environmental Stewardship. Annu. Rev. Environ. Resour. , 41(1) , 575–598, doi:10.1146/annurev-environ-110615-085737.
WRAP and Green Alliance, 2015: Employment and the circular economy: Job creation in a more resource efficient Britain. Banbury, UK, 24 pp. https://wrap.org.uk/sites/files/wrap/Employment and the circular economy summary.pdf. (Accessed March 27, 2021).
Wu, P., S.P. Low, B. Xia, and J. Zuo, 2014: Achieving transparency in carbon labelling for construction materials – Lessons from current assessment standards and carbon labels. Environ. Sci. Policy, 44, 11–25, doi:10.1016/J.ENVSCI.2014.07.009.
Wu, R., Y. Geng, X. Cui, Z. Gao, and Z. Liu, 2019: Reasons for recent stagnancy of carbon emissions in China’s industrial sectors. Energy, 172, 457–466, doi:10.1016/j.energy.2019.01.156.
Wyns, T., G. Khandekar, M. Axelson, O. Sartor, and K. Neuhoff, 2019: Industrial Transformation 2050 – Towards an Industrial strategy for a Climate Neutral Europe. Brussels, Belgium, 79 pp. https://www.ies.be/files/Industrial_Transformat ion_2050_0.pdf .
Xiang, D., Y. Qian, Y. Man, and S. Yang, 2014: Techno-economic analysis of the coal-to-olefins process in comparison with the oil-to-olefins process. Appl. Energy, 113(113) , 639–647, doi:10.1016/j.apenergy.2013.08.013.
Xylia, M., S. Silveira, J. Duerinck, and F. Meinke-Huben, 2016: Worldwide resource efficient steel production. In: Eceee Industrial Summer Study Proceedings, Stockholm, Sweden. pp. 321–333.
Xylia, M., S. Silveira, J. Duerinck, and F. Meinke-Hubeny, 2018: Weighing regional scrap availability in global pathways for steel production processes. Energy Effic. , 11(5) , 1135–1159, doi:10.1007/s12053-017-9583-7.
Yamada, K. and K. Tanaka, 2019: Promotion of Constructing Zero Carbon Society: Effectiveness of Quantitative Evaluation of Technology and System for Sustainable Economic Developmente. T20 Japan, Tokyo, Japan. 19 pp. https://t20japan.org/policy-brief-promotion-constructing-zero-carbon-society/. (Accessed March 27, 2021).
Yang, Y. et al., 2019: Progress in coal chemical technologies of China. Rev. Chem. Eng. , 36(1) , 21–66, doi:10.1515/revce-2017-0026.
Yao, Y. and E. Masanet, 2018: Life-cycle modeling framework for generating energy and greenhouse gas emissions inventory of emerging technologies in the chemical industry. J. Clean. Prod. , 172, 768–777, doi:10.1016/j.jclepro.2017.10.125.
Yoshimoto, Y., 2016: Realization of productivity improvement and energy saving by data utilization to a factory. Spring meeting, the Japan Society for Precision Engineering, pp. 443–444. https://www.jstage.jst.go.jp/article/pscjspe/2016S/0/2016S_443/_pdf/-char/ja.
Zachmann, G. and B. McWilliams, 2020: A European carbon border tax: much pain, little gain. Bruegel, Brussels, Belgium, 19 pp.
Zhang, Z. et al., 2020: Recent advances in carbon dioxide utilization. Renew. Sustain. Energy Rev. , 125 (March), 109799, doi:10.1016/j.rser.2020.109799.
Zheng, J. and S. Suh, 2019: Strategies to reduce the global carbon footprint of plastics. Nat. Clim. Change, 9(5) , 374–378, doi:10.1038/s41558-019-0459-z.
Zhou, N. et al., 2013: China’s energy and emissions outlook to 2050: Perspectives from bottom-up energy end-use model. Energy Policy, 53, 51–62, doi:10.1016/j.enpol.2012.09.065.
Zhou, N. et al., 2019: A roadmap for China to peak carbon dioxide emissions and achieve a 20% share of non-fossil fuels in primary energy by 2030. Appl. Energy, 239 (February), 793–819, doi:10.1016/j.apenergy.2019.01.154.
Zhou, N. et al., 2020: China Energy Outlook: Understanding China’s Energy and Emissions Trends. Berkeley, USA, 135 pp.
Zhu, Q., Y. Geng, and J. Sarkis, 2013: Motivating green public procurement in China: An individual level perspective. J. Environ. Manage. , 126, 85–95, doi:10.1016/J.JENVMAN.2013.04.009.
Zimmerman, J.B., P.T. Anastas, H.C. Erythropel, and W. Leitner, 2020: Designing for a green chemistry future., 367(6476) , 397–400, doi:10.1126/science.aay3060.
Zühlsdorf, B., F. Bühler, M. Bantle, and B. Elmegaard, 2019: Analysis of technologies and potentials for heat pump-based process heat supply above 150°C. Energy Convers. Manag. X, 2, 100011, doi:10.1016/j.ecmx.2019.100011.
1 Accumulated material stock initially was introduced in the analysis of past trends (Krausmann et al. 2018; Wiedenhofer et al. 2019), but recently it was incorporated in different forms in the long-term projections for the whole economy (Krausmann et al. 2020) and for some sectors (buildings and cars in Hertwich et al. (2020)) with a steadily improving regional resolution (Krausmann et al. 2020).
2 In 2020 this factor played on the reduction side as the COVID-19 crisis led to a global decline in demand for basic materials, respective energy use and emissions by 3–5 % (IEA 2020a).
3 This conclusion is also valid separately for developed countries and rest of the world (Krausmann et al. 2020).
4 Cement stock for 2014 was estimated at 75 Gt (Cao et al. 2020).
5 IRP (2020) estimate 2017 material extraction at 94 Gt yr –1.
6 It approaches 60 Gt yr –1 after construction and furniture wood and feedstock fuels are added (Krausmann et al. 2018; Wiedenhofer et al. 2019; UNEP and IRP 2020).
7 Mayer et al. (2019) found that in 2010–2014 the secondary-to-primary materials ratio for the EU-28 was slightly below 9%.
8 According to Circle Economy (2020) 8.6 Gt yr –1 or 8.6% of total inputs for all resources.
9 Environmental impacts of secondary materials are much (up to an order of magnitude) lower compared to primary materials (OECD 2019a; IEA 2021a; Wang et al. 2021), but to enable and mobilise circularity benefits it requires social system and industrial designing transformation (Oberle et al. 2019).
10 IEA (2021a) assesses the global plastics collection rate at 17% for 2020.
11 Significant progress with data and indicators was reached in recent years with the development of several global coverage material flows datasets (Oberle et al. 2019).
12 China contributed three quarters of global industrial energy use increment in 2000–2014. Since 2014 China’s share in global industrial energy use has slowly declined, reaching about a third in 2018 (IEA 2020d).
13 This is close to 28.8% average 1900–2018 share of industrial energy use in global primary energy consumption. This share shows a slow decline trend (0.01% yr –1) in response to the growing share of services in global GDP, with about 60-year-long cycles.
14 Industry also produces goods traditionally used as feedstock – hydrogen and ammonia – which in the future may be widely used as energy carriers.
15 Mapping global flows of fuel feedstock allows for better tailoring of downstream mitigation options for chemical products (Levi and Cullen 2018).
16 Indirect emissions are assessed based on the EDGAR database (Crippa et al. 2021). The IEA database reports 6 Gt of CO2 for 2019 (IEA 2020f).
17 Based on Crippa et al. (2021) and Minx et al. (2021). In 2019, industrial CO2-only emissions were 10.4 GtCO2, which due to wider industrial processes and product use (IPPU) coverage exceeds the CO2 emission assessed by the IEA (2021a) at 8.9 Gt for 2019 and at 8.4–8.5 Gt for 2020.
18 According to the IEA (2020f), industry fuel combustion CO2-only emissions contributed 24% to total combustion emissions, but combined with indirect emission it accounted for 43% in 2018.
19 There are suggestions to incorporate carbon uptake by cement-containing products in IPCC methodology for national GHG inventories (Stripple et al. 2018).
20 Crippa et al. (2021) and the IEA (2020a) assess materials-related scope 1 + 2 (direct and indirect emissions) correspondingly at 10.3 for 2019 and at 10.7 for 2018. Hertwich (2021) updated estimates for the global cradle-to-gate material-production-related GHG emissions for 2018 at 11.8 Gt (5.1 Gt for metals, 3.7 Gt for non-metallic minerals, 1.8 Gt for plastics and rubber, 1 Gt for wood) – which is about 69% of direct and indirect industrial emissions (waste excluded). These assessments are consistent as transportation of basic materials contributes around 1 GtCO2-eq. to GHG emissions.
21 According to Hertwich et al. (2020), of the 11.5 GtCO2-eq 2015 global materials GHG footprint about 5 Gt were embodied in buildings and infrastructure, and nearly 3 Gt in machinery, vehicles, and electronics.
22 According to the International Aluminium Institute (2021b), scope 3 (cradle to gate) emissions from the aluminium industry in 2018 reached 1.127 GtCO2-eq or 17.6 tCO2-eq per tonne of primary aluminium. In the Beyond 2°C Scenario (B2DS) it is expected to be reduced to 2.5 tCO2-eq per tonne.
23 In addition, there are many other studies available which have developed country-specific, technologically detailed scenarios for industry decarbonisation (e.g., Gerbert et al. 2018) and a few which have investigated the decarbonisation prospects of individual industrial clusters (Schneider 2019), but these types of studies are not discussed here.
24 Most of the global mitigation scenarios solely focus on CO2 emissions. Non-CO2 emissions make up only a small share of the industry sector’s current CO2-eq. emissions and include N2O emissions (e.g., from nitric and adipic acid production), CH4 emissions (e.g., from chemical production and iron and steel production) and various F-gases (such as perfluorocarbons from primary aluminium production and semiconductor manufacturing) (USEPA and ICF 2012; Gambhir et al. 2017). Mitigation options for these non-CO2 emissions are discussed in Gambhir et al. (2017).
25 Following the description of IEA SDS 2020 would limit the global temperature rise to below 1.8°C with a 66% probability if CO2 emissions remain at net zero after 2070. If CO2 emissions were to fall below net zero after 2070, then this would increase the possibility of reaching 1.5°C by the end of the century (IEA 2020c).
26 Other global mitigation scenarios (e.g., from Tchung-Ming et al. (2018) and Shell Sky Scenario from Shell (2018)) are not included in the following scenario comparison as these studies’ energy and emission base year data on the industry sector deviates considerably from the other three studies included in the comparison, which all use IEA data. Furthermore, unlike the other studies, Tchung-Ming et al. (2018) do not provide detailed information on the steel, chemicals and concrete subsectors. Not included here but worth mentioning are many other sector-specific studies, for example Napp et al. (2019, 2014), which consider more technologically advanced decarbonisation routes for the sector.
27 Note: In the described scenarios CCS was not taken into consideration as a mitigation option by the authors.


