Chapter 12: Cross sectoral perspectives


This chapter should be cited as:
Babiker, M., G. Berndes, K. Blok, B. Cohen, A. Cowie, O. Geden, V. Ginzburg, A. Leip, P. Smith, M. Sugiyama, F. Yamba, 2022: Cross-sectoral perspectives. In IPCC, 2022: Climate Change 2022: Mitigation of Climate Change. Contribution of Working Group III to the Sixth Assessment Report of the Intergovernmental Panel on Climate Change[P.R. Shukla, J. Skea, R. Slade, A. Al Khourdajie, R. van Diemen, D. McCollum, M. Pathak, S. Some, P. Vyas, R. Fradera, M. Belkacemi, A. Hasija, G. Lisboa, S. Luz, J. Malley, (eds.)]. Cambridge University Press, Cambridge, UK and New York, NY, USA. doi: 10.1017/9781009157926.005
Executive Summary
The total emission mitigation potential achievable by the year 2030, calculated based on sectoral assessments, is sufficient to reduce global greenhouse gas emissions to half of the current (2019) level or less (robust evidence, high agreement). This potential (32–44 GtCO2-eq) requires implementation of a wide range of mitigation options. Options with mitigation costs lower than USD20 tCO2–1 make up more than half of this potential and are available for all sectors. {12.2, Table 12.3}
Carbon dioxide removal (CDR) is a necessary element to achieve net zero CO2and greenhouse gas (GHG) emissions both globally and nationally, counterbalancing residual emissions from hard-to-transition sectors. It is a key element in scenarios that limit warming to 2°C (>67%) or lower by 2100 (robust evidence, high agreement). Implementation strategies need to reflect that CDR methods differ in terms of removal process, timescale of carbon storage, technological maturity, mitigation potential, cost, co-benefits, adverse side effects, and governance requirements. All Illustrative Mitigation Pathways (IMPs) use land-based biological CDR (primarily afforestation/reforestation (A/R)) and/or bioenergy with carbon capture and storage (BECCS) and some include direct air carbon capture and storage (DACCS). As a median value (5–95% range) across the scenarios that limit warming to 2°C (>67%) or lower, cumulative volumes of BECCS, CO2 removal from AFOLU (mainly A/R), and DACCS reach 328 (168–763) gigatonnes of CO2 equivalent (GtCO2), 252 (20–418) GtCO2, and 29 (0–339) GtCO2 for the 2020–2100 period, with annual volumes at 2.75 (0.52–9.45) GtCO2 yr –1 for BECCS, 2.98 (0.23–6.38) GtCO2 yr –1 for the CO2 removal from AFOLU (mainly A/R), and 0.02 (0–1.74) GtCO2 yr –1 for DACCS, in 2050. {12.3, Cross-Chapter Box 8 in this chapter}
Despite limitedcurrent deployment, moderate to large future mitigation potentials are estimated for direct air carbon capture and sequestration (DACCS), enhanced weathering (EW) and ocean-based CDR methods (including ocean alkalinity enhancement and ocean fertilisation) (medium evidence, medium agreement). The potential for DACCS (5–40 GtCO2 yr –1) is limited mainly by requirements for low-carbon energy and by cost (USD100–300 (full range: USD84–386) tCO2–1). DACCS is currently at a medium technology readiness level. EW has the potential to remove 2–4 (full range: <1 to about 100) GtCO2 yr –1, at costs ranging from USD50 to 200 (full range: USD24–578) tCO2–1. Ocean-based methods have a combined potential to remove 1–100 GtCO2 yr –1 at costs of USD40–500 tCO2–1, but their feasibility is uncertain due to possible side effects on the marine environment. EW and ocean-based methods are currently at a low technology readiness level. {12.3}
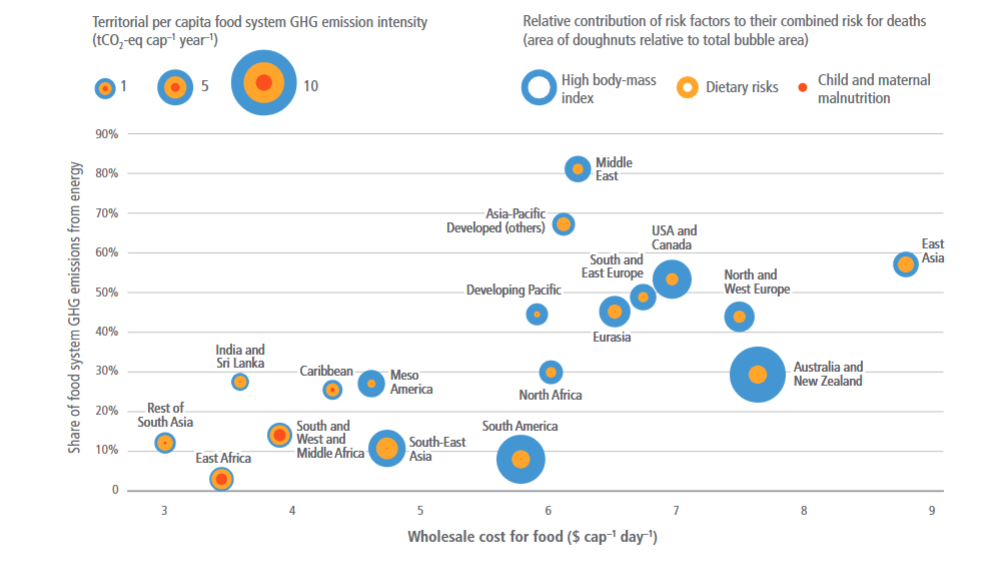
Realising the full mitigation potential from the food system requires change at all stages from producer to consumer and waste management, which can be facilitated through integrated policy packages (robust evidence, high agreement). Some 23–42% of global GHG emissions are associated with food systems, while there is still widespread food insecurity and malnutrition. Absolute GHG emissions from food systems increased from 14 to 17 GtCO2-eq yr –1 in the period 1990–2018. Both supply and demand-side measures are important to reduce the GHG intensity of food systems. Integrated food policy packages based on a combination of market-based, administrative, informative, and behavioural policies can reduce cost compared to uncoordinated interventions, address multiple sustainability goals, and increase acceptance across stakeholders and civil society (limited evidence, medium agreement ). {7.2, 7.4, 12.4}
Diets high in plant protein and low in meat and dairy are associated with lower GHG emissions (robust evidence, high agreement). Ruminant meat shows the highest GHG intensity. Beef from dairy systems has lower emissions intensity than beef from beef herds (8–23 and 17–94 kgCO2-eq per 100 g protein, respectively) when a share of emissions is allocated to dairy products. The wide variation in emissions reflects differences in production systems, which range from intensive feedlots with stock raised largely on grains through to rangeland and transhumance production systems. Where appropriate, a shift to diets with a higher share of plant protein, moderate intake of animal-source foods and reduced intake of added sugars, salt and saturated fats could lead to substantial decreases in GHG emissions. Benefits would also include reduced land occupation and nutrient losses to the surrounding environment, while at the same time providing health benefits and reducing mortality from diet-related non-communicable diseases. {7.4.5, 12.4}
Emerging food technologies such as cellular fermentation, cultured meat, plant-based alternatives to animal-based food products, and controlled-environment agriculture, can bring substantial reductions in direct GHG emissions from food production (limited evidence, high agreement). These technologies have lower land, water, and nutrient footprints, and address concerns over animal welfare. Access to low-carbon energy is needed to realise the full mitigation potential, as some emerging technologies are relatively more energy intensive. This also holds for deployment of cold chain and packaging technologies, which can help reduce food loss and waste, but increase energy and materials use in the food system. (limited evidence, high agreement ). {11.4.1.3, 12.4}
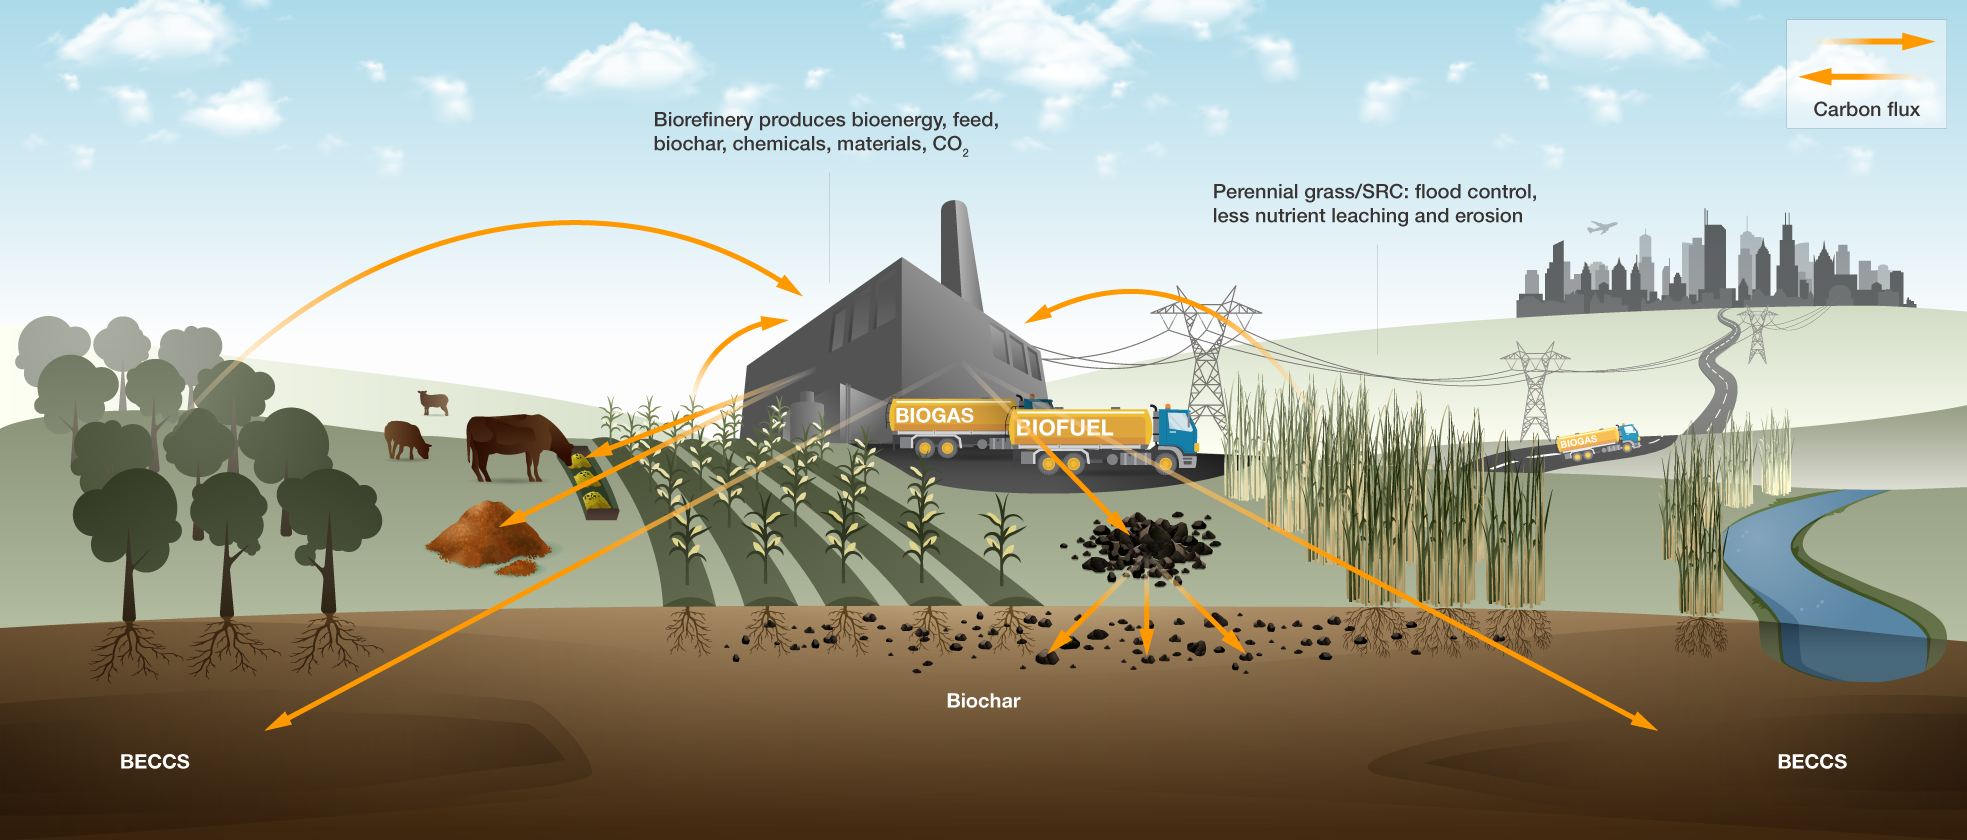
Scenarios that limit warming to 2°C (>67%) or lower by 2100 commonly involve extensive mitigation in the agriculture, forestry and other land use (AFOLU) sector that at the same time provides biomass for mitigation in other sectors. Bioenergy is the most land intensive renewable energy option, but the total land occupation of other renewable energy options can become significant in high deployment scenarios (robust evidence, high agreement). Growing demands for food, feed, biomaterials, and non-fossil fuels increase the competition for land and biomass while climate change creates additional stresses on land, exacerbating existing risks to livelihoods, biodiversity, human and ecosystem health, infrastructure, and food systems. Appropriate integration of bioenergy and other bio-based systems, and of other mitigation options, with existing land and biomass uses can improve resource use efficiency, mitigate pressures on natural ecosystems and support adaptation through measures to combat land degradation, enhance food security, and improve resilience through maintenance of the productivity of the land resource base (medium evidence, high agreement ). {3.2.5, 3.4.6, 12.5}
Bio-based products as part of a circular bioeconomy have potential to support adaptation and mitigation. Key to maximising benefits and managing trade-offs are sectoral integration, transparent governance, and stakeholder involvement (high confidence) . A sustainable bioeconomy relying on biomass resources will need to be supported by technology innovation and international cooperation and governance of global trade to disincentivise environmental and social externalities (medium confidence). {12.5, Cross-Working Group Box 3 in this chapter}
Coordinated, cross-sectoral approaches to climate change mitigation should be adopted to target synergies and minimise trade-offs between sectors and with respect to sustainable development (robust evidence, high agreement). This requires integrated planning using multiple-objective-multiple-impact policy frameworks. Strong interdependencies and cross-sectoral linkages create both opportunities for synergies and the need to address trade-offs related to mitigation options and technologies. This can only be done if coordinated sectoral approaches to climate change mitigation policies that mainstream these interactions are adopted . Integrated planning and cross-sectoral alignment of climate change policies are particularly evident in developing countries’ Nationally Determined Contributions (NDCs) pledged under the Paris Agreement, where key priority sectors such as agriculture and energy are closely aligned between the proposed mitigation and adaptation actions in the context of sustainable development and the Sustainable Development Goals (SDGs). {12.6.2}
Carbon leakage is a critical cross-sectoral and cross-country consequence of differentiated climate policy (robust evidence, medium agreement). Carbon leakage occurs when mitigation measures implemented in one country/sector lead to increased emissions in other countries/sectors. Global commodity value chains and associated international transport are important mechanisms of carbon leakage. Reducing emissions from the value chain and transportation can offer opportunities to mitigate three elements of cross-sectoral spillovers and related leakage: (i) domestic cross-sectoral spillovers within the same country; (ii) international spillovers within a single sector resulting from substitution of domestic production of carbon-intensive goods with their imports from abroad; and (iii) international cross-sectoral spillovers among sectors in different countries . {12.6.3}
Cross-sectoral considerations in mitigation finance are critical for the effectiveness of mitigation action as well as for balancing the often conflicting social, developmental, and environmental policy goals at the sectoral level (medium evidence, medium agreement). True resource mobilisation plans that properly address mitigation costs and benefits at sectoral level cannot be developed in isolation from their cross-sectoral implications. There is an urgent need for multilateral financing institutions to align their frameworks and delivery mechanisms including the use of blended financing to facilitate cross-sectoral solutions as opposed to causing competition for resources among sectors . {12.6.4}
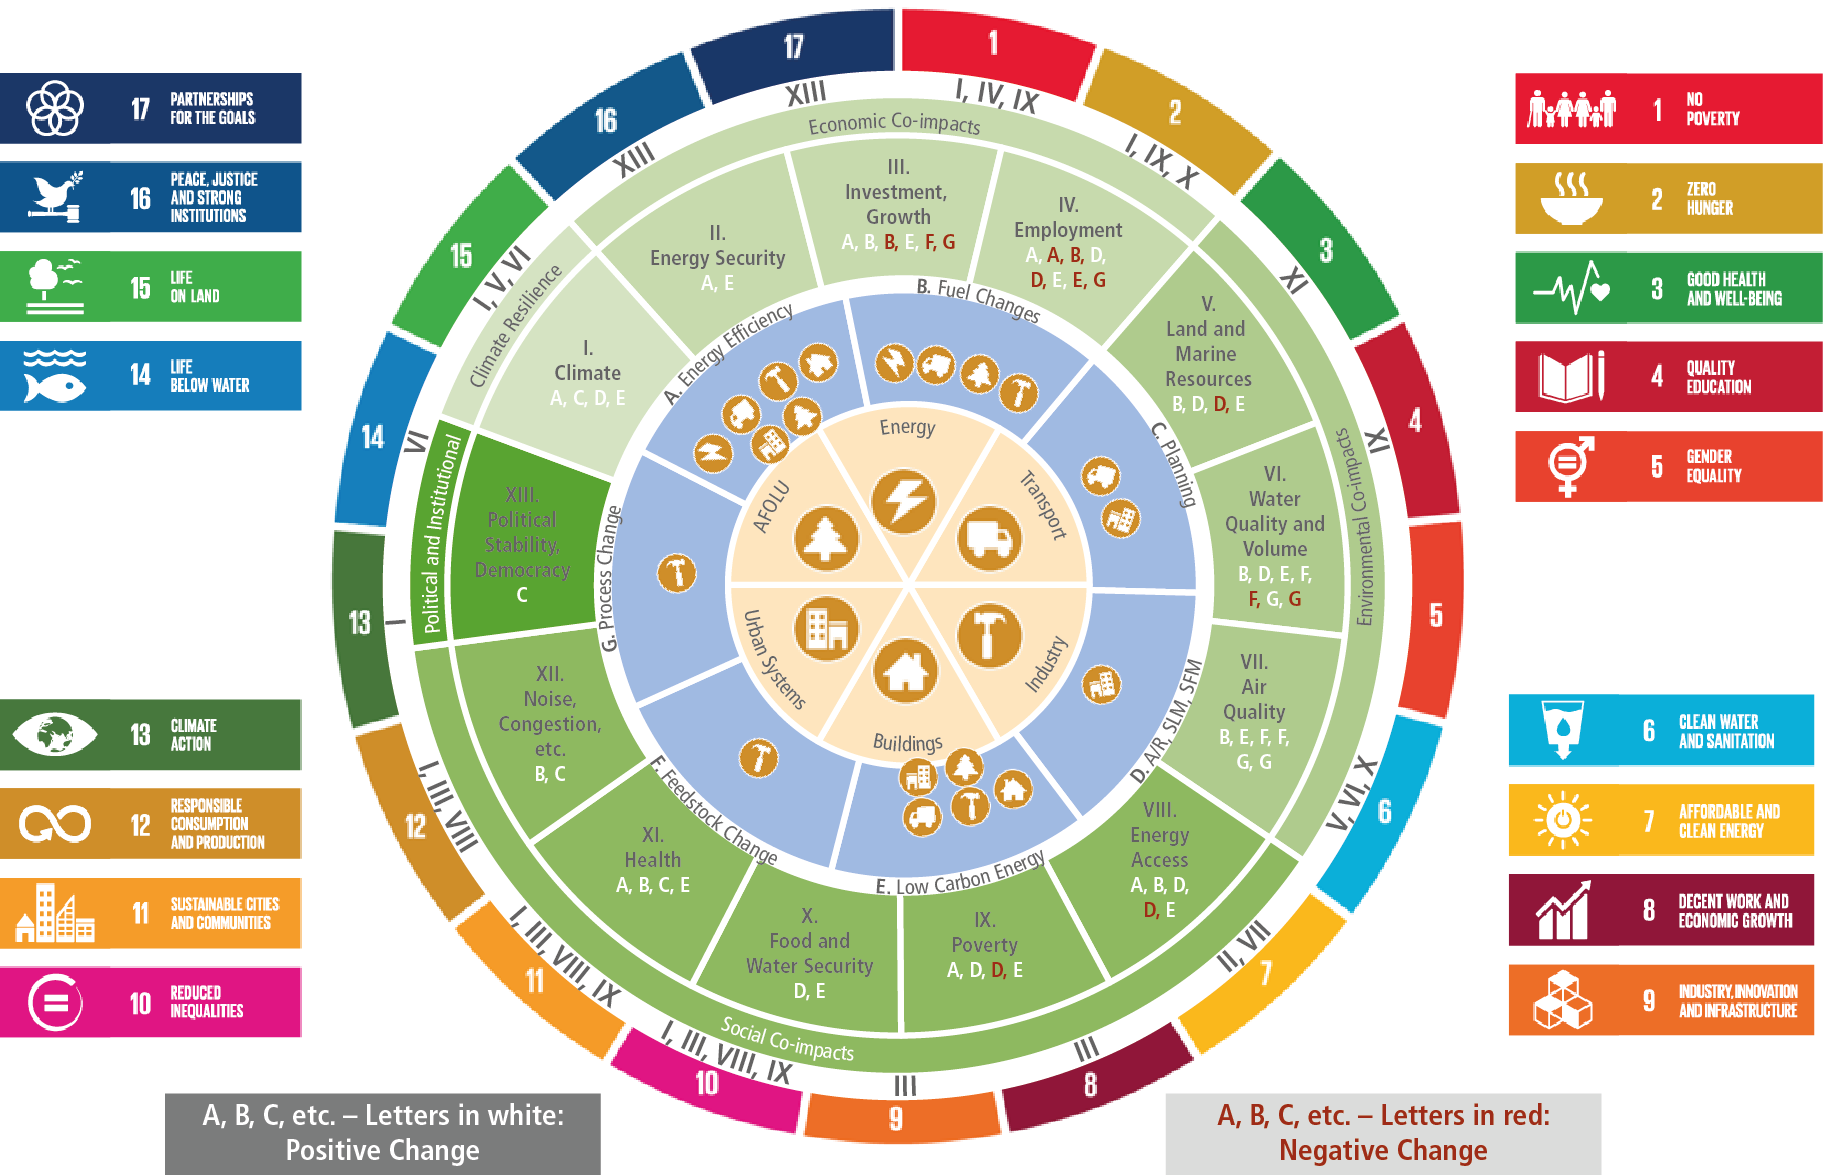
Understanding the co-benefits and trade-offs associated with mitigation is key to supporting societies to prioritise among the various sectoral policy options (medium evidence, medium agreement). For example, CDR options can have positive impacts on ecosystem services and the SDGs, but also potential adverse side effects; transforming food systems has potential co-benefits for several SDGs, but also trade-offs; and land-based mitigation measures may have multiple co-benefits but may also be associated with trade-offs among environmental, social, and economic objectives. Therefore, the possible implementation of the different sectoral mitigation options would depend on how societies prioritise mitigation versus other products and services, including food, material well-being, nature conservation and biodiversity protection, as well as on other considerations such as society’s future dependence on CDR and on carbon-based energy and materials. {12.3, 12.4, 12.5, 12.6.1}
Governance of CDR, food systems and land-based mitigation can support effective and equitable policy implementation (medium evidence, high agreement). Effectively responding to climate change while advancing sustainable development will require coordinated efforts among a diverse set of state- and non-state-actors on global, multinational, national, and sub-national levels. Governance arrangements in public policy domains that cut through traditional sectors are confronted with specific challenges, such as establishing reliable systems for monitoring, reporting and verification (MRV) that allow evaluation of mitigation outcomes and co-benefits. Effectively integrating CDR into mitigation portfolios can build on already existing rules, procedures and instruments for emissions abatement. Additionally, to accelerate research, development, and demonstration, and to incentivise CDR deployment, a political commitment to formal integration into existing climate policy frameworks is required, including reliable MRV of carbon flows. Food systems governance may be pioneered through local food policy initiatives complemented by national and international initiatives, but governance on the national level tends to be fragmented, and thus have limited capacity to address structural issues like inequities in access. The governance of land-based mitigation, including land-based CDR, can draw on lessons from previous experience with regulating biofuels and forest carbon; however, integrating these insights requires governance that goes beyond project-level approaches and emphasises integrated land use-planning and management within the frame of the SDGs. {7.4, Box 7.2, 7.6, 12.3.3, 12.4, 12.5}
12.1Introduction
12.1.1Chapter Overview
The scope of this chapter was motivated by the need for a succinct bottom-up cross-sectoral view of greenhouse gas (GHG) emissions mitigation coupled with the desire to provide systemic perspectives on critical mitigation potentials and options that go beyond individual sectors and cover cross-sectoral topics such as food systems, land systems, and carbon dioxide removal (CDR) methods. Driven by this motivation, Chapter 12 provides a focused thematic assessment of CDR methods and food systems, followed by consideration of land-related impacts of mitigation options (land-based CDR and other mitigation options that occupy land) and other cross-sectoral impacts of mitigation, with emphasis on synergies and trade-offs between mitigation options, and between mitigation and other environmental and socio-economic objectives. The systems focus is unique to the Sixth Assessment Report (AR6) of the IPCC and is of critical policy relevance as it informs coordinated approaches to planning interventions that deliver multiple benefits and minimise trade-offs, and coordinated policy approaches to support such planning, to tap relatively under-explored areas for the strengthening and acceleration of mitigation efforts in the short to medium term, and for dealing with residual emissions in hard-to-transition sectors in the medium to long term.
Table 12.1 presents an overview of the cross-sectoral perspectives addressed in Chapter 12, mapping the chapter’s main themes to the sectoral and global chapters in this report. These mappings reflect the cross-sectoral aspects of mitigation options in the context of sustainable development, sectoral policy interactions, governance, implications in terms of international trade, spillover effects, and competitiveness, and cross-sectoral financing options for mitigation. While some cross-sector technologies are covered in more detail in sectoral chapters, this chapter covers important cross-sectoral linkages and provides synthesis concerning costs and potentials of mitigation options, and co-benefits and trade-offs that can be associated with deployment of mitigation options. Additionally, Chapter 12 covers CDR methods and specific considerations related to land use and food systems, complementing Chapter 7. The literature assessed in the chapter includes both peer-reviewed and grey literature since the Fifth Assessment Report (AR5) of the IPCC, including the IPCC Special Report on Global Warming of 1.5°C (SR1.5), the IPCC Special Report on Climate Change and Land (SRCCL) and the IPCC Special Report on the Ocean and Cryosphere in a Changing Climate (SROCC). Knowledge gaps are identified and reflected where encountered, as well as in a separate section. Finally, a strong link is maintained with sectoral chapters and the relevant global chapters of this report to ensure consistency.
Table 12.1 | An overview of cross-sector perspectives addressed in Chapter 12.
Sectoral chapters | Global chapters | |||||||||||
Chapter 12 themes | Chapter 5 | Chapter 6 | Chapter 7 | Chapter 8 | Chapter 9 | Chapter 10 | Chapter 11 | Chapter 13 | Chapter 14 | Chapter 15 | Chapter 16 | Chapter 17 |
Costs & potentials | Change in demand | Renewables CCU CCS Nuclear | Land-use change | Urban planning Cities Demographics | Standards Electrification | Hybridisation Electric vehicles Fuel economy Decoupling | Technology Biomass CCU CCS | Enabling of mitigation | Finance of mitigation | Synergies and trade-offs with SDGs | ||
CDR | BECCS | Land-based CDR | Carbon storage in buildings | International governance | ||||||||
Food systems | Food demand Well-being | Energy demand of some emerging mitigation options | Agricultural production Demand-side measures | Urban food systems; controlled-environment agriculture | Food transport | Food processing and packaging | Food system transformation | Governance | Food system and SDGs | |||
Mitigation & land use | Land use/ occupation: bioenergy hydro solar windnuclear | A/R Biomass production Bioenergy Biochar | Land use and biomass supply | Land use and biomass supply | Land use and biomass supply | Governance | Co-benefits and adverse side effects | |||||
Cross-sectoral perspectives | Electrification, Hydrogen, Digitalisation, Circularity, Synergies, Trade-offs, Spillovers | Policy interactions Policy packages Case studies Value chain and carbon leakage | Governance Leakage | Blended financing | General-urpose technologies Electrification Hydrogen | SDGs co-benefits Trade-offs Adaptation | ||||||
12.1.2Chapter Content
Chapters 5 to 11 assess outcomes from mitigation measures that are applicable in individual sectors, and potential co-benefits and adverse side effects of these individual measures. Chapter 12 brings together the cross-sectoral aspects of these assessments including synergies and trade-offs as well as the implications of measures that have application in more than one sector and measures whose implementation in one sector impacts implementation in other sectors.
Taking stock of the sectoral mitigation assessments, Chapter 12 provides a summary synthesis of sectoral mitigation costs and potentials in the short and long term along with comparison to the top-down integrated assessment model (IAM) assessment literature of Chapter 3 and the national/regional assessment literature of Chapter 4.
In the context of cross-sectoral synergies and trade-offs, the chapter identifies a number of mitigation measures that have application in more than one sector. Examples include measures involving product and material circularity, which contribute to mitigation of GHG emissions in a number of ways, such as treatment of organic waste to reduce methane emissions, avoid emissions through generation of renewable energy, and reduce emissions through substitution of synthetic fertilisers. Low-carbon energy technologies such as solar and wind may be used for grid electricity supply, as embedded generation in the buildings sector (e.g., rooftop solar) and for energy supply in the agriculture sector. Nuclear and bio-based thermal electric generation can provide multiple synergies including base load to augment solar and wind, district heating, and seawater desalination. Grid-integrated hydrogen systems can buffer variability of solar and wind power and are being explored as a mitigation option in the transport and industry sectors. Carbon capture and storage (CCS) has potential application in a number of industrial processes (cement, iron and steel, petroleum refining and pulp and paper) and the fossil fuel electricity sector. When coupled with energy recovery from biomass (BECCS), CCS can help to provide CO2 removal from the atmosphere. On the demand side, electric vehicles are also considered an option for balancing variable power, energy efficiency options find application across the sectors, as does reducing demand for goods and services, and improving material use efficiency. Focused inquiry into these areas of cross-sectoral perspectives is provided for CDR, food systems, and land-based mitigation options.
A range of examples of where mitigation measures result in cross-sectoral interactions and integration is identified. The mitigation potential of electric vehicles, including plug-in hybrids, is linked to the extent of decarbonisation of the electricity grid, as well as to the liquid fuel supply emissions profile. Making buildings energy positive, where excess energy is used to charge vehicles, can increase the potential of electric and hybrid vehicles. Advanced process control and process optimisation in industry can reduce energy demand and material inputs, which in turn can reduce emissions linked to resource extraction and manufacturing. Trees and green roofs planted to counter urban heat islands reduce the demand for energy for air conditioning and simultaneously sequester carbon. Material and product circularity contributes to mitigation, such as treatment of organic waste to reduce methane emissions, generate renewable energy, and to substitute for synthetic fertilisers.
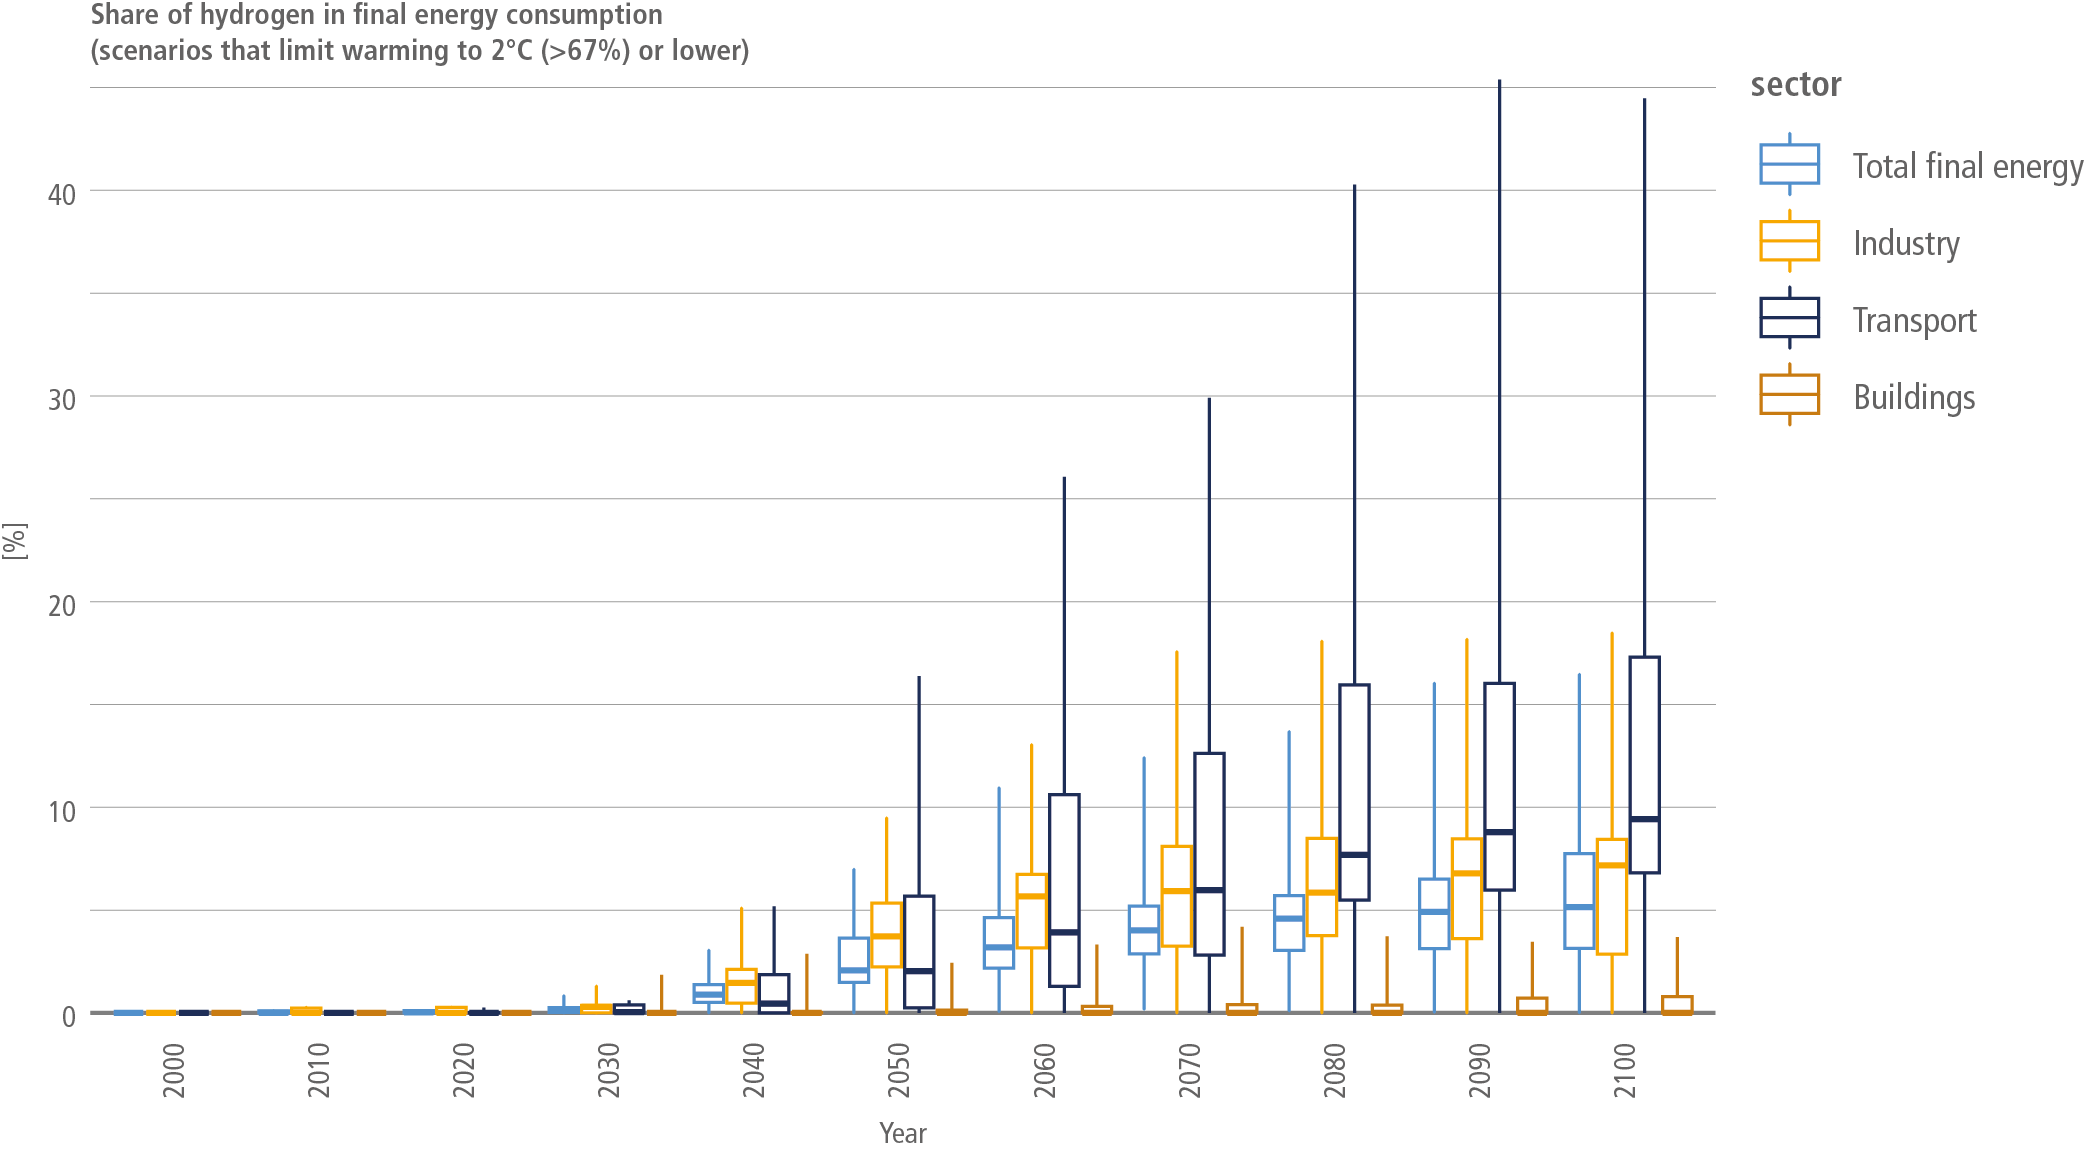
The chapter also discusses cross-sectoral mitigation potential related to diffusion of general-purpose technologies (GPT), such as electrification, digitalisation, and hydrogen. Examples include the use of hydrogen as an energy carrier, which, when coupled with low-carbon energy, has potential for driving mitigation in energy, industry, transport, and buildings (Box 12.5), and digitalisation has the potential for reducing GHG emissions through energy savings across multiple sectors.
The efficient realisation of the above examples of cross-sectoral mitigation would require careful design of government interventions across planning, policy, finance, governance, and capacity building fronts. In this respect, Chapter 12 assesses literature on cross-sectoral integrated policies, cross-sectoral financing solutions, cross-sectoral spillovers and competitiveness effects, and on cross-sectoral governance for climate change mitigation.
Finally, in the context of cross-sectoral synergies and trade-offs, the chapter assesses the non-climate mitigation co-benefits and adverse effects in relation to SDGs, building on the fast-growing literature on the non-climate impacts of mitigation.
12.1.3Chapter Layout
The chapter is mapped into seven sections. Cost and potentials of mitigation technologies are discussed in Section 12.2, where a comparative assessment and a summary of sectoral mitigation cost and potentials is provided in coordination with the sectoral Chapters 5 to 11, along with a comparison to aggregate cost and potentials based on IAM outputs presented in Chapter 3.
Section 12.3 provides a synthesis of the state and potential contribution of CDR methods for addressing climate change. CDR options associated with the agriculture, forestry and other land use (AFOLU) and energy sectors are dealt with in Chapters 6 and 7 and synthesised in Section 12.3. Other methods, not dealt with elsewhere, are covered in more detail. A comparative assessment is provided for the different CDR options in terms of costs, potentials, governance, impacts and risks, and synergies and trade-offs.
Section 12.4 assesses the literature on food systems and GHG emissions. The term ‘food system’ refers to a composite of elements (environment, people, inputs, processes, infrastructures, institutions, etc.) and activities that relate to the production, processing, distribution, preparation and consumption of food, and the outputs of these activities, including socio-economic and environmental outcomes. Climate change mitigation opportunities and related implications for sustainable development and adaptation are assessed, including those arising from food production, landscape impacts, supply chain and distribution, and diet shifts.
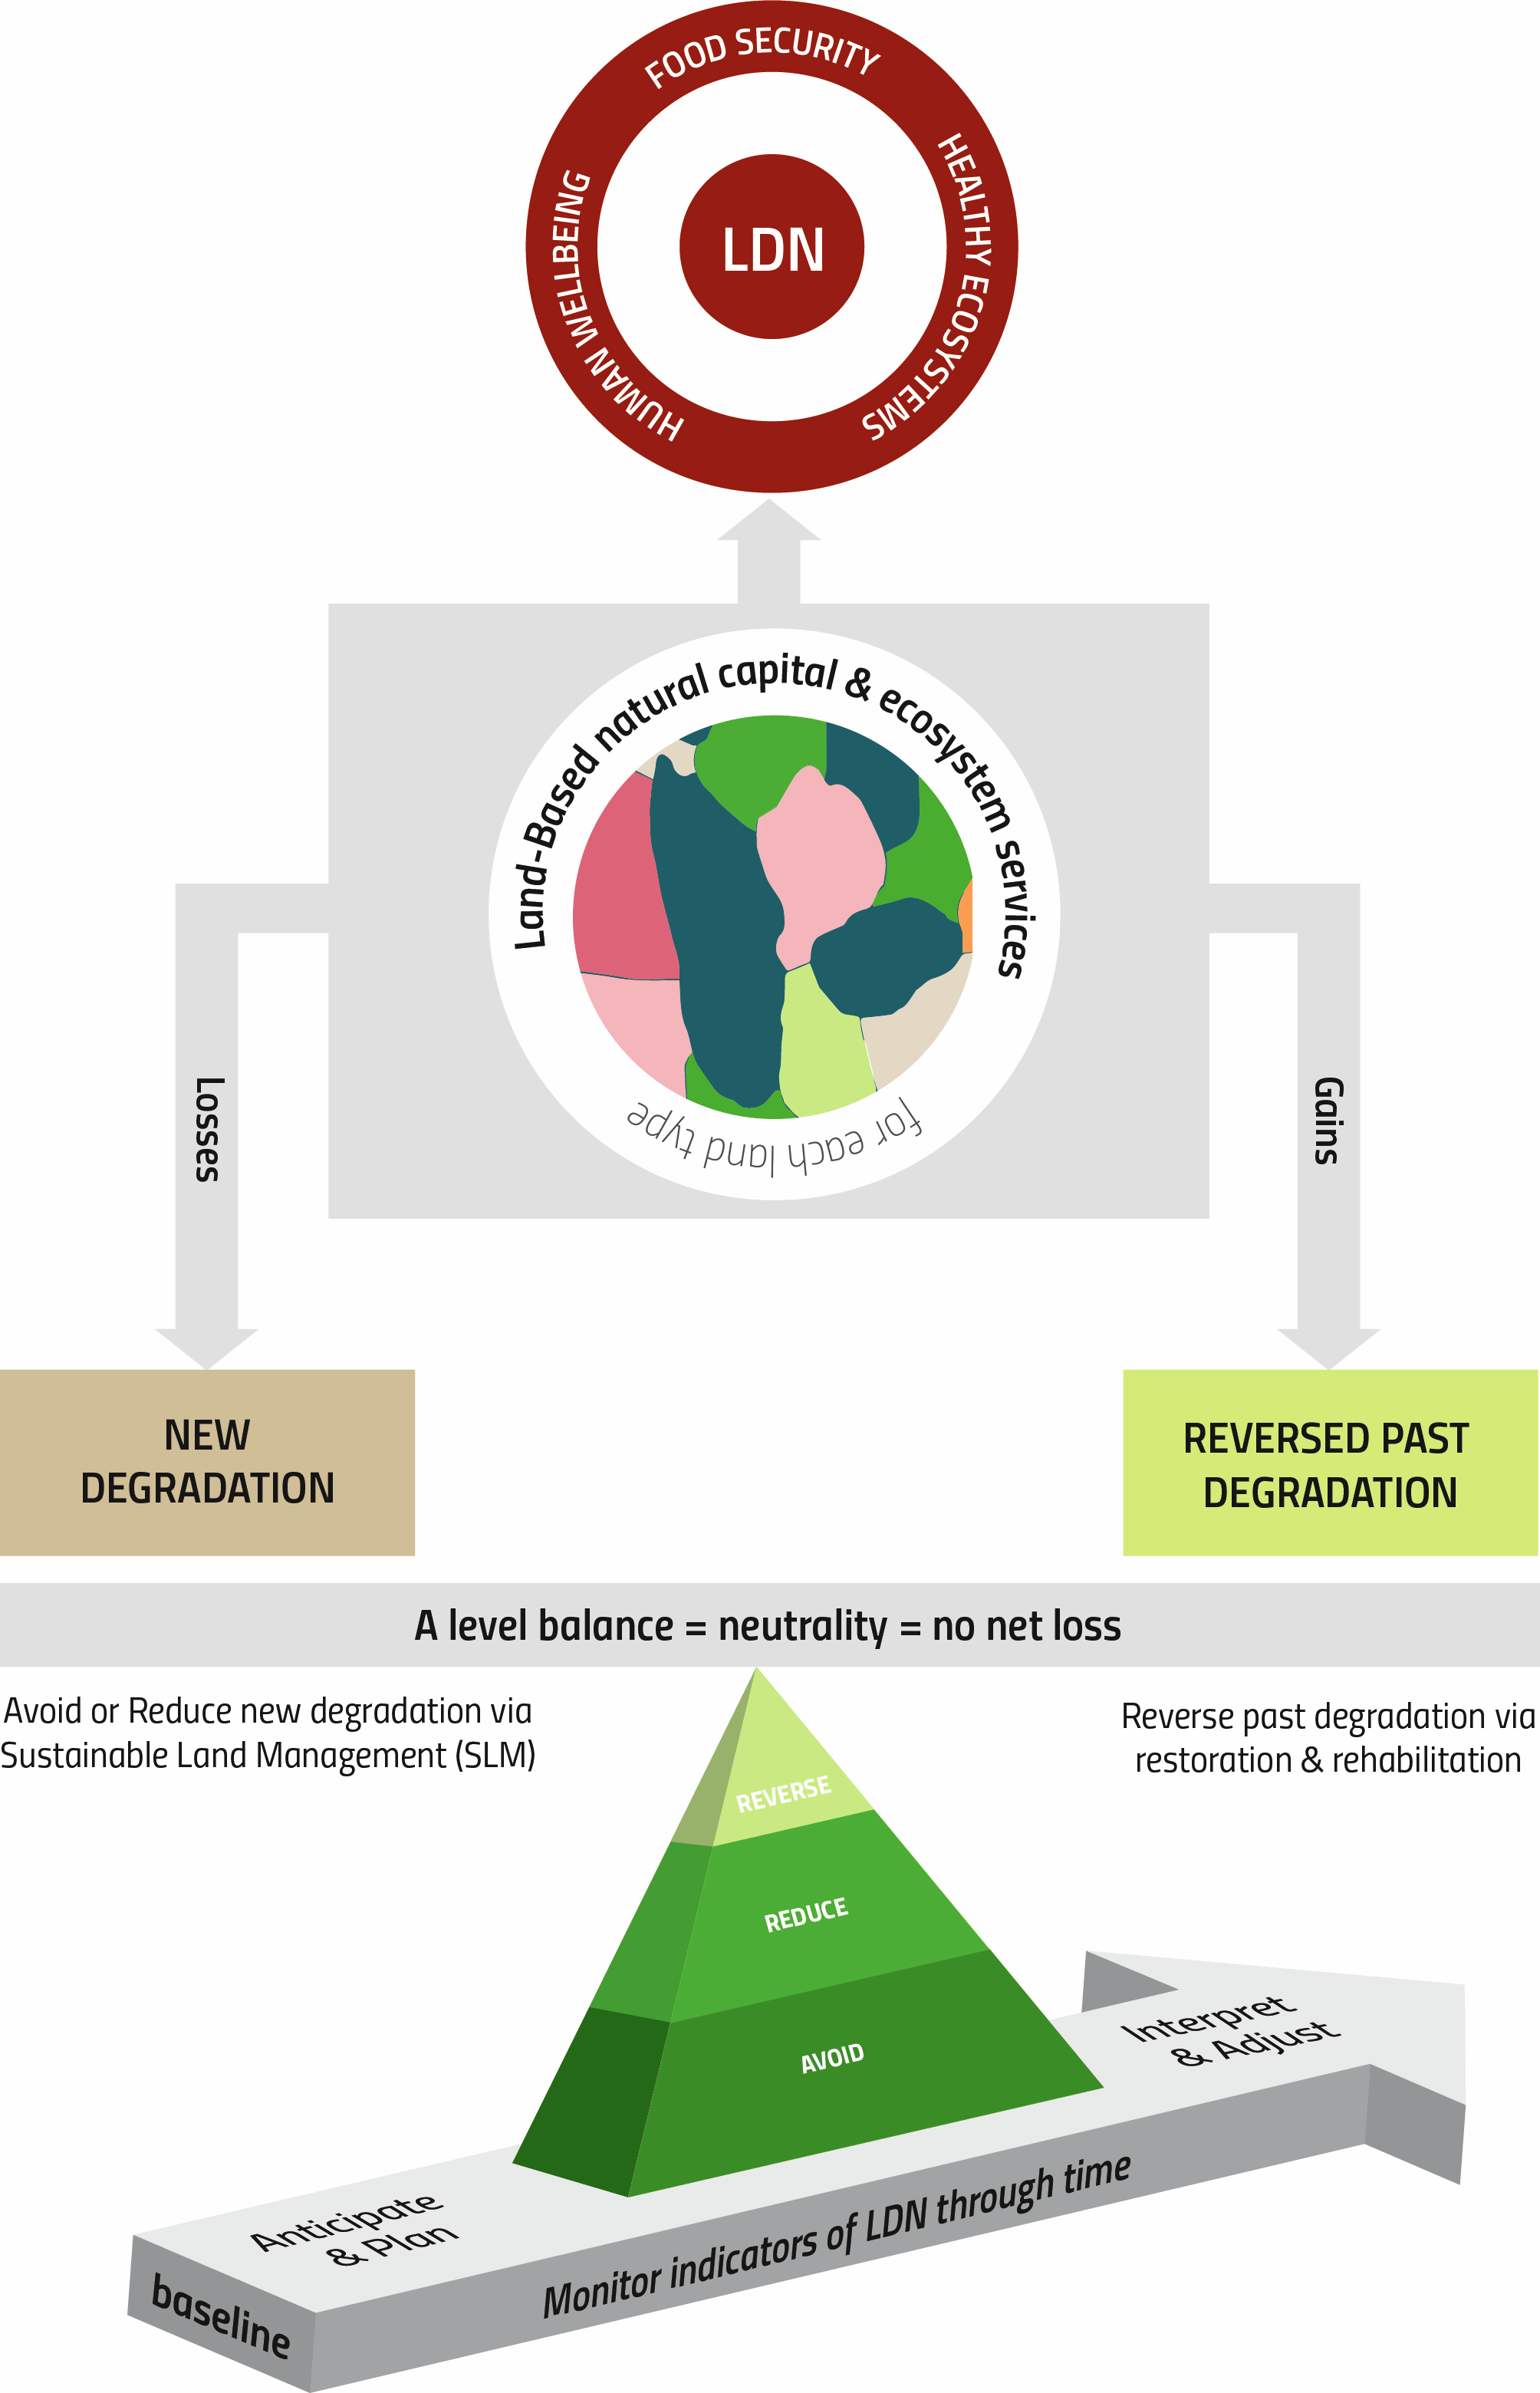
Section 12.5 provides a cross-sectoral perspective on land occupation and related impacts, risks and opportunities associated with land-based mitigation options as well as mitigation options that are not designated land based, yet occupy land. It builds on SRCCL and Chapter 7 in this report, which covers mitigation in AFOLU, including biomass production for mitigation in other sectors. In addition to an assessment of biophysical and socio-economic risks, impacts and opportunities, this section includes a Cross-Working Group Box (WGII and WGIII) on Mitigation and Adaptation via the Bioeconomy, and a Box on Land Degradation Neutrality as a framework to manage trade-offs in land-based mitigation.
Section 12.6 provides a cross-sectoral perspective on mitigation, co-benefits, and trade-offs, including those related to sustainable development and adaptation. The synthesised sectoral mitigation synergies and trade-offs are mapped into options/technologies, policies, international trade, and finance domains. Cross-sectoral mitigation technologies fall into three categories in which the implementation of the technology: (i) occurs in parallel in more than one sector; (ii) could involve interaction between sectors, and/or (iii) could create resource competition among sectors. Policies that have direct sectoral effects include specific policies for reducing GHG emissions and non-climate policies that yield GHG emissions reductions as co-benefits. Policies may also have indirect cross-sectoral effects, including synergies and trade-offs that may, in addition, spill over to other countries.
Section 12.7 provides an overview of knowledge gaps, which could be used to inform further research.
12.2Aggregation of Sectoral Costs and Potentials
The aim of this section is to provide a consolidated overview of the net emissions reduction potentials and costs for mitigation options available in the various sectors dealt with in the sectoral Chapters 6, 7, 9, 10 and 11 of this assessment report. This overview provides policymakers with an understanding of which options are more or less important in terms of mitigating emissions in the short term (here interpreted as 2030), and which ones are more or less costly. The intention is not to provide a high level of accuracy for each technology cost or potential, but rather to indicate relative importance on a global scale and whether costs are low, intermediate or high. The section starts with an introduction (Section 12.2.1), providing definitions and the background. Next, ranges of net emission reduction potentials and the associated costs for the year 2030 are presented (Section 12.2.2) and compared to earlier estimates and with the outputs of IAMs (Section 12.2.3). Finally, an outlook to the year 2050 is provided (Section 12.2.4).
12.2.1Introduction
The term ‘mitigation potential’ is used here to report the quantity of net greenhouse gas emissions reductions that can be achieved by a given mitigation option relative to a specified reference scenario. The net greenhouse gas emission reduction is the sum of reduced emissions and enhanced sinks. Several types of potential can be distinguished. The technical potential is the mitigation potential constrained by theoretical limits in addition to the availability of technology and practices. Quantification of technical potentials primarily takes into account technical considerations, but social, economic and/or environmental considerations are sometimes also considered, if these represent strong barriers to the deployment of an option. The economic potential, being the potential reported in this section, is the proportion of the technical potential for which the social benefits exceed the social costs, taking into account a social discount rate and the value of externalities (see Annex I: Glossary). In this section, only externalities related to greenhouse gas emissions are taken into account. They are represented by using different cost cut-off levels of options in terms of USD per tonne of avoided CO2-eq emissions. Other potentials, such as market potentials, could also be considered, but they are not included in this section.
The analysis presented here is based, as far as possible, on information contained in Chapters 6, 7, 9, 10 and 11, where costs and potentials, referred to here as ‘sectoral mitigation potentials’ have been discussed for each individual sector. In the past, these were designated as bottom-up potentials, in contrast to the top-down potentials that are obtained from integrated energy-economic models and IAMs. However, IAMs increasingly include ‘bottom-up’ elements, which makes the distinction less clear. Still, sectoral studies often have more technical and economic detail than IAMs. They may also provide more up-to-date information on technology options and associated costs. However, aggregation of results from sectoral studies is more complex, and although interactions and overlap are corrected for as far as possible in this analysis, it is recognised that such systemic effects are much more rigorously taken into account in IAMs. A comparison is made between the sectoral results and the outcomes of the IAMs in Section 12.2.3.
Costs of mitigation options will change over time. For many technologies, costs will reduce as a result of technological learning. An attempt has been made to take into account the average, implementation-weighted costs until 2030. However, the underlying literature did not always allow such costs to be presented. For the year 2030, the results are presented similarly to AR4, with a breakdown of the potential in ‘cost bins’. For the year 2050, a more qualitative approach is provided. The origins of the cost data in this section are mostly based on studies carried out in the period 2015–2020. Given the wide range of the cost bins that are used in this section it is not meaningful (and often not possible) to convert to USD values for one specific year. This may lead to some extra uncertainty, but this is expected to be relatively small.
As indicated previously, net emission reduction potentials are presented based on comparison with a reference scenario. Unfortunately, not all costs and potentials found in the literature are determined against the same reference scenarios. In this assessment, reference scenarios are based on what were assumed current-policy scenarios in the period 2015–2019. Typical reference scenarios are the Shared Socio-economic Pathway (SSP2) scenarios (Fricko et al. 2017) and the Current Policies scenario from the World Energy Outlook (WEO) 2019 (IEA 2019). They can both be considered scenarios with middle-of-the-road expectations on population growth and economic development, but there are still some differences between the two (Table 12.2). The net emissions reduction potentials reported here were generally based on analyses carried out before 2020, so the impact of the COVID-19 pandemic was not taken into account. For comparison, the Stated Policies scenario of the World Energy Outlook 2020 (IEA 2020a) is also shown, one of the scenarios in which the impact of COVID-19 was considered. Variations of up to 10% between the different reference scenarios exist with respect to macro-variables such as total primary energy use and total GHG emissions. The potential estimates presented below should be interpreted against this background. The total emissions under the reference scenarios in 2030 are expected to be in the range of 54 to 68 GtCO2-eq yr –1 with a median of 60 GtCO2-eq yr –1 (Table 4.1).
For the energy sector the potentials are determined using the World Energy Outlook 2019 Current Policies Scenario as a reference (IEA 2019). However, for the economic assessment, more recent Levelised Costs of Electricity (LCOEs) for different electricity generating technologies were used (IEA 2020a). For the AFOLU sector, the potentials were derived from a variety of studies. It may be expected that the best estimates, as averages, match with the reference in a middle-of-the-road scenario. For the buildings sector, the Current Policies scenario of World Energy Outlook 2019 (IEA 2019) was used as a reference. For the transport sector, the references of the underlying sources were used. For the industry sector, the scenarios used have emissions that are slightly higher than in the Current Policies scenario from the World Energy Outlook 2019 (IEA 2019).
Table 12.2 | Key characteristics of the scenarios used as a reference for determining costs and potentials. The values are for the year 2030.
SSP2 reference (MESSAGE-GLOBIOM) | All reference scenarios median (25th–75th percentiles in parenthesis) (AR6 scenarios database, IIASA, 2021) | WEO-2019 (Current Policies) (IEA 2019) | WEO-2020 (Stated Policies) | AR6 WG III Chapter 4 (Chapter 4, Table 4.1) | |
Real GDP (purchasing power parity, PPP) (1012USD) | 158 (USD2010) | 159 (154–171) | 3.6% p.a. ↑ (2018 to 2030) | 2.9% p.a. ↑ (2019 to 2030) | |
Population (billion) | 8.30 | 8.30 (8.20–8.34) | 8.60 | ||
Total primary energy use (EJ) | 627 | 670 (635–718) | 710 | 660 | |
Total final energy use (EJ) | 499 | 480 (457–508) | 502 | 472 | |
Energy-related CO2 emissions (Gt) | 33.0 | 37.9 (34.7–41.4) | 37.4 | 33.2a | 37 (35–45) |
CO2 emissions energy and industry (Gt) | 37.9 | 42.3 (39.0–45.8) | 36.0 | ||
Total CO2 emissions (Gt) | 40.6 | 45.7 (41.8–49.4) | 43 (38–51) | ||
Total greenhouse gas emissions (GtCO2-eq) | 52.7 | 59.7 (55.0–65.8) | 60 (54–68) |
aThe difference between WEO-2020 and WEO-2019 is partly explained by the fact that WEO-2019 had two different reference scenarios: Current Policies and Stated Policies. WEO-2020 has only one reference: the Stated Policies Scenario, which ‘is based on today’s policy settings’. The Stated Policies Scenario in WEO-2019 had energy-related emissions of 34.9 GtCO2. EJ, exajoules (1 x 10¹⁸ joules); p.a., per annum.
12.2.2Costs and Potentials of Options for 2030
In this section, we present an overview of mitigation options per sector. An overview of net emissions reduction potentials for different mitigation options is presented in Table 12.3.
Table 12.3 | Detailed overview of global net GHG emissions reduction potentials (GtCO2-eq) in the various cost categories for the year 2030. Note that potentials within and across sectors cannot be summed, as the adoption of some options may affect the mitigation potentials of other options. Only monetary costs and benefits of options are taken into account. Negative costs occur when the benefits are higher than the costs. For wind energy, for example, this is the case if production costs are lower than those of the fossil alternatives. Ranges are indicated for each option separately, or indicated for the sector as a whole (see Notes column); they reflect full ranges. Cost ranges are not cumulative, e.g., to obtain the full potential below USD50 tCO2-eq –1, the potentials in the cost bins <USD0, USD0–20 and USD20–50 tCO2-eq –1 need to be summed together.
Emissions reduction options (including carbon sequestration options) | Cost categories (USD tCO2-eq–1) | Notes | ||||
<0 | 0–20 | 20–50 | 50–100 | 100–200 | ||
Energy sector | Cost ranges are derived as ranges of LCOEs for different electricity generating technologies and the potentials are updated from UNEP (2017). | |||||
Wind energy | 2.1–5.6 (majority in <0 range) | Costs for system integration of intermittent renewables are not included, but these are expected to have limited impact until 2030 and will depend on market design and cross-sectoral integration. | ||||
Solar energy | 2.0–7.0 (majority in <0 range) | |||||
Nuclear energy | 0.88 ± 50% | |||||
Bioelectricity | 0.86 ± 50% | Biomass use for indoor heating and industrial heat is not included here. Currently, about 90% of renewable industrial heat consumption is bio-based, mainly in industries that can use their own biomass waste and residues (IEA, 2020). | ||||
Hydropower | 0.32 ± 50% | Mitigation costs show large variation and may end up beyond these ranges. | ||||
Geothermal energy | 0.74 ± 50% | Mitigation costs show large variation and may end up beyond these ranges. | ||||
Carbon capture and storage (CCS) | 0.54 ± 50% | |||||
Bioelectricity with CCS | 0.30 ± 50% | |||||
CH4 emissions reduction from coal mining | 0.04 (0.01–0.06) | 0.41 (0.15–0.64) | 0.03 (0.02–0.05) | 0.02 (0.01–0.03) | ||
CH4 emissions reduction from oil and gas operations | 0.31 (0.12–0.56) | 0.61 (0.23–1.30) | 0.07 (0.03–0.20) | 0.06 (0.00–0.29) | 0.10 (0–0.29) | |
Land-based mitigation options (including agriculture and forestry) | Potentials for AFOLU are averages for the period 2020–2050 and represent a proxy for mitigation in 2030. Technical potentials listed below include the potentials already listed in the previous columns. Note that in Table 7.3 the same potentials are listed, but they are cumulative over the cost bins. | |||||
Carbon sequestration in agriculture (soil carbon sequestration, agroforestry and biochar application) | 0.50 (0.38–0.60) | 0.73 (0.5–1.0) | 2.21 (0.6–3.9) | Technical potential: 9.5 (range 1.1–25.3). | ||
CH4 and N2O emissions reduction in agriculture (reduced enteric fermentation, improved manure management, nutrient management, rice cultivation) | 0.35 (0.11–0.84) | – | 0.28 (0.19–0.46) | Technical potential: 1.7 (range 0.5–3.2). GWPs used from AR4 and AR5. | ||
Protection of natural ecosystems (avoid deforestation, loss and degradation of peatlands, coastal wetlands and grasslands) | 2.28 (1.7–2.9) | 0.12 (0.06–0.18) | 1.63 (1.3–4.2) | 0.22 (0.09–0.45) | Technical potential 6.2 (range 2.8–14.4). | |
Restoration (afforestation, reforestation, peatland restoration, coastal wetland restoration) | 0.15 | 0.57 (0.2–1.5) | 1.46 (0.6–2.3) | 0.66 (0.4–1.1) | Technical potential 5.0 (range 1.1–12.3). | |
Improved forest management, fire management | 0.38 (0.32–0.44) | – | 0.78 (0.32–1.44) | Technical potential 1.8 (range 1.1–2.8). | ||
Reduction of food loss and food waste | Feasible potential 0.5 (0.1–0.9). Technical potential 0.7 (0.1–1.6). Estimates reflect direct mitigation from diverted agricultural production only, not including land use effects. | |||||
Shift to sustainable healthy diets | Feasible potential 1.7 (1.0–2.7). Technical potential 3.5 (2.1–5.5). Estimates reflect direct mitigation from diverted agricultural production only, not including land-use effects. | |||||
Buildings | To avoid double-counting, the numbers were corrected for the potential overlap between options in the order sufficiency, efficiency, renewable measures and they could be therefore added up. In 2050, much larger and cheaper potential is available (see Section 9.6); the potential in 2030 is lower and more expensive, mostly due to various feasibility constraints. | |||||
Sufficiency to avoid demand for energy services (e.g., efficient building use and increased inhabitancy and density) | 0.56 (0.28–0.84) | |||||
Efficient lighting, appliances and equipment, including information and communications technologies, water heating and cooking technologies | 0.73 (0.54–0.91) | |||||
New buildings with very high energy performance (change in construction methods, management and operation of buildings, efficient heating, ventilation and air conditioning) | 0.35 (0.26–0.53) | 0.83 (0.62–1.24) | ||||
Onsite renewable production and use (often backed-up with demand-side flexibility and digitalisation measures, typically installed in very new high energy performance buildings) | 0.20 (0.15–0.30) | 0.27 (0.20–0.40) | ||||
Improvement of existing building stock (thermal efficiency of building envelopes, management and operation of buildings, and efficient heating, ventilation and air conditioning leading to ‘deep’ energy savings) | 0.27 (0.20–0.34) | Additionally, there is 0.50 (range 0.37–0.62) GtCO2-eq of potential above a price of USD200 tCO2-eq –1. | ||||
Enhanced use of wood products | Technical potential 1.0 (range 0.04–3.7). Economic potential 0.38 (range 0.3–0.5) (varying carbon prices). Potential is mainly in the construction sector. | |||||
Transport | Options for the transportation sector have an uncertainty of ±50%. | |||||
Light duty vehicles – fuel efficiency | 0.6 | |||||
Light duty vehicles – electric vehicles | Estimated potential is 0.5-0.7 GtCO2-eq, depending on the carbon intensity of the electricity supplied to the vehicles. Mitigation costs are variable. | |||||
Light duty vehicles – shift to public transport | 0.5 | |||||
Light duty vehicles – shift to bikes and e-bikes | 0.2 | |||||
Heavy duty vehicles – fuel efficiency | 0.4 | |||||
Heavy duty vehicles – electric vehicles | Estimated potential is 0.2 GtCO2-eq. Mitigation costs are variable. | |||||
Heavy duty vehicles – shift to rail | No data available. | |||||
Shipping – efficiency, optimisation, biofuels | 0.5 (0.4–0.7) | |||||
Aviation – energy efficiency | 0.12–0.32 | Limited evidence. | ||||
Biofuels | 0.6–0.8 | |||||
Industry | The numbers for the industry sector typically have an uncertainty of ±25%, unless indicated differently. The numbers are corrected for overlap between the options, except for the 0.15 GtCO2potential in the highest cost bin. For the rest they can be aggregated to provide full potentials. | |||||
Energy efficiency | 1.14 | This only applies to more efficient use of fuels. More efficient use of electricity is not included. | ||||
Material efficiency | 0.93 | |||||
Circularity (enhanced recycling) | 0.48 | |||||
Fuel switching | 1.28 | 0.67 | 0.15 | |||
Feedstock decarbonisation, process change | 0.38 | |||||
Carbon capture, utilisation and storage (CCU and CCS) | 0.15 (0.08–0.36) | |||||
Cementitious material substitution | 0.28 | |||||
Reduction of non-CO2 emissions | 0.2 | |||||
Cross-sectorial | ||||||
Emission reduction of fluorinated gases | 0.26 (0.01–0.50) | 0.68 (0.55–0.90) | 0.18 (0.01–0.42) | 0.09 (0–0.20) | 0.03 (0–0.05) | GWPs not updated. |
Reduction of CH4 emissions from solid waste | 0.33 (0.24–0.43) | 0.11 (0.03–0.15) | 0.06 (0.03–0.08) | 0.04 (0.01–0.10) | 0.08 (0.02–0.12) | |
Reduction of CH4 emissions from wastewater | 0.02 (0–0.05) | 0.03 (0.01–0.05) | 0.04 (0.01–0.07) | 0.03 (0.02–0.04) | 0.07 (0.01–0.16) | |
Direct air carbon capture and storage (DACCS) | very small | There is potential in these categories, but given the current technology readiness levels, for 2030 the potential is limited. Also, it is not certain whether the costs will have dropped below 200 USD tCO2–1 before 2030. In the longer term, much larger potentials are projected, see Section 12.3.1. | ||||
Enhanced weathering | very small | |||||
Firstly, a brief overview of the process of data collection is presented, with a more detailed overview being found in Supplementary Material 12.SM.1.2. For the energy sector, the starting point for the determination of the emissions reduction potentials was the Emissions Gap Report (UNEP 2017), but new literature was also assessed, and a few studies that provide updated estimates of the mitigation potentials were included. It was found that higher mitigation potentials than in the UNEP report are now reported for solar and wind energy, but at the same time electricity production by solar and wind energy in the reference scenario has increased, compared to earlier versions of the World Energy Outlook. The net effect is a modest increase in the average value of the potential, and a wider uncertainty range. Costs of electricity-generating technologies are discussed in Section 6.4.7, with a summary of LCOEs from the literature being presented in Section 6.4.7. Mitigation costs of electricity production technology depend on local conditions and on the baseline technology being displaced, and it is difficult to determine the distribution over the cost ranges used in this assessment. However, it is possible to indicate a broad cost range for these technologies. These cost ranges are presented in Table 12.3. For onshore wind and utility-scale solar energy, there is strong evidence that despite regional differences in resource potential and cost, a large part of the mitigation potential can be found in the negative cost category or at cost parity with fossil fuel-based options. This is also the case for nuclear energy in some regions. Other technologies show mostly positive mitigation costs, the highest mitigation costs are for CCS and bioelectricity with CCS, for details see Supplementary Material 12.SM.1.2.
For the AFOLU sector, assessments of global net emissions reduction studies were provided in Table 7.3. The number of studies depends on the type of mitigation action, but ranges from five to nine. Each of these studies relies on a much larger number of underlying data sources. From these studies, emissions reduction ranges and best estimates were derived. The studies presented refer to different years in the period 2020 to 2050, and the mitigation potential presented for AFOLU primarily refers to the average over the period 2020 to 2050. However, because most of the activities involve storage of carbon in stocks that accumulate carbon, or conversely decay over time (e.g., forests, mangroves, peatland soils, agricultural soils, wood products), the 2020 to 2050 average provides a good approximation of the amount of permanent atmospheric CO2 mitigation that could be available at a given price in 2030. The exception is BECCS, which is in an early upscaling phase, so the potential estimated by Chapter 7 as an average for the 2020 to 2050 period is not included in Table 12.3. Note that for the energy sector a mitigation potential for BECCS is provided in Table 12.3.
The emissions reduction potentials for the buildings sector were based on the analysis by Chapter 9 authors of a large number of sectoral studies for individual countries or regions. In total, the chapter analysed the results of 67 studies that assess the potential of technological energy efficiency and onsite renewable energy production and use, and the results of 11 studies that assess the potential of sufficiency measures helping avoid demand for energy and materials. The sufficiency measures were included in models by reorganisation of human activities; efficient design, planning, and use of building space; higher density of building and settlement inhabitancy; redefining and downsizing goods and equipment, limiting their use to health, living, and working standards, and their sharing. Most of these studies targeted 2050 for the decarbonisation of buildings; the potentials in 2030 reported here rely on the estimates for 2030 provided by these studies or on the interpolated estimates targeting these 2050 figures. Based on these individual country studies, regional aggregate emissions reduction percentages were found. The potential estimates were assembled in the order sufficiency, efficiency, renewable options, correcting the amount of the potential at each step for the interaction with preceding measures. Note that the option ‘Enhanced use of wood products’ was analysed by Chapter 7, but is listed under the buildings sector in Table 12.3, as such enhanced use of wood takes place predominantly in the construction sector.
For the transport sector, Chapter 10 provided data on the emissions reduction potential for shipping. For the other transportation modes, additional sources were used to achieve a complete overview of emissions reduction potentials (for further details, see Supplementary Material 12.SM.1.2). A limited number of estimates for global emissions reduction potential is available: the total number of sources is about 10, and some estimates rely on just one source. The data have been coordinated with Chapter 10 authors.
For the industrial sector, global emissions reduction potentials per technology class per sector were derived by Chapter 11 authors, using primarily sectoral or technology-oriented literature. The analysis is based on about 75 studies, including sectoral assessments (Sections 11.4.1 and 11.4.2 and Figure 11.13).
For methane emissions reduction from oil and gas operations, coal mining, waste treatment and wastewater, an analysis was done, based on three major data sources in this area (Harmsen et al. 2019; US EPA 2019; Höglund-Isaksson et al. 2020); for oil and gas operations this was complemented by IEA (2021a). A similar analysis for reductions of emissions of fluorinated gases was carried out based on analysis by the same institutes (Purohit and Höglund-Isaksson 2017; Harmsen et al. 2019; US EPA 2019). Data for CDR options not discussed previously (such as DACCS and enhanced weathering) were taken from Section 12.3. For more details about data sources and data processing, see Supplementary Material 12.SM.1.2.
In Table 12.4 mitigation potentials for all gases are presented in GtCO2-eq. For most sectors the mitigation potentials (notably for methane emissions reductions from coal, oil and gas, waste and wastewater) have been converted to CO2-eq using global warming potential (GWP) values as presented in AR6 WGIII (Cross-Chapter Box 2 in Chapter 2). However, the underlying literature did not always accommodate this, in which cases older GWP values apply. Given the uncertainty ranges in the mitigation potentials in Table 12.3, the impact on the results of using different GWP values is considered to be very small.
Table 12.4 | Overview of aggregate sectoral net GHG emissions reduction potentials (GtCO2-eq) for the year 2030 at costs below USD100 tCO2-eq–1. Comparisons with earlier assessments are also provided. Note that sectors are not entirely comparable across the three different estimates.
Sector | Mitigation potentials at costs less than USD100 tCO2-eq–1 | ||||
AR6 best estimate | AR6 range | AR4 | UNEP2017 best estimate | range | |
Electricity sector | 11.0 | 7.9–12.5 | 6.2–9.3 | 10.3 | 9.5–11.0 |
Other energy sector (methane) | 1.6 | 1.1–2.1 | 2.2 | 1.7–2.6 | |
Agriculture | 4.1 | 1.7–6.7 | 2.3–6.4 | 4.8 | 3.6–6.0 |
Forestry and other land use-related options | 7.3 | 3.9–13.1 | 1.3–4.2 | 5.3 | 4.1–6.5 |
AFOLU demand-side options (estimates reflect direct mitigation from diverted agricultural production only, not including land-use effects) | 2.2 | 1.1–3.6 | 1.3–3.4 | ||
Buildings (potentials up to USD200tCO2-eq–1in parentheses) | Dir 0.7 (1.1) Ind 1.3 (2.1) Tot 2.0 (3.2) | 0.5–1.0 (0.7–1.5) 0.9–1.8 (1.5–3.1) 1.4–2.9 (2.3–4.6) | Dir 2.3–2.9 Ind 3.0–3.8 Tot 5.4–6.7 | Dir 1.9 Ind 4.0 Tot 5.9 | Dir 1.6–2.1 |
Transport | 3.8 | 1.9–5.7 | 1.6–2.5 | 4.7 | 4.1–5.3 |
Industry | Dir 5.4 | 4.0–6.7 | Dir 2.3–4.9 Ind 0.83 Tot 3.1–5.7 | Dir 3.9 Ind 1.9 Tot 5.8 | Dir 3.0–4.8 |
Fluorinated gases (all sectors) | 1.2 | 0.7–1.5 | NE | 1.5 | 1.2–1.8 |
Waste and wastewater | 0.7 | 0.6–0.8 | 0.4–1.0 | 0.4 | 0.3–0.5 |
Enhanced weathering | – | – | – | 1.0 | 0.7–1.2 |
Total of all sectors | 38 | 32–44 | 15.8–31.1 | 38 | 35–41 |
Note: Dir = reduction of direct emissions, Ind = reduction of indirect emissions (related to electricity production), Tot = reduction of total emissions, NE = not estimated, AR4: Table 11.3, UNEP-2017: Chapter 4.
For all options, uncertainty ranges of the mitigation potentials are given in Table 12.3. As far as possible, the ranges represent the variation in assessments found in the literature. This is the case for wind and solar energy, for the AFOLU options, for the methane mitigation options (coal, oil and gas, waste and wastewater) and for fluorinated gas mitigation. For the latter options, some variability exists for each cost bin, but aggregated over cost ranges the variation is much smaller, typically ±50%. For the buildings sector and the industrial sector options, the uncertainty in the mitigation potential is estimated by the lead authors of those chapters. For options for which only limited sources were available, an uncertainty range of ±50% was used. Overall, the uncertainty range per option is typically in the range of ±20% to ±60%.
Despite these uncertainties, clearly a number of options with high potentials can be identified, including solar energy, wind energy, reducing conversion of forests and other natural ecosystems, and restoration of forests and other natural ecosystems. As mid-range values, they each represent 4 to 7% of total reference emissions for 2030. Soil carbon sequestration in agriculture and fuel switching in industry can also be considered as options with high potential, although it should be noted that these options consist of a number of discernible sub-options, see Table 12.3. It can be observed that for each sector, a variety of options is available. Many of the smaller options each make up 1 to 2% of the reference emissions for 2030. Within this group of smaller options there are some categories that, summed together, stand out as substantial: the energy efficiency options and the methane mitigations options.
Costs are highly variable across the options. All sectors have several options for which at least part of the potential has mitigation costs below USD20 tCO2–1. The only exception is the industrial sector, in which only energy efficiency is available below this cost level. At the same time, a substantial part of the emissions reduction potential comes at higher cost, much being in the USD20 to 100 tCO2–1 cost ranges. All sectors have substantial additional potential in these cost ranges; only for transportation is this limited. Aggregation of the potentials per cost bin shows that the potential in these cost bins is marginally smaller than in the two cheapest cost bins. For some options, potential was identified in the 100 to 200 tCO2–1 cost bin. The mitigation potentials identified in this cost range make up only a small part of the total mitigation potential. It could be that there is limited potential in this range; however, a more plausible explanation, supported by several authors of sectoral chapters, is that this cost range is relatively unexplored.
In this assessment, the emphasis is on the specific mitigation costs of the various options, and these are often considered as an indicator to prioritise options. However, in such a prioritisation, other elements will also play a role, like the development of technology for the longer term (Section 12.2.4) and the need to optimise investments over longer time periods, see for example Vogt-Schilb et al. (2018) who argue that sometimes it makes sense to start with implementing the most expensive option.
In this section, an overview of emissions mitigation options for the year 2030 was presented. The overview of the mitigation potential is based on a variety of approaches, relying on a large number of sources, and the number of sources varied strongly from sector to sector. The main conclusions from this section are: (i) there is a variety of options per sector, (ii) per sector the options combined show significant mitigation potential, (iii) there are a few major options and a lot of smaller ones, and (iv) more than half of the potential comes at costs below USD20 tCO2–1 (between sectors: medium to robust evidence, high agreement ).
12.2.3Aggregation of Sectoral Results and Comparison with Earlier Analyses and Integrated Assessment Models
In this section, the mitigation potentials are aggregated per sector, and then to the global economy. These potentials, which are based on sectoral analysis, are then compared to the results from earlier assessments and the results from IAMs. Given the incompleteness of data on the mitigation potential at mitigation costs larger than USD100 tCO2–1, the focus will be on options with mitigation costs below USD100 tCO2–1.
As suggested previously, the overview presented in Table 12.3 should be interpreted with care, as the implementation of one option may affect the mitigation potential of another option. Most sectoral chapters have supplied mitigation potentials that were already adjusted for overlap and mutual influences (industry, buildings, AFOLU). For the energy sector, interactions between the options will occur, but parallel implementation of all the options seems to be possible; if all options at costs levels below USD100 tCO2–1 were implemented, this would lead to an additional power generation with no direct CO2 emissions of 41% of the total projected generation in 2030. This seems to be possible, but as higher penetrations are relatively unexplored, we apply a smaller uncertainty range at the high end. For the calculation of the aggregate potentials in the energy sector, error propagation rules were applied. For the transport sector, there will be interaction between the technical measures on the one hand and the modal shift measures on the other hand. Given the small mitigation contribution of the modal shift options, these interactions will be negligible. The resulting aggregate mitigation potentials and their uncertainty ranges per (sub)sector are given in Table 12.4 (columns indicated ‘AR6’). This overview confirms the large potentials per sector, even when taking the uncertainty ranges into account.
Calculating aggregated mitigation potentials for the global economy requires that interactions between sectors also need to be taken into account (Section 12.6). First of all, there may be overlap between the electricity supply sector and the electricity demand sectors: if the electricity sector is extensively decarbonised, the avoided emissions due to electricity efficiency measures and local electricity production will be significantly reduced. Therefore, this demand-side mitigation potential is only taken into account for 25% (reflecting the degree of further decarbonisation of the power sector) in the cross-sectoral aggregation. For the other demand sectors, this problem does not arise. The industry sector did not provide estimates for electricity efficiency improvement and in the transport sector the utilisation of electricity to date is very low. Electrification options may occur in all sectors, but this enhances the mitigation potential in combination with a decreased carbon intensity of the power sector. For other energy sector options, such as methane emissions reduction from coal, oil and natural gas operations, the situation is more complex. The total emissions reduction potential for fossil fuels in the other sectors is high. Should this potential be realised, this would lead to a reduction of the potential reported here. However, reducing fossil fuel use also leads to a reduction in the upstream CH4 (methane) emissions, so in the case of reducing fossil fuel use, these upstream emissions will also be avoided, so no overestimate of the aggregate emissions reduction potential occurs.
The total potential, given these corrections for overlap, leads to a mid-range value for the total mitigation potential at costs below USD100 tCO2-eq –1 of 38 GtCO2-eq. Given the fact that it is not to be expected that mitigation potentials of the various sectors are mutually correlated, that is, it is not to be expected that mitigation potentials are all on the high side or all on the low side, the ranges are aggregated using error propagation rules, which leads to a range for the mitigation potential of 32 to 44 GtCO2-eq.
Mitigation costs and potentials for 2030 have been presented previously, notably in AR4 Chapter 11 on Mitigation from a Cross-sectoral Perspective (Barker et al. 2007) and the Emissions Gap Report (UNEP 2017). Note that AR5 did not provide emissions reduction potentials in this form. The aggregated potentials reported here are higher than those estimated in AR4. Note, however, that AR4 suggested the potentials were underestimated by 10 to 15%, but a higher potential still remains in the current assessment. In a sector-by-sector comparison, higher potentials than in AR4 can be observed especially for the energy sector and the forestry sector, and to a more limited extent for the industry sector and the transport sector. For the energy sector, the change can largely be explained by the higher estimates for wind and solar energy and the improved understanding of how to integrate high shares of intermittent renewable energy sources into power systems. For industry and transport, the higher potentials can be partly explained by the inclusion of more options, like recycling and material efficiency (for industry) and electric transportation and modal shifts for transport. For buildings, a lower potential can be observed compared to AR4, one reason is that the 2030 reference direct and indirect emissions were estimated as 45% and 11% higher in AR4 than they were in AR6 (signalling a much quicker actual switch to electricity than was thought 15 to 20 years ago, among other reasons). The other reason for a difference is that the scenarios considered in AR4 had 25 to 30 years between their start year until the target year of 2030 and the scenarios reviewed in AR6 have only 10 to 15 years before 2030. The current retrofitting rates of existing buildings and penetration rates of nearly zero-energy buildings do not allow for decarbonisation of the sector over 10 to 15 years, but they do over a longer time period. A much larger potential than reported here for 2030 can still be realised in the timeframe up to 2050 (Section 9.6.2).
Another global analysis was done by McKinsey (2009), which presents a marginal abatement cost curve for 2030, suggesting a total potential of 38 GtCO2-eq (note that the reference for that study is 70 GtCO2-eq, which is at the high end of the reference range used in this assessment).
The potentials reported here are comparable with UNEP (2017). Note that material for the energy sector from the UNEP report was partly reused in this analysis. Furthermore, some options for the transport sector (aviation and biofuels) were identical to the estimates in the UNEP report. The remaining mitigation potentials are all based on new – and much more extended – assessment. There are some notable changes. The AR6 mitigation potential for forestry is substantially larger. For buildings the potential is smaller, mainly related to the smaller mitigation potential for electric appliances than in the UNEP report. But overall, the estimates of the total mitigation potential are well aligned, which confirms there is substantial consistency across various emissions reduction estimates.
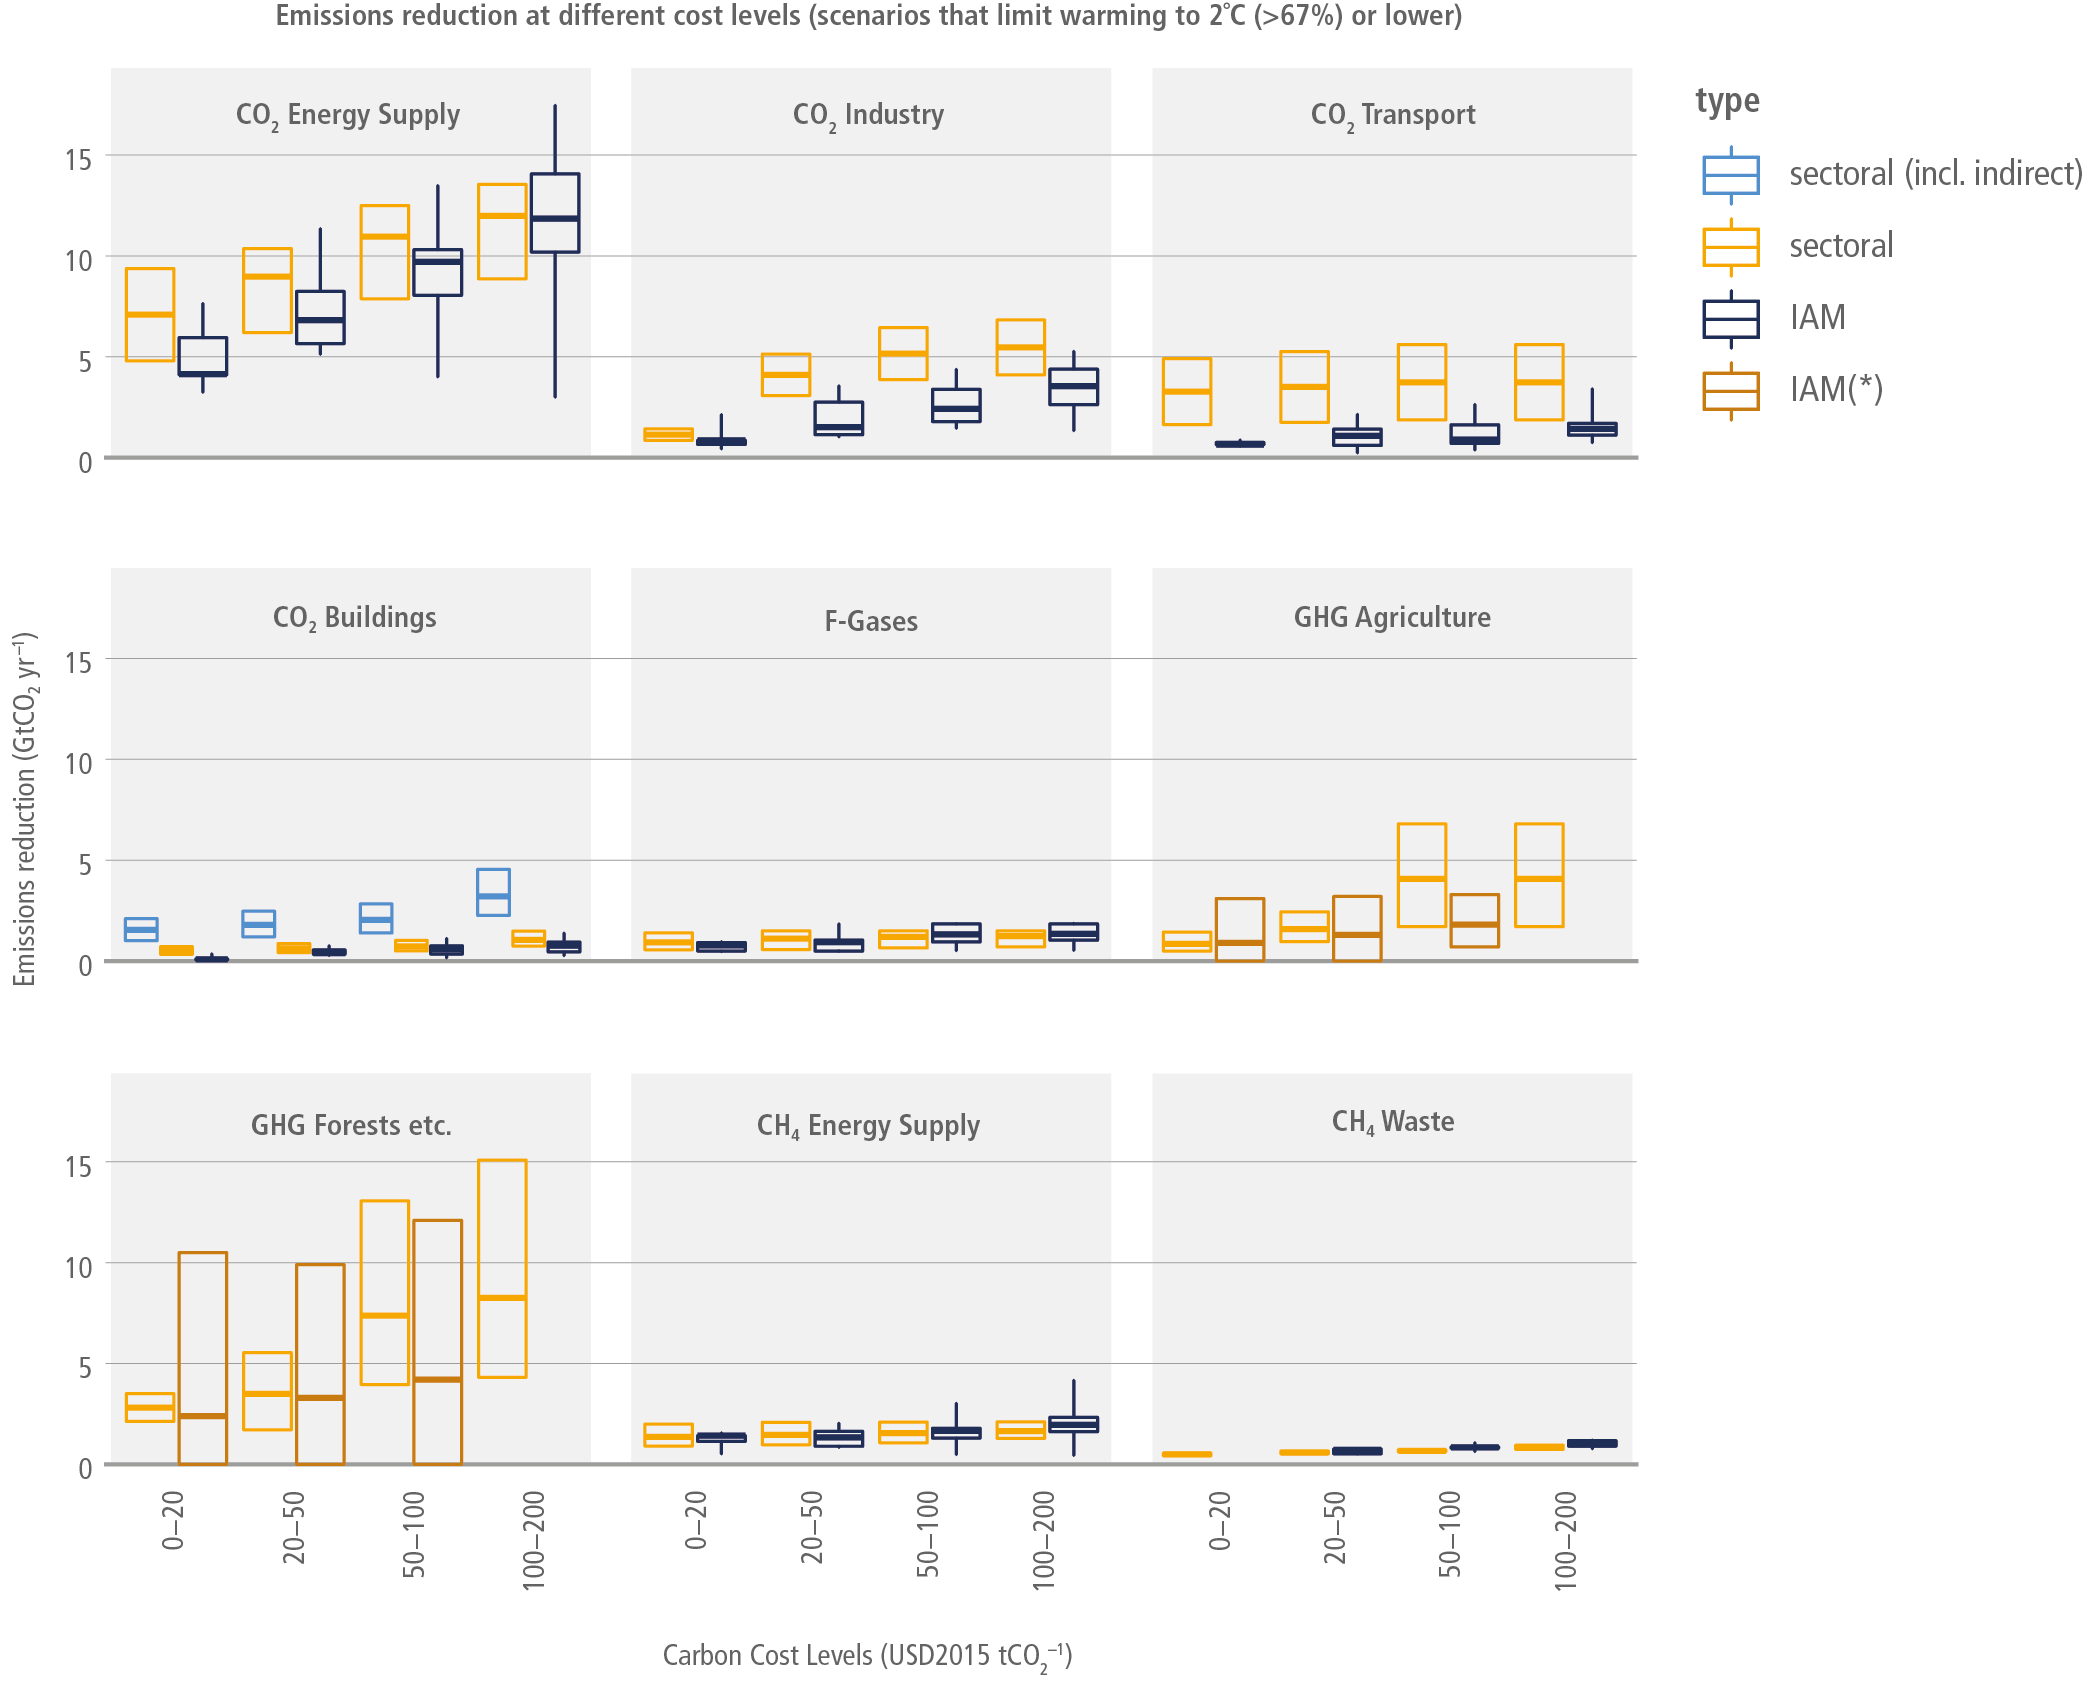
The results of the sectoral mitigation potentials are also compared with mitigation impacts as calculated by IAMs. To this end, cumulative sectoral potentials over cost ranges were determined, based on the information in Table 12.3. For options that are in various cost ranges, we assumed that they are evenly distributed over these cost ranges. The only exception is wind and solar energy, for which it is indicated that the majority of the mitigation potential is in the negative cost range. It was assumed that the fraction in the negative cost range was 60%; the remainder is evenly distributed over the other cost ranges. These cumulative potentials were compared with emissions reductions realised in IAMs at certain price levels for CO2. Note that these price levels selected in IAMs are average price levels – not all IAMs use globally uniform carbon prices, so underlying these cost levels, there may be regional differentiation. Data were taken from the AR6 scenarios database. Note that, strictly speaking, not all models in the database are IAMs; in this analysis all models in the database were used, but the term IAMs is used as shorthand in the text that follows. All scenarios that limit warming to 2°C (>67%) or lower are included for the comparison (i.e., the categories of scenarios C1 to C3 in Chapter 3). A comparison per sector is provided in Figure 12.1. It is important to note that two different things are compared in this figure: on the one hand emissions reduction potentials and on the other hand realisations of (part of) the potential within the context of a certain scenario. Having said that, a number of lessons can be learned from the comparison of both.

Figure 12.1 | Comparison of sectoral estimates for emissions reduction potential with the emissions reductions calculated using IAMs. Emission reductions calculated using IAMs are given as box plots of global emissions reductions for each sector (dark blue and brown) at different global carbon cost levels (horizontal axis) for 2030, based on all scenarios that limit warming to 2°C (>67%) or lower (see Chapter 3) in the AR6 scenarios database (IIASA 2021). For IAMs, the cost levels correspond to the levels of the carbon price. Hinges in the dark blue box plots represent the interquartile ranges and whiskers extend to 5th and 95th percentiles while the hinges in the brown box plots describe the full range, and the middle point indicates the mean, not the median. In yellow, the estimates from the sectoral analysis are given. In all cases, only direct emissions reductions are presented, except for the light-blue boxes (for buildings), which include indirect emissions reductions. The light-blue boxes are only given for reasons of completeness. For buildings the dark-blue boxes should be compared with the yellow boxes. Light-blue and yellow boxes represent the full ranges of estimates. For IAMs, global carbon prices are applied, which are subject to significant uncertainty.
For the energy supply sector, the emissions reductions projected by the IAMs are for the higher cost levels comparable with the potentials found in the sectoral analysis. But at lower cost levels, the emissions reductions as projected by IAMs are smaller than for the sectoral analysis. This is likely due to the fact that high costs for solar energy and wind energy are assumed in IAM models (Krey et al. 2019; Shiraki and Sugiyama 2020). This is not surprising, as the scenario database comprises studies dating back to 2015. A more detailed comparison for the power sector is given in Figure 12.2. Both the sectoral analysis and the IAMs find that both solar and wind energy in particular show strong growth potential, although there is a continuing role for other low-carbon technologies, like nuclear energy and hydropower.
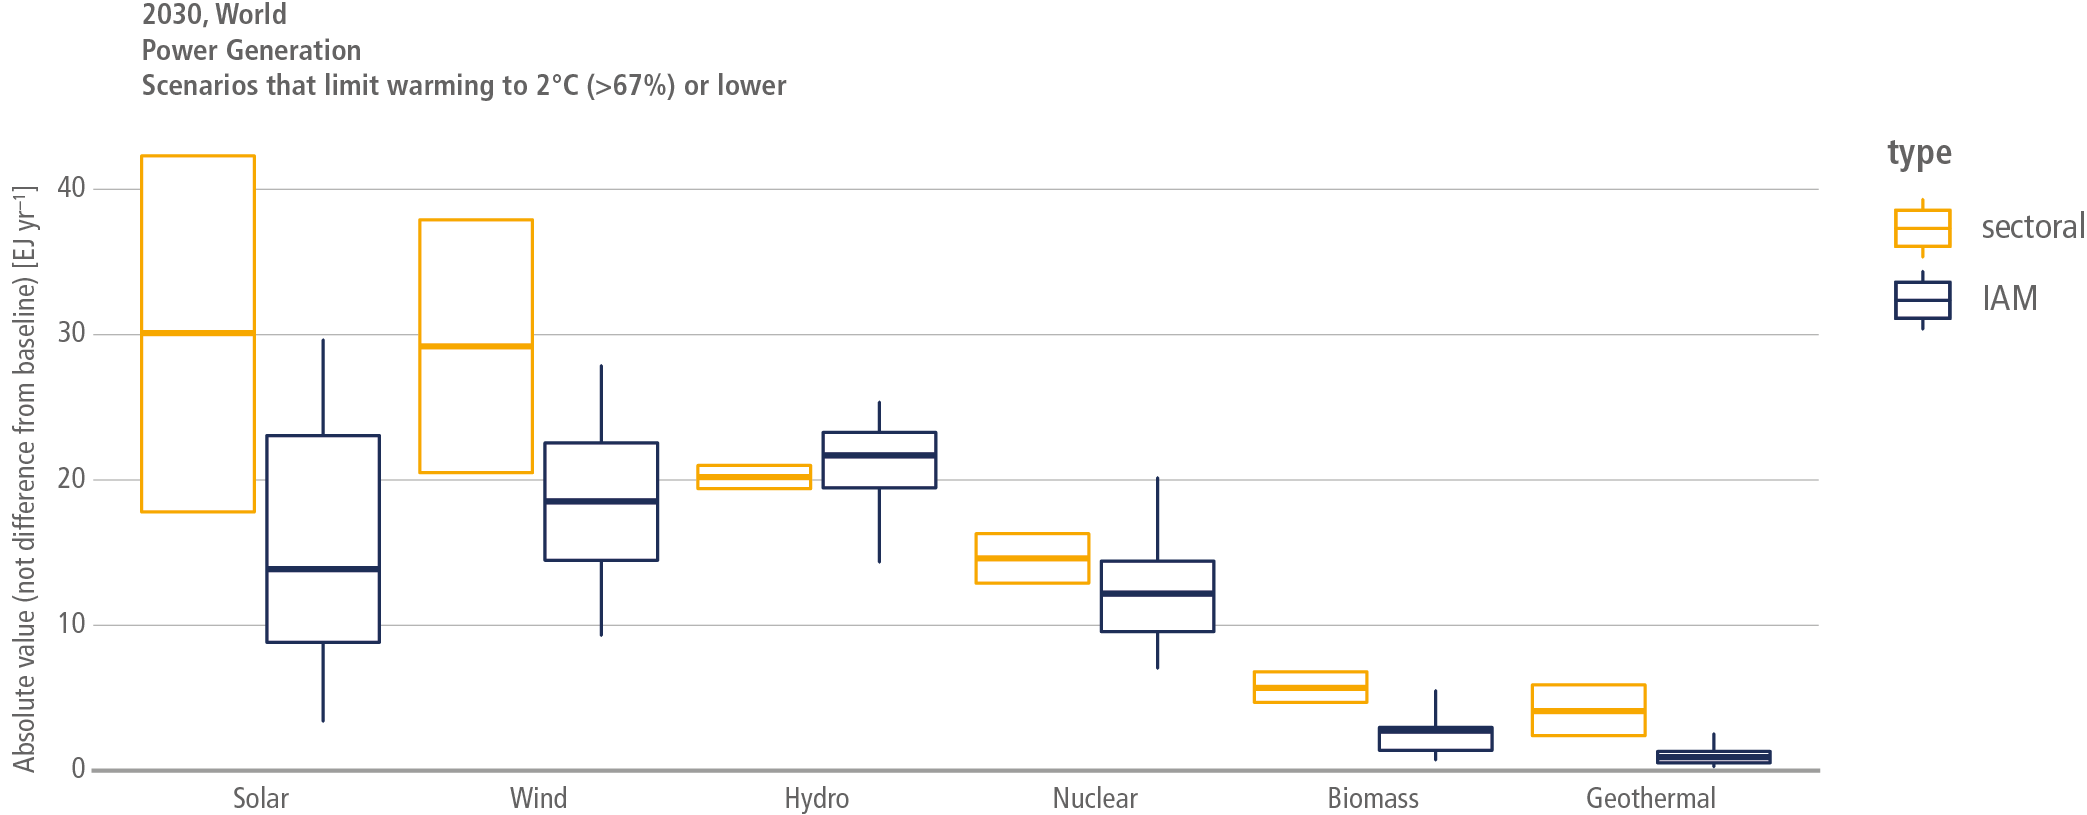
Figure 12.2 | Electricity production in 2030 as calculated by IAMs (dark blue), compared with electricity production potentials found in the sectoral analysis (yellow). Cost cut-offs at USD100 tCO2–1 are applied to both electricity production in 2030 as calculated by IAMs and electricity production potentials found in the sectoral analyses. Hinges in the dark-blue box plots represent the interquartile ranges and whiskers extend to the 5th and 95th percentiles, while the hinges in the yellow box plots describe the full range.
For the AFOLU sector, the sectoral studies provide net emissions reduction potentials comparable with projections from the IAMs at costs levels up to USD50 tCO2-eq –1. However, beyond that level the mitigation potential found in the sectoral analysis is larger than in the IAMs. For agriculture, it can be explained by the fact that carbon sequestration options, like soil carbon, biochar and agroforestry, have little to no representation in IAMs. Similarly, for forestry and other land use-related options, the protection and restoration of other ecosystems than forests (peatland, coastal wetlands and savannas) are not represented in IAMs. Also note that some IAM baselines already have small carbon prices, which induce land-based mitigation, while in others, mitigation, particularly from reduced deforestation, is part of the storyline even without an implemented carbon price. Both of these effects dampen the mitigation potential available in the USD100 tCO2-eq –1 carbon price scenario from IAMs. Furthermore, estimates of mitigation through forestry and other land use-related options from the AR6 IAM scenario database represent the net emissions from A/R and deforestation, thus are likely to be lower than the sectoral estimates of A/R potential expressed as gross removals.
For the buildings and transport sectors, the sectoral mitigation potentials are higher than those projected by the IAMs. The difference in the transport sector is particularly significant. One possible explanation is that options with negative costs are already included in the reference. In addition, some options, like avoiding demand for energy services in the building sector and model shift in transportation, are less well represented in IAMs.
For the industry sector, the sectoral emissions reduction potentials are somewhat higher than those reported on average by IAMs. The difference can well be explained by the fact that most IAMs do not include circularity options like material efficiency and recycling; these options together account for 1.5 GtCO2-eq at costs levels from USD20 tCO2-eq –1 onwards.
For mitigation of emissions of methane and fluorinated gases, the comparability between the sectoral results and IAMs is good.
Overall, it is concluded that there are differences between the sectoral analyses and the IAM outcomes, but most of the differences can be explained by the exclusion of specific options in most IAMs. This comparability confirms the reliability of the sectoral analysis of emissions reduction potential. It also demonstrates the added value of sectoral analyses of mitigation potentials: they can more rapidly adapt to changes in price levels of technologies and adopt new options for emissions mitigation.
In this section, the information on individual options reported in Section 12.2.2 to sectoral and economy-wide totals has been aggregated. It is concluded that, based on the sectoral analysis, the global mitigation potential is in the range of 32 to 44 GtCO2-eq. This mitigation potential is substantially higher than that reported in AR4, but it is comparable to the more recent estimate by UNEP (2017). Differences exist with the results of IAMs, but most of these can be well explained. The conclusion that the global potential is in this range can be drawn with high agreement and robust evidence.
Given the median projection of the reference emissions of 60 GtCO2-eq in 2030, the range of mitigation potentials presented here is sufficient to bring down global emissions in the year 2030 to a level of 16 to 28 GtCO2-eq. Taking into account that there is a range in reference projections for 2030 of 54 to 68 GtCO2-eq, the resulting emissions level shows a wider range: 12 to 31 GtCO2-eq. This is about, or below half, the most recent (2019) emissions value of 59 ± 6.6 GtCO2-eq (high confidence).
12.2.4 Sectoral Findings on Emission Pathways until 2050
As noted previously, a more qualitative approach is followed and less quantitative information is presented for 2050. The sectoral results are summarised in Table 12.5. In addition to the many technologies that already play a role by 2030 (Table 12.3) additional technologies may be needed for deep decarbonisation, for example for managing power systems with high shares of intermittent renewable sources and for providing new fuels and associated infrastructure for sectors that are hard to decarbonise. New processes also play an important role, notably for industrial processes. In general, stronger sector coupling is needed, particularly increased integration of energy end use and supply sectors.
Table 12.5 | Mitigation options and their characteristics for 2050.
Sector | Major options | Degree to which net zero-GHG is possible |
Energy sector. | Range of supply-side options possible (see 2030 overview). Increased share of electricity in final energy use. Potentially important role for hydrogen, ammonia, etc. | Zero CO2 energy system is possible. |
Agriculture, forestry and other land use (AFOLU). | Options comparable to those in 2030. Permanence is important. | Some hard-to-abate activities will still have positive emissions, but for the sector as a whole, net negative emissions are possible through carbon sequestration in agriculture and forestry. |
Buildings. | Sufficiency, high performance new and existing buildings with efficient heating, ventilation, and air conditioning, especially heat pumps, building management and operation, efficient appliances, and onsite renewables backed up with demand flexibility and digitalisation measures. | At least 8.2 GtCO2 or 61% reduction, as compared to the baseline is possible with options on the demand side. This is a low estimate, because in some developing regions literature is not sufficient to derive a comprehensive estimate. Nearly net zero CO2 emissions is possible if grid electricity will also be decarbonised. Carbon storage in buildings provides CDR. |
Transport. | Electrification can become a major option for many transport modes. For long-haul trucking, ships and aviation, in addition biofuels, hydrogen and potentially synthetic fuels can be applied. | To a large extent if the electricity sector is fully decarbonised and the deployment of alternative fuels for long-haul trucking, aviation and shipping is successful. |
Industry. | Stronger role for material efficiency and recycling. Full decarbonisation through new processes; CCS, CCU and hydrogen can become dominant. | Approx. 85% reduction is possible. Net zero CO2 emissions is possible with retrofitting and early retirement. |
Cross-sectoral. | Direct air carbon capture and storage. Enhanced weathering. Ocean-based methods. | Contributes CDR to support net zero GHG by counterbalancing sectoral emissions. |
12.3Carbon Dioxide Removal
Carbon dioxide removal (CDR) refers to a cluster of technologies, practices, and approaches that remove and sequester carbon dioxide from the atmosphere and durably store the carbon in geological, terrestrial, or ocean reservoirs, or in products. Despite the common feature of removing carbon dioxide, CDR methods can be very different (Smith et al. 2017). There are proposed methods for removal of non-CO2 greenhouse gases such as methane (Jackson et al. 2019; Jackson et al. 2021) but scarcity of literature on these methods prevents assessment here.
A number of CDR methods (e.g., afforestation/reforestation (A/R), bioenergy with carbon capture and storage (BECCS), soil carbon sequestration (SCS), biochar, wetland/peatland restoration and coastal restoration) are dealt with elsewhere in this report (Chapters 6 and 7). These methods are synthesised in Section 12.3.2. Others, not dealt with elsewhere, – direct air carbon capture and storage (DACCS), enhanced weathering (EW) of minerals and ocean-based approaches including ocean fertilisation (OF) and ocean alkalinity enhancement (OAE) – are discussed in Sections 12.3.1.1 to 12.3.1.3 below (see also IPCC 2019b and AR6 WGI, Section 5.6). Some methods, such as BECCS and DACCS, involve carbon storage in geological formations, which is discussed in Chapter 6. The climate system and the carbon cycle responses to CDR deployment and each method’s physical and biogeochemical characteristics such as storage form and duration are assessed in Chapters 4 and 5 of the AR6 WGI report.
Cross-Chapter Box 8 | Carbon Dioxide Removal: Key Characteristics and Multiple Roles in Mitigation Strategies
Authors: Oliver Geden (Germany), Alaa Al Khourdajie (United Kingdom/Syria), Christopher Bataille (Canada), Göran Berndes (Sweden), Holly Jean Buck (the United States of America), Katherine Calvin (the United States of America), Annette Cowie (Australia), Kiane de Kleijne (the Netherlands), Jan Christoph Minx (Germany), Gert-Jan Nabuurs (the Netherlands), Glen P. Peters (Norway/Australia), Andy Reisinger (New Zealand), Pete Smith (United Kingdom), Masahiro Sugiyama (Japan)
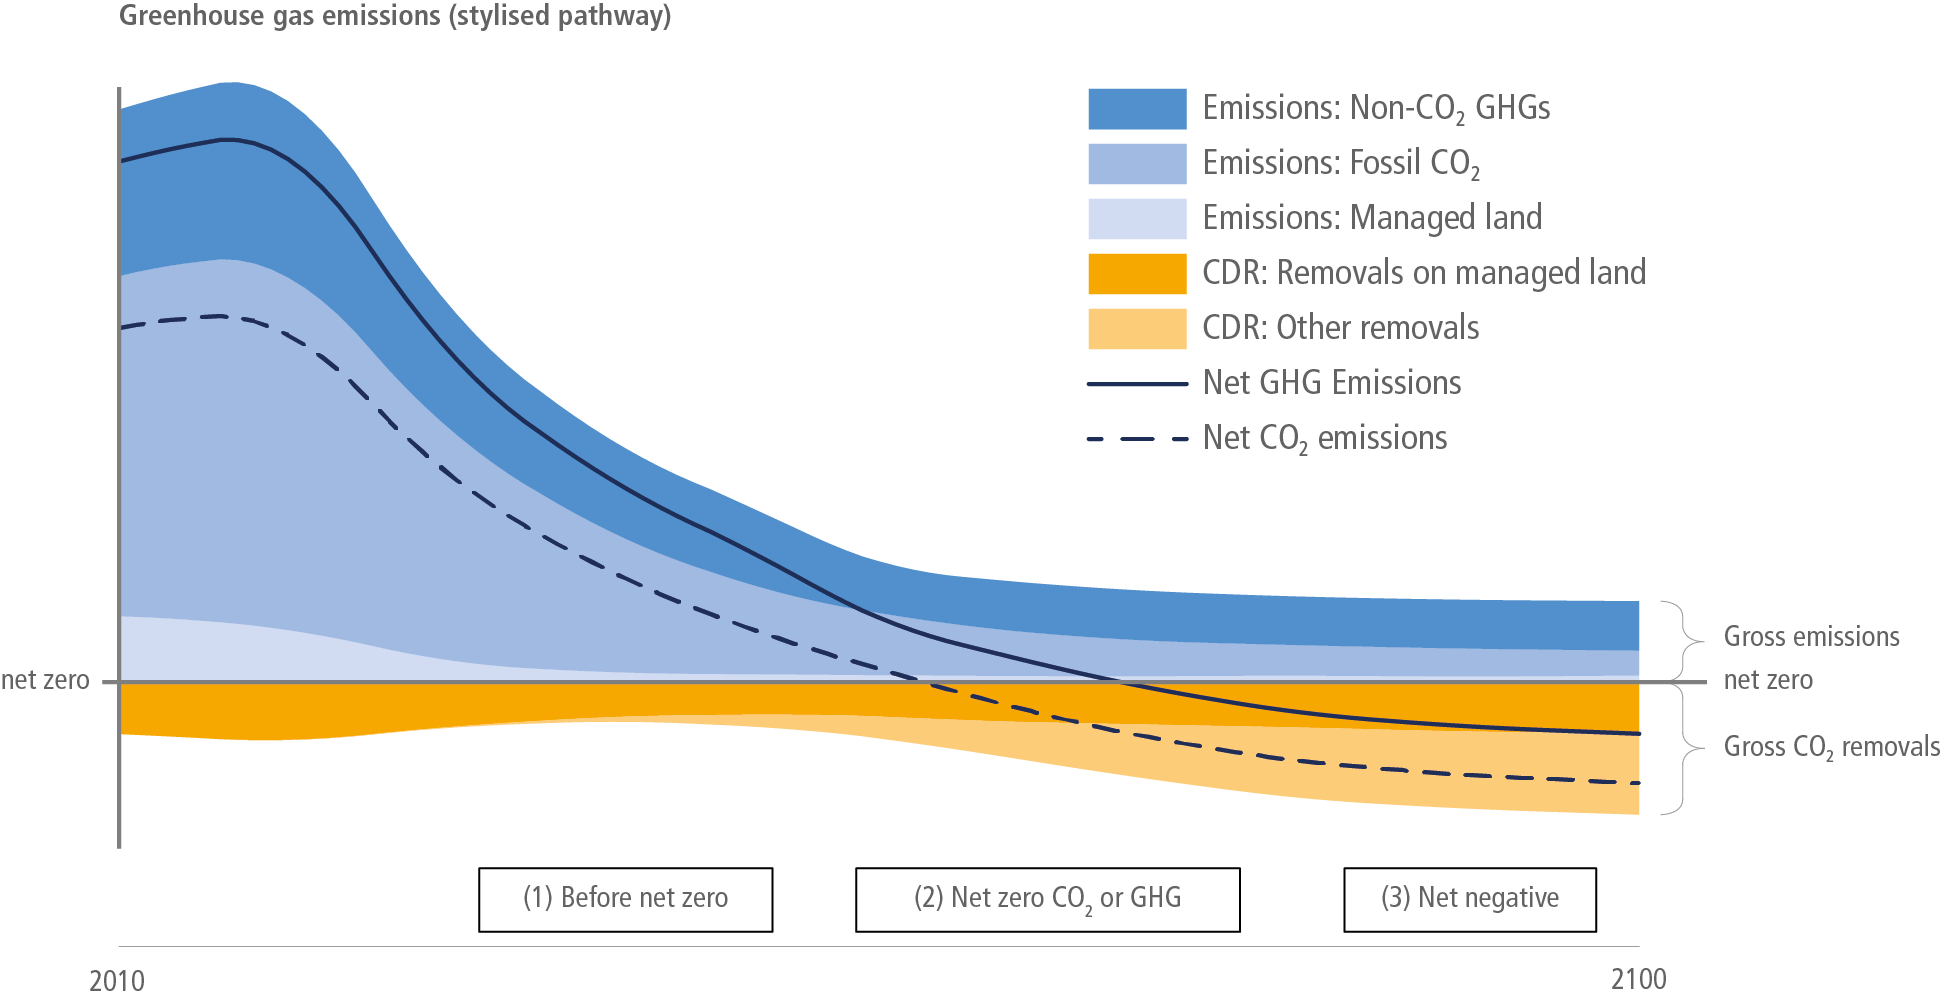
Carbon dioxide removal (CDR) is a necessary element of mitigation portfolios to achieve net zero CO2 and GHG emissions both globally and nationally, counterbalancing residual emissions from hard-to-transition sectors such as industry, transport and agriculture. CDR is a key element in scenarios that limit warming to 2°C (>67%) or lower, regardless of whether global emissions reach near-zero, net zero or net-negative levels (Sections 3.3, 3.4, 3.5 and 12.3). While national mitigation portfolios aiming at net zero or net-negative emissions will need to include some level of CDR, the choice of methods and the scale and timing of their deployment will depend on the ambition for gross emissions reductions, how sustainability and feasibility constraints are managed, and how political preferences and social acceptability evolve (Section 12.3.3). This box gives an overview of CDR methods, presents a categorisation based on the key characteristics of removal processes and storage timescales, and clarifies the multiple roles of CDR in mitigation strategies. The term ‘negative emissions’ is used in this report only when referring to the net emissions outcome at a systems level (e.g., ‘net negative emissions’ at global, national, sectoral or supply chain levels).
Categorisation of the main CDR methods
CDR refers to anthropogenic activities that remove CO2 from the atmosphere and store it durably in geological, terrestrial, or ocean reservoirs, or in products. It includes anthropogenic enhancement of biological, geochemical or chemical CO2 sinks, but excludes natural CO2 uptake not directly caused by human activities. Increases in land carbon sink strength due to CO2 fertilisation or other indirect effects of human activities are not considered CDR (see Glossary). Carbon capture and storage (CCS) and carbon capture and utilisation (CCU) applied to CO2 from fossil fuel use are not CDR methods as they do not remove CO2 from the atmosphere. CCS and CCU can, however, be part of CDR methods if the CO2 has been captured from the atmosphere, either indirectly in the form of biomass or directly from ambient air, and stored durably in geological reservoirs or products (Sections 11.3.6 and 12.3).
There are many different CDR methods and associated implementation options (Cross-Chapter Box 8, Figure 1). Some of these methods (including afforestation and improved forest management, wetland restoration and soil carbon sequestration (SCS)) have been practised for decades to millennia, although not necessarily with the intention of removing carbon from the atmosphere. Conversely, methods such as direct air carbon capture and storage (DACCS), bioenergy with carbon capture and storage (BECCS) and enhanced weathering are novel, and while experience is growing, their demonstration and deployment are limited in scale. CDR methods have been categorised in different ways in the literature, highlighting different characteristics. In this report, as in AR6 WGI, the categorisation is based on the role of CDR methods in the carbon cycle, that is, on the removal process (land-based biological; ocean-based biological; geochemical; chemical) and on the timescale of storage (decades to centuries; centuries to millennia; ten thousand years or longer). The time scale of storage is closely linked to the storage medium: carbon stored in ocean reservoirs (through enhanced weathering, ocean alkalinity enhancement or ocean fertilisation) and in geological formations (through BECCS or DACCS) generally has longer storage times and is less vulnerable to reversal through human actions or disturbances such as drought and wildfire than carbon stored in terrestrial reservoirs (vegetation, soil). Furthermore, carbon stored in vegetation or through SCS has shorter storage times and is more vulnerable than carbon stored in buildings as wood products; as biochar in soils, cement and other materials; or in chemical products made from biomass or potentially through direct air (Fuss et al. 2018; Minx et al. 2018; NASEM 2019) capture (Section 11.3.6; AR6 WGI, Figure 5.36). Within the same category (e.g., land-based biological CDR) options often differ with respect to other dynamic or context-specific dimensions, such as mitigation potential, cost, potential for co-benefits and adverse side effects, and technology readiness level (Table 12.6).
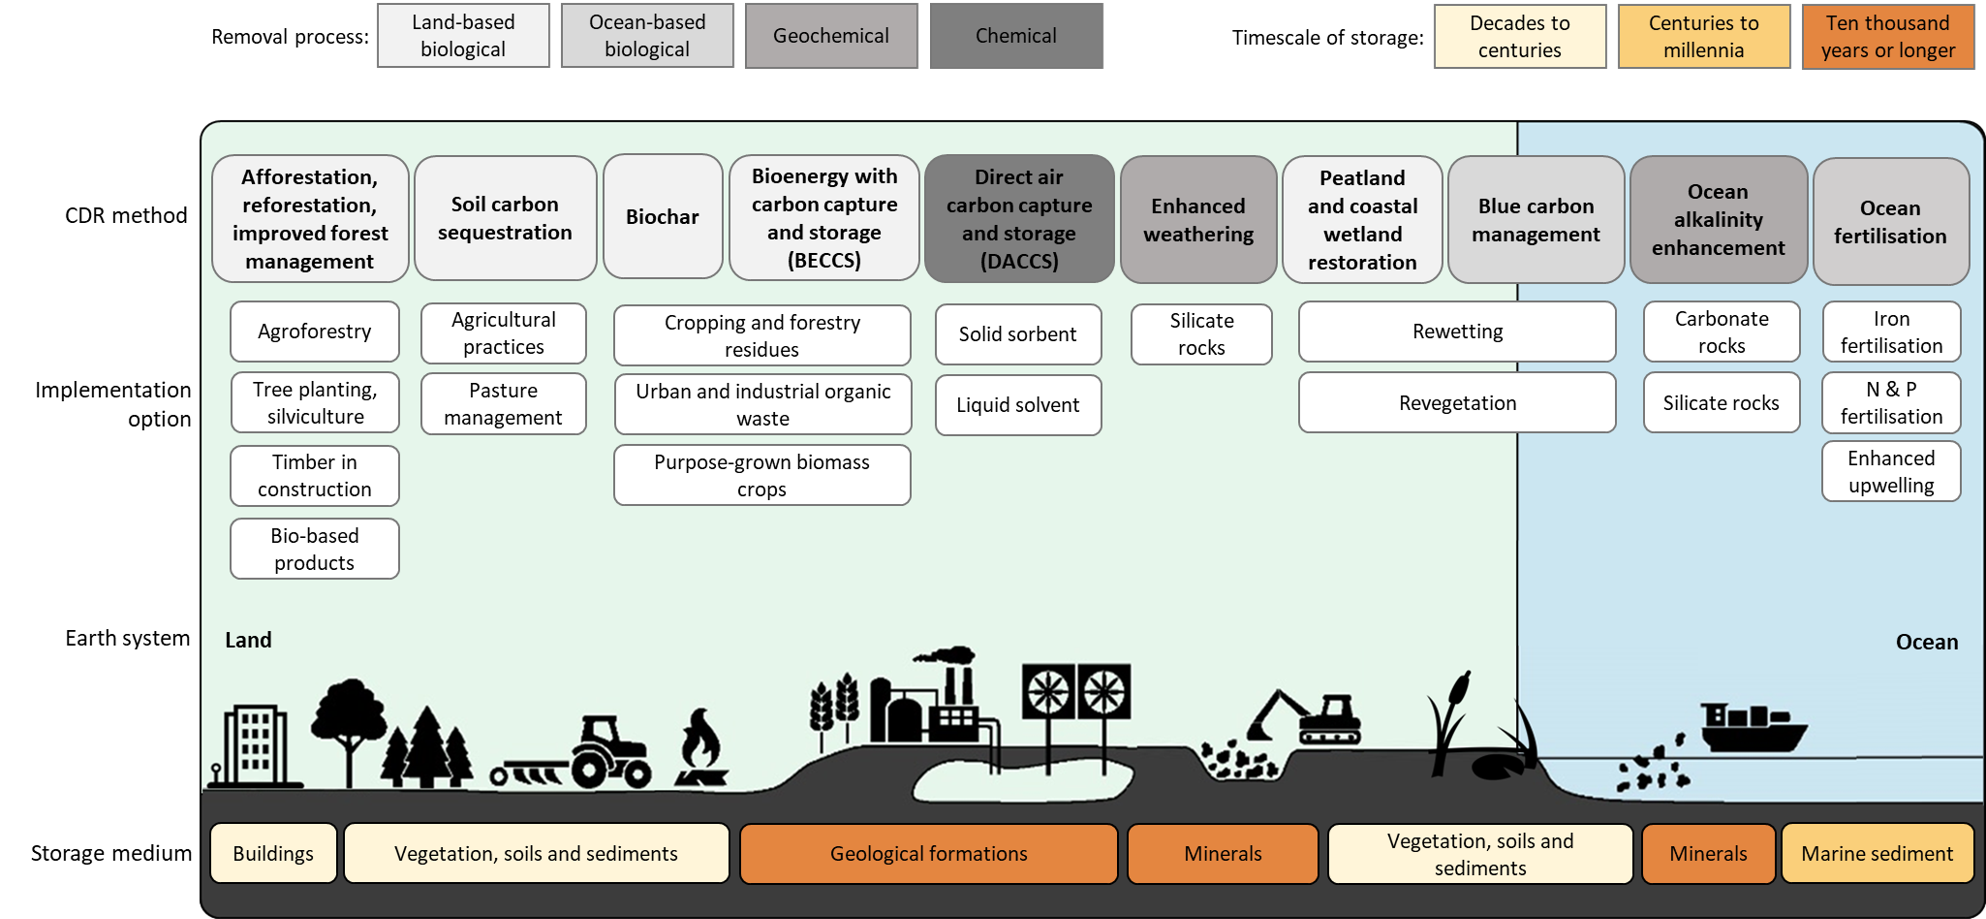
Cross-Chapter Box 8, Figure 1 | Carbon dioxide removal taxonomy. Methods are categorised based on removal process (grey shades) and storage medium (for which timescales of storage are given, yellow/brown shades). Main implementation options are included for each CDR method. Note that specific land-based implementation options can be associated with several CDR methods, for example, agroforestry can support soil carbon sequestration and provide biomass for biochar or BECCS. Source: adapted from Minx et al. (2018).
Roles of CDR in mitigation strategies
Within ambitious mitigation strategies at global or national levels, CDR cannot serve as a substitute for deep emissions reductions but can fulfil multiple complementary roles: it can (i) further reduce net CO2 or GHG emission levels in the near-term; (ii) counterbalance residual emissions from hard-to-transition sectors, such as CO2 from industrial activities and long-distance transport (e.g., aviation, shipping), or methane and nitrous oxide from agriculture, in order to help reach net zero CO2 or GHG emissions in the mid-term; (iii) achieve and sustain net-negative CO2 or GHG emissions in the long-term, by deploying CDR at levels exceeding annual residual gross CO2 or GHG emissions (Sections 2.7.3 and 3.5).
In general, these roles of CDR are not mutually exclusive and can exist in parallel. For example, achieving net zero CO2 or GHG emissions globally might involve some countries already reaching net-negative levels at the time of global net zero, allowing other countries more time to achieve this. Equally, achieving net-negative CO2 emissions globally, which could address a potential temperature overshoot by lowering atmospheric CO2 concentrations, does not necessarily involve all countries reaching net-negative levels (Rajamani et al. 2021; Rogelj et al. 2021) (Cross-Chapter Box 3 in Chapter 3).
Cross-Chapter Box 8, Figure 2 shows these multiple roles of CDR in a stylised ambitious mitigation pathway that can be applied to global and national levels. While such mitigation pathways will differ in their shape and exact composition, they include the same basic components: CO2 emissions from fossil sources, CO2 emissions from managed land, non-CO2 emissions, and various forms of CDR. Cross-Chapter Box 8, Figure 2 also illustrates the importance of distinguishing between gross CO2 removals from the atmosphere through deployment of CDR methods and the net emissions outcome (i.e., gross emissions minus gross removals).

Cross-Chapter Box 8, Figure 2 | Roles of CDR in global or national mitigation strategies. Stylised pathway showing multiple functions of CDR in different phases of ambitious mitigation: (1) further reducing net CO2 or GHG emissions levels in near-term; (2) counterbalancing residual emissions to help reach net zero CO2 or GHG emissions in the mid-term; (3) achieving and sustaining net-negative CO2 or GHG emissions in the long-term.
CDR methods currently deployed on managed land, such as afforestation or reforestation and improved forest management, lead to CO2 removals already today, even when net emissions from land use are still positive, for example, when gross emissions from deforestation and draining peatlands exceed gross removals from afforestation or reforestation and ecosystem conservation (Sections 2.2 and 7.2; Cross-Chapter Box 6 in Chapter 7). As there are currently no removal methods for non-CO2 gases that have progressed beyond conceptual discussions (Jackson et al. 2021), achieving net zero GHG implies gross CO2 removals to counterbalance residual emissions of both CO2 and non-CO2 gases, applying 100-year global warming potential (GWP100) as the metric for reporting CO2-equivalent emissions, as required for emissions reporting under the Rulebook of the Paris Agreement (Cross-Chapter Box 2 in Chapter 2).
Net zero CO2 emissions will be achieved earlier than net zero GHG emissions. As volumes of residual non-CO2 emissions are expected to be significant, this time-lag could reach one to several decades, depending on the respective size and composition of residual GHG emissions at the time of net zero CO2 emissions. Furthermore, counterbalancing residual non-CO2 emissions by CO2 removals will lead to net-negative CO2 emissions at the time of net zero GHG emissions (Cross-Chapter Box 3 in Chapter 3).
While many governments have included A/R and other forestry measures in their NDCs under the Paris Agreement (Moe and Røttereng 2018; Fyson and Jeffery 2019; Mace et al. 2021), and a few countries also mention BECCS, DACCS and enhanced weathering in their mid-century low emission development strategies (Buylova et al. 2021), very few are pursuing the integration of a broad range of CDR methods into national mitigation portfolios so far (Schenuit et al. 2021) (Box 12.1). There are concerns that the prospect of large-scale CDR could, depending on the design of mitigation strategies, obstruct near-term emissions reduction efforts (Lenzi et al. 2018; Markusson et al. 2018), mask insufficient policy interventions (Geden 2016; Carton 2019), might lead to an overreliance on technologies that are still in their infancy (Anderson and Peters 2016; Larkin et al. 2018; Grant et al. 2021), could overburden future generations (Lenzi 2018; Shue 2018; Bednar et al. 2019) might evoke new conflicts over equitable burden-sharing (Pozo et al. 2020; Lee et al. 2021; Mohan et al. 2021), could impact food security, biodiversity or land rights (Buck 2016; Boysen et al. 2017; Dooley and Kartha 2018; Hurlbert et al. 2019; Dooley et al. 2021), or might be perceived negatively by stakeholders and broader public audiences (Royal Society and Royal Academy of Engineering 2018; Colvin et al. 2020). Conversely, without considering different timescales of carbon storage (Fuss et al. 2018; Hepburn et al. 2019) and implementation of reliable measurement, reporting and verification of carbon flows (Mace et al. 2021), CDR deployment might not deliver the intended benefit of removing CO2 durably from the atmosphere. Furthermore, without appropriate incentive schemes and market designs (Honegger et al. 2021b), CDR implementation options could see under-investment. The many challenges in research, development and demonstration of novel approaches, to advance innovation according to broader societal objectives and to bring down costs, could delay their scaling up and deployment (Nemet et al. 2018). Depending on the scale and deployment scenario, CDR methods could bring about various co-benefits and adverse side effects (see below). All this highlights the need for appropriate CDR governance and policies (Section 12.3.3).
The volumes of future global CDR deployment assumed in IAM-based mitigation scenarios are large compared to current volumes of deployment, which presents a challenge since rapid and sustained upscaling from a small base is particularly difficult (de Coninck et al. 2018; Nemet et al. 2018; Hanna et al. 2021). All Illustrative Mitigation Pathways (IMPs) that limit warming to 2°C (>67%) or lower use some form of CDR. Across the full range of similarly ambitious IAM scenarios (scenario categories C1 to C3; see Section 3.3), the reported annual CO2 removal from AFOLU (mainly A/R) reaches 0.86 [0.01–4.11] GtCO2 yr –1 by 2030, 2.98 [0.23–6.38] GtCO2 yr –1 by 2050, and 4.19 [0.1–6.91] GtCO2 yr –1 by 2100 (values are the medians and bracketed values denote the 5–95th percentile range 1 ). The annual BECCS deployment is 0.08 [0–1.09] GtCO2 yr –1, 2.75 [0.52–9.45] GtCO2 yr –1, and 8.96 [2.63–16.15] GtCO2 yr –1 for these years, respectively. The annual DACCS deployment eaches 0 [0–0.02] GtCO2 yr –1 by 2030, 0.02 [0–1.74] GtCO2 yr –1 by 2050, and 1.02 [0–12.6] GtCO2 yr –1 by 2100 (Figure 12.3). 2 Reported cumulative volumes of BECCS, CO2 removal from AFOLU, and DACCS reach 328 [168–763] GtCO2, 252 [20–418] GtCO2, and 29 [0–339] GtCO2 for the 2020–2100 period, respectively. Reaching the higher end of CDR volumes is subject to issues regarding their feasibility (see below), especially if achieved with only a limited number of CDR methods. Recent studies have identified some drivers for large-scale CDR deployment in IAM scenarios, including insufficient representation of variable renewables, a high discount rate that tends to increase initial carbon budget overshoot and therefore inflates usage of CDR to achieve net-negative emissions at later times, omission of CDR methods aside from BECCS and A/R (Emmerling et al. 2019; Hilaire et al. 2019; Köberle 2019), and limited deployment of demand-side options (Grubler et al. 2018; van Vuuren et al. 2018; Daioglou et al. 2019). The levels of CDR in IAMs in modelled pathways would change depending on the allowable overshoot of policy targets such as temperature or radiative forcing and the costs of non-CDR mitigation options (Johansson et al. 2020; van der Wijst et al. 2021) (Section 3.2.2).
While many CDR methods are gradually being explored, IAM scenarios have focused mostly on BECCS and A/R (Tavoni and Socolow 2013; Fuhrman et al. 2019; Rickels et al. 2019; Calvin et al. 2021; Diniz Oliveira et al. 2021). Although some IAM studies have also included other methods such as DACCS (Chen and Tavoni 2013; Marcucci et al. 2017; Realmonte et al. 2019; Fuhrman et al. 2020; Akimoto et al. 2021; Fuhrman et al. 2021a), enhanced weathering (Strefler et al. 2021), SCS and biochar (Holz et al. 2018) there is much less literature compared to studies on BECCS (Hilaire et al. 2019). A large-scale coordinated IAM study on BECCS (‘EMF-33’) has been conducted (Muratori et al. 2020; Rose et al. 2020) but none exists for other CDR methods. A recent review proposes a combination of various CDR methods (Fuss et al. 2018) but more in-depth literature on such a portfolio approach is limited (Strefler et al. 2021). A multi-criteria analysis has identified pathways with CDR portfolios different from least-cost pathways often dominated by BECCS and A/R (Rueda et al. 2021).
At the national and regional levels, the role of land-based biological CDR methods has long been analysed, but there is little detailed techno-economic assessment of the role of other CDR methods. There is a small but emerging literature providing such assessments for developed countries (Kraxner et al. 2014; Baik et al. 2018; Daggash et al. 2018; Patrizio et al. 2018; Sanchez et al. 2018; Breyer et al. 2019; Kato and Kurosawa 2019; Larsen et al. 2019; McQueen et al. 2020; Bistline and Blanford 2021; García-Freites et al. 2021; Jackson et al. 2021; Kato and Kurosawa 2021; Negri et al. 2021) while the literature outside developed countries is limited (Alatiq et al. 2021; Fuhrman et al. 2021b; Weng et al. 2021).
In IAMs, CDR is contributed mainly by the energy sector (through BECCS) and AFOLU (through A/R) (Figure 12.3). IAMs are starting to include other CDR methods, such as DACCS and enhanced weathering (Section 12.3.1), which are yet to be attributed to specific sectors in IAMs. Following IPCC guidance for UNFCCC inventories, A/R and SCS are reported in land use, land-use change and forestry (LULUCF), while BECCS would be reported in the sector where the carbon capture occurs, that is, the energy sector in the case of electricity and heat production, and the industry sector for BECCS linked to manufacturing (e.g., steel or hydrogen) (Tanzer et al. 2020; Bui et al. 2021; Tanzer et al. 2021).
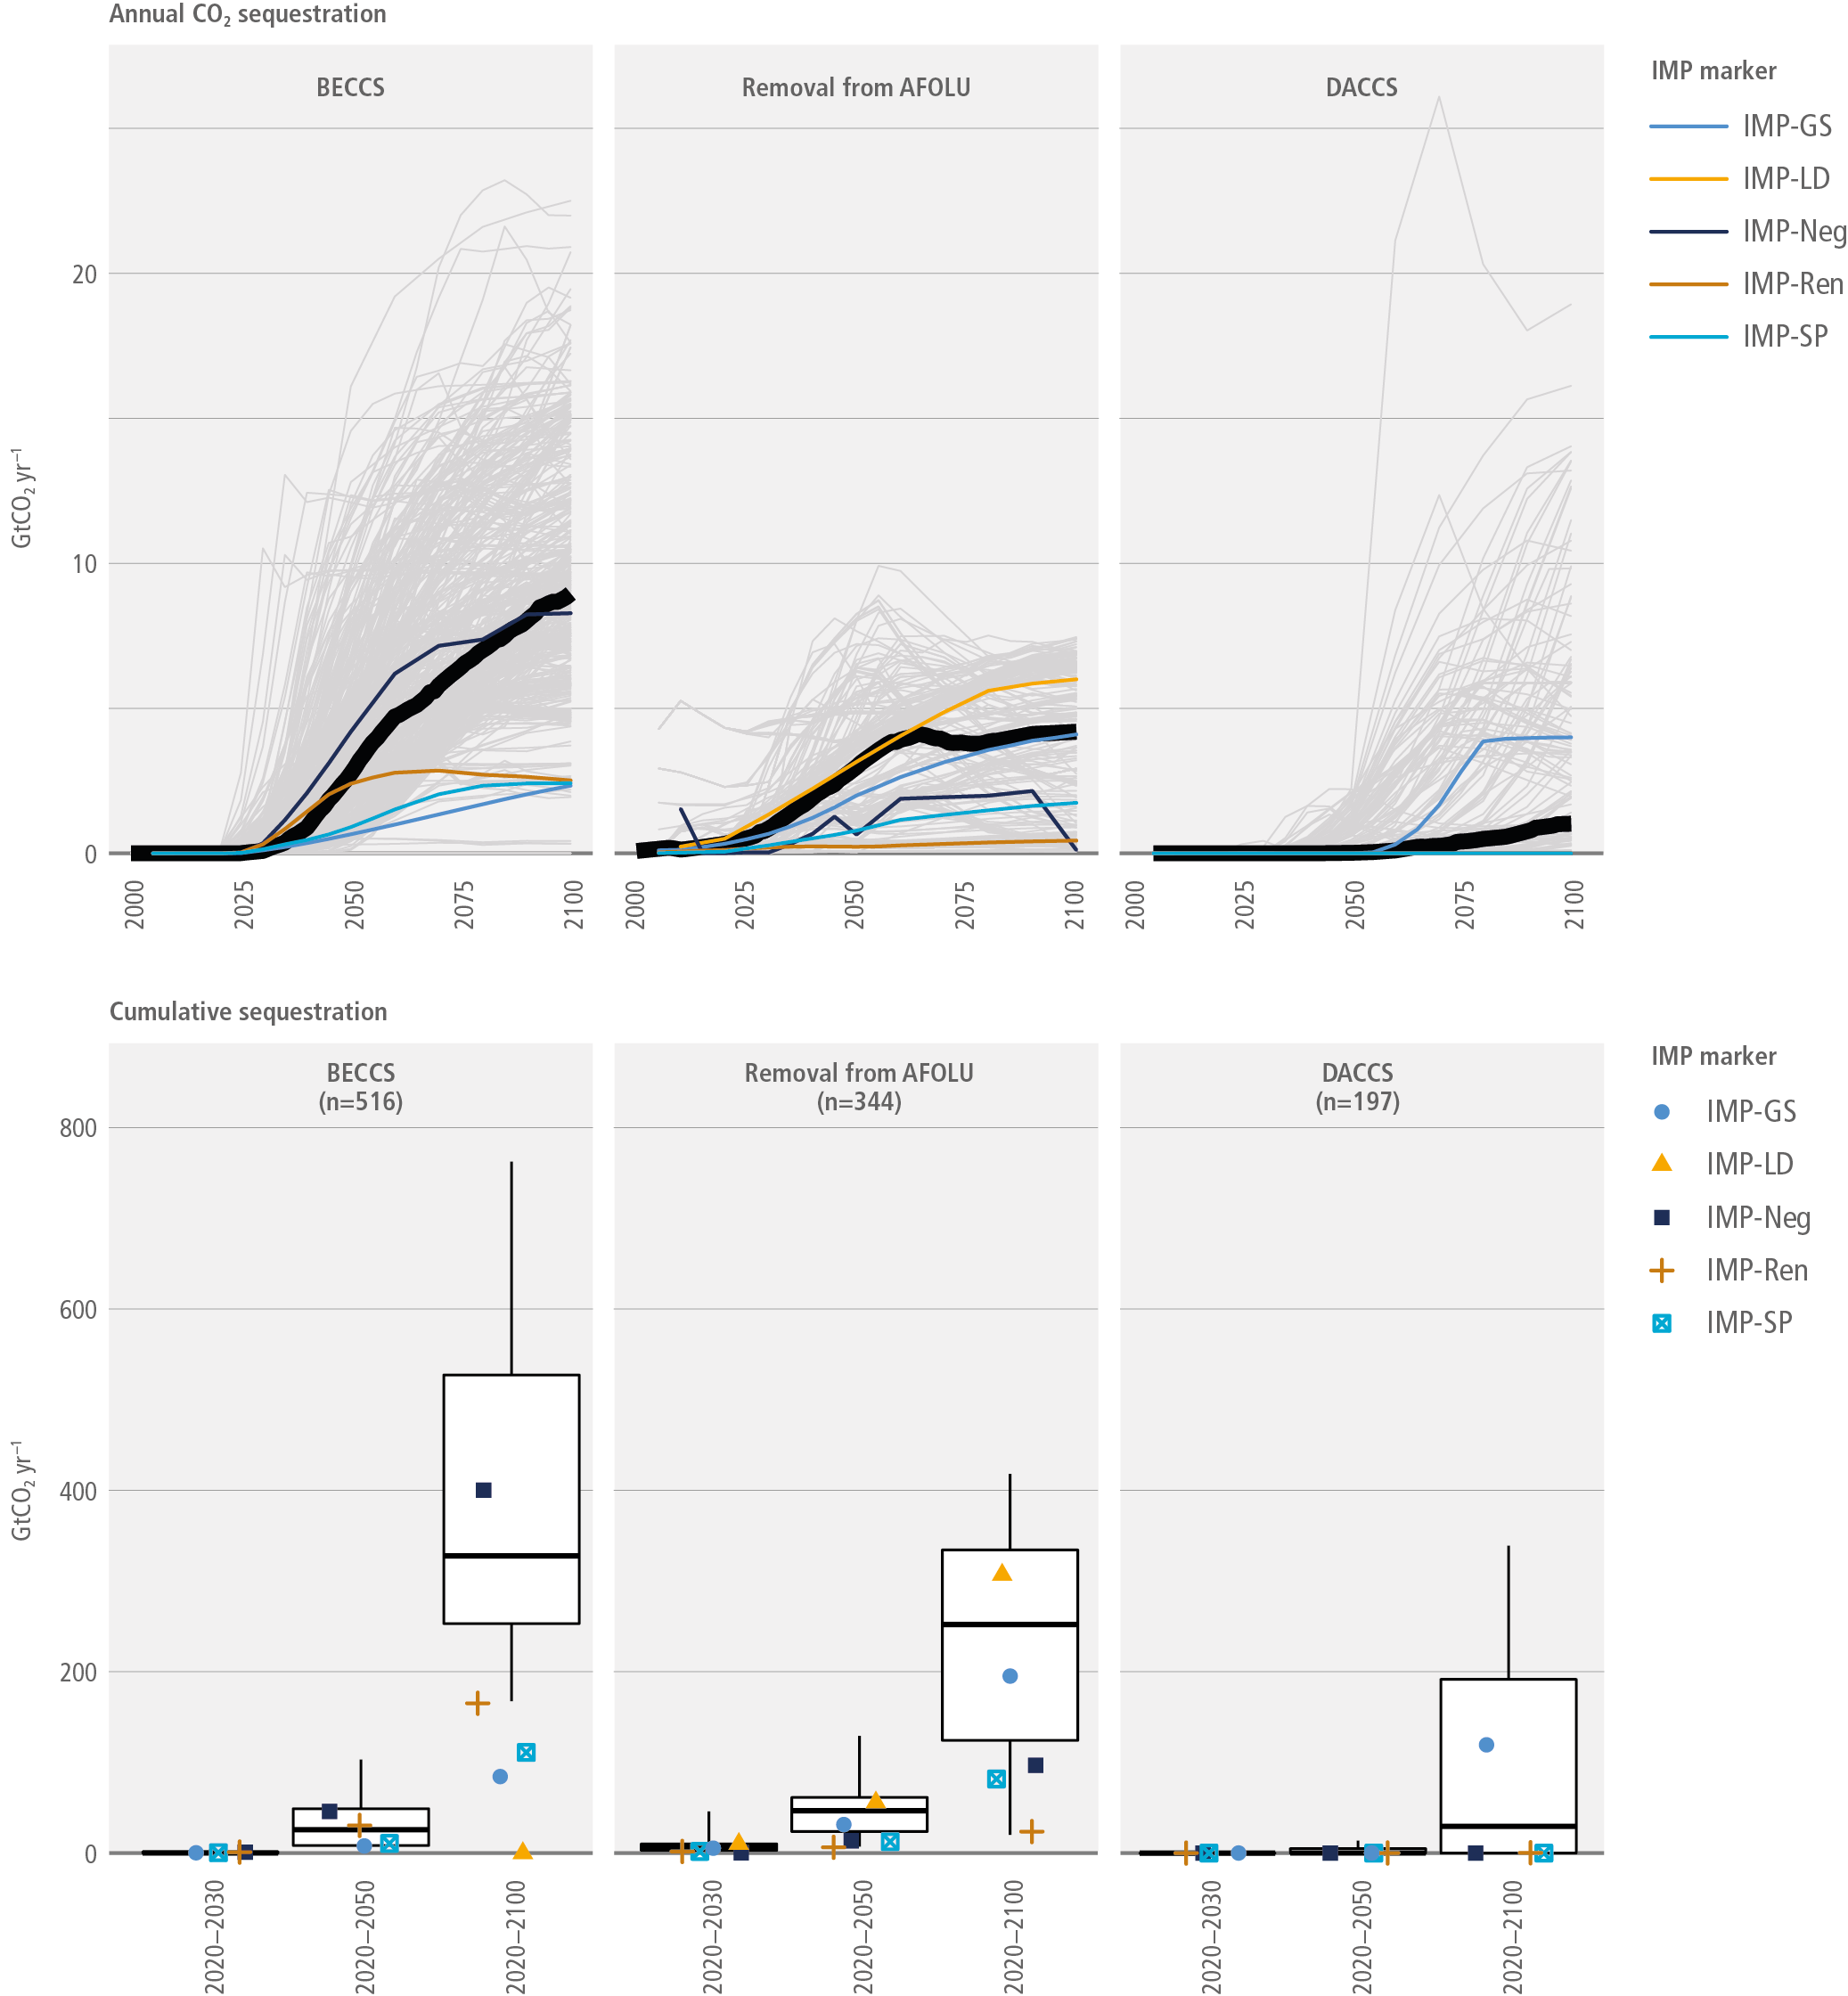
Figure 12.3 | Sequestration through three predominant CDR methods: BECCS, CO2removal from AFOLU (mainly A/R), and DACCS (upper panels) annual sequestration and (lower panels) cumulative sequestration. The IAM scenarios described in the figure correspond to those that limit warming to 2°C (>67%) or lower. The black line in each of the upper panels indicates the median of all the scenarios in categories C1 to C3. Hinges in the lower panels represent the interquartile ranges while whiskers extend to 5th and 95th percentiles. The IMPs are highlighted with colours, as shown in the key. The number of scenarios is indicated in the header of each panel. The number of scenarios with a non-zero DACCS value is 146.
12.3.1CDR Methods Not Assessed Elsewhere in This Report: DACCS, Enhanced Weathering and Ocean-based Approaches
This section assesses the CDR methods that are not carried out solely within conventional sectors and so are not covered in other parts of the report: direct air carbon capture and storage, enhanced weathering, and ocean-based approaches. It provides an overview of each CDR method: their costs, potentials, risks and impacts, co-benefits, and their role in mitigation pathways. Since these processes, approaches and technologies have medium to low technology readiness levels, they are subject to significant uncertainty.
12.3.1.1Direct Air Carbon Capture and Storage (DACCS)
Direct air capture (DAC) is a chemical process to capture ambient CO2 from the atmosphere. Captured CO2 can be stored underground (direct air carbon capture and storage, DACCS) or utilised in products (direct air carbon capture and utilisation, DACCU). DACCS shares with conventional CCS the transport and storage components but is distinct in its capture part. Because CO2 is a well-mixed GHG, DACCS can be sited relatively flexibly, though its locational flexibility is constrained by the availability of low-carbon energy and storage sites. Capturing the CO2 involves three basic steps: (i) contacting the air, (ii) capturing on a liquid or solid sorbent or a liquid solvent, and (iii) regeneration of the solvent or the sorbent (with heat, moisture and/or pressure). After capture, the CO2 stream can be stored underground or utilised. The duration of storage is an important consideration; geological reservoirs or mineralisation result in removal for more than 1000 years. The duration of the removal through DACCU (Breyer et al. 2019) varies with the lifetime of respective products (Wilcox et al. 2017; Bui et al. 2018; Fuss et al. 2018; Gunnarsson et al. 2018; Royal Society and Royal Academy of Engineering 2018; Creutzig et al. 2019), ranging from weeks to months for synthetic fuels to centuries or more for building materials (e.g., concrete cured using mineral carbonation) (Hepburn et al. 2019). The efficiency and environmental impacts of DACCS and DACCU options depend on the carbon intensity of the energy input (electricity and heat) and other lifecycle assessment (LCA) considerations (Zimmerman 2018; Jacobson 2019). See Chapters 6 and 11 for further details regarding carbon capture and utilisation. Another key consideration is the net carbon CO2 removal of DACCS over its lifecycle (Madhu et al. 2021). Deutz and Bardow (2021) and Terlouw et al. (2021) demonstrated that the life-cycle net emissions of DACCS systems can be negative, even for existing supply chains and some current energy mixes. They found that the GHG intensity of energy sources is a key factor.
DAC options can be differentiated by the specific chemical processes used to capture ambient CO2 from the air and recover it from the sorbent (Fasihi et al. 2019). The main categories are (i) liquid solvents with high-temperature regeneration, (ii) solid sorbents with low-temperature regeneration and (iii) regenerating by moisturising of solid sorbents. Other approaches such as electro-swing (Voskian and Hatton 2019) have been proposed but are less developed. Compared to other CDR methods, the primary barrier to upscaling DAC is its high cost and large energy requirement ( high confidence) (Nemet et al. 2018), which can be reduced through innovation. It has therefore attracted entrepreneurs and private investments (IEA 2020b).
Status: There are some demonstration projects by start-up companies and academic researchers, who are developing various types of DAC, including aqueous potassium solvent with calcium carbonation and solid sorbents with heat regeneration (NASEM 2019). These projects are supported mostly by private investments and grants or sometimes serve utilisation niche markets (e.g., CO2 for beverages, greenhouses, enhanced oil recovery). As of 2021, there are more than ten plants worldwide, with a scale of ktCO2 yr –1 or smaller (Larsen et al. 2019; NASEM 2019; IEA 2020b). Because of the fundamental difference in the CO2 concentration at the capture stage, DACCS does not benefit directly from research, development and demonstration (RD&D) of conventional CCS. Public RD&D programmes dedicated to DAC have therefore been proposed (Larsen et al. 2019; NASEM 2019). Possible research topics include development of new liquid solvents, novel solid sorbents, and novel equipment or system designs, and the need for third-party evaluation of techno-economic aspects has also been emphasised (NASEM 2019). However, since basic research does not appear to be a primary barrier, both NASEM (2019) and Larsen et al. (2019) argue for a stronger focus on demonstration in the US context. Though the US and UK governments have begun funding DACCS research (IEA 2020b), the scale of R&D activities is limited.
Costs: As the process captures dilute CO2 (~0.04%) from the ambient air, it is less efficient and more costly than conventional carbon capture applied to power plants and industrial installations (with a CO2 concentration of ~10%) ( high confidence). The cost of a liquid solvent system is dominated by the energy cost (because of the much higher energy demand for CO2 regeneration, which reduces the efficiency) while capital costs account for a significant share of the cost of solid sorbent systems (Fasihi et al. 2019). The range of the DAC cost estimates found in the literature is wide (USD60–1000 tCO2–1) (Fuss et al. 2018) partly because different studies assume different use cases, differing phases (first plant vs n th plant) (Lackner et al. 2012), different configurations, and disparate system boundaries. Estimates of industrial origin are often on the lower side (Ishimoto et al. 2017). Fuss et al. (2018) suggest a cost range of USD600–1000 tCO2–1 for first-of-a-kind plants, and USD100–300 tCO2–1 as experience accumulates. An expert elicitation study found a similar cost level for 2050 with a median of around USD200 tCO2–1 (Shayegh et al. 2021) (medium evidence, medium agreement ). NASEM (2019) systematically evaluated the costs of different designs and found a range of 84–386 USD2015 tCO2–1 for the designs currently considered by active technology developers. This cost range excludes the site-specific costs of transportation or storage.
Potentials: There is no specific study on the potential of DACCS but the literature has assumed that the technical potential is virtually unlimited provided that high energy requirements could be met (medium evidence, high agreement ) (Marcucci et al. 2017; Fuss et al. 2018; Lawrence et al. 2018) since DACCS encounters fewer non-cost constraints than any other CDR method. Focusing only on the Maghreb region, Breyer et al. (2020) reported an optimistic potential 150 GtCO2 at less than USD61 tCO2–1 for 2050. Fuss et al. (2018) suggest a potential of 0.5–5 GtCO2 yr –1 by 2050 because of environmental side effects and limits to underground storage. In addition to the ultimate potentials, Realmonte et al. (2019) noted the rate of scale-up as a strong constraint on deployment. Meckling and Biber (2021) discuss a policy roadmap to address the political economy for upscaling. More systematic analysis on potentials is necessary; first and foremost on national and regional levels, including the requirements for low-carbon heat and power, water and material demand, availability of geological storage and the need for land in case of low-density energy sources such as solar or wind power.
Risks and impacts: DACCS requires a considerable amount of energy ( high confidence), depending on the type of technology, water, and make-up sorbents, while its land footprint is small compared to other CDR methods (Smith et al. 2016). Yet, depending on the source of energy for DACCS (e.g., renewables vs nuclear), DACCS could require a significant land footprint (NASEM 2019; Sekera and Lichtenberger 2020). The theoretical minimum energy requirement for separating CO2 gas from the air is about 0.5 GJ tCO2–1 (Socolow et al. 2011). Fasihi et al. (2019) reviewed the published estimates of energy requirements and found that for the current technologies, the total energy requirement is about 4–10 GJ tCO2–1, with heat accounting for about 80% and electricity about 20% (McQueen et al. 2021). At a 10 GtCO2 yr –1 sequestration scale, this would translate into 40–100 exajoules (EJ) yr –1 of energy consumption (32–80 EJ yr –1 for heat and 8–20 EJ yr –1 electricity), which can be contrasted with the current primary energy supply of about 600 EJ yr –1 and electricity generation of about 100 EJ yr –1. For the solid sorbent technology, low-temperature heat could be sourced from heat pumps powered by low-carbon sources such as renewables (Breyer et al. 2020), waste heat (Beuttler et al. 2019), and nuclear energy (Sandalow et al. 2018). Unless sourced from a clean source, this amount of energy could cause environmental damage (Jacobson 2019). Because DACCS is an open system, water lost from evaporation must be replenished. Water loss varies, depending on technology (including adjustable factors such as the concentration of the liquid solvent) as well as environmental conditions (e.g., temperate vs tropical climates). For a liquid solvent system, it can be 0–50 tH2O tCO2–1 (Fasihi et al. 2019). A water loss rate of about 1–10 tH2O tCO2–1 (Socolow et al. 2011) would translate into about 10–100 GtH2O (10–100 km 3) to capture 10 GtCO2 from the atmosphere. Some solid sorbent technologies actually produce water as a by-product, for example 0.8–2 tH2O tCO2–1 for a solid-sorbent technology with heat regeneration (Beuttler et al. 2019; Fasihi et al. 2019). Large-scale deployment of DACCS would also require a significant quantity of materials, and energy to produce them (Chatterjee and Huang 2020). Hydroxide solutions are currently being produced as a by-product of chlorine but replacement (make-up) requirement of such materials at scale exceeds the current market supply (Realmonte et al. 2019). The land requirements for DAC units are not large enough to be of concern (Madhu et al. 2021). Furthermore, these can be placed on unproductive lands, in contrast to biological CDR. Nevertheless, to ensure that CO2-depleted air does not enter the air contactor of an adjacent DAC system, there must be enough space between DAC units, similar to wind power turbines. Considering this, Socolow et al. (2011) estimated a land footprint of 1.5 km 2MtCO2–1. In contrast, large energy requirements can lead to significant footprints if low-density energy sources (e.g., solar PV) are used (Smith et al. 2016). For the issues associated with CO2 utilisation and storage, see Chapter 6.
Co-benefits: While Wohland et al. (2018) proposed solid sorbent-based DAC plants as a Power-to-X technology that could use excess renewable power (at times of low or even negative prices), such operation would add additional costs. Installations would need to be designed for intermittent operations (i.e., at low load factors) which would negatively affect capital and operation costs (Daggash et al. 2018; Sandalow et al. 2018) as a high time-resolution model suggests a high utilisation rate (Breyer et al. 2020). Solid sorbent DAC designs can potentially remove more water from the ambient air than needed for regeneration, thereby delivering surplus water that would contribute to SDG 6 (clean water and sanitation) in arid regions (Sandalow et al. 2018; Fasihi et al. 2019).
Trade-offs and spillover effects: Liquid solvent DACCS systems need substantial amounts of water (Fasihi et al. 2019), although much less than BECCS systems (Smith et al. 2016), which could negatively affect SDG 6 (clean water and sanitation). Although the high energy demand of DACCS could affect SDG 7 (affordable and clean energy) negatively through potential competition or positively through learning effects (Beuttler et al. 2019), its impact has not been thoroughly assessed yet.
Role in mitigation pathways: There are a few IAM studies that have explicitly incorporated DACCS. Stringent emissions constraints in these studies lead to high carbon prices, allowing DACCS to play an important role in mitigation. Chen and Tavoni (2013) examined the role of DACCS in an IAM (WITCH) and found that incorporating DACCS reduces the overall cost of mitigation and tends to postpone the timing of mitigation. The scale of capture goes up to 37 GtCO2 yr –1 in 2100. Akimoto et al. (2021) introduced DACCS in the IAM DNE21+, and also found the long-term marginal cost of abatement is significantly reduced by DACCS. Marcucci et al. (2017) ran MERGE-ETL, an integrated model with endogenous learning, and showed that DACCS allows for a model solution for the 1.5°C target, and that DACCS substitutes for BECCS under stringent targets. In their analysis, DACCS captures up to 38.3 GtCO2 yr –1 in 2100. Realmonte et al. (2019) modelled two types of DACCS (based on liquid and solid sorbents) with two IAMs (TIAM-Grantham and WITCH), and showed that in deep mitigation scenarios, DACCS complements, rather than substitutes, other CDR methods such as BECCS, and that DACCS is effective at containing mitigation costs. At the national scale, Larsen et al. (2019) utilised the Regional Investment and Operations (RIO) Platform coupled with the Energy PATHWAYS model, and explicitly represented DAC in US energy systems scenarios. They found that in a scenario that reaches net zero emissions by 2045, about 0.6 GtCO2 or 1.8 GtCO2 of DACCS would be deployed, depending on the availability of biological carbon sinks and bioenergy. The modelling supporting the European Commission’s initial proposal for net zero GHG emissions by 2050 incorporated DAC, with the captured CO2 used for both synthetic fuel production (DACCU) and storage (DACCS) (Capros et al. 2019). Fuhrman et al. (2021a) evaluated the role of DACCS across five shared socio-economic pathways with the GCAM modelling framework and identified a substantial role for DACCS in mitigation and a decreased pressure on land and water resources from BECCS, even under the assumption of limited energy efficiency improvement and conservative cost declines of DACCS technologies. The newest iteration of the World Economic Outlook by IEA (2021b) deploys CDR on a limited scale, and DACCS removes 0.6 GtCO2 in 2050 for its Net Zero CO2 Emissions scenario.
Status, costs, potentials, risk and impacts, co-benefits, trade-offs and spillover effects and the role in mitigation pathways of DACCS are summarised in Table 12.6.
Table 12.6 | Summary of status, costs, potentials, risk and impacts, co-benefits, trade-offs and spillover effects and the role in mitigation pathways for CDR methods. Technology readiness level (TRL) is a measure of maturity of the CDR method. Scores range from 1 (basic principles defined) to 9 (proven in operational environment). Author judgement ranges (assessed by authors in the literature) are shown, with full literature ranges shown in brackets.
CDR method | Status (TRL) | Cost (USD tCO2–1) | Mitigation Potential (GtCO2yr–1) | Risk and impacts | Co-benefits | Trade-offs and spillover effects | Role in modelled mitigation pathways | Section |
DACCS | 6 | 100–300 (84–386) | 5–40 | Increased energy and water use | Water produced (solid sorbent DAC designs only) | Potentially increased emissions from water supply and energy generation | In a few IAMs; DACCS complements other CDR methods | 12.3.1.1 |
Enhanced weathering | 3–4 | 50–200 (24–578) | 2–4 (<1–95) | Mining impacts; air quality impacts of rock dust when spreading on soil | Enhanced plant growth, reduced erosion, enhanced soil carbon, reduced soil acidity, enhanced soil water retention | Potentially increased emissions from water supply and energy generation | In a few IAMs; EW complements other CDR methods | 12.3.1.2 |
Ocean alkalinity enhancement | 1–2 | 40–260 | 1–100 | Increased seawater pH and saturation states may impact marine biota. Possible release of nutritive or toxic elements and compounds. Mining impacts | Limiting ocean acidification | Potentially increased emissions of CO2 and dust from mining, transport and deployment operations | No data | 12.3.1.3 |
Ocean fertilisation | 1–2 | 50–500 | 1–3 | Nutrient redistribution, restructuring of the ecosystem, enhanced oxygen consumption and acidification in deeper waters, potential for decadal-to-millennial-scale return to the atmosphere of nearly all the extra carbon removed, risks of unintended side effects | Increased productivity and fisheries, reduced upper ocean acidification | Subsurface ocean acidification, deoxygenation; altered meridional supply of macro-nutrients as they are utilised in the iron-fertilised region and become unavailable for transport to, and utilisation in, other regions, fundamental alteration of food webs, biodiversity | No data | 12.3.1.3 |
Blue carbon management in coastal ecosystems | 2–3 | Insufficient data, estimates range from ~100 to ~10,000 | <1 | If degraded or lost, coastal blue carbon ecosystems are likely to release most of their carbon back to the atmosphere; potential for sediment contaminants, toxicity, bioaccumulation and biomagnification in organisms; issues related to altering degradability of coastal plants; use of subtidal areas for tidal wetland carbon removal; effect of shoreline modifications on sediment redeposition and natural marsh accretion; abusive use of coastal blue carbon as means to reclaim land for purposes that degrade capacity for carbon removal | Potential for many non-climatic benefits and can contribute to ecosystem-based adaptation, coastal protection, increased biodiversity, reduced upper ocean acidification; could potentially benefit human nutrition or produce fertiliser for terrestrial agriculture, anti-methanogenic feed additive, or as an industrial or materials feedstock | If degraded or lost, coastal blue carbon ecosystems are likely to release most of their carbon back to the atmosphere. The full delivery of the benefits at their maximum global capacity will require years to decades to be achieved | Not incorporated in IAMs, but in some bottom-up studies: small contribution | 12.3.1.3, 7.4 |
BECCS | 5–6 | 15–400 | 0.5–11 | Competition for land and water resources, to grow biomass feedstock. Biodiversity and carbon stock loss if from unsustainable biomass harvest | Reduction of air pollutants; fuel security, optimal use of residues, additional income, health benefits and if implemented well can enhance biodiversity, soil health and land carbon | Competition for land with biodiversity conservation and food production | Substantial contribution in IAMs and bottom-up sectoral studies | 7.4 |
Afforestation/reforestation | 8–9 | 0–240 | 0.5–10 | Reversal of carbon removal through wildfire, disease, pests may occur. Reduced catchment water yield and lower groundwater level if species and biome are inappropriate | Enhanced employment and local livelihoods, improved biodiversity, improved renewable wood products provision, soil carbon and nutrient cycling. Possibly less pressure on primary forest | Inappropriate deployment at large scale can lead to competition for land with biodiversity conservation and food production | Substantial contribution in IAMs and also in bottom-up sectoral studies | 7.4 |
Biochar | 6–7 | 10–345 | 0.3–6.6 | Particulate and GHG emissions from production; biodiversity and carbon stock loss from unsustainable biomass harvest | Increased crop yields and reduced non-CO2 emissions from soil; resilience to drought | Environmental impacts associated with particulate matter; competition for biomass resource | In development – not yet in global mitigation pathways simulated by IAMs | 7.4 |
Soil carbon sequestration in croplands and grasslands | 8–9 | -45–100 | 0.6–9.3 | Risk of increased nitrous oxide emissions due to higher levels of organic nitrogen in the soil; risk of reversal of carbon sequestration | Improved soil quality, resilience and agricultural productivity | Attempts to increase carbon sequestration potential at the expense of production. Net addition per hectare is very small; hard to monitor | In development – not yet in global mitigation pathways simulated by IAMs; in bottom-up studies: with medium contribution | 7.4 |
Peatland and coastal wetland restoration | 8–9 | Insufficient data | 0.5–2.1 | Reversal of carbon removal in drought or future disturbance. Risk of increased methane emissions | Enhanced employment and local livelihoods, increased productivity of fisheries, improved biodiversity, soil carbon and nutrient cycling | Competition for land for food production on some peatlands used for food production | Not in IAMs but some bottom-up studies with medium contribution | 7.4 |
Agroforestry | 8–9 | Insufficient data | 0.3–9.4 | Risk that some land area lost from food production; requires high skills | Enhanced employment and local livelihoods, variety of products, improved soil quality, more resilient systems | Some trade-off with agricultural crop production, but enhanced biodiversity, and resilience of system | No data from IAMs, but in bottom-up sectoral studies. with medium contribution | 7.4 |
Improved forest management | 8–9 | Insufficient data | 0.1–2.1 | If improved management is understood as merely intensification involving increased fertiliser use and introduced species, then it could reduce biodiversity and increase eutrophication | In case of sustainable forest management, it leads to enhanced employment and local livelihoods, enhanced biodiversity, improved productivity | If it involves increased fertiliser use and introduced species, it could reduce biodiversity and increase eutrophication and upstream GHG emissions | No data from IAMs, but in bottom-up sectoral studies with medium contribution | 7.4 |
12.3.1.2Enhanced Weathering
Enhanced weathering involves (i) the mining of rocks containing minerals that naturally absorb CO2 from the atmosphere over geological timescales (as they become exposed to the atmosphere through geological weathering), (ii) the comminution of these rocks to increase the surface area, and (iii) the spreading of these crushed rocks on soils (or in the ocean/coastal environments; Section 12.3.1.3) so that they react with atmospheric CO2 (Schuiling and Krijgsman 2006; Hartmann et al. 2013; Beerling et al. 2018; Goll et al. 2021). Construction waste and waste materials from mining can also be used as a source material for enhanced weathering. Silicate rocks such as basalt, containing minerals rich in calcium and magnesium and lacking metal ions such as nickel and chromium, are most suitable for enhanced weathering (Beerling et al. 2018); they reduce soil solution acidity during dissolution, and promote the chemical transformation of CO2 to bicarbonate ions. The bicarbonate ions can precipitate in soils and drainage waters as a solid carbonate mineral (Manning 2008), or remain dissolved and increase alkalinity levels in the ocean when the water reaches the sea (Renforth and Henderson 2017). The modelling study by Cipolla et al. (2021) found that rate of weathering is greater in high rainfall environments, and was increased by organic matter amendment.
Status: Enhanced weathering has been demonstrated in the laboratory and in small-scale field trials (TRL 3–4) but has yet to be demonstrated at scale (Beerling et al. 2018; Amann et al. 2020). The chemical reactions are well understood (Manning 2008; Gillman 1980; Gillman et al. 2001), but the behaviour of the crushed rocks in the field and potential co-benefits and adverse side effects of enhanced weathering require further research (Beerling et al. 2018). Small-scale laboratory experiments have calculated weathering rates that are orders of magnitude slower than the theoretical limit for mass transfer-controlled forsterite (Renforth et al. 2015; Amann et al. 2020) and basalt dissolution (Kelland et al. 2020). Uncertainty surrounding silicate mineral dissolution rates in soils, the fate of the released products, the extent of legacy reserves of mining by-products that might be exploited, location and availability of rock extraction sites, and the impact on ecosystems remain poorly quantified and require further research to better understand feasibility (Renforth 2012; Moosdorf et al. 2014; Beerling et al. 2018). Closely monitored, large-scale demonstration projects would allow these aspects to be studied (Smith et al. 2019a; Beerling et al. 2020).
Costs: Fuss et al. (2018), in a systematic review of the costs and potentials of CDR methods including enhanced weathering, note that costs are closely related to the source of the rock and the technology used for rock grinding and material transport (Renforth 2012; Hartmann et al. 2013; Strefler et al. 2018). Due to differences in the methods and assumptions between studies, literature ranges are highly uncertain and range from USD15–40 tCO2–1 to USD3460 tCO2–1 (Köhler et al. 2010; Taylor et al. 2016). Renforth (2012) reported operational costs in the UK of applying mafic rocks (rocks with high magnesium and iron silicate mineral concentrations) of USD70–578 tCO2–1, and for ultramafic rocks (rocks rich in magnesium and iron silicate minerals but with very low silica content – the low silica content enhances weathering rates) of USD24–123 tCO2–1. Beerling et al. (2020) combined a spatially resolved weathering model with a techno-economic assessment to suggest costs of between USD54–220 tCO2–1 (with a weighted mean of USD118–128 tCO2–1). Fuss et al. (2018) suggested an author judgement cost range of USD50–200 tCO2–1 for a potential of 2–4 GtCO2 yr −1 from 2050, excluding biological storage.
Potentials: In a systematic review of the costs and potentials of enhanced weathering, Fuss et al. (2018) report a wide range of potentials (limited evidence, low agreement ). The highest reported regional sequestration potential, 88.1 GtCO2 yr −1, is reported for the spreading of pulverised rock over a very large land area in the tropics, a region considered promising given the higher temperatures and greater rainfall (Taylor et al. 2016). Considering cropland areas only, the potential carbon removal was estimated by Strefler et al. (2018) to be 95 GtCO2 yr −1 for dunite and 4.9 GtCO2 yr −1 for basalt. Slightly lower potentials were estimated by Lenton (2014) where the potential of carbon removal by enhanced weathering (including adding carbonate and olivine to both oceans and soils) was estimated to be 3.7 GtCO2 yr –1 by 2100, but with mean annual removal an order of magnitude less at 0.2 GtC-eq yr –1 (Lenton 2014). The estimates reported in Smith et al. (2016) are based on the potential estimates of Lenton (2014). Beerling et al. (2020) estimate that up to 2 GtCO2 yr –1 could be removed by 2050 by spreading basalt onto 35–59% (weighted mean 53%) of agricultural land of 12 countries. Fuss et al. (2018) provide an author judgement range for potential of 2–4 GtCO2 yr −1 for 2050.
Risks and impacts: Mining of rocks for enhanced weathering will have local impacts and carries risks similar to those associated with the mining of mineral construction aggregates, with the possible additional risk of greater dust generation from fine comminution and land application. In addition to direct habitat destruction and increased traffic to access mining sites, there could be adverse impacts on local water quality (Younger and Wolkersdorfer 2004).
Co-benefits: Enhanced weathering can improve plant growth by pH modification and increased mineral supply (Kantola et al. 2017; Beerling et al. 2018), can enhance SCS in some soils (Beerling et al. 2018) thereby protecting against soil erosion (Wright and Upadhyaya 1998), and increasing the cation exchange capacity, resulting in increased nutrient retention and availability (Gillman 1980; Baldock and Skjemstad 2000; Gillman et al. 2001; Manning 2010; Guntzer et al. 2012; Tubana et al. 2016; Yu et al. 2017; Haque et al. 2019; Smith et al. 2019a). Through these actions, it can contribute to SDG 2 (zero hunger), SDG 15 (life on land) (by reducing land demand for croplands), SDG 13 (climate action) (through CDR), SDG 14 (life below water) (by ameliorating ocean acidification) and SDG 6 (clean water and sanitation) (Smith et al. 2019a). To more directly ameliorate ocean acidification while increasing CDR and reducing impacts on land ecosystems, alkaline minerals could instead be directly added to the ocean (Section 12.3.1.3). There are potential benefits in poverty reduction through employment of local workers in mining (Pegg 2006).
Trade-offs and spillover effects: Air quality could be adversely affected by the spreading of rock dust (Edwards et al. 2017), though this can partly be ameliorated by water-spraying (Grundnig et al. 2006). As noted above, any significant expansion of the mining industry would require careful assessment to avoid possible detrimental effects on biodiversity (Amundson et al. 2015). The processing of an additional 10 billion tonnes of rock would require up to 3000 Terawatt-hours of energy, which could represent approximately 0.1–6 % of global electricity use in 2100. The emissions associated with this additional energy generation may reduce the net carbon dioxide removal by up to 30% with present-day grid average emissions, but this efficiency loss would decrease with low-carbon power (Beerling et al. 2020).
Role in mitigation pathways: Only one study to date has included enhanced weathering in an integrated assessment model to explore mitigation pathways (Strefler et al. 2021).
Status, costs, potentials, risk and impacts, co-benefits, trade-offs and spillover effects and the role in mitigation pathways of enhanced weathering are summarised in Table 12.6.
12.3.1.3Ocean-based Methods
The ocean, which covers over 70% of the Earth’s surface, contains about 38,000 gigatonnes of carbon, some 45 times more than the present atmosphere, and oceanic uptake has already consumed close to 30–40% of anthropogenic carbon emissions (Sabine et al. 2004; Gruber et al. 2019). The ocean is characterised by diverse biogeochemical cycles involving carbon, and ocean circulation has much longer timescales than the atmosphere, meaning that additional anthropogenic carbon could potentially be stored in the ocean for centuries to millennia for methods that increase deep ocean-dissolved carbon concentrations or temporarily bury the carbon; or essentially permanently (over ten thousand years) for methods that store the carbon in mineral forms or as ions by increasing alkalinity (Siegel et al., 2021) (Cross-Chapter Box 8, Figure 1). A wide range of methods and implementation options for marine CDR have been proposed (Gattuso et al. 2018; Hoegh-Guldberg et al. 2018; GESAMP 2019). The most studied ocean-based CDR methods are ocean fertilisation, alkalinity enhancement (including electrochemical methods) and intensification of biologically-driven carbon fluxes and storage in marine ecosystems, referred to as ‘blue carbon’. The mitigation potentials, costs, co-benefits and trade-offs of these three options are discussed below. Less well studied are methods including artificial upwelling, terrestrial biomass dumping into oceans, direct CO2 removal from seawater (with CCS), and sinking marine biomass into the deep ocean or harvesting it for bioenergy (with CCS) or biochar (GESAMP 2019). These methods are summarised briefly below. Potential climate response and influence on the carbon budget of ocean-based CDR methods are discussed in WGI AR6, Chapter 5.
One natural mechanism of carbon transfer from the atmosphere to the deep ocean is the ocean biological pump, which is driven by the sinking of organic particles from the upper ocean. These particles derive ultimately from primary production by phytoplankton and most of them are remineralised within the upper ocean with only a small fraction reaching the deep ocean where the carbon can be sequestered on centennial and longer timescales . Increasing nutrient availability would stimulate uptake of CO2 through phytoplankton photosynthesis producing organic matter, some of which would be exported into the deep ocean, sequestering carbon. In areas of the ocean where macronutrients (nitrogen, phosphorus) are available in sufficient quantities (about 25% of the total area), the growth of phytoplankton is limited by the lack of trace elements such as iron. Thus, OF CDR can be based on two implementation options to increase the productivity of phytoplankton (Minx et al. 2018): macronutrient enrichment and micronutrient enrichment. A third option, highlighted in GESAMP (2019), is based on fertilisation for fish stock enhancement, for instance, as naturally occurs in eastern boundary current systems. Iron fertilisation is the best-studied OF option to date, but knowledge so far is still inadequate to predict global ecological and biogeochemical consequences.
Status: OF has a natural analogue: periods of glaciation in the geological past are associated with changes in deposition of dust containing iron into the ocean. Increased formation of phytoplankton has also been observed during seasonal deposition of dust from the Arabian Peninsula and ash deposition on the ocean surface after volcanic eruptions (Achterberg et al. 2013; Jaccard et al., 2013; Olgun et al. 2013; Martínez-García et al. 2014). OF options may appear technologically feasible, and enhancement of photosynthesis and CO2 uptake from surface waters is confirmed by a number of field experiments conducted in different areas of the ocean, but there is scientific uncertainty about the proportion of newly-formed organic carbon that is transferred to deep ocean, and the longevity of storage (Blain et al. 2008; Williamson et al. 2012; Trull et al. 2015). The efficiency of OF also depends on the region and experimental conditions, especially in relation to the availability of other nutrients, light and temperature (Aumont and Bopp 2006). In the case of macronutrients, very large quantities are needed and the proposed scaling of this technique has been viewed as unrealistic (Williamson and Bodle 2016).
Costs: Ocean fertilisation costs depend on nutrient production and its delivery to the application area (Jones 2014). The costs range from USD2 tCO2–1 for fertilisation with iron (Boyd 2008) to USD457 tCO2–1 for nitrate (Harrison 2013). Reported costs for macronutrient application at USD20 tCO2–1 (Jones 2014) contrast with higher estimates by (Harrison 2013) reporting that low costs are due to overestimation of sequestration capacity and underestimation of logistical costs. The median of OF cost estimates, USD230 tCO2–1 (Gattuso et al., 2021) indicates low cost-effectiveness, albeit uncertainties are large.
Potentials: Theoretical calculations indicate that organic carbon export increases 2–20 kg per gram of iron added, but experiments indicate much lower efficiency: a significant part of the CO2 can be emitted back the atmosphere because much of the organic carbon produced is remineralised in the upper ocean. Efficiency also varies with location (Bopp et al. 2013). Between studies, there are substantial differences in the ratio of iron added to carbon fixed photosynthetically, and in the ratio of iron added to carbon eventually sequestered (Trull et al. 2015), which has implications both for the success of this strategy and its cost. Estimates indicate potentially achievable net sequestration rates of 1–3 GtCO2 yr –1 for iron fertilisation, translating into cumulative CDR of 100–300 GtCO2 by 2100 (Ryaboshapko and Revokatova 2015; Minx et al. 2018), whereas OF with macronutrients has a higher theoretical potential of 5.5 GtCO2 yr –1 (Harrison 2017; Gattuso et al. 2021). Modelling studies show a maximum effect on atmospheric CO2 of 15–45 parts per million volume in 2100 (Zeebe and Archer 2005; Aumont and Bopp 2006; Keller et al. 2014; Gattuso et al. 2021).
Risks and impacts: Several of the mesoscale iron enrichment experiments have seen the emergence of potentially toxic species of diatoms (Silver et al. 2010; Trick et al. 2010). There is also (limited) evidence of increased concentrations of other GHGs such as methane and nitrous oxide during the subsurface decomposition of the sinking particles from iron-stimulated blooms (Law 2008). Impacts on marine biology and food web structure are not well known, however OF at large scale could cause changes in nutrient distributions or anoxia in subsurface water (Fuhrman and Capone 1991; DFO 2010). Other potential risks are perturbation to marine ecosystems via reorganisation of community structure, enhanced deep ocean acidification (Oschlies et al. 2010 ) and effects on human food supply.
Co-benefits: Co-benefits of OF include a potential increase in fish biomass through enhanced biological production (Minx et al. 2018) and reduced ocean acidification in the short term in the upper ocean (by CO2 removal), though it could be enhanced in the long term in the ocean interior (by CO2 release) (Oschlies et al., 2010 ; Gattuso et al. 2018).
Trade-offs and spillover effects: Potential drawbacks include subsurface ocean acidification and deoxygenation (Cao and Caldeira 2010; Oschlies et al., 2010 ; Williamson et al. 2012); altered regional meridional nutrient supply and fundamental alteration of food webs (GESAMP 2019); and increased production of N2O and CH4 (Jin and Gruber 2003; Lampitt et al. 2008). Ocean fertilisation is considered to have negative consequences for eight SDGs, and a combination of both positive and negative consequences for seven SDGs (Honegger et al. 2020).
CDR through ‘ocean alkalinity enhancement’ or ‘artificial ocean alkalinisation’ (Renforth and Henderson 2017) can be based on: (i) the dissolution of natural alkaline minerals that are added directly to the ocean or coastal environments; (ii) the dissolution of such minerals upstream from the ocean (e.g., enhanced weathering, Section 12.3.1.2); (iii) the addition of synthetic alkaline materials directly to the ocean or upstream; and (iv) electrochemical processing of seawater. In the case of (ii), minerals are dissolved on land and the dissolution products are conveyed to the ocean through runoff and river flow. These processes result in chemical transformation of CO2 and sequestration as bicarbonate and carbonate ions (HCO3–, CO32–) in the ocean. Imbalances between the input and removal fluxes of alkalinity can result in changes in global oceanic alkalinity and therefore the capacity of the ocean to store carbon. Such alkalinity-induced changes in partitioning of carbon between atmosphere and ocean are thought to play an important role in controlling climate change on timescales of 1000 years and longer (e.g., Zeebe 2012). The residence time of dissolved inorganic carbon in the deep ocean is around 100,000 years. However, residence time may decrease if alkalinity is reduced by a net increase in carbonate minerals by either increased formation (precipitation) or reduced dissolution of carbonate (Renforth and Henderson 2017). The alkalinity of seawater could potentially also be increased by electrochemical methods, either directly by reactions at the cathode that increase the alkalinity of the surrounding solution that can be discharged into the ocean, or by forcing the precipitation of solid alkaline materials (e.g., hydroxide minerals) that can then be added to the ocean (e.g., Rau et al. 2013; La Plante et al. 2021).
Status: OAE has been demonstrated by a small number of laboratory experiments (in addition to enhanced weathering, Section 12.3.1.2). The use of enhanced ocean alkalinity for carbon storage was first proposed by Kheshgi (1995) who considered the creation of highly reactive lime that would readily dissolve in the surface ocean and sequester CO2. An alternative method proposed the dissolution of carbonate minerals (e.g., calcium carbonate) in the presence of waste flue gas CO2 and seawater as a means capturing CO2 and converting it to bicarbonate ions (Rau and Caldeira 1999; Rau 2011). House et al. (2007) proposed the creation of alkalinity in the ocean through electrolysis. The fate of the stored carbon is the same for these proposals (i.e., HCO3– and CO32– ions), but the reaction pathway is different. Enhanced weathering of silicate minerals such as olivine could add alkalinity to the ocean, for example, by placing olivine sand in coastal areas (Meysman and Montserrat 2017; Montserrat et al. 2017). Some authors suggest use of maritime transport to discharge calcium hydroxide (slaked lime) (Caserini et al. 2021).
Costs: Techno-economic assessments of OAE largely focus on quantifying overall energy and carbon balances. Cost ranges are USD40–260 tCO2–1 (Fuss et al. 2018). Considering life-cycle carbon and energy balances for various OAE options, adding lime (or other reactive calcium or magnesium oxide/hydroxides) to the ocean would cost USD64–260 tCO2–1 (Renforth et al. 2013; Renforth & Kruger 2013; Caserini et al. 2019). Rau (2008) and Rau et al. (2018) estimate that electrochemical processes for increasing ocean alkalinity may have a net cost of USD3–160 tCO2–1, largely depending on energy cost and co-product (H2) market value. In the case of direct addition of alkaline minerals to the ocean (i.e., without calcination), the cost is estimated to be USD20–50 tCO2–1 (Harvey 2008; Köhler et al. 2013; Renforth and Henderson 2017).
Potentials: For OAE, the ocean theoretically has the capacity to store thousands of GtCO2 (cumulatively) without exceeding pre-industrial levels of carbonate saturation (Renforth and Henderson 2017) if the impacts were distributed evenly across the surface ocean. The potential of increasing ocean alkalinity may be constrained by the capability to extract, process, and react minerals (Section 12.3.1.2); the demand for co-benefits (see below), or to minimise impacts around points of addition. Important challenges with respect to the detailed quantification of the CO2 sequestration efficiency include nonstoichiometric dissolution, reversed weathering and potential pore water saturation in the case of adding minerals to shallow coastal environments (Meysman and Montserrat 2017). Fuss et al. (2018) suggest storage potentials of 1–100 GtCO2 yr –1. (González and Ilyina 2016) suggested that addition of 114 picomoles of alkalinity to the surface ocean could remove 3400 GtCO2 from the atmosphere.
Risks and impacts: For OAE, the local impact of increasing alkalinity on ocean chemistry can depend on the speed at which the impacted seawater is diluted/circulated and the exchange of CO2 from the atmosphere (Bach et al. 2019). Also, more extreme carbonate chemistry perturbations due to non-equilibrated alkalinity could affect local marine biota (Bach et al. 2019), although biological impacts are largely unknown. Air-equilibrated seawater has a much lower potential to perturb seawater carbonate chemistry. However, seawater with slow air-sea gas exchange, in which alkalinity increases, consumes CO2 from the surrounding water without immediate replenishment from the atmosphere, which would increase seawater pH and saturation states and may impact marine biota (Meysman and Montserrat 2017; Montserrat et al. 2017). It may be possible to use this effect to ameliorate ocean acidification. Like enhanced weathering, some proposals may result in the dissolution products of silicate minerals (e.g., silicon, iron, potassium, nickel) being supplied to ocean ecosystems (Meysman and Montserrat 2017; Montserrat et al. 2017). Ecological and biogeochemical consequences of OAE largely depend on the minerals used. When natural minerals such as olivine are used, the release of additional Si and Fe could have fertilising effects (Bach et al. 2019). In addition to perturbations to marine ecosystems via reorganisation of community structure, potentially adverse effects of OAE that should be studied include the release of toxic trace metals from some deposited minerals (Hartmann et al. 2013).
Co-benefits: Intentional addition of alkalinity to the oceans through OAE would decrease the risk to ocean ecosystems caused by the CO2-induced impact of ocean acidification on marine biota and the global carbon cycle (Doney et al. 2009; Köhler et al. 2010; Rau et al. 2012; Williamson and Turley 2012; Albright et al. 2016; Bach et al. 2019). OAE could be jointly implemented with enhanced weathering (Section 12.3.1.2), spreading the finely crushed rock in the ocean rather than on land. Regional alkalinisation could be effective in protecting coral reefs against acidification (Feng et al. 2016; Mongin et al., 2021) and coastal OAE could be part of a broader strategy for geochemical management of the coastal zone, safeguarding specific coastal ecosystems, such as important shellfisheries, from the adverse impact of ocean acidification (Meysman and Montserrat 2017).
Trade-offs and spillover effects: There is a paucity of research on biological effects of alkalinity addition. The very few studies that have explored the impact of elevated alkalinity on ocean ecosystems have largely been limited to single species experiments (Cripps et al. 2013; Gore et al. 2019) and a constrained field study quantifying the net calcification response of a coral reef flat to alkalinity enhancement (Albright et al. 2016). The addition rate would have to be great enough to overcome mixing of the local seawater with the ambient environment, but not sufficient to detrimentally impact ecosystems. More research is required to assess locations in which this may be feasible, and how such a scheme may operate (Renforth and Henderson 2017). The environmental impact of large-scale release of natural dissolution products into the coastal environment will strongly depend on the scale of olivine application, the characteristics of the coastal water body (e.g., residence time) and the particular biota present (e.g., coral reefs will react differently compared with seagrasses) (Meysman and Montserrat 2017). Model simulations (González et al. 2018) suggest that termination of OAE implemented on a massive scale under a high CO2 emission scenario (Representative Concentration Pathway 8.5) might pose high risks to biological systems sensitive to rapid environmental changes because it would cause a sharp increase in ocean acidification. For example, OAE termination would lead to a decrease in surface pH in warm shallow regions where vulnerable coral reefs are located, and a drop in the carbonate saturation state. However, other studies with lower levels of OAE have shown no termination effect (Keller et al., 2014).
The term ‘blue carbon’ was used originally to refer to biological carbon sequestration in all marine ecosystems, but it is increasingly applied to CDR associated with rooted vegetation in the coastal zone, such as tidal marshes, mangroves and seagrasses. Potential for carbon sequestration in other coastal and non-coastal ecosystems, such as macroalgae (e.g., kelp), is debated (Krause-Jensen and Duarte, 2016; Krause-Jensen et al., 2018). In this report, blue carbon refers to CDR through coastal blue carbon management.
Status: In recent years, there has been increasing research on the potential, effectiveness, risks, and possibility of enhancing CO2 sequestration in shallow coastal ecosystems (Duarte, 2017). About 20% of the countries that are signatories to the Paris Agreement refer to blue carbon approaches for climate change mitigation in their NDCs and are moving toward measuring blue carbon in inventories. About 40% of those same countries have pledged to manage shallow coastal ecosystems for climate change adaptation (Kuwae and Hori 2019).
Costs: There are large differences in the cost of CDR applying blue carbon management methods between different ecosystems (and at the local level). Median values are estimated as USD240, 30,000, and 7800 tCO2–1, respectively for mangroves, salt marsh and seagrass habitats (Gattuso et al. 2021). Currently estimated cost effectiveness (for climate change mitigation) is very low (Siikamäki et al. 2012; Bayraktarov et al. 2016; Narayan et al. 2016).
Potentials: Globally, the total potential carbon sequestration rate through blue carbon CDR is estimated in the range 0.02–0.08 GtCO2 yr –1 (Wilcox et al. 2017; National Academies of Sciences 2019). Gattuso et al. (2021) estimate the theoretical cumulative potential of coastal blue carbon management by 2100 to be 95 GtCO2, taking into account the maximum area that can be occupied by these habitats and historic losses of mangroves, seagrass and salt marsh ecosystems.
Risks and impacts: For blue carbon management, potential risks relate to the high sensitivity of coastal ecosystems to external impacts associated with both degradation and attempts to increase carbon sequestration. Under expected future warming, sea level rise and changes in coastal management, blue carbon ecosystems are at risk, and their stored carbon is at risk of being lost (Bindoff et al. 2019).
Co-benefits: Blue carbon management provides many non-climatic benefits and can contribute to ecosystem-based adaptation, also reducing emissions associated with habitat degradation and loss (Howard et al. 2017; Hamilton and Friess 2018). Shallow coastal ecosystems have been severely affected by human activity; significant areas have already been deforested or degraded and continue to be denuded. These processes are accompanied by carbon emissions. The conservation and restoration of coastal ecosystems, which will lead to increased carbon sequestration, is also essential for the preservation of basic ecosystem services, and healthy ecosystems tend to be more resilient to the effects of climate change.
Trade-offs and spillover effects: Blue carbon management schemes should consist of a mix of restoration, conservation and areal increase, including complex engineering interventions that enhance natural capital, safeguard their resilience and the ecosystem services they provide, and decrease the sensitivity of such ecosystems to further disturbances.
Artificial upwelling: This concept uses pipes or other methods to pump nutrient-rich deep ocean water to the surface where it has a fertilising effect (see OF section). To achieve CO2 removal at a Gt magnitude, modelling studies have shown that artificial upwelling would have to be implemented on a massive scale (over 50% of the ocean to deliver maximum rate of 10GtCO2 yr –1 under RCP8.5) (Oschlies et al., 2010 , Keller et al. 2014). Because the deep water is much colder than surface water, at massive scale this could cool the Earth’s surface by several degrees, but the cooling effect would cease as the deeper ocean warms, and would reverse, leading to rapid warming, if the pumping ceased (Oschlies et al., 2010 , Keller et al. 2014).
Furthermore, the cooling would also severely alter atmospheric circulation and precipitation patterns (Kwiatkowski et al. 2015). Several upwelling approaches have been developed and tested (Pan et al., 2016) and more R&D is underway.
Terrestrial biomass dumping: There are proposals to sink terrestrial biomass (crop residues or logs) into the deep ocean as a means of sequestering carbon (Strand and Benford 2009). Sinking biochar has also been proposed (Miller and Orton, 2021). Decomposition would be inhibited by the cold and sometimes hypoxic/anoxic environment on the ocean floor, and absence of bacteria that decompose terrestrial lignocellulosic biomass, so storage timescale is estimated at hundreds to thousands of years (Strand and Benford 2009) (Burdige 2005). Potential side effects on marine ecosystems, chemistry, or circulation have not been thoroughly assessed. Neither have these concepts been evaluated with respect to the impacts on land from enhanced transfer of nutrients and organic matter to the ocean, nor the relative merits of alternative applications of residues and biochar as an energy source or soil amendment (Chapter 7).
Marine biomass CDR options: Proposals have been made to grow macroalgae (Duarte et al., 2017) for BECCS (N’Yeurt et al. 2012; Duarte et al. 2013; Chen et al., 2015 ), to sink cultured macroalgae into the deep sea, or to use marine algae for biochar (Roberts et al., 2015). Naturally-growing sargassum has also been considered for these purposes (Bach et al., 2021). Froehlich et al. (2019) found a substantial area of the ocean (about 48 million km 2) suitable for farming seaweed. N’Yeurt et al. (2012) suggested that converting 9% of the oceans to macroalgal aquaculture could take up 19 GtCO2 in biomass, generate 12 Gt per annum of biogas, and the CO2 produced by burning the biogas could be captured and sequestered. Productivity of farmed macroalgae in the open ocean could potentially be enhanced through fertilising via artificial upwelling (Fan et al., 2020) or through cultivation platforms that dive at night to access nutrient-rich waters below the, often nutrient-limited, surface ocean. If the biomass were sunk, it is unknown how long the carbon would remain in the deep ocean and what the additional impacts would be. Research and development on macroalgae cultivation and use is currently underway in multiple parts of the world, though not necessarily directly focused on CDR.
Extraction of CO2from seawater (with storage): CO2 can be extracted by applying a vacuum, or by purging with a gas low in CO2 (Koweek et al., 2016). CO2 stripping can also be accomplished by acidifying seawater with a mineral acid, or through electrodialysis and electrolysis, to convert bicarbonate ions (HCO3–) to CO2 (Willauer et al., 2017; Eisaman et al., 2018; Digdaya et al., 2020; Eisaman 2020; Sharifian et al., 2021). The removal of CO2 from the ocean surface leads to undersaturation in the water, thus forcing CO2 to move from the atmosphere into the ocean to restore equilibrium. Electrochemical seawater CO2 extraction has been modelled, prototyped, and analysed from a techno-economic perspective (Eisaman et al., 2012; Willauer et al., 2017; de Lannoy et al., 2018; Eisaman et al., 2018a; Eisaman et al., 2018b).
Status, costs, potentials, risk and impacts, co-benefits, trade-offs and spillover effects and the role in mitigation pathways of ocean-based approaches are summarised in Table 12.6.
12.3.1.4Feasibility Assessment
Following the framework presented in Section 6.4 and Annex II, Part IV, Section 11, a multi-dimensional feasibility assessment of the CDR methods covered here is provided in Figure 12.4, taking into account the assessment presented in this section. Both DACCS and EW perform positively on the geophysical and technological dimensions while for ocean-based approaches performance is mixed. There is limited evidence to assess social-cultural, environmental/ecological, and institutional dimensions as the literature is still nascent for DACCS and EW, while these aspects are positive for blue carbon and mixed or negative for ocean fertilisation. On the economic dimension, the cost is assessed negatively for all CDR methods.
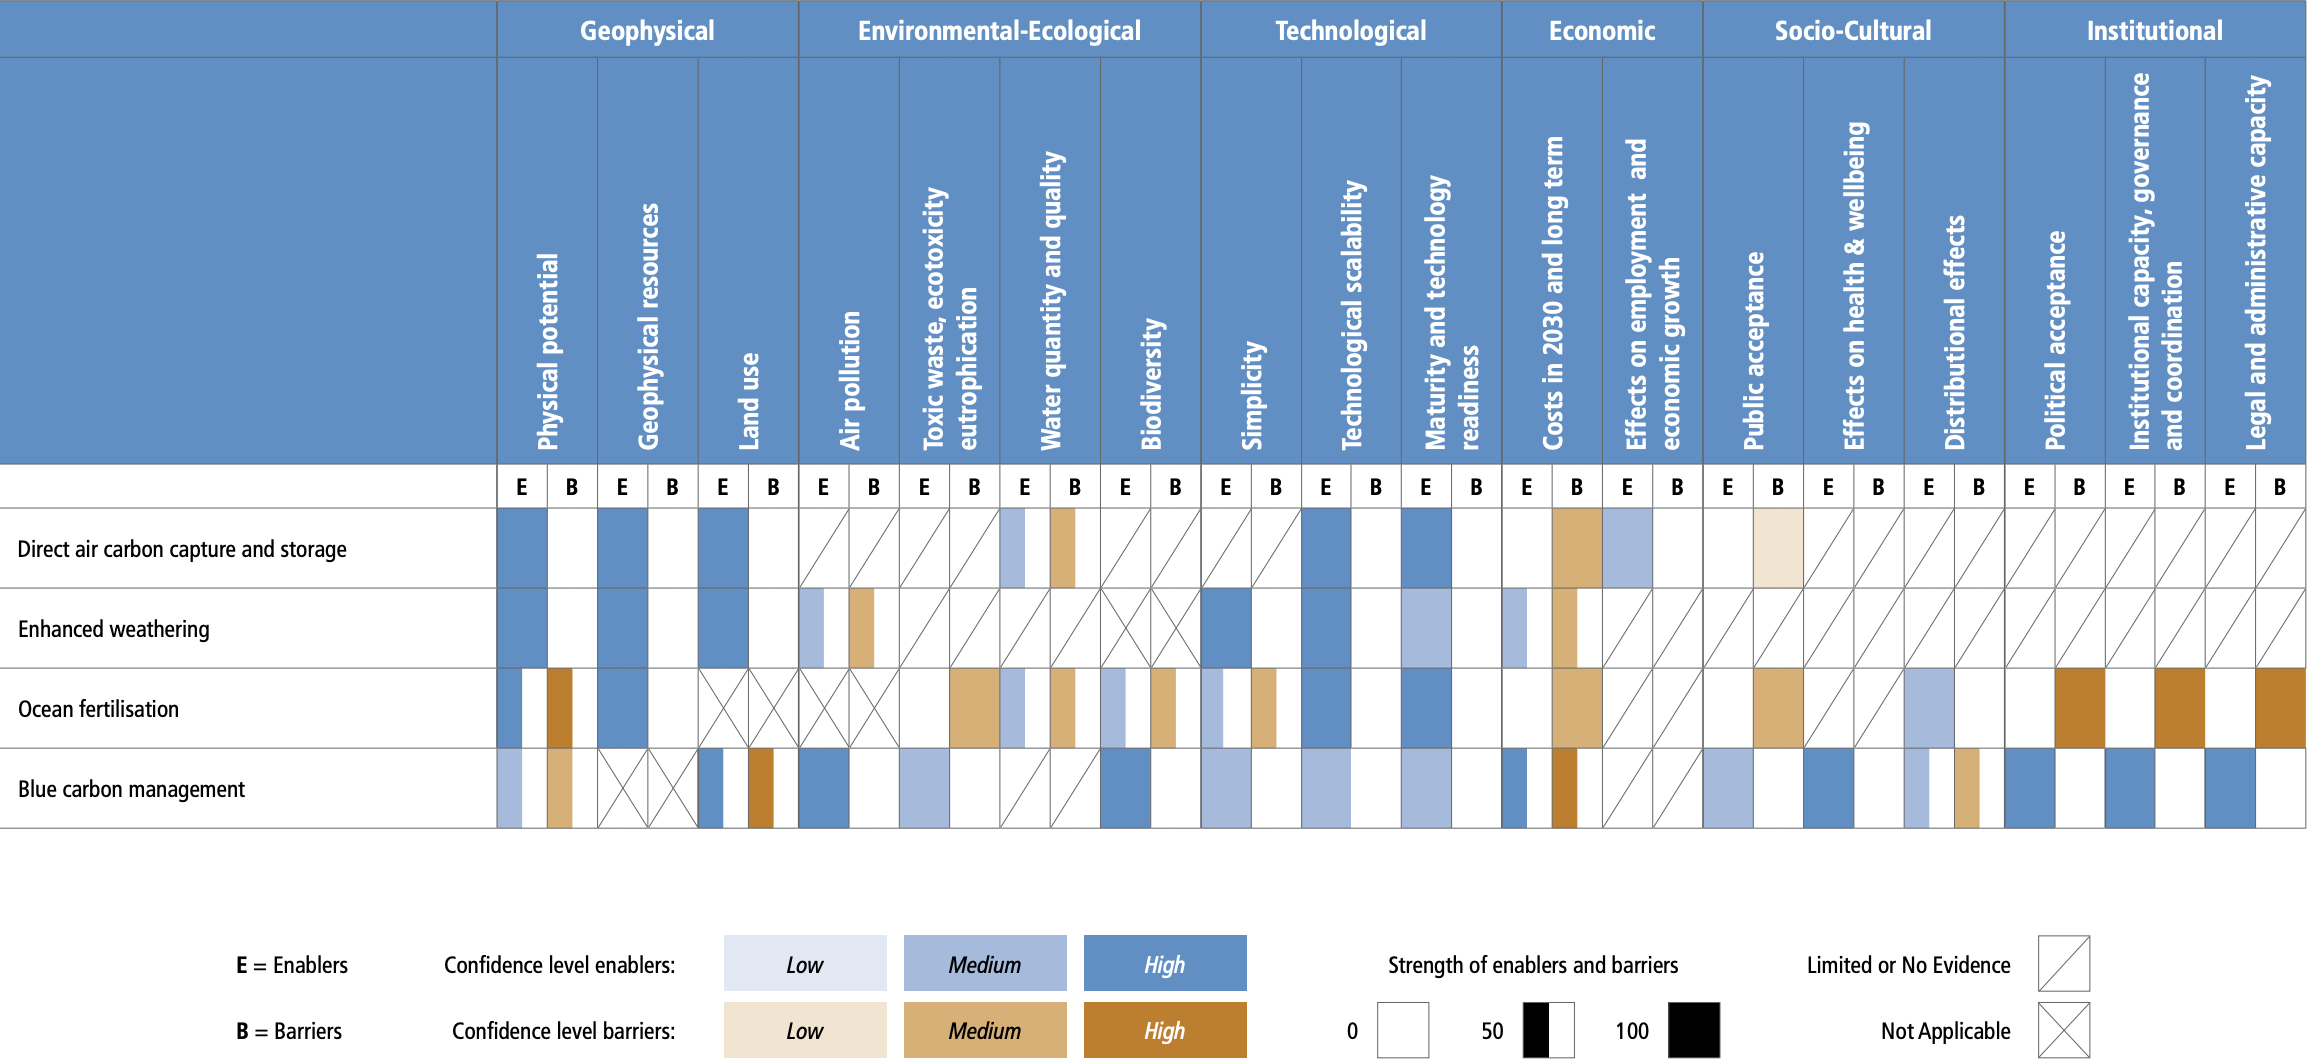
Figure 12.4 | Summary of the extent to which different factors would enable or inhibit the deployment of the carbon dioxide removal methods DACCS, EW, ocean fertilisation and blue carbon management. Blue bars indicate the extent to which the indicator enables the implementation of the CDR method (E) and orange bars indicate the extent to which an indicator is a barrier (B) to the deployment of the method, relative to the maximum possible barriers and enablers assessed. An ‘X’ signifies the indicator is not applicable or does not affect the feasibility of the method, while a forward slash indicates that there is no or limited evidence whether the indicator affects the feasibility of the method. The shading indicates the level of confidence, with darker shading signifying higher levels of confidence. Supplementary Material 12.SM.B provides an overview of the factors affecting the feasibility of CDR methods and how they differ across contexts (e.g., region), time (e.g., 2030 versus 2050), and scale (e.g., small versus large), and includes a line of sight on which the assessment is based. The assessment methodology is explained in Annex II, Part IV, Section 11.
12.3.2Consideration of Methods Assessed in Sectoral Chapters: A/R, Biochar, BECCS, Soil Carbon Sequestration
Status: BECCS, afforestation/reforestation (A/R), soil carbon sequestration (SCS) and biochar are land-based biological CDR methods (Smith et al. 2016). BECCS combines biomass use for energy with CCS to capture and store the biogenic carbon geologically (Section 6.4.2.6); A/R and SCS involve fixing atmospheric carbon in biomass and soils, and biochar involves converting biomass to biochar and using it as a soil amendment. These CDR methods can be associated with both co-benefits and adverse side effects (Smith et al. 2016; Hurlbert et al. 2019; Mbow et al. 2019; Olsson et al. 2019; Schleicher et al. 2019; Smith et al. 2019b; Babin et al. 2021; Dooley et al. 2021) (Sections 7.4 and 12.5).
Among CDR methods, BECCS and A/R are most commonly selected by IAMs to meet the requirements of scenarios that limit warming to 2°C (>67%) or lower. This is partially because of the long lead time required to refine IAMs to include additional methods and update techno-economic parameters. Currently, few IAMs represent SCS or biochar (Frank et al. 2017). Given the removal potential of SCS and biochar and some potential co-benefits, more efforts should be made to include these methods within IAMs, so that their mitigation potential can be compared to other CDR methods, along with possible co-benefits and adverse side effects (Smith et al. 2016; Rogelj et al. 2018) (Section 12.5).
Potential: The technical potential for BECCS by 2050 is estimated at 0.5–11.3 GtCO2-eq yr –1 (Table 7.3). These potentials do not include avoided emissions resulting from the use of heat, electricity and/or fuels provided by the BECCS system, which depend on substitution patterns, conversion efficiencies, and supply chain emissions for the BECCS and substituted energy systems (Box 7.7). The mitigation effect of BECCS also depends on how deployment affects land carbon stocks and sink strength (Section 7.4.4).
As detailed in Chapter 7, the technical potential for gross removals realised through A/R in 2050 is 0.5–10.1 GtCO2-eq yr –1, and for improved forest management the potential is 1–2.1 GtCO2-eq yr –1 (including both CDR and emissions reduction). Technical potential for SCS in 2050 is estimated to be 0.6–9.4 GtCO2-eq yr –1, for agroforestry it is 0.3–9.4 GtCO2-eq yr –1, and for biochar it is 0.2–6.6 GtCO2-eq yr –1. Peatland and coastal wetland restoration have a technical potential of 0.5–2.1 GtCO2-eq yr –1 in 2050, with an estimated 80% of the potential being CDR. Note that these potentials reflect only biophysical and technological conditions and become reduced when factoring in economic, environmental, socio-cultural and institutional constraints (Table 12.6).
Costs: Costs across technologies vary substantially (Smith et al. 2016) and were estimated to be USD15–400 tCO2–1 for BECSS, USD0–240 tCO2–1 for A/R, –USD45 to +USD100 tCO2–1 for SCS and USD10–345 tCO2–1 for biochar. Fuss et al. (2018) estimated abatement cost ranges for BECCS, A/R, SCS and biochar to be 100–200, 5–50, 0–100, and 30–120 tCO2-eq −1 respectively, corresponding to 2100 potentials. Ranges for economic potential (<USD100 tCO2–1) reported in Chapter 7 are 0.5–3.0 GtCO2 yr –1 (A/R); 0.6–1.9 GtCO2 yr –1 (improved forest management); 0.7–2.5 GtCO2 yr –1 (SCS); 0.4–1.1 GtCO2 yr –1 (agroforestry); 0.3–1.8 GtCO2 yr –1 (biochar); and 0.2–0.8 GtCO2 yr –1 (peatland and coastal wetland restoration).
Risks, impacts, and co-benefits: a brief summary of risks, impacts and co-benefits is provided here and more detail is provided in Chapter 7 and Section 12.5. A/R and biomass production for BECCS and biochar potentially compete for land, water and other resources, implying possible adverse outcomes for ecosystem health, biodiversity, livelihoods and food security (medium evidence, high agreement ) (Smith et al. 2016; Heck et al. 2018; Hurlbert et al. 2019; Mbow et al. 2019) (Chapter 7). SCS requires the addition of nitrogen and phosphorus to maintain stoichiometry of soil organic matter, leading to a potential risk of eutrophication (Fuss et al. 2018). Apart from possible negative effects associated with biomass supply, adverse side effects from biochar are relatively low if the biomass is uncontaminated (Tisserant and Cherubini 2019).
Possible climate risks relate to direct and/or indirect land carbon losses (A/R, BECCS, biochar), increased N2O emissions (BECCS, SCS), saturation and non-permanence of carbon storage (A/R, SCS) (Jia et al. 2019; Smith et al. 2019b) (Chapter 7), and potential CO2 leakage from deep geological reservoirs (BECCS) (Chapter 6). Land cover change associated with A/R and biomass supply for BECCS and biochar may cause albedo changes that reduce mitigation effectiveness (Fuss et al. 2018; Jia et al. 2019). Potentially unfavourable albedo change resulting from biochar use can be minimised by incorporating biochar into the soil (Fuss et al. 2018) (Chapter 7).
Concerning co-benefits, A/R and biomass production for BECCS or biochar could improve soil carbon, nutrient and water cycling (robust evidence, high agreement ), and contribute to market opportunities, employment and local livelihoods, economic diversification, energy security, and technology development and transfer (medium evidence, high agreement ) (Fuss et al. 2018) (Chapter 7). It may contribute to reduction of other air pollutants, health benefits, and reduced dependency on imported fossil fuels. A/R can improve biodiversity if native and diverse species are used (Fuss et al. 2018). For biochar, additional co-benefits include increased crop yields, reduced drought impacts, and reduced CH4 and N2O emissions from soils (Joseph et al., 2021) (Section 7.4.5.2). SCS can improve soil quality and resilience and improve agricultural productivity and food security (Frank et al. 2017; Smith et al. 2019b).
Role in mitigation pathways: Biomass use for BECCS in 2050 is 61 EJ yr –1 (13–208 EJ yr –1, 5–95th percentile range) in scenarios limiting warming to 1.5°C (>50%) with no or limited overshoot (C1, excluding traditional energy). This corresponds to 5.3 GtCO2 yr –1 (1.1–18 GtCO2 yr –1) CDR, if assuming 28 kg C GJ–1 biomass carbon content and 85% capture rate in BECCS systems. In scenarios that limit warming to 2°C (>67%) (C3), biomass use for BECCS in 2050 is 28 EJ yr –1 (0–96 EJ yr –1, 5–95th percentile range), corresponding to 2.4 GtCO2 yr –1 (0–8.3 GtCO2 yr –1) CDR. Cumulative CO2 removal from AFOLU (mainly through A/R), as reported from models, in the period 2020 to 2100 is 262 GtCO2 (17–397 GtCO2) and 209 GtCO2 (20–415 GtCO2) in C1 and C3 scenarios, respectively (5–95th percentile range).
Uncertainties remain in two main areas: the availability of land and biomass, which is affected by many factors (Anandarajah et al. 2018) (Chapter 7), and the role of other mitigation measures including CDR methods other than A/R and BECCS. Strong near-term climate change mitigation to limit overshoot, and deployment of CDR methods other than A/R and BECCS, may significantly reduce the contribution of these CDR methods in scenarios limiting warming to 1.5°C or 2°C (Köberle 2019; Hasegawa et al. 2021).
Trade-offs and spillovers: Some land-based biological CDR methods, such as BECCS and A/R, demand land. Combining mitigation strategies has the potential to increase overall carbon sequestration rates (Humpenöder et al. 2014). However, these CDR methods may also compete for resources (Frank et al. 2017). Land-based mitigation approaches currently propose the use of forests (i) as a source of woody biomass for bioenergy and various biomaterials and (ii) for carbon sequestration in vegetation, soils, and forest products. Forests are therefore required to provide both provisioning (biomass feedstock) and regulating (carbon sequestration) ecosystem services. This multifaceted strategy has the potential to result in trade-offs (Makkonen et al. 2015). Some land-based mitigation options could conflict with biodiversity goals, e.g., A/R using monoculture plantations can reduce species richness when introduced into (semi-)natural grasslands (Smith et al. 2019a; Dooley et al. 2021). When trade-offs exist between biodiversity protection and mitigation objectives, biodiversity is typically given a lower priority, especially if the mitigation option is considered risk-free and economically feasible (Pörtner et al. 2021). Approaches that promote synergies, such as sustainable forest management, reducing deforestation rates, cultivation of perennial crops for bioenergy in sustainable farming practices, and mixed-species forests in A/R, can mitigate biodiversity impacts and even improve ecosystem capacity to support biodiversity while mitigating climate change (Pörtner et al. 2021) (Section 12.5). Systematic land-use planning could help to deliver land-based mitigation options that also limit trade-offs with biodiversity (Longva et al. 2017) (Cross-Working Group Box 3: Mitigation and Adaptation via the Bioeconomy, in this chapter).
Status, costs, potentials, risk and impacts, co-benefits, trade-offs and spillover effects and the role in mitigation pathways of A/R, biochar, SCS, peatland and coastal wetland restoration, agroforestry and forest management are summarised in Table 12.6. See also Section 12.5.
12.3.3CDR Governance and Policies
As shown in Cross-Chapter Box 8 in this chapter, CDR fulfils multiple functions in different phases of ambitious mitigation: (i) further reducing net CO2 or GHG emission levels in the near term; (ii) counterbalancing residual emissions (from hard-to-transition sectors like transport, industry, or agriculture) to help reach net zero CO2 or GHG emissions in the mid term; (iii) achieving and sustaining net-negative CO2 or GHG emissions in the long term. While inclusion of emissions and removals on managed land (LULUCF) is mandatory for developed countries under UNFCCC inventory rules (Grassi et al. 2021), not all Annex I countries have included land-based biological removals when setting domestic mitigation targets in the past, but updated NDCs for 2030 indicate a shift, most notably in the European Union (Gheuens and Oberthür 2021; Schenuit et al. 2021). The early literature on CDR governance and policy has been mainly conceptual rather than empirical, focusing on high-level principles (see the concerns listed in the introduction to Section 12.3) and the representation of CDR in global mitigation scenarios (Section 3.2.2). However, with the widespread adoption of net zero targets and the recognition that CDR is a necessary element of mitigation portfolios to achieve net zero CO2 or GHG emissions, countries with national net-zero emissions targets have begun to integrate CDR into modelled national mitigation pathways, increase research, development and demonstration (RD&D) efforts on CDR methods, and consider CDR-specific incentives and policies (Honegger et al. 2021b; Schenuit et al. 2021) (Box 12.1). Nevertheless, this increasing consideration of CDR has not yet extended to net-negative targets and policies to achieve these. While the use of CDR at levels that would lead to net negative CO2 or GHG emissions in the long term has been assumed in most global mitigation scenarios that limit warming to 1.5°C, net-negative emissions trajectories and BECCS as the main CDR method modelled to achieve these have not been mirrored by corresponding UNFCCC decisions so far (Fridahl 2017; Mohan et al. 2021). Likewise, only a few national long-term mitigation plans or legal acts entail a vision for net-negative GHG emissions (Buylova et al. 2021), for example Finland, Sweden, Germany and Fiji.
For countries with emissions targets aiming for net zero or lower, the core governance question is not whether CDR should be mobilised or not, but which CDR methods governments want to see deployed by whom, by when, at which volumes and in which ways (Minx et al. 2018; Bellamy and Geden 2019). The choice of CDR methods and the scale and timing of their deployment will depend on the respective ambitions for gross emissions reductions, how sustainability and feasibility constraints are managed, and how political preferences and social acceptability evolve (Bellamy 2018; Forster et al. 2020; Fuss et al. 2020; Waller et al. 2020; Clery et al. 2021; Iyer et al. 2021; Rogelj et al. 2021). As examples of emerging CDR policymaking at (sub-)national levels show, policymakers are beginning to incorporate CDR methods beyond those currently dominating global mitigation scenarios, that is, BECCS and afforestation/reforestation (Bellamy and Geden 2019; Buylova et al. 2021; Schenuit et al. 2021; Uden et al. 2021) (Box 12.1). CDR policymaking is faced with the need to consider method-specific timescales of CO2 storage, as well as challenges in MRV and accounting, potential co-benefits, adverse side effects, interactions with adaptation and trade-offs with SDGs (Dooley and Kartha 2018; McLaren et al. 2019; Buck et al. 2020; Honegger et al. 2020; Brander et al. 2021; Dooley et al. 2021; Mace et al. 2021) (Table 12.6). Therefore, CDR governance and policymaking are expected to focus on responsibly incentivising RD&D and targeted deployment, building on both technical and governance experience with already widely practised CDR methods like afforestation/reforestation (Lomax et al. 2015; Field and Mach 2017; Bellamy 2018; Carton et al. 2020; VonHedemann et al. 2020), as well as learning from two decades of slow-moving CCS deployment (Buck 2021; Martin-Roberts et al. 2021; Wang et al. 2021). For some less well-understood methods and implementation options, such as ocean alkalinisation or enhanced weathering, investment in RD&D can help in understanding the risks, rewards, and uncertainties of deployment (Nemet et al. 2018; Fajardy et al. 2019; Burns and Corbett 2020; Goll et al. 2021).
Box 12.1 | Case Study: Emerging CDR Policy, Research and Development in theUnited Kingdom
Climate change mitigation policies in the UK have been motivated since 2008 by a domestic, legally-binding framework. This framework includes a 2050 target for net zero greenhouse gas emissions, interim targets and an independent advisory body called the Climate Change Committee (Muinzer 2019). It has led successive UK governments to publish mitigation plans to 2050, causing policy to be more forward looking (Averchenkova et al. 2021).
The UK’s targets include emissions and removals from LULUCF. In 2008 the target for 2050 was an economy-wide net emissions reduction of at least 80% below 1990 levels. Even the first government plans to achieve this target proposed deployment of removal methods, specifically afforestation and wood in construction, increased soil carbon and BECCS (HM Government 2011).
Box 12.1
Adoption of the Paris Agreement in 2015 caused the government to change the legislated 2050 target to a reduction of at least 100% (i.e., net zero). Since then, removal of CO2 and other greenhouse gases has received greater prominence as a distinct topic. The most recent national plan (published October 2021) proposes deployment not only of the methods mentioned above, but also DACCS, biochar and enhanced weathering. The government has committed to amend accounting of UK targets to include a wider range of removal methods beyond LULUCF, and set a target of 5 MtCO2 yr –1 from methods such as BECCS, DACCS and enhanced weathering by 2030. It is consulting on markets and incentives for deployment, and exploring new requirements for MRV (HM Government 2021).
In parallel to these policy developments, the UK funds research into technical, environmental and social aspects of removal (Lezaun et al. 2021). Research on some elements (e.g., forestry, CCS, soils, bioenergy) have been funded for well over a decade, but the first programme dedicated to greenhouse gas removal ran during 2017–2021. This has been followed by two new programmes with greater focus on demonstration, totalling GBP100 million over four years (HM Government 2021). A wide variety of methods is supported in these programmes, covering approaches such as CO2 capture from seawater and capture of methane from cattle, in addition to those included already in national mitigation scenarios.
Deployment of removal methods has lagged behind expectations, as national targets for tree planting are not being met and infrastructure for CO2 transport and storage is not yet in place (Climate Change Committee 2021). While public awareness around carbon removal is low, studies indicate support in general, provided it is perceived as enhancing rather than impeding action to reduce emissions (Cox et al. 2020a).
Since the enhancement of carbon sinks is a form of climate change mitigation (Honegger et al. 2021a), CDR governance challenges will in many respects be similar to those around emissions reduction measures, as will policy instruments like RD&D funding, carbon pricing, tax or investment credits, certification schemes, and public procurement (Sections 13.4, 13.6, 14.4 and 14.5). Effectively integrating CDR into mitigation portfolios can build on already existing rules, procedures and instruments for emissions abatement (Torvanger 2019; Fridahl et al. 2020; Zakkour et al. 2020; Honegger et al. 2021b; Mace et al. 2021; Rickels et al. 2021). Additionally, to accelerate RD&D and to incentivise CDR deployment, a political commitment to formal integration into existing climate policy frameworks is required (robust evidence, high agreement ) (Lomax et al. 2015; Geden et al. 2018; Honegger and Reiner 2018; VonHedemann et al. 2020; Schenuit et al. 2021). To avoid CDR being misperceived as a substitute for deep emissions reductions, the prioritisation of emissions cuts can be signalled and achieved with differentiated target setting for reductions and removals (Geden et al. 2019; McLaren et al. 2019). Similarly, sub-targets are conceivable for different types of CDR, to prioritise preferred methods according to characteristics such as removal processes or timescales of storage (Smith 2021).
IPCC guidance on quantifying removals is available for land-based biological CDR methods (IPCC 2006, 2019), but has yet to be developed for other CDR methods (Royal Society and Royal Academy of Engineering 2018). Challenges with development of estimation algorithms, data collection, and attribution between sectors and countries will need to be overcome (Luisetti et al. 2020; Wedding et al. 2021). Trusted methodologies for MRV, required to enable private sector participation. will need to address the permanence, leakage, and saturation challenges with land- and ocean-based biological methods (Mace et al. 2021). Protocols that also capture social and ecological co-benefits could encourage the adoption of biological CDR methods such as SCS, biochar, A/R and blue carbon management (robust evidence, high agreement ) (VonHedemann et al. 2020; Macreadie et al. 2021).
Private capital and companies, impact investors, and philanthropy will play a role in technical demonstrations and bringing down costs, as well as creating demand for carbon removal products on voluntary markets, which companies may purchase to fulfil corporate social responsibility-driven targets (Friedmann 2019; Fuss et al. 2020; Joppa et al. 2021). Niche markets can provide entry points for limited deployment of novel CDR methods (Cox and Edwards 2019), but targeting currently existing revenue streams by using CO2 captured from the atmosphere in Enhanced Oil Recovery and other utilisation routes (Mackler et al. 2021; Meckling and Biber 2021) is contested, and highlights the importance of choosing appropriate system boundaries when assessing supply chains (Tanzer and Ramírez 2019; Brander et al. 2021). While the private sector will play a distinct role in scaling CDR, governments will need to commit to developing infrastructure for the transport and storage of CO2, including financing, permitting, and regulating liabilities (Sanchez et al. 2018; Mace et al. 2021; Mackler et al. 2021).
International governance considerations include global technology transfer around CDR implementation options (Batres et al. 2021); land use change that could affect food production and land condition and cause conflict around land tenure and access (Dooley and Kartha 2018; Hurlbert et al. 2019; Milne et al. 2019); and efforts to create sustainable and just supply chains for CDR (Fajardy and Mac Dowell 2020; Tan et al. 2021), such as resources used for BECCS, enhanced weathering, or ocean alkalinisation. International governance would be particularly important for methods posing transboundary risks, especially for ocean-based methods. Specific regulations have so far only been developed in the context of the London Protocol, an international treaty that explicitly regulates ocean fertilisation and allows parties to govern other marine CDR methods like ocean alkalinity enhancement (GESAMP 2019; Burns and Corbett 2020; Boettcher et al. 2021) (Section 14.4.5).
Engagement of civil society organisations and publics will be important for shaping CDR policy and deployment (medium evidence, high agreement ). Public awareness of CDR and its role in national net zero emissions strategies is generally very low (Cox et al. 2020a), and perceptions differ across countries and between methods (Bertram and Merk 2020; Spence et al. 2021; Sweet et al. 2021; Wenger et al. 2021). When awareness increases, social processes will shape political attitudes on CDR (Shrum et al. 2020), as will efforts to frame particular CDR methods as ‘natural’ or ‘technological’ (Osaka et al. 2021), and the policy instruments chosen to support CDR (Bellamy et al. 2019). Lack of confidence in CDR implementation options from both publics and investors, and lack of trust in project developers (Cox et al. 2020b) have hampered support for CCS (Thomas et al. 2018) and are expected to affect deployment of CDR methods with geological storage (Gough and Mander 2019). On local and regional scales, CDR projects will need to consider air and water quality, impacts to human health, energy needs, land use and ecological integrity, and local community engagement and procedural justice. Bottom-up and community-driven strategies are important for deploying equitable carbon removal projects (Batres et al. 2021; Hansson et al. 2021).
12.4Food systems
12.4.1Introduction
This section complements Chapter 7 by reviewing recent estimates of food system emissions and assessing options beyond the agriculture, forestry and land use sectors to mitigate food systems GHG emissions. A food system approach enables identification of cross-sectoral mitigation opportunities including both technological and behavioural options. Further, a system approach permits evaluation of policies that do not necessarily directly target primary producers or consumers, but other food system actors, with possibly higher mitigation efficiency. A food system approach was introduced in the IPCC Special Report on Climate Change and Land (SRCCL) (Mbow et al. 2019). Besides major knowledge gaps in the quantification of food system GHG emissions (Section 12.4.2), the SRCCL authors identified as major knowledge gaps the understanding of the dynamics of dietary change (including behavioural patterns, the adoption of plant-based dietary patterns, and interaction with human health and nutrition of sustainable healthy diets and associated feedbacks); and instruments and mechanisms to accelerate transitions towards sustainable and healthy food systems.
Sufficient food and adequate nutrition are fundamental human needs (HLPE 2020; Ingram 2020). Food needs to be grown and processed, transported and distributed, and finally prepared and consumed. Food systems range from traditional, involving only few people and short supply chains, to modern food systems, comprising complex webs involving large numbers of stakeholders and processes that grow and transform food commodities into food products and distribute them globally (Gómez and Ricketts 2013; HLPE 2017). A ‘food system’ includes all food chain activities (production, processing, distribution, preparation, consumption of food) and the management of food loss and wastes. It also includes institutions and infrastructures influencing any of these activities, as well as people and systems impacted (HLPE 2017; FAO 2018a). Food choices are determined by the food environment, consisting of the ‘physical, economic, political and socio-cultural context in which consumers engage with the food system to acquire, prepare and consume food’ (HLPE 2017). Food system outcomes encompass food and nutrition, productivity, profit and livelihood of food producers and other actors in food value chains, but also social outcomes and the impact on the environment (Zurek et al. 2018). ‘Sustainable healthy diets’ have been defined by FAO and WHO (FAO and WHO 2019) as ‘dietary patterns that promote all dimensions of individuals’ health and wellbeing; have low environmental pressure and impact; are accessible, affordable, safe and equitable; and are culturally acceptable’.
The SRCCL estimated overall global anthropogenic emissions from food systems to range between 10.8 and 19.1 GtCO2-eq yr –1, equivalent to 21–37% of total anthropogenic emissions (Mbow et al. 2019; Rosenzweig et al. 2020a). The authors identified major knowledge gaps for the GHG emissions inventories of food systems, particularly in providing disaggregated emissions from the food industry and transportation. The food system approach taken in the SRCCL (Mbow et al. 2019) evaluates the synergies and trade-offs of food system response options and their implications for food security, climate change adaptation and mitigation. This integrated framework allows the identification of fundamental attributes of responses to maximise co-benefits, while avoiding maladaptation measures and adverse side effects. A food system approach supports the design of interconnected climate policy responses to tackle climate change, incorporating perspectives of producers and consumers. The SRCCL (Mbow et al. 2019) found that the technical mitigation potential by 2050 of demand-side responses at 0.7–8.0 GtCO2-eq yr –1 is comparable to supply-side options at 2.3–9.6 GtCO2-eq yr –1. This shows that mitigation actions need to go beyond food producers and suppliers to incorporate dietary changes and consumers’ behavioural patterns and reveals that producers and consumers need to work together to reduce GHG emissions.
Though total production of calories is sufficient for the world population (Wood et al. 2018; Benton et al. 2019), availability and access to food is unequally distributed, and there is a lack of nutrient-dense foods, fruit and vegetables (Berners-Lee et al. 2018; KC et al. 2018). In 2019, close to 750 million people were food insecure. An estimated 2 billion people lacked adequate access to safe and nutritious food in both quality and quantity (FAO et al. 2020). Two billion adults are overweight or obese through inadequate nutrition, with an upward trend globally (FAO et al. 2019). Low intake of fruit and vegetables is further aggravated by high intake rates of refined grains, sugar and sodium, together leading to a high risk of non-communicable diseases such as cardiovascular disease and type 2 diabetes (Springmann et al. 2016; Clark et al. 2018; Clark et al. 2019; GBD 2017 Diet Collaborators et al. 2019; Willett et al. 2019) (robust evidence, high agreement ). At least 340 million children under five years of age experience lack of vitamins or other essential bio-available nutrients, including almost 200 million suffering from stunting, wasting or overweight (UNICEF 2019).
Bodirsky et al. (2020) find that the global prevalence of overweight will increase to 39–52% of world population in 2050 (from 29% in 2010; range across the Shared Socio-economic Pathways studied), and the prevalence of obesity to 13–20% (9% in 2010). The prevalence of underweight people was predicted to approximately halve, with absolute numbers stagnating at 0.4–0.7 billion. Although many studies represent future pathways of diets and food systems, there are few holistic and consistent narratives and quantification of the future pathways of diets and food systems (Mitter et al. 2020; Mora et al. 2020). Alternative pathways for improved diets and food systems have been developed, emphasising climate, environmental and health co-benefits (Bajželj et al. 2014; Hedenus et al. 2014; Damerau et al. 2016; Weindl et al. 2017a; Weindl et al. 2017b; Springmann et al. 2018a; Bodirsky et al. 2020; Prudhomme et al. 2020; Hamilton et al. 2021), reduced food waste and closing yield gaps (Bajželj et al. 2014; Pradhan et al. 2014), nitrogen management (Bodirsky et al. 2014), urban and peri-urban agriculture (Kriewald et al. 2019) and different sustainability targets (Henry et al. 2018b). The UN Food and Agriculture Organization (FAO) has examined three alternative food system scenarios: ‘business as usual’, ‘towards sustainability’, and ‘stratified societies’ (FAO 2018b). Others have identified research priorities or changes in legislation needed to support adoption of improved food systems (Mylona et al. 2018).
Malnutrition aggravates susceptibility of children to various infectious diseases (França et al. 2009; Farhadi and Ovchinnikov 2018), and infectious diseases can also decrease nutrient uptake, thereby promoting malnutrition (Farhadi and Ovchinnikov 2018). Contamination of food with bacteria, viruses, parasites and microbial toxins can cause foodborne illnesses (Ricci et al. 2017; Abebe et al. 2020; Gallo et al. 2020), foodborne substances such as food additives and specific proteins can cause adverse reactions, and contamination with toxic chemical substances used in agriculture and food processing can lead to poisoning or chronic diseases (Gallo et al. 2020). Further, health risks from food systems may originate from the use of antibiotics in livestock production and the occurrence of anti-microbial resistance in pathogens (ECDC et al. 2015; Bennani et al. 2020), or zoonotic diseases such as COVID-19 (Gan et al. 2020; Patterson et al. 2020; Vågsholm et al. 2020).
Modern food systems are highly consolidated, through vertical and horizontal integration (Swinnen and Maertens 2007; Folke et al. 2019). This consolidation has led to uneven distribution of power across the food value chain, with influence concentrated among a few actors in the post-farmgate food supply chain (e.g., large food processors and retailers), and has contributed to a loss of indigenous agriculture and food systems, for example on Pacific Islands (Vogliano et al. 2020). While agricultural producers contribute a higher proportion of GHG emissions compared with other actors in the supply chain, they have relatively little power to change the system (Clapp 2019; Group of Chief Scientific Advisors 2020; Leip et al. 2021).
In 2016, the agriculture, fisheries, and forestry sectors employed 29% of working people; employment within these sectors was 4% in developed countries, down from 9% in 1995, and 57% in least developed countries, down from 71% in 1995 (World Bank 2021). Employment in other (non-agriculture) food system sectors, such as the food processing industry and service sectors, differs between food systems. The share of total non-farm food system employment ranges from 10% in traditional food systems (e.g., sub-Saharan Africa), to over 50% in food systems in transition (e.g., Brazil), to high shares (80%) in modern food systems (e.g., US) (Townsend et al. 2017). The share of the food expenditures that farmers receive is decreasing; at the global level, this share has been estimated at 27% in 2015 (Yi et al. 2021).
12.4.2GHG Emissions from Food Systems
12.4.2.1 Sectoral Contribution of GHG Emissions from Food Systems
New calculations using the EDGAR v6.0 (Crippa et al. 2021a) and FAOSTAT (FAO 2021) databases provide territorial-based food system GHG emissions by country globally for the period 1990 to 2018 (Crippa et al. 2021b). The data are calculated based on a combination of country-specific data and aggregated information as described byCrippa et al. (2021b) and Tubiello et al. (2021). The data show that, in 2018, 17 GtCO2-eq yr –1 (95% confidence range 13–23GtCO2-eq yr –1, calculated according to Solazzo et al. (2020)) were associated with the production, processing, distribution, consumption of food and management of food system residues. This corresponded to 31% (range 23–42%) of total anthropogenic GHG emissions of 54 GtCO2-eq yr –1. Based on the IPCC sectoral classification (Table 12.7 and Figure 12.5), the largest contribution of food systems GHG emissions in 2018 was from agriculture, that is, livestock and crop production systems (6.3 GtCO2-eq yr –1, range 2.6–11.9) and land use, land use change and forestry (LULUCF) (4.0 GtCO2-eq yr –1, range 2.1–5.9) (Figure 12.5). Emissions from energy use were 3.9 GtCO2-eq yr –1 (3.6–4.4) , waste management 1.7 GtCO2-eq yr –1 (0.9–2.6), and industrial processes and product use 0.9 GtCO2-eq yr –1 (0.6–1.1). The share of GHG emissions from food systems generated outside the AFOLU (agriculture and LULUCF) sectors has increased over recent decades, from 28% in 1990 to 39% in 2018.
Table 12.7| GHG emissions from food systems by sector according to IPCC classification in Mt gas yr–1and food systems’ share of total anthropogenic GHG emissions in1990 and 2015.
Sector | CO2 | CH4 | N2O | F-gases | GHG | CO2 | CH4 | N2O | F-gases | GHG |
Emissions (Mt gas yr–1) | Share of total sectoral emissions (%) | |||||||||
1990 | ||||||||||
1 Energy | 2212 | 10 | 0 | – | 2583 | 10.5 | 10.2 | 26.7 | – | 10.7 |
2 Industrial processes | 190 | 0 | 0 | 0 | 263 | 14.5 | 0 | 38 | 4.8 | 16.2 |
3 Solvent and Other Product Use | 0 | – | – | – | 0 | 0.2 | – | – | – | 0.2 |
4 Agriculture | 102 | 142 | 5 | – | 5370 | 100 | 100 | 99.2 | – | 99.8 |
5 LULUCF | 4946 | – | 0 | – | 5080 | 181 | – | 194 | – | 182 |
6 Waste | 3 | 40 | 0 | – | 1155 | 29 | 72.4 | 99.1 | – | 73.2 |
Total | 7453 | 192 | 6 | 0 | 14452 | 29.3 | 65.2 | 84.5 | 4.8 | 40.3 |
Total (MtCO2-eq yr–1) | 7453 | 5243 | 1755 | 0 | 14452 | 29.3 | 63.9 | 84.5 | 0.3 | 40.3 |
2015 | ||||||||||
1 Energy | 3449 | 13 | 0 | – | 3927 | 10.1 | 9.5 | 24.1 | – | 10.2 |
2 Industrial processes | 242 | 0 | 0 | 0 | 881 | 7.9 | 0 | 28.6 | 58 | 20.1 |
3 Solvent and Other Product Use | 7 | – | – | – | 7 | 4.1 | – | – | – | 3.6 |
4 Agriculture | 140 | 161 | 7 | – | 6326 | 100 | 100 | 99.1 | – | 99.7 |
5 LULUCF | 3823 | – | 1 | – | 3982 | 190 | – | 229 | – | 191 |
6 Waste | 5 | 58 | 0 | – | 1699 | 30.6 | 71.8 | 99.1 | – | 72.9 |
Total | 7666 | 231 | 8 | 0 | 16821 | 19.3 | 61.6 | 83.7 | 58 | 31.1 |
Total (MtCO2-eq yr–1) | 7666 | 6317 | 2256 | 581 | 16821 | 19.3 | 60.2 | 83.7 | 53.6 | 31.1 |
Notes: Agricultural emissions include the emissions from the whole sector; biomass production for non-food use currently not differentiated. Non-food system AFOLU emissions are negative (that is, a net carbon sink), therefore the share of AFOLU food system emissions is >100. Source: EDGARv6 (Crippa et al. 2019; Crippa et al. 2021b), and FAOSTAT (FAO 2021). LULUCF: land use, land-use change and forestry.
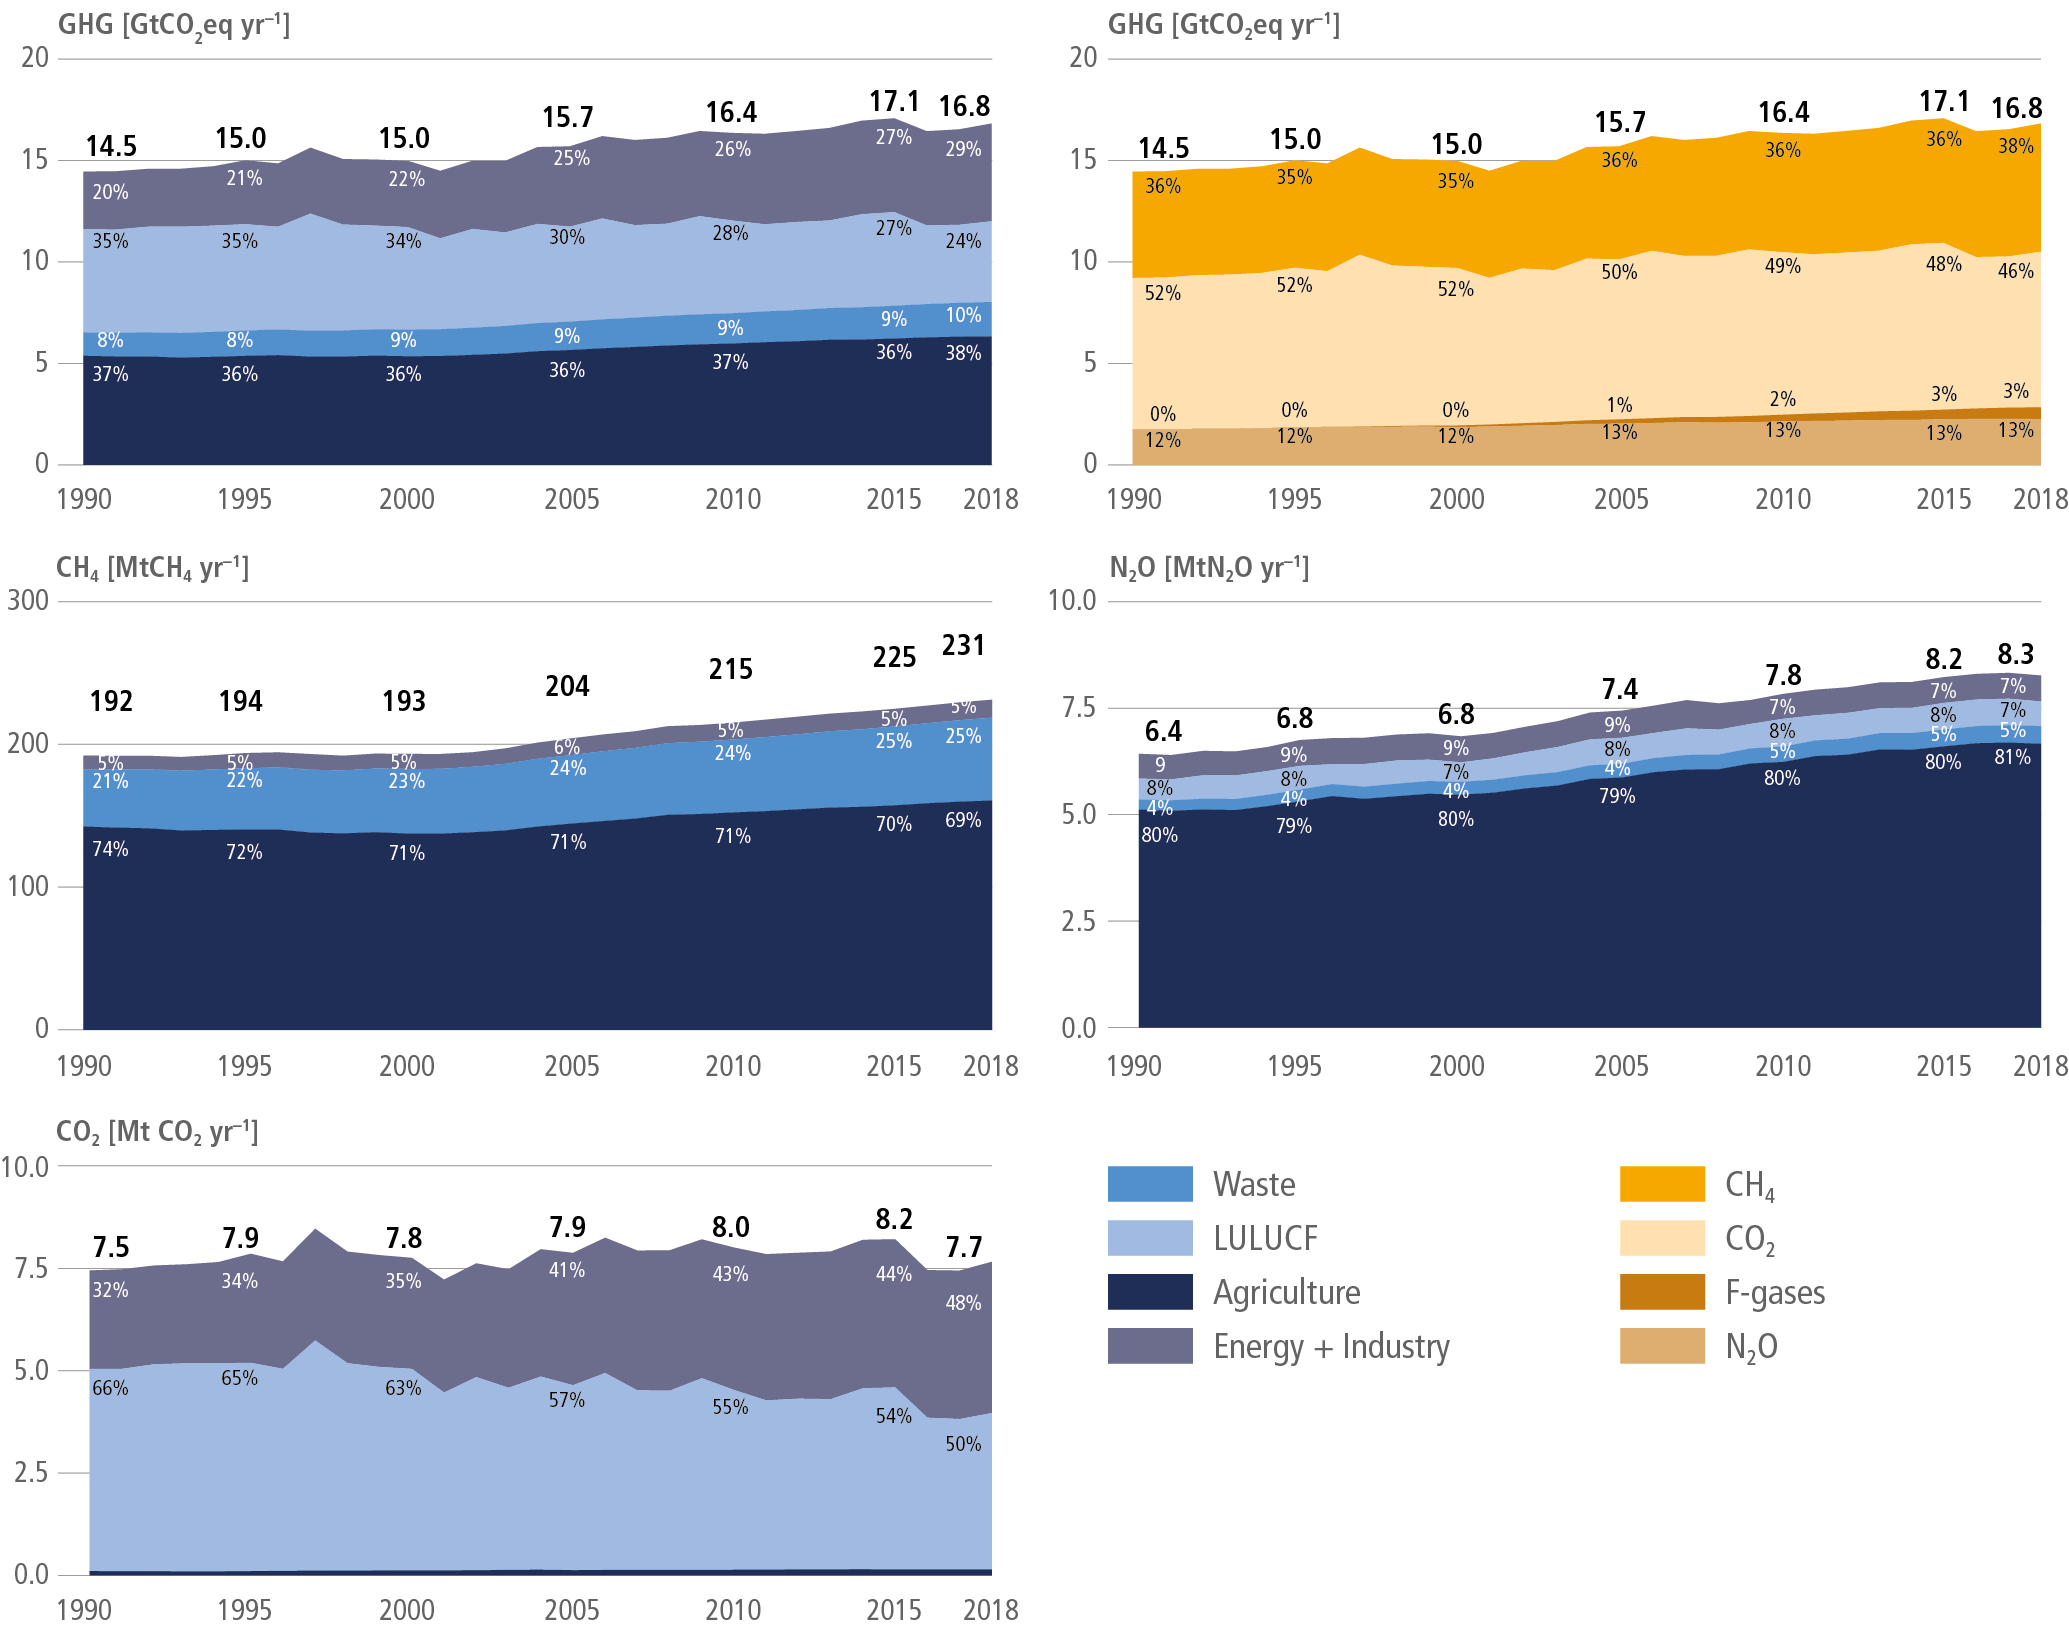
Figure 12.5 | Food system GHG emissions from the agriculture, LULUCF, waste, and energy & industry sectors. Source: Crippa et al. (2021b).
Energy: Emissions from energy use occur throughout the food supply chain. In 2018, the main contributions came from energy industries supplying electricity and heat (970 MtCO2-eq yr –1), manufacturing and construction (920 MtCO2-eq yr –1, of which 29% was attributable to the food, beverage, and tobacco industry), and transport (760 MtCO2-eq yr –1). These emissions were almost entirely as CO2. Energy emissions from forestry and fisheries amounted to 480 MtCO2-eq yr –1, with 91% of emissions as CO2. Emissions from residential and commercial fuel combustion contributed 250 MtCO2-eq yr –1 (79% of emissions as CO2, and with emissions of 1.7 MtCH4 yr –1) and 130 MtCO2-eq yr –1 (with 98% of emissions as CO2), respectively.
Refrigeration uses an estimated 43% of energy in the retail sector (Behfar et al. 2018) and significantly increases fuel consumption during distribution. Besides being energy intensive, supermarket refrigeration also contributes to GHG emissions through leakage of refrigerants (fluorinated gases, or F-gases), although their contribution to food system GHG emissions is estimated to be minor (Crippa et al. 2021b). The cold chain accounts for approximately 1% of global GHG emissions, but as the volume of refrigerators per capita in developing countries is reported to be one order of magnitude lower than in developed countries (19 m 3 versus 200 m 3 refrigerated storage capacity per 1000 inhabitants), the importance of refrigeration to total GHG emissions is expected to increase (James and James 2010). Although refrigeration gives rise to GHG emissions, both household refrigeration and effective cold chains could contribute to a substantial reduction in losses of perishable food and thus in emissions associated with food provision (University of Birmingham 2018; James and James 2010). A trade-off exists between reducing food waste and increased refrigeration emissions, with the benefits depending on type of produce, location and technologies used (Sustainable Cooling for All 2018; Wu et al. 2019).
Transport has overall a minor importance for food system GHG emissions, with a share of 5% to 6% (Poore and Nemecek 2018; Crippa et al. 2021b). The largest contributor to food system transport GHG emissions was road transport (92%), followed by marine shipping (4%), rail (3%), and aviation (1%). Only looking at energy needs, air or road transport consumes one order of magnitude higher energy (road: 70–80 MJ t –1 km –1; aviation: 100–200 MJ t –1 km –1) than marine shipping (10–20 MJ t –1 km –1) or rail (8–10 MJ t –1 km –1) (FAO 2011). For specific food products with high water content, relatively low agricultural emissions and high average transport distances, the share of transport in total GHG emissions can be over 40% (e.g., bananas, with total global average GHG emissions of 0.7 kgCO2-eq kg –1) (Poore and Nemecek 2018), but transport is a minor source of GHG emissions for most food products (Poore and Nemecek 2018).
Industry: Direct industrial emissions associated with food systems are generated by the refrigerants industry (580 MtCO2-eq yr –1 as F-gases) and the fertiliser industry for ammonia production (280 MtCO2-eq yr –1 as CO2) and nitric acid (60 MtCO2-eq yr –1 as N2O). The industry sector data account for CO2 stored in urea (–50 MtCO2-eq yr –1). Packaging contributed about 6% of total food system emissions (0.98 GtCO2-eq yr –1, 91% as CO2, with CH4 emissions of 2.8 Mt CH4 yr –1). Major emissions sources are pulp and paper (60 MtCO2-eq yr –1) and aluminium (30 MtCO2-eq yr –1), with ferrous metals, glass, and plastics making a smaller contribution. High shares of emissions from packaging are found for beverages and some fruit and vegetables (Poore and Nemecek 2018).
Waste: Management of waste generated in the food system (including food waste, wastewater, packaging waste, etc.) leads to biogenic GHG emissions, and contributed 1.7 GtCO2-eq yr –1 to food systems’ GHG emissions in 2018. Of these emissions, 55% were from domestic and commercial wastewater (30 MtCH4 yr –1 and 310 ktN2O yr –1), 36% from solid waste management (20 MtCH4 yr –1 and 310 ktN2O yr –1), and 8% from industrial wastewater (4 MtCH4 yr –1 and 80 ktN2O yr –1). Emissions from waste incineration and other waste management systems contributed 1%.
12.4.2.2GHG Intensities of Food Commodities
There is high variability in the GHG emissions of different food products and production systems (Figure 12.6). GHG emissions intensities – measured using attributional lifecycle assessment, considering the full supply chain, expressed as CO2-eq per kg of product or per kg of protein – are generally highest for ruminant meat, cheese, and certain crustacean species (e.g., farmed shrimp and prawns, trawled lobster) (Nijdam et al. 2012; Clark and Tilman 2017; Clune et al. 2017; Hilborn et al. 2018; Poore and Nemecek 2018) (robust evidence, high agreement ). Generally, beef from dairy systems has a lower footprint (8–23 kgCO2-eq per 100 g protein than beef from beef herds (17–94 kgCO2-eq per 100 g protein (Figure 12.6, re-calculated from Poore and Nemecek (2018) using AR6 GWPs based on a 100year horizon) (medium evidence, high agreement ). The wide variation in emissions from beef reflects differences in production systems, which range from intensive feedlots with stock raised largely on grains through to rangeland and transhumance production systems. Dairy systems are generally more intensive production systems, with higher digestibility feed than beef systems. Further, emissions from dairy systems are shared between milk and meat, which brings GHG footprints of beef from dairy herds closer to those of meat from monogastric animals, with emissions intensities of pork (4.4–13 kgCO2-eq per 100 g protein) and poultry meat (2.3–11 kgCO2-eq per 100 g protein) (Poore and Nemecek 2018).
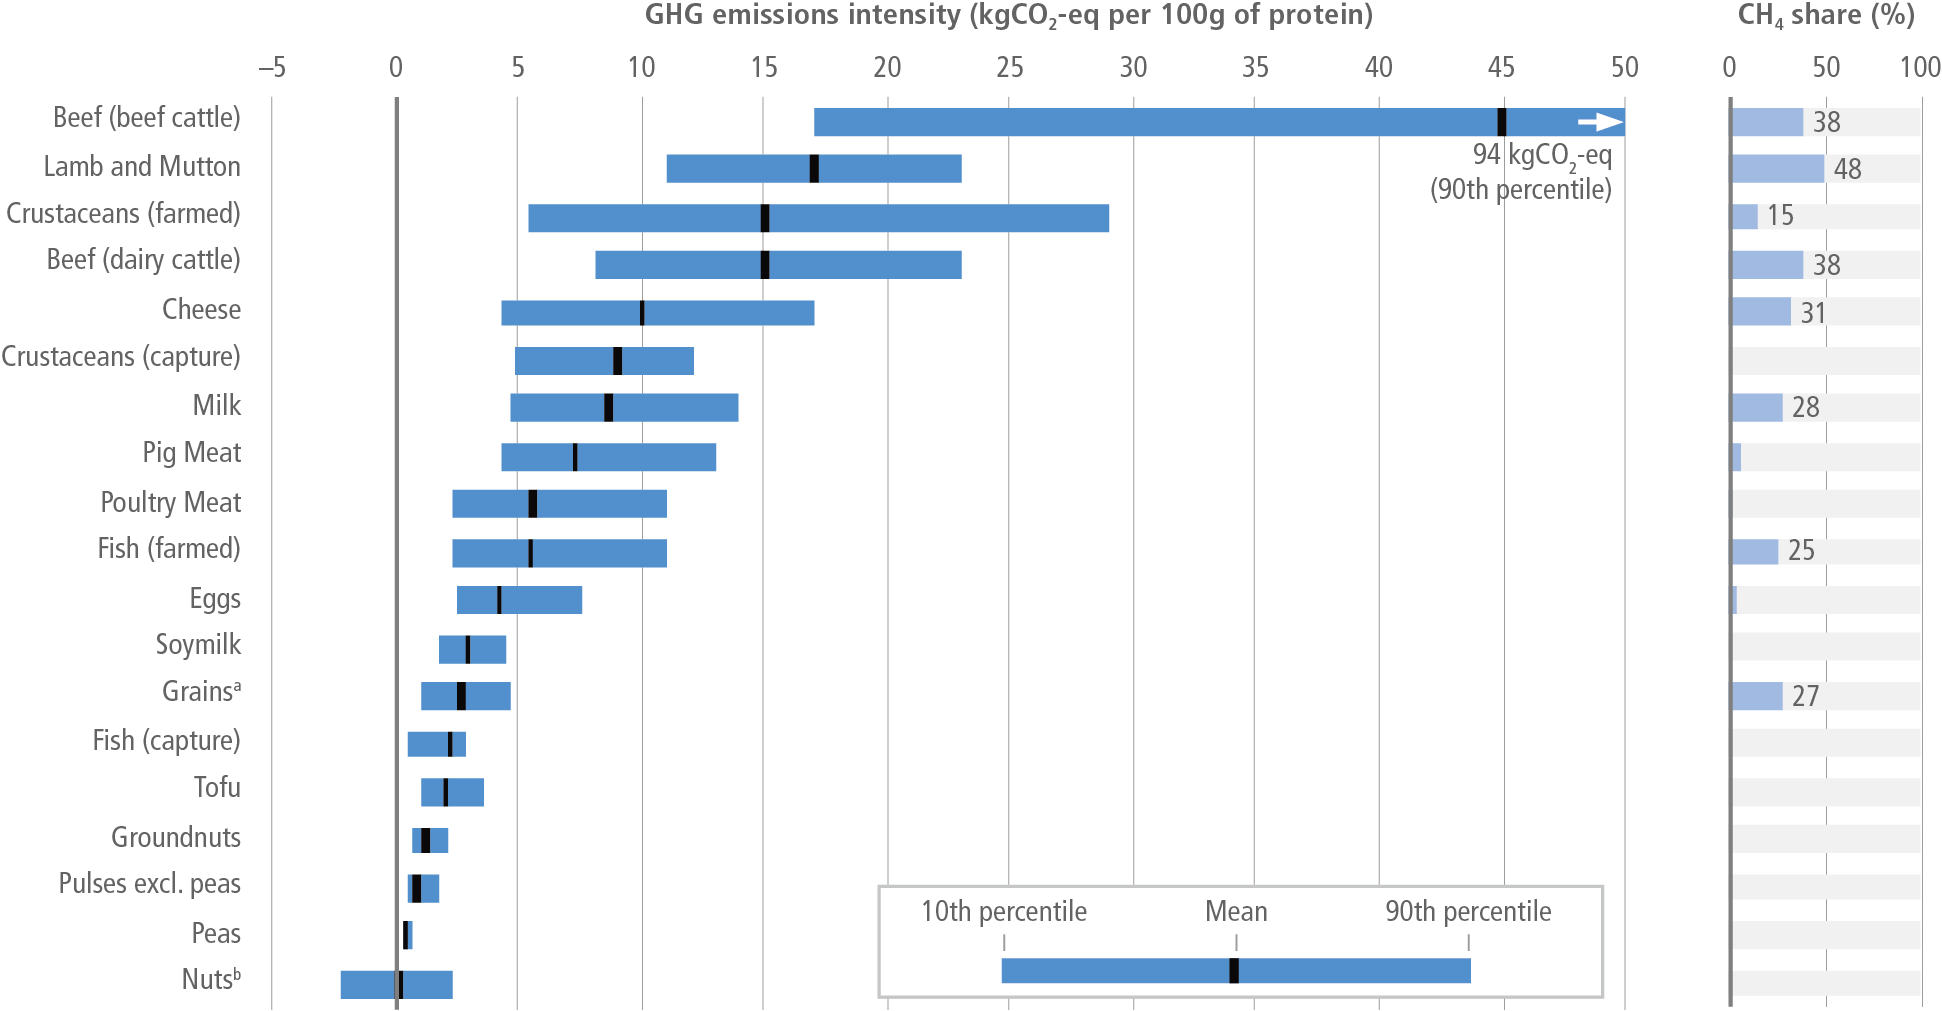
Figure 12.6 | Ranges of GHG intensities [kgCO2-eq per 100 g protein, 10–90thpercentile] in protein-rich foods, quantified via a meta-analysis of attributional lifecycle assessment studies using economic allocation. Aggregation of CO2, CH4, and N2O emissions in Poore and Nemecek (2018) updated to use AR6 100-year GWP. Data for capture fish, crustaceans, and cephalopods from Parker et al. (2018), with post-farm data from Poore and Nemecek (2018), where the ranges represent differences across species groups. CH4 emissions include emissions from manure management, enteric fermentation, and flooded rice only. aGrains are not generally classed as protein-rich, but they provide about 41% of global protein intake. Here grains are a weighted average of wheat, maize, oats, and rice by global protein intake. bConversion of annual to perennial crops can lead to carbon sequestration in woody biomass and soil, shown as negative emissions intensity. Source: data from Poore and Nemecek (2018); Parker et al. (2018).
Emissions intensities for farmed fish ranged from 2.4–11 kgCO2-eq per 100 g protein (Poore and Nemecek 2018). For Norwegian seafood, large differences have been found ranging from 1.1 kgCO2-eq kg –1 edible product for herring to more than 8 kgCO2-eq kg –1 edible product for salmon shipped by road and ferry from Oslo to Paris (Winther et al. 2020). For capture fish, large differences in emissions have been found, ranging from 0.2–7.9 kgCO2-eq kg –1 landed fish (Parker et al. 2018), although an environmental comparison of capture fish to farmed foods should include other indicators such as overfishing. Plant-based foods generally have lower GHG emissions (–2.2 to +4.5 kgCO2-eq per 100 g protein) than farmed animal-based foods (Nijdam et al. 2012; Clark and Tilman 2017; Clune et al. 2017; Hilborn et al. 2018; Poore and Nemecek 2018) (robust evidence, high agreement ). Several plant-based foods are associated with emissions from land use change, for example, palm oil, soy and coffee (Poore and Nemecek 2018), although emissions intensities are context specific (Meijaard et al. 2020) and for plant-based proteins, GHG footprints per serving remain lower than those of animal source proteins (Kim et al. 2019).
In traditional production systems, especially in developing countries, livestock serve multiple functions, providing draught power, fertiliser, investment and social status, besides constituting an important source of nutrients (Weiler et al. 2014). In landscapes dominated by forests or cropland, semi-natural pastures grazed by ruminants provide heterogeneity that supports biodiversity (Röös et al. 2016). Grazing on marginal land and the use of crop residues and food waste can provide human-edible food with lower demands for cropland (Röös et al. 2016; Van Zanten et al. 2018; Van Hal et al. 2019). Animal protein requires more land than vegetable protein, so switching consumption from animal to vegetable proteins could reduce the pressure on land resources and potentially enable additional mitigation through expansion of natural ecosystems, storing carbon while supporting biodiversity, or reforestation to sequester carbon and enhance wood supply capacity for the production of bio-based products substituting fossil fuels, plastics, cement, etc. (Schmidinger and Stehfest 2012; Searchinger et al. 2018b; Hayek et al. 2021). At the same time, alternatives to animal-based meat and other livestock products are being developed (Figure 12.6). Their increasing visibility in supermarkets and catering services, as well as falling production prices, could make meat substitutes competitive in one to two decades (Gerhardt et al. 2019). However, uncertainty around their uptake creates uncertainty around their effect on future GHG emissions.
12.4.2.3Territorial National Per Capita GHG Emissions from Food Systems
Food systems are connected to other societal systems, such as the energy system, financial system, and transport system (Leip et al. 2021). Also, food systems are dynamic and continuously changing and adapting to existing and anticipated future conditions. Food production systems are very diverse and vary by farm size, intensity level, farm specialisation, technological level, production methods (e.g., organic, conventional, etc.), with differing environmental and social consequences (Václavík et al. 2013; Fanzo 2017; Herrero et al. 2017; Herrero et al. 2021).
Various frameworks have been proposed to assess sustainability of food systems, including metrics and indicators on environmental, health, economic and equity issues, pointing to the importance of recognising the multi-dimensionality of food system outcomes (Gustafson et al. 2016; Chaudhary et al. 2018; Hallström et al. 2018; Zurek et al. 2018; Eme et al. 2019; Béné et al. 2020; Hebinck et al. 2021). Data platforms are being developed, but so far comprehensive data for evidence-based food system policy are lacking (Fanzo et al. 2020).
To visualise several food systems dimensions in a GHG context, Figure 12.7 shows GHG emissions per capita and year for regional country aggregates (Crippa et al. 2021a; Crippa et al. 2021b), indicated by the size of the bubbles. The GHG emissions presented here are based on territorial accounting similar to the UNFCCC GHG inventories: emissions are assigned to the country where they occur, not where food is consumed (Crippa et al. 2021a; Crippa et al. 2021b) (Section 12.4.2.1). The colours of the bubbles indicate the relative contribution of the following risk factors to deaths, according to the classification used in the Global Burden of Disease Study: child and maternal malnutrition (red, deficiencies of iron, zinc or Vitamin A, or low birth weight or child growth failure), dietary risks (yellow, for example diets low in vegetables, legumes, whole grains or diets high in red and processed meat and sugar-sweetened beverages) or high body mass index (blue). The combined contribution of these three risk factors to total deaths varies strongly and is between 28% and 88% of total deaths. Figure 12.7 shows that dietary risk factors are prevalent throughout all regions. Though not a complete measure of the health impact of food, these were selected as a proxy for nutritional adequacy and balance of diets, avoidance of food insecurity, over- or mal-nutrition and associated non-communicable diseases (GBD 2017 Diet Collaborators 2018; GBD 2017 Diet Collaborators et al. 2019).

Figure 12.7 | Regional differences in health outcomes, territorial per capita GHG emissions from national food systems, and share of food system GHG emissions from energy use. GHG emissions are calculated according to the IPCC Tier 1 approach and are assigned to the country where they occur, not necessarily where the food is consumed. Health outcome is expressed as relative contribution of each of the following risk factors to their combined risk for deaths: child and maternal malnutrition (red), dietary risks (yellow) or high body mass index (blue). Sources: wholesale cost of food per capita: Springmann et al. 2021); territorial food system GHG emissions: EDGAR v.6, Crippa et al. (2021a), recalculated according to Crippa et al. (2021b) using AR6 GWPs; deaths attributed to dietary factors: IHME (2018); GBD 2017 Diet Collaborators et al. (2019).
The share of GHG emissions from energy use is taken as a proxy for the structure of food supply in a region (Section 12.4.1), and the cost for food as a proxy for the structure of the demand side and the access to (healthy) food (Chen et al. 2016; Finaret and Masters 2019; Hirvonen et al. 2019; HLPE 2020; Springmann et al. 2021), though acknowledging the limitations of such a simplification.
While total food system emissions in 2018 range between 0.9 and 8.5 tCO2-eq per capita per year between regions, the share of energy emissions relative to energy and land-based (agriculture and food system land-use change) emissions ranges between 3% and 78%. Regional expenditures for food range from USD3.0–8.8 per capita per day (Figure 12.7), though there is high variability within countries and the costs of nutrient-adequate diets often exceeds those of diets delivering adequate energy (Hirvonen et al. 2019; Bai et al. 2020; FAO et al. 2020). Thus, low-income households in industrialised countries can also be affected by food insecurity (Penne and Goedemé 2020).
12.4.3Mitigation Opportunities
GHG emissions from food systems can be reduced by targeting direct or indirect GHG emissions in the supply chain including enhanced carbon sequestration, by introducing sustainable production methods such as agroecological approaches which can reduce system-level GHG emissions of conventional food production and also enhance resilience (HLPE 2019), by substituting food products with high GHG intensities with others of lower GHG intensities, by reducing food over-consumption, and/or by reducing food loss and waste. The substitution of food products with others that are more sustainable and/or healthier is often called ‘dietary shift’.
Clark et al. (2020) showed that even if fossil fuel emissions were eliminated immediately, food system emissions alone would jeopardise the achievement of the 1.5ºC target and threaten the 2ºC target. They concluded that both demand-side and supply-side strategies are needed, including a shift to a diet with lower GHG intensity and rich in plant-based ‘conventional’ foods (e.g., pulses, nuts), or new food products that could support dietary shift. Such dietary shift needs to overcome socio-cultural, knowledge, and economic barriers to significantly achieve GHG mitigation (Section 12.4.5).
Food losses occur at the farm, post-harvest and during the food processing/wholesale stages of a food supply chain, while in the final retail and consumption stages the term food waste is used (HLPE 2014). Typically, food losses are linked to technical issues such as lack of infrastructure and storage, while food waste is often caused by socio-economic and behavioural factors. Mitigation opportunities through reducing food waste and loss exist in all food supply chain stages and are described in the sub-sections below.
Food system mitigation opportunities are divided into five categories as given in Table 12.8:
•Food production from agriculture, aquaculture, and fisheries (Chapter 7.4 and Section 12.4.3.1)
•Controlled-environment agriculture (Section 12.4.3.2)
•Emerging food production technologies (Section 12.4.3.3)
•Food processing industries (Section 12.4.3.4)
• Storage and distribution (Section 12.4.3.5)
Food system mitigation opportunities can be either incremental or transformative (Kugelberg et al. 2021). Incremental options are based on mature technologies, for which processes and causalities are understood, and their implementation is generally accepted by society. They do not require a substantial change in the way food is produced, processed, or consumed and might lead to a (slight) shift in production systems or preferences. Transformative mitigation opportunities have wider food system implications and usually coincide with a significant change in food choices. They are based on technologies that are not yet mature and are expected to require further innovation (Klerkx and Rose 2020), and/or mature technologies that might already be part of some food systems but are not yet widely accepted and have transformative potential if applied at large scale, for example consumption of insects (Raheem et al. 2019a). Many emerging technologies might be seen as a further step in agronomic development where land-intensive production methods relying on the availability of naturally-available nutrients and water are successively replaced with crop variants and cultivation practices reducing these dependencies at the cost of larger energy input (Winiwarter et al. 2014). Others suggest a shift to agroecological approaches combining new scientific insights with local knowledge and cultural values (HLPE 2019). Food system transformation can lead to regime shifts or (fast) disruptions (Pereira et al. 2020) if driven by events that are out of control of private or public measures and have a ‘crisis’ character (e.g., BSE) (Skuce et al. 2013).
Table 12.8 summarises the main characteristics of food system mitigation opportunities, their effect on GHG emissions, and associated co-benefits and adverse effects.
Table 12.8 | Food system mitigationopportunities.
Food system mit igation options I: incremental; T: transformative | Direct and indirect effect on GHG mitigation D: direct emissions except emissions from energy use; E: energy demand; M: material demand; FL: food losses; FW: food waste Direction of effect on GHG mitigation: +increased mitigation; 0neutral; –decreased mitigation | Co-benefits/adverse effects H: health aspects; A: animal welfare; R: resource use; L: land demand; E: ecosystem services; 0: neutral +co-benefits; –adverse effects | Source | |
Food from agriculture, aquaculture and fisheries | (I) Dietary shift, in particular increased share of plant-based protein sources | D+↓GHG footprint | A+ Animal welfare L+ Land sparing H+ Good nutritional properties, potentially ↓ risk from zoonotic diseases, pesticides and antibiotics | 1–5 |
(I/T) Digital agriculture | D+↑Logistics | L+ Land sparing R+↑Resource use efficiencies | 6–7 | |
(T) Gene technology | D+↑Productivity or efficiency | H+↑Nutritional quality E0↓Use of agrochemicals; ↑ probability of off-target impacts | 7–11 | |
(I) Sustainable intensification, Land-use optimisation | D+↓GHG footprint E0 Mixed effects | L+ Land sparing R– Might ↑ pollution/biodiversity loss | 7, 12 | |
(I) Agroecology | D+↓GHG/area, positive micro-climatic effects E+↓Energy, possibly ↓ transport FL+ Circular approaches | E+ Focus on co-benefits/ecosystem services R+ Circular, ↑ nutrient and water use efficiencies | 13–17 | |
Controlled-environment agriculture | (T) Soilless agriculture | D+↑ productivity, weather independent FL+ harvest on demand E- Currently ↑ energy demand, but ↓ transport, building spaces can be used for renewable energy | R+ Controlled loops ↑ nutrient and water use efficiency L+ Land sparing H+ Crop breeding can be optimised for taste and/or nutritional quality | 18–24 |
Emerging food production technologies | (T) Insects | D0 Good feed conversion efficiency FW+ Can be fed on food waste | H0 Good nutritional qualities but attention to allergies and food safety issues required | 25–28 |
(I/T) Algae and bivalves | D+↓GHG footprints | A+ Animal welfare L+ Land sparing H+ Good nutritional qualities; risk of heavy metal and pathogen contamination R+ Biofiltration of nutrient-polluted waters | 29–32 | |
(I/T) Plant-based alternatives to animal-based food products | D+ No emissions from animals, ↓ inputs for feed | A+ Animal welfare L+ Land sparing H+ Potentially ↓ risk from zoonotic diseases, pesticides and antibiotics; but ↑ processing demand | 31–33 | |
(T) Cellular agriculture (including cultured meat, microbial protein) | D+ No emissions from animals, high protein conversion efficiency E–↑Energy need FLW+↓Food loss and waste | A+ Animal welfare R+↓Emissions of reactive nitrogen or other pollutants H0 Potentially ↓ risk from zoonotic diseases, pesticides and antibiotics;↑ research on safety aspects needed | 3, 24 34–42 | |
Food processing and packaging | (I) Valorisation of by-products, food loss and waste logistics and management | M+ Substitution of bio-based materials FL+↓ of food losses | 43–44 | |
(I) Food conservation | FW+↓Food waste E0↑ energy demand but also energy savings possible (e.g., refrigeration, transport) | 45–46 | ||
(I) Smart packaging and other technologies | FW+↓Food waste M0↑Material demand and ↑ material-efficiency E0↑Energy demand; energy savings possible | H+ Possibly ↑ freshness/reduced food safety risks | 46–49 | |
(I) Energy efficiency | E+↓Energy | 50 | ||
Storage and distribution | (I) Improved logistics | D+↓Transport emissions FL+↓Losses in transport FW– Easier access to food could ↑ food waste | 46–47 51–53 | |
(I) Specific measures to reduce food waste in retail and food catering | FW+↓Food waste E+↓Downstream energy demand M+↓Downstream material demand | 54–56 | ||
(I) Alternative fuels/ transport modes | D+↓Emissions from transport | |||
(I) Energy efficiency | E+↓Energy in refrigeration, lightening, climatisation | 57–58 | ||
(I) Replacing refrigerants | D+↓Emissions from the cold chain | 50 59–60 | ||
Sources: [1] McDermott and Wyatt (2017); [2] Foyer et al. (2016); [3] Semba et al. (2021); [4] Weindl et al. (2020); [5] Hertzler et al. (2020); [6] Finger et al. (2019); [7] Herrero et al. (2020); [8] Steinwand and Ronald (2020); [9] Zhang et al. (2020a); [10] Ansari et al. (2020); [11] Eckerstorfer et al. (2021); [12] Folberth et al. (2020); [13] HLPE (2019); [14] Wezel et al. (2009); [15] Van Zanten et al. (2018); [16] Van Zanten et al. (2019); [17] van Hal et al. (2019); [18] Beacham et al. (2019); [19] Benke and Tomkins (2017); [20] Gómez and Gennaro Izzo (2018); [21] Maucieri et al. (2018); [22] Rufí-Salís et al. (2020); [23] Shamshiri et al. (2018); [24] Graamans et al. (2018); [25] Fasolin et al. (2019); [26] Garofalo et al. (2019); [27] Parodi et al. (2018); [28] Varelas (2019); [29] Gentry et al. (2020); [30] Peñalver et al. (2020); [31] Torres-Tiji et al. (2020); [32] Willer and Aldridge (2020); [33] Fresán et al. (2019); [34] Mejia et al. (2019); [35] Tuomisto (2019); [36] Thorrez and Vandenburgh (2019); [37] Tuomisto and Teixeira de Mattos (2011); [38] Mattick et al. (2015); [39] Mattick (2018); [40] Souza Filho et al. (2019); [41] Chriki and Hocquette (2020); [42] Hadi and Brightwell (2021); [43] Göbel et al. (2015); [44] Caldeira et al. (2020); [45] Silva and Sanjuán (2019); [46] FAO (2019a); [47] Molina-Besch et al. (2019); [48] Poyatos-Racionero et al. (2018); [49] Müller and Schmid (2019); [50] Niles et al. (2018); [51] Lindh et al. (2016); [52] Wohner et al. (2019); [53] Bajželj et al. (2020); [54] Buisman et al. (2019); [55] Albizzati et al. (2019); [56] Liu et al. (2016); [57] Chaomuang et al. (2017); [58] Lemma et al. (2014); [59] McLinden et al. (2017); [60] Gullo et al. (2017). Food from Agriculture, Aquaculture, and Fisheries.
Agricultural food production systems range from smallholder subsistence farms to large animal production factories, in open spaces, greenhouses, rural areas or urban settings.
Dietary shift: Studies demonstrate that a shift to diets rich in plant-based foods, particularly pulses, nuts, fruits and vegetables, such as vegetarian, pescatarian or vegan diets, could lead to substantial reduction of greenhouse gas emissions as compared to current dietary patterns in most industrialised countries, while also providing health benefits and reducing mortality from diet-related non-communicable diseases (Springmann et al. 2018a; Chen et al. 2019; Willett et al. 2019; Bodirsky et al. 2020; Costa Leite et al. 2020; Ernstoff et al. 2020; Jarmul et al. 2020; Semba et al. 2020; Theurl et al. 2020; Hamilton et al. 2021).
Pulses such as beans, chickpeas, or lentils, have a protein composition complementary to cereals, providing together all essential amino acids (Foyer et al. 2016; McDermott and Wyatt 2017). Bio-availability of proteins in foods is influenced by several factors, including amino acid composition, presence of anti-nutritional factors, and preparation method (Hertzler et al. 2020; Weindl et al. 2020; Semba et al. 2021). Soy beans, in particular, have a well-balanced amino acid profile with high bio-availability (Leinonen et al. 2019). Pulses are part of most traditional diets (Semba et al. 2021) and supply up to 10–35% of protein in low-income countries, but consumption decreases with increasing income and they are globally only a minor share of the diet (McDermott and Wyatt 2017). Pulses play a key role in crop rotations, fixing nitrogen and breaking disease cycles, but yields of pulses are relatively low and have seen small yield increases relative to those of cereals (Foyer et al. 2016; McDermott and Wyatt 2017; Barbieri et al. 2021; Semba et al. 2021).
Technological innovations: have made food production more efficient since the onset of agriculture (Winiwarter et al. 2014; Herrero et al. 2020). Emerging technologies include digital agriculture (using advanced sensors, big data), gene technology (crop bio-fortification, genome editing, crop innovations), sustainable intensification (automation of processes, improved inputs, precision agriculture) (Herrero et al. 2020), or multi-trophic aquaculture approaches (Knowler et al. 2020; Sanz-Lazaro and Sanchez-Jerez 2020), though literature on aquaculture and fisheries in the context of GHG mitigation is limited.
Such technologies may contribute to a reduction of GHG emissions at the food system level, enhanced provision of food, better consideration of ecosystem services, and/or contribute to nutrition-sensitive agriculture, for example, by increasing the nutritional quality of staple crops, increasing the palatability of leguminous crops such as lupines, or increasing the agronomic efficiency or resilience of crops with good nutritional characteristics.
For details on agricultural mitigation opportunities refer to Section 7.4.
12.4.3.1Controlled-environment Agriculture
Controlled-environment agriculture is mainly based on hydroponic or aquaponic cultivation systems that do not require soil. Aquaponics combine hydroponics with a re-circulating aquaculture compartment for integrated production of plants and fish (Junge et al. 2017; Maucieri et al. 2018), while aeroponics is a further development of hydroponics that replaces water as a growing medium with a mist of nutrient solution (Al-Kodmany 2018). Aquaponics could potentially produce proteins in urban farms, but the technology is not yet mature and its economic and environmental performance is unclear (Love et al. 2015; O’Sullivan et al. 2019).
Controlled-environment agriculture is often undertaken in urban environments to take advantage of short supply chains (O’Sullivan et al. 2019), and might use abandoned buildings or be integrated in supermarkets, producing for example herbs ‘on demand’.
Optimising growing conditions, hydroponic systems achieve higher yields than un-conditioned agriculture (O’Sullivan et al. 2019); and yields can be further enhanced in CO2-enriched atmospheres (Shamshiri et al. 2018; Armanda et al. 2019). By using existing spaces or modular systems that can be vertically stacked, this technology minimises land demand, however it is energy intensive and requires large financial investments. So far, only a few crops are commercially produced in vertical farms, including lettuce and other leafy greens, herbs and some vegetables, due to their short growth period and high value (Benke and Tomkins 2017; Armanda et al. 2019; Beacham et al. 2019; O’Sullivan et al. 2019). Through breeding, other crops could reach commercial feasibility, or crops with improved taste or nutritional characteristics can be grown (O’Sullivan et al. 2019).
In controlled-environment agriculture, photosynthesis is fuelled by artificial light through LEDs or a combination of natural light with LEDs. Control of the wave band and light cycle of the LEDs and micro-climate can be used to optimise photosynthetic activity, yield and crop quality (Gómez and Gennaro Izzo 2018; Shamshiri et al. 2018).
Co-benefits of controlled-environment agriculture include minimising water and nutrient losses as well as agro-chemical use (Al-Kodmany 2018; Shamshiri et al. 2018; Armanda et al. 2019; Farfan et al. 2019; O’Sullivan et al. 2019; Rufí-Salís et al. 2020) (robust evidence, high agreement ). Water is recycled in a closed system and additionally some plants generate fresh water by evaporation from grey or black water, and high nutrient use efficiencies are possible. Food production from controlled-environment agriculture is independent of weather conditions and able to satisfy some consumer demand for locally-produced fresh and diverse produce throughout the year (Benke and Tomkins 2017; Al-Kodmany 2018; O’Sullivan et al. 2019).
Controlled-environment agriculture is a very energy intensive technology (mainly for cooling) and its GHG intensity depends therefore crucially on the source of the energy. Options for reducing GHG intensity include reducing energy use through improved lighting and cooling efficiency or by employing low-carbon energy sources, potentially integrated into the building structure (Benke and Tomkins 2017).
Comprehensive studies assessing the GHG balance of controlled-environment agriculture are lacking. The overall GHG emissions from controlled-environment agriculture is therefore uncertain and depends on the balance of reduced GHG emissions from production and distribution and reduced land requirements, versus increased external energy needs.
12.4.3.2Emerging Foods and Production Technologies
A diverse range of novel food products and production systems are emerging, that are proposed to reduce GHG emissions from food production, mainly by replacing conventional animal-source food with alternative protein sources. Assessments of the potential of dietary changes are given in Sections 5.3 and 7.4. Here, we assess the GHG intensities of emerging food production technologies. This includes products such as insects, algae, mussels and products from bio-refineries, some of which have been consumed in certain societies and/or in smaller quantities (Pikaar et al. 2018; Jönsson et al. 2019; Govorushko 2019; Raheem et al. 2019a; Souza Filho et al. 2019). The novel aspect considered here is the scale at which they are proposed to replace conventional food with the aim to reduce both negative health and environmental impacts. To fully realise the health benefits, dietary shifts should also encompass a reduction in consumption of added sugars, salt, saturated fats, and potentially harmful additives (Curtain and Grafenauer 2019; Fardet and Rock 2019; Petersen et al. 2021).
Meat analogues have attracted substantial venture capital, and production costs have dropped considerably in the last decade, with some reaching market maturity (Mouat and Prince 2018; Santo et al. 2020), but there is uncertainty whether they will ‘disrupt’ the food market or remain niche products. According to Kumar et al. (2017), the demand for plant-based meat analogues is expected to increase as their production is relatively cheap and they satisfy consumer demands with regard to health and environmental concerns as well as ethical and religious requirements. Consumer acceptance is still low for some options, especially insects (Aiking and de Boer 2019) and cultured meat (Chriki and Hocquette 2020; Siegrist and Hartmann 2020).
Insects: Farmed edible insects have a higher feed conversion ratio than other animals farmed for food, and have short reproduction periods with high biomass production rates (Halloran et al. 2016). Insects have good nutritional qualities (Parodi et al. 2018). They are suited as a protein source for both humans and livestock, with high protein content and favourable fatty acid composition (Fasolin et al. 2019; Raheem et al. 2019b). If used as feed, they can grow on food waste and manure; if used as food, food safety concerns and regulations can restrict the use of manure (Raheem et al. 2019b) or food waste (Varelas 2019) as growing substrates, and the dangers of pathogenic or toxigenic microorganisms and incidences of anti-microbial resistance need to be managed (Garofalo et al. 2019).
Algae and bivalves have a high protein content and a favourable nutrient profile and can play a role in providing sustainable food. Bivalves are high in omega-3 fatty acids and vitamin B12 and therefore well suited as replacement of conventional meats, and have a lower GHG footprint (Parodi et al. 2018; Willer and Aldridge 2020). Micro- and macro algae are rich in omega-3 and omega-6 fatty acids, anti-oxidants and vitamins (Parodi et al. 2018; Peñalver et al. 2020; Torres-Tiji et al. 2020). Kim et al. (2019) show that diets with modest amounts of animals low on the food chain such as forage fish, bivalves, or insects have similar GHG intensities to vegan diets. Algae and bi-valves can be used to filter nutrients from waters, though care is required to avoid accumulation of hazardous substances (Gentry et al. 2020; Willer and Aldridge 2020).
Plant-based meat, milk and egg analogues: Demand for plant-based proteins is increasing and incentivising the development of protein crop varieties with improved agronomic performance and/or nutritional quality (Santo et al. 2020). There is also an emerging market for meat replacements based on plant proteins, such as pulses, cereals, soya, algae and other ingredients mainly used to imitate the taste, texture and nutritional profiles of animal-source food (Kumar et al. 2017; Boukid 2021). Currently, the majority of plant-based meat analogues is based on soy (Semba et al. 2021). While other products still serve a niche market, their share is growing rapidly and some studies project a sizeable share within a decade (Kumar et al. 2017; Jönsson et al. 2019). In particular, plant-based milk alternatives have seen large increases in market share (Jönsson et al. 2019). A LCA of 56 plant-based meat analogues showed mean GHG intensities (farm to factory) of 0.21–0.23 kgCO2-eq per 100 g of product or 20 g of protein for all assessed protein sources (Fresán et al. 2019). Higher footprints were found in the meta-review by Santo et al. (2020). Including preparation, Meija et al. (2019) found higher emissions for burgers and sausages as compared to minced products.
Cellular agriculture: The use of fungi, algae and bacteria is an old process (beer, bread, yoghurt) and serves, among others, for the preservation of products. The concept of cellular agriculture (Mattick 2018) covers bio-technological processes that use micro-organisms to produce acellular (fermentation-based cellular agriculture) or cellular products. Yeasts, fungi or bacteria can synthesise acellular products such as haem, milk and egg proteins, or protein-rich animal feed, other food ingredients, and pharmaceutical and material products (Rischer et al. 2020; Mendly-Zambo et al. 2021). Cellular products include cell tissues such as muscle cells to grow cultured meat, fish or other cells (Post 2012; Rischer et al. 2020) and products where the micro-organisms will be eaten themselves (Pikaar et al. 2018; Sillman et al. 2019; Schade et al. 2020). Single cell proteins, combined with photovoltaic electricity generation and direct air capture of carbon dioxide, are proposed as highly land- and energy-efficient alternatives to plant-based protein (Leger et al. 2021). Some microbial proteins are produced in a ‘bioreactor’ and use Haber-Bosch nitrogen and vegetable sugars or atmospheric CO2 as source of nitrogen and carbon (Pikaar et al. 2018; Simsa et al. 2019). Cultured meat is currently at the research stage and some challenges remain, such as the need for animal-based ingredients to ensure fast and effective growth of muscle cells; tissue engineering to create different meat products; production at scale and at competitive costs; and regulatory barriers (Post 2012; Stephens et al. 2018; Rubio et al. 2019; Tuomisto 2019; Post et al. 2020). Only a few studies to date have quantified the GHG emissions of microbial proteins or cultured meat, suggesting GHG emissions at the level of poultry meat (Tuomisto and Teixeira de Mattos 2011; Mattick et al. 2015; Souza Filho et al. 2019; Tuomisto 2019).
A review of LCA studies on different plant-based, animal source and nine ‘future food’ protein sources (Parodi et al. 2018) concluded that insects, macro-algae, mussels, mycoproteins and cultured meat show similar GHG intensities per unit of protein (mean values ranging 0.3–3.1 kgCO2-eq per 100 g protein), comparable to milk, eggs, and tuna (mean values ranging 1.2–5.4 kgCO2-eq per 100 g protein); while chlorella and spirulina consume more energy per unit of protein and were associated with higher GHG emissions (mean values ranging 11–13 kgCO2-eq per 100 g protein). As the main source of GHG emissions from insects and cellular agriculture foods is energy consumption, their GHG intensity improves with increased use of low-carbon energy (Smetana et al. 2015; Parodi et al. 2018; Pikaar et al. 2018).
Future foods offer other benefits such as lower land requirements, controlled systems with reduced losses of water and nutrients, increased resilience, and possibly reduced hazards from pesticide and antibiotics use and zoonotic diseases, although more research is needed including on allergenic and other safety aspects, and possibly reduced protein bioavailability (Alexander et al. 2017; Parodi et al. 2018; Stephens et al. 2018; Fasolin et al. 2019; Chriki and Hocquette 2020; Santo et al. 2020; Hadi and Brightwell 2021; Tzachor et al. 2021) (medium evidence, high agreement ). Research is needed also on the effect of processing (Wickramasinghe et al. 2021), though a randomised crossover trial comparing appetising plant foods with meat alternatives found several beneficial and no adverse effects from the consumption of the plant-based meats (Crimarco et al. 2020).
12.4.3.3Food Processing and Packaging
Food processing includes preparation and preservation of fresh commodities (fruit and vegetables, meat, seafood and dairy products), grain milling, production of baked goods, and manufacture of pre-prepared foods and meals. Food processors range from small local operations to large multinational food producers, producing food for local to global markets. The importance of food processing and preservation is particularly evident in developing countries which lack cold chains for the preservation and distribution of fresh perishable products such as fresh fish (Adeyeye and Oyewole 2016; Adeyeye 2017).
Mitigation in food processing largely focuses on reducing food waste and fossil energy usage during the processing itself, as well as in the transport, packaging and storage of food products for distribution and sale (Silva and Sanjuán 2019). Reducing food waste provides emissions savings by reducing wastage of primary inputs required for food production. Another mitigation route, contributing to the circular bioeconomy (Section 12.6.1.2 and Cross-Working Group Box 3 in this chapter), is by valorisation of food processing by-products through recovery of nutrients and/or energy. No global analyses of the emissions savings potential from the processing step in the value chain could be found.
Reduced food waste during food processing can be achieved by seeking alternative processing routes (Atuonwu et al. 2018), improved communication along the food value chain (Göbel et al. 2015), optimisation of food processing facilities, reducing contamination, and limiting damages and spillage (HLPE 2014). Optimisation of food packaging also plays an important role in reducing food waste, in that it can extend product shelf life; protect against damage during transport and handling; prevent spoilage; facilitate easy opening and emptying; and communicate storage and preparation information to consumers (Molina-Besch et al. 2019).
Developments in smart packaging are increasingly contributing to reducing food waste along the food value chain. Strategies for reducing the environmental impact of packaging include using less, and more sustainable, materials and a shift to reusable packaging (Coelho et al. 2020). Active packaging increases shelf life through regulating the environment inside the packaging, including levels of oxygen, moisture and chemicals released as the food ages (Emanuel and Sandhu 2019). Intelligent packaging communicates information on the freshness of the food through indicator labels (Poyatos-Racionero et al. 2018), and data carriers can store information on conditions such as temperature along the entire food chain (Müller and Schmid 2019).
LCA can be used to evaluate the benefits and trade-offs associated with different processing or packaging types (Silva and Sanjuán 2019). Some options, such as aluminium, steel and glass, require high energy investment in manufacture when produced from primary materials, with significant savings in energy through recycling being possible (Camaratta et al. 2020). However, these materials are inert in landfill. Other packaging options, such as paper and biodegradable packaging, may require a lower energy investment during manufacture, but may require larger land area and can release methane when consigned to anaerobic landfill where there is no methane recovery. Nevertheless, packaging accounts for only 1–12% (typically around 5%) of the GHG emissions in the lifecycle of a food system (Wohner et al. 2019; Crippa et al. 2021b), suggesting that its benefits can often outweigh the emissions associated with the packaging itself.
The second component of mitigation in food processing relates to reduction in fossil energy use. Opportunities include energy efficiency in processes (also discussed in Section 11.3), the use of heat and electricity from low-carbon energy sources in processing (Chapter 6), through off-grid thermal processing (sun drying, food smoking) and improving logistics efficiencies. Energy-intensive processes with energy-saving potential include milling and refining (oil seeds, corn, sugar), drying, and food safety practices such as sterilisation and pasteurisation (Niles et al. 2018). Packaging also plays a role: reduced transport energy can be achieved through reducing the mass of goods transported and improving packing densities in transport vehicles (Lindh et al. 2016; Molina-Besch et al. 2019; Wohner et al. 2019). Choice of packaging also influences refrigeration energy requirements during transport and storage.
12.4.3.4 Storage and Distribution
Transport mitigation options along the supply chain include improved logistics, the use of alternative fuels and transport modes, and reduced transport distances. Logistics and alternative fuels and transport modes are discussed in Chapter 10. Transport emissions might increase with increasing demand for a diversity of foods as developing countries become more affluent. New technologies that enable food on demand or online food shopping systems might further increase emissions from food transport; however, the consequences are uncertain and might also entail a shift from individual traffic to bulk transport. The impact on food waste is also uncertain as more targeted delivery options could reduce food waste, but easier access to a wider range of food could also foster over-supply and increase food waste. Mitigation opportunities in food transport are inherently linked to decarbonisation of the transport sector (Chapter 10).
Retail and the food service industry are the main factors shaping the external food environment or ‘food entry points’; they are the ‘physical spaces where food is obtained; the built environment that allows consumers to access these spaces’ (HLPE 2017). These industries have significant influence on consumers’ choices and can play a role in reducing GHG emissions from food systems. Opportunities are available for optimisation of inventories in response to consumer demands through advanced IT systems (Niles et al. 2018), and for discounting foods close to sell-by dates, which can serve to reduce both food spoilage and wastage (Buisman et al. 2019).
As one of the highest contributors to energy demand at this stage in the food value chain, refrigeration has received a strong focus in mitigation. Efficient refrigeration options include advanced refrigeration temperature control systems, and installation of more efficient refrigerators, air curtains and closed display fridges (Chaomuang et al. 2017). Also related to reducing emissions from cooling and refrigeration is the replacement of hydrofluorocarbons which have very high GWPs with lower GWP alternatives (Niles et al. 2018). The use of propane, isobutane, ammonia, hydrofluoroolefins and CO2 (refrigerant R744) are among those that are being explored, with varying success (McLinden et al. 2017). In recent years, due to restrictions on high GWP-refrigerants, a considerable growth in the market availability of appliances and systems with non-fluorinated refrigerants has been seen (Eckert et al. 2021).
Energy efficiency alternatives generic to buildings more broadly are also relevant here, including efficient lighting, heating, ventilation, and air conditioning systems and building management, with ventilation being a particularly high energy user in retail, that warrants attention (Kolokotroni et al. 2015).
In developing countries particularly, better infrastructure for transportation and expansion of processing and manufacturing industries can significantly reduce food losses, particularly of highly perishable food (Niles et al. 2018; FAO 2019 a).
12.4.4Enabling Food System Transformation
Food system mitigation potentials in AFOLU are assessed in Section 7.4, and food system mitigation potentials linked to demand-side measures are assessed in Chapter 5. Studies suggest that implementing supply- and demand-side policies in combination makes ambitious mitigation targets easier to achieve (Clark et al. 2020; Global Panel on Agriculture and Food Systems for Nutrition 2020; Temme et al. 2020; Latka et al. 2021 a) ( high agreement , limited evidence).
The trends in the global and national food systems towards a globalisation of food supply chains and increasing dominance of supermarkets and large corporate food processors (Dries et al. 2004; Neven and Reardon 2004; Baker and Friel 2016; Andam et al. 2018; Popkin and Reardon 2018; Reardon et al. 2019; Pereira et al. 2020) have led to environmental, food insecurity and malnutrition problems. Studies therefore call for a transformation of current global and national food systems to solve these problems (Schösler and Boer 2018; McBey et al. 2019; Kugelberg et al. 2021). This has not yet been successful, including due to insufficient coordination between relevant food system policies (Weber et al. 2020) (medium evidence, high agreement ).
Different elements of food systems are currently governed by separate policy areas that in most countries scarcely interact or cooperate (Termeer et al. 2018; iPES Food 2019). This compartmentalisation makes the identification of synergetic and antagonistic effects difficult and faces the possibility of failure due to unintended and unanticipated negative impacts on other policy areas and consequently lack of agreement and social acceptance (Mylona et al. 2018; Brouwer et al. 2020; Mausch et al. 2020; Hebinck et al. 2021) (Section 12.4.5). This could be overcome through cooperation across several policy areas (Sections 12.6.2 and 13.7), in particular agriculture, nutrition, health, trade, climate and environment, and an inclusive and transparent governance structure (Termeer et al. 2018; Bhunnoo 2019; Diercks et al. 2019; Herrero et al. 2021; iPES Food 2019; Mausch et al. 2020; Kugelberg et al. 2021), making use of potential spillover effects (Kanter et al. 2020; OECD 2021).
Transformation of food systems may come from technological, social or institutional innovations that start as niches but can potentially lead to rapid changes, including changes in social conventions (Centola et al. 2018; Benton et al. 2019).
Where calories and ruminant animal-source food are consumed in excess of health guidelines, reduction of excess meat (and dairy) consumption is among the most effective measures to mitigate GHG emissions, with a high potential for environment, health, food security, biodiversity, and animal welfare co-benefits (Hedenus et al. 2014; Springmann et al. 2018a; Chai et al. 2019; Chen et al. 2019; Kim et al. 2019; Willett et al. 2019; Semba et al. 2020; Theurl et al. 2020; Hamilton et al. 2021; Stylianou et al. 2021) (robust evidence, high agreement ). Dietary changes are relevant for several SDGs, in addition to SDG 13 (climate action), including SDG 2 (zero hunger), SDG 3 (good health and well-being), SDG 6 (clean water and sanitation), SDG 12 (responsible consumption and production), SDG 14 (life below water) and SDG 15 (life on land) (Bruce M et al. 2018; Mbow et al. 2019; Vanham et al. 2019; Herrero et al. 2021) (Section 12.6.1). However, behavioural change towards diets of lower environmental impact and higher nutritional qualities faces barriers both from agricultural producers and consumers (Apostolidis and McLeay 2016; Aiking and de Boer 2018; de Boer et al. 2018; Milford et al. 2019), and requires policy packages that combine informative instruments with behavioural, administrative and/or market-based instruments, and are attentive to the needs of, and engage, all food system stakeholders including civil society networks, and change the food environment (Cornelsen et al. 2015; Kraak et al. 2017;Stoll-Kleemann and Schmidt 2017; El Bilali 2019; iPES Food 2019; Milford et al. 2019; Temme et al. 2020) (Section 12.4.1) (robust evidence, high agreement ).
Table 12.9 summarises the implications of a range of policy instruments discussed in more detail in the following sub-sections and highlights the benefits of integrated policy packages. Furthermore, Table 12.9 assesses transformative potential, environmental effectiveness, feasibility, distributional effect, cost, and cost-benefits and trade-offs of individual policy instruments, as well as their potential role as part of coherent policy packages. Table 12.9 shows that information and behavioural policy instruments can have significant but small effects in changing diets (robust evidence, medium agreement ), but are mutually enforcing and might be essential to lower barriers and increase acceptance of market-based and administrative instruments (medium evidence, high agreement ).
Table 12.9 | Assessment of food system policies targeting (post-farm gate) food chain actorsand consumers.
Level G: global/multinational; N: national; L: local | Transformative potential | Environmental effectiveness | Feasibility | Distributional effects | Cost | Co-benefitsaand adverse side effect | Implications for coordination, coherence and consistency in policy packageb | |
Integrated food policy packages | NL | can be controlled | cost efficient | + balanced, addresses multiple sustainability goals | Reduces cost of uncoordinated interventions; increases acceptance across stakeholders and civil society (robust evidence, high agreement ) | |||
Taxes on food products | GN | regressive | low # 1 | – unintended substitution effects | High enforcing effect on other food policies; higher acceptance if compensation or hypothecated taxes (medium evidence, high agreement ) | |||
GHG taxes on food | GN | regressive | low # 2 | – unintended substitution effects | Supportive, enabling effect on other food policies, agricultural/fishery policies; requires changes in power distribution and trade agreements (medium evidence, medium agreement ) | |||
+ high spillover effect | ||||||||
Trade policies | G | impacts global distribution | complex effects | + counters leakage effects | Requires changes in existing trade agreements (medium evidence, high agreement ) | |||
+/– effects on market structure and jobs | ||||||||
Investment into research and innovation | GN | none | medium | + high spillover effect + converging with digital society | Can fill targeted gaps for coordinated policy packages (e.g., monitoring methods) (robust evidence, high agreement ) | |||
Food and marketing regulations | N | low | Can be supportive; might be supportive to realise innovation; voluntary standards might be less effective (medium evidence, medium agreement ) | |||||
Organisational-level procurement policies | NL | low | + can address multiple sustainability goals | Enabling effect on other food policies; reaches large share of population (medium evidence, high agreement ) | ||||
Sustainable food-based dietary guidelines | GNL | none | low | + can address multiple sustainability goals | Little attention so far on environmental aspects; can serve as benchmark for other policies (labels, food formulation standards, etc.) (medium evidence, medium agreement ) | |||
Food labels/ information | GNL | education level relevant | low | + empowers citizens + increases awareness + multiple objectives | Effective mainly as part of a policy package; incorporation of other objectives (e.g., animal welfare, fair trade); higher effect if mandatory (medium evidence, medium agreement ) | |||
Nudges | NL | none | low | + possibly counteracting information deficits in population subgroups | High enabling effect on other food policies (medium evidence, high agreement ) |
Effect of measures:  negative
  none/unclear
  slightly positive
  positive 
Notes: #1Minimum level to be effective 20% price increase; #2Minimum level to be effective USD50–80 tCO2-eq. aIn addition, all interventions are assumed to address health and climate change mitigation. bRequires coordination between policy areas, participation of stakeholders, transparent methods and indicators to manage trade-offs and prioritisation between possibly conflicting objectives; and suitable indicators for monitoring and evaluation against objectives.
The policy instruments are assessed in relation to shifting food consumption and production towards increased sustainability and health. This includes lowering GHG emissions, although not in all cases is this the primary focus of the instrument, and in some cases lowering GHG emissions may not even be explicitly mentioned.
12.4.4.1Market-based Instruments
Taxes and subsidies: Food-based taxes have largely been implemented to reduce non-communicable diseases and sugar intake, particularly those targeting sugar-sweetened beverages (WHO 2019). Many health-related organisations recommend the introduction of such taxes to improve the nutritional quality of marketed products and consumers’ diets (Wright et al. 2017; Park and Yu 2019; WHO 2019), even though the impacts of food taxes are complex due to cross-price and substitution effects and supplier reactions (Cornelsen et al. 2015; Gren et al. 2019; Blakely et al. 2020) and can have a regressive effect (WHO 2019). Subsidies and taxes are found to be effective in changing dietary behaviour at levels above 20% price increase (Cornelsen et al. 2015; Niebylski et al. 2015; Nakhimovsky et al. 2016; Hagenaars et al. 2017; Mozaffarian et al. 2018), even though longer-term effects are scarcely studied (Cornelsen et al. 2015) and effects of sugar tax with tax rates lower than 20% have been observed for low-income groups (Temme et al. 2020).
Modelling results show only small consumption shifts with moderate meat price increases; and high price increases are required to reach mitigation targets, even though model predictions become highly uncertain due to lack of observational data (Mazzocchi 2017; Bonnet et al. 2018; Fellmann et al. 2018; Zech and Schneider 2019; Latka et al. 2021 b). Taxes applied at the consumer level are found to be more effective than levying the taxes on the production side (Springmann et al. 2017).
Unilateral taxes on food with high GHG intensities have been shown to induce increases in net export flows, which could reduce global prices and increase global demand. Indirect effects on GHG mitigation therefore could be reduced by up to 70–90% of national results (Fellmann et al. 2018; Zech and Schneider 2019) (limited evidence, high agreement ). The global mitigation potential for GHG taxation of food products at USD52 kgCO2-eq –1 has been estimated at 1 GtCO2-eq yr –1 (Springmann et al. 2017).
Studies have shown that taxes can improve the nutritional quality of diets and reduce GHG emissions from the food system, particularly if accompanied by other policies that increase acceptance and elasticity, and reduce regressive and distributional problems (Niebylski et al. 2015; Hagenaars et al. 2017; Mazzocchi 2017; Springmann et al. 2017; Wright et al. 2017; Henderson et al. 2018; Säll 2018; FAO et al. 2020; Penne and Goedemé 2020) (robust evidence, high agreement ).
Trade: Since the middle of the last century, global trade in agricultural products has contributed to boosting productivity and reducing commodity prices, while also incentivising national subsidies for farmers to remain competitive in the global market (Benton et al. 2019). Trade liberalisation has been coined as an essential element of sustainable food systems, and as one element required to achieve sustainable development, that can shift pressure to regions where the resources are less scarce (Wood et al. 2018; Traverso and Schiavo 2020). However, Clapp (2017) argues that the main economic benefit of trade liberalisation flows to large transnational firms. Benton and Bailey (2019) argue that low food prices in the second half of last century contributed to both yield and food waste increases, and to a focus on staple crops to the disadvantage of nutrient-dense foods. However, global trade can also contribute to economic benefits such as jobs and income, reduce food insecurity and facilitate access to nutrients (Wood et al. 2018; Hoff et al. 2019; Traverso and Schiavo 2020; Geyik et al. 2021) and has contributed to increased food supply diversity (Kummu et al. 2020). The relevance of trade for food security, and adaptation and mitigation of agricultural production, has also been discussed in Mbow et al. (2019).
Trade policies can be used to protect national food system measures, by requiring front-of-package labels, or to impose border taxes on unhealthy products (Thow and Nisbett 2019). For example, in the frame of the Pacific Obesity Prevention in Communities project, the Fijian government implemented three measures (out of seven proposed) that eliminated import duties on fruits and vegetables, and imposed 15% import duties on unhealthy oils (Latu et al. 2018). Trade agreements, however, have the potential to undermine national efforts to improve public health (Unar-Munguía et al. 2019). GHG mitigation efforts in food supply chains can be counteracted by GHG leakage, with a general increase of environmental and social impact in developing countries exporting food products, and a decrease in the developed countries importing food products (Fellmann et al. 2018; Sandström et al. 2018; Wiedmann and Lenzen 2018). The demand for agricultural commodities has also been associated with tropical deforestation, though a robust estimate on the extent of embodied deforestation in food commodities is not available (Pendrill et al. 2019).
Investment into research and innovation: El Bilali (2019) assessed research gaps in the food system transition literature and found a need to develop comparative studies that enable the assessment of spatial variability and scalability of food system transitions. The author found also that the role of private industry and corporate business is scarcely researched, although they could play a major role in food system transitions.
The InterAcademy Partnership assessed how research can contribute to providing the required evidence and opportunities for food system transitions, with a focus on climate change impacts and mitigation (IAP 2018). The project builds on four regional assessments of opportunities and challenges on food and nutrition security in Africa (NASAC 2018), the Americas (IANAS 2018), Asia (AASSA 2018), and Europe (EASAC 2017). The Partnership concludes with a set of research questions around food systems, that need to be better understood: (i) how are sustainable food systems constituted in different contexts and at different scales? (ii) how can transition towards sustainable food systems be achieved? and (iii) how can success and failure be measured along sustainability dimensions including climate mitigation?
12.4.4.2Regulatory and Administrative Instruments
Marketing regulations: Currently, 16 countries regulate marketing of unhealthy food to children, mainly on television and in schools (Taillie et al. 2019), and many other efforts are ongoing across the globe (European Commission 2019). The aim to counter the increase in obesity in children and target products high in saturated fats, trans-fatty acids, free sugars and/or salt (WHO 2010) was endorsed by 192 countries (Kovic et al. 2018). Nutrition and health claims for products are used by industry to increase sales, for example in the sport sector or for breakfast cereals. They can be informative, but can also be misleading if misused for promoting unhealthy food (Whalen et al. 2018; Ghosh and Sen 2019; Sussman et al. 2019).
Strong statutory marketing regulations can significantly reduce the exposure of children to, and sales of, unhealthy food compared with voluntary restrictions (Kovic et al. 2018; Temme et al. 2020). Data on effectiveness of marketing regulations with a broader food sustainability scope are not available. On the other hand, regulations that mobilise private investment into emerging food production technologies can be instrumental in curbing the cost and making them competitive (Bianchi et al. 2018a).
Voluntary sustainability standards: Voluntary sustainability standards are developed either by a public entity or by private organisations to respond to consumers’ demands for social and environmental standards (Fiorini et al. 2019). For example, the Dutch Green Protein Alliance, an alliance of government, industry, NGOs and academia, formulated a goal to shift the ratio of protein consumption from 60% animal source proteins currently to 40% by 2050 (Aiking and de Boer 2020), and Cool Food Pledge signatories (organisations that serve food, such as restaurants, hospitals and universities) committed to a 25% reduction in GHG emissions by 2030, compared with 2015 (Cool Food 2020). For firms, obtaining certification under such schemes can be costly, and costs are generally borne by the producers and/or supply chain stakeholders (Fiorini et al. 2019). The effectiveness of private voluntary sustainability standards is uncertain. Cazzolla Gatti et al. (2019) have investigated the effectiveness of the Roundtable on Sustainable Palm Oil on halting forest loss and habitat degradation in Southeast Asia and concluded that production of certified palm oil continued to lead to deforestation.
Organisational procurement: Green public procurement is a policy that aims to create additional demand for sustainable products (Bergmann Madsen 2018; Mazzocchi and Marino 2019) or decrease demand for less sustainable products (e.g., the introduction of ‘Meatless Monday’ by the Norwegian Armed Forces) (Cheng et al. 2018; Gava et al. 2018; Milford and Kildal 2019; Wilts et al. 2019). To improve dietary choices, organisations can increase the price of unsustainable options while decreasing the price of sustainable ones, or employ information or choice architecture measures (Goggins and Rau 2016; Goggins 2018). Procurement guidelines exist at global, national, organisational or local levels (Noonan et al. 2013; Neto and Gama Caldas 2018). Procurement rules in schools or public canteens increase the accessibility of healthy food and can improve dietary behaviour and decrease purchases of unhealthy food (Cheng et al. 2018; Temme et al. 2020).
Food regulations: Novel foods based on insects, microbial proteins or cellular agriculture must go through authorisation processes to ensure compliance with food safety standards before they can be sold to consumers. Several countries have ‘novel food’ regulations governing the approval of foods for human consumption. For example, the European Commission, in its update of the Novel Food Regulation in 2015, expanded its definition of novel food to include food from cell cultures, or that produced from animals by non-traditional breeding techniques (EU 2015).
For animal product analogues, regulatory pathways and procedures (Stephens et al. 2018) and terminology issues (defining equivalence questions) (Carrenõ and Dolle 2018; Pisanello and Ferraris 2018) need clarification, as does their relation to religious rules (Chriki and Hocquette 2020).
Examples of legislation targeting food waste include the French ban on wasting food approaching best-before dates, requiring its donation to charity organisations (Global Alliance for the Future of Food 2020). In Japan, the Food Waste Recycling Law set targets for food waste recycling for industries in the food sector for 2020, ranging between 50% for restaurants and 95% for food manufacturers (Liu et al. 2016).
12.4.4.3Informative Instruments.
Sustainable food-based dietary guidelines: National food-based dietary guidelines (FBDGs) provide science-based recommendations on food group consumption quantities. They are available for 94, mostly upper- and middle-income, countries globally (Wijesinha-Bettoni et al. 2021), are adapted to national cultural and socio-economic context, and can be used as a benchmark for food formulation standards for public and private food procurement, or to inform citizens (Bechthold et al. 2018; Temme et al. 2020). Most FBDGs are based on health considerations and only a few mention environmental sustainability aspects (Bechthold et al. 2018; Ritchie et al. 2018; Ahmed et al. 2019; Springmann et al. 2020). Implementation of FBDGs so far focuses largely in the education and health sectors, with few countries also using their potential for guiding food system policies in other sectors (Wijesinha-Bettoni et al. 2021).
Despite the fact that 1.5 billion people follow a vegetarian diet from choice or necessity, and that the position statements of various nutrition societies point out that vegetarian diets are adequate if well planned, few FBDGs give recommendations for vegetarian diets (Costa Leite et al. 2020). An increase in consumption of plant-based food is a recurring recommendation in FBDGs, though an explicit reduction or limit of animal-source proteins is not often included, with the exception of red or processed meat (Temme et al. 2020). To account for changing dietary trends, however, FBDGs need to incorporate sustainability aspects (Herforth et al. 2019). A healthy diet respecting planetary boundaries has been proposed by Willett et al. (2019), though some authors have questioned the validity of the nutritional (Zagmutt et al. 2019) or environmental implications, such as water use (Vanham et al. 2020). In October 2019, 14 global cities pledged to adhere to this ‘planetary health diet’ (C40 Cities 2019).
Education on food/nutrition and environment: Some consumers are reluctant to adopt sustainable healthy dietary patterns because of a lack of awareness of the environmental and health consequences of what they eat, but also out of suspicion towards alternatives that are perceived as not ‘natural’ and that seem to be difficult to integrate into their daily dietary habits (Hartmann and Siegrist 2017; Stephens et al. 2018; McBey et al. 2019; Siegrist and Hartmann 2020) or simply lack of knowledge on how to prepare or eat unfamiliar foods (El Bilali 2019; Aiking and de Boer 2020; Temme et al. 2020). Misconceptions may contribute, for example, to the belief that packaging or ‘food miles’ dominate the climate impact of food (Macdiarmid et al. 2016). However, spillover effects can induce sustainable behaviour from ‘entry points’ such as concerns about food waste (El Bilali 2019). Early-life experiences are crucial determinants for adopting healthy and sustainable lifestyles (Bascopé et al. 2019; McBey et al. 2019), so improved understanding of sustainability aspects in the education of public health practitioners and in university education is proposed (Wegener et al. 2018). Investment in education, particularly of women (Vermeulen et al. 2020), might lower the barrier for stronger policies to be accepted and effective (McBey et al. 2019; Temme et al. 2020) (medium evidence, high agreement ).
Food labels: Instruments to improve transparency and information on food sustainability aspects are based on the assumption of the ‘rational’ consumer. Information gives the necessary freedom of choice, but also the responsibility to make the ‘right choice’ (Kersh 2015; Bucher et al. 2016). Studies find a lack of consumer awareness about the link between own food choices and environmental effect (Grebitus et al. 2016; Leach et al. 2016; Hartmann and Siegrist 2017; de Boer et al. 2018) and so effective messaging is required to raise awareness and acceptance of potentially stricter food system policies.
Back-of-package labels usually provide detailed nutritional information (Temple 2019). Front-of-package labels simplify and interpret the information: for example, the traffic light system or the Nutri-Score label used in France (Kanter et al. 2018b) and the health star rating used in Australia and New Zealand (Shahid et al. 2020) provide an aggregate rating based on product attributes such as energy, sugar, saturated fat and fibre content; other labels warn against frequent consumption (e.g., in the 1990s Finland introduced a mandatory warning for products high in salt; the keyhole label was introduced in Sweden in 1989 (Storcksdieck genannt Bonsmann et al. 2020); and ‘high in’ (energy/saturated fat/sugar) labels were introduced in Chile in 2016 to reduce obesity (Corvalán et al. 2019)). Front-of-package labels serve also as an incentive to industry to produce healthier or more sustainable products, or can serve as a marketing strategy (Van Loo et al. 2014; Apostolidis and McLeay 2016; Kanter et al. 2018b). Carbon footprint labels can be difficult for consumers to understand (Hyland et al. 2017), and simple, interpretative summary indicators used on front-of-package labels (e.g., traffic lights) are more effective than more complex ones (Bauer and Reisch 2019; Ikonen et al. 2019; Temple 2019; Tørris and Mobekk 2019) (robust evidence, high agreement ). Reviews find mixed results but overall a positive effect of food labels in improving direct purchasing decisions (Hieke and Harris 2016; Sarink et al. 2016; Anastasiou et al. 2019; Shangguan et al. 2019; Temple 2019), and in raising levels of awareness, thus possibly increasing success of other policy instruments (Apostolidis and McLeay 2016; Samant and Seo 2016; Al-Khudairy et al. 2019; Miller et al. 2019; Temple 2019) (medium evidence, high agreement ).
12.4.4.4Behavioural Instruments
Choice architecture: Information is more effective if accompanied by reinforcement through structural changes or by changing the food environment, such as through product placement in supermarkets, to overcome the intention–behaviour gap (Bucher et al. 2016; Broers et al. 2017; Tørris and Mobekk 2019). Behavioural change strategies have also been shown to improve efficiencies of school food programmes (Marcano-Olivier et al. 2020).
Environmental considerations rank behind financial, health, or sensory factors for determining citizens’ food choices (Leach et al. 2016; Hartmann and Siegrist 2017; Neff et al. 2018; Rose 2018; Gustafson et al. 2019). There is evidence that choice architecture (‘nudging’) can be effective in influencing purchase decisions, but regulators do not normally explore this option (Broers et al. 2017). Examples of green nudging include making the sustainable option the default option, enhancing visibility, accessibility of, or exposure to, sustainable products and reducing visibility and accessibility of unsustainable products, or increasing the salience of healthy sustainable choices through social norms or food labels (Bucher et al. 2016; Wilson et al. 2016; Broers et al. 2017; Al-Khudairy et al. 2019; Bauer and Reisch 2019; Ferrari et al. 2019; Weinrich and Elshiewy 2019; Cialdini and Jacobson 2021). Available evidence suggests that choice architecture measures are relatively inexpensive and easy to implement (Ferrari et al. 2019; Tørris and Mobekk 2019), they are a preferred solution if a restriction of choices is to be avoided (Wilson et al. 2016; Kraak et al. 2017; Vecchio and Cavallo 2019), and can be effective (Arno and Thomas 2016; Bucher et al. 2016; Bianchi et al. 2018b; Cadario and Chandon 2018) if embedded in policy packages (Wilson et al. 2016; Tørris and Mobekk 2019) (medium evidence, high agreement ).
Choice architecture measures are also facilitated by growing market shares of animal-free protein sources taken up by discount chains and fast food companies, that enhance visibility of new products and ease integration into daily life for consumers, particularly if sustainable products are similar to the products they substitute (Slade 2018). This effect can be further increased by media and role models (Elgaaied-Gambier et al. 2018).
12.4.5Food Systems Governance
To support the policies outlined in Section 12.4.4, food system governance depends on the cooperation of actors across traditional sectors in several policy areas, in particular agriculture, nutrition, health, trade, climate, and environment (Termeer et al. 2018; Bhunnoo 2019; Diercks et al. 2019; iPES Food 2019; Rosenzweig et al. 2020b). Top-down integration, mandatory mainstreaming, or boundary-spanning structures like public-private partnerships may be introduced to promote coordination (Termeer et al. 2018). ‘Flow-centric’ rather than territory-centric governance combined with private governance mechanisms has enabled codes of conduct and certification schemes (Eakin et al. 2017), for example the Roundtable on Sustainable Palm Oil (RSPO), as well as commodity chain transparency initiatives and platforms like Trase (Meijaard et al. 2020; Pirard et al. 2020). Trade agreements are an emerging arena of governance in which improving GHG performance may be an objective, and trade agreements can involve sustainability assessments.
Research on food system governance is mostly non-empirical or case study based, which means that there is limited understanding of which governance arrangements work in specific social and ecological contexts to produce particular food system outcomes (Delaney et al. 2018). Research has identified a number of desirable attributes in food systems governance, including adaptive governance (Termeer et al. 2018), a systems perspective (Whitfield et al. 2018), governance that considers food system resilience (Ericksen 2008; Moragues-Faus et al. 2017; Meyer 2020), transparency, participation of civil society (Candel 2014; Duncan 2015;), and cross-scale governance (Moragues-Faus et al. 2017).
Food systems governance has multiple targets and objectives, not least contributing to the achievement of the SDGs. GHG emissions from food systems can be impacted by both interventions targeted at different parts of the food system and interventions in other systems, such as reducing deforestation or promoting reforestation (Lee et al. 2019). For example, policies targeting health can contribute to diet shifts away from red meat, while also influencing GHG emissions (Springmann et al. 2018b; Semba et al. 2020); national and local food self-sufficiency policies may also have GHG impacts (Kriewald et al. 2019; Loon et al. 2019). Cross-sectoral governance could enhance synergies between reduced GHG emissions from food systems and other goals; however, integrative paradigms for cross-sectoral governance between food and other sectors have faced implementation challenges (Delaney et al. 2018). For example, in the late 2000s, the water-energy-food nexus emerged as a framework for cross-sectoral governance, but has not been well integrated into policy (Urbinatti et al. 2020), perhaps because of perceptions that it is an academic concept, or that it takes a technical-administrative view of governance; simply adopting the paradigm is not sufficient to develop effective nexus governance (Cairns and Krzywoszynska 2016; Weitz et al. 2017; Pahl-Wostl et al. 2018). Other policy paradigms and theoretical frameworks that aim to integrate food systems governance include system transition, agroecology, multifunctionality in agriculture (Andrée et al. 2018), climate-smart agriculture (Taylor 2018) and the circular economy (Box 12.4). Cross-sectoral coordination on food systems and climate governance could be aided by internal recognition and ownership by agencies, dedicated budgets for cross-sectoral projects, and consistency in budgets (Pardoe et al. 2018) (Boxes 12.1 and 12.2).
Food systems governance is still fragmented at national levels, which means that there may be a proliferation of efforts that cannot be scaled and are ineffective (Candel 2014). National policies can be complemented or possibly pioneered by initiatives at the local level (de Boer et al. 2018; Rose 2018). The city-region has been proposed as a useful focus for food system governance (Vermeulen et al. 2020); for example, the Milan Urban Food Policy Pact involves 180 global cities committed to integrative food system strategies (Candel 2019; Moragues-Faus 2021). Local food policy groups and councils that assemble stakeholders from government, civil society, and the private sector have formed trans-local networks of place-based local food policy groups, with over two hundred food policy councils worldwide (Andrée et al. 2018). However, the fluidity and lack of clear agendas and membership structures may hinder their ability to confront fundamental structural issues like unsustainable diets or inequities in food access (Santo and Moragues-Faus 2019).
Early characterisations of food systems governance featured a binary distinction between global and local scales, but this has been replaced by a relational approach where the local governance is seen as a process that relies on the interconnections between scales (Lever et al. 2019). Cross-scalar governance is not simply an aggregation of local groups, but involves the telecoupling of distant systems; for example, transnational NGO networks have been able to link coffee retailers in the global North with producers in the global South via international NGOs concerned about deforestation and social justice (Eakin et al. 2017). Global governance institutions like the Committee on World Food Security can promote policy coherence globally and reinforce accountability at all levels (McKeon 2015), as can norm-setting efforts like the Voluntary Guidelines for the Responsible Governance of Tenure of Land, Fisheries and Forests (FAO 2012). Global multi-stakeholder processes like the UN Food Systems Summit can foster the development of principles for guiding further actions based on sound scientific evidence. The European Commission’s Farm to Fork strategy aims to promote policy coherence in food policy at EU and national levels, and could be the exemplar of a genuinely integrated food policy (Schebesta and Candel 2020).
Box 12.2 | Case Study: The Finnish Food2030 Strategy
Until 2016, the strategic goals of Finnish food policy were split between different programmes and ministries, resulting in fragmented national oversight of the Finnish food system. To enable policy coordination, a national food strategy was adopted in 2017 called Food2030 (Government of Finland 2017). Food2030 embodies a holistic food system approach and addresses multiple outcomes of the food system, including the competitiveness of the food supply chain and the development of local, organic and climate-friendly food production, as well as responsible and sustainable consumption.
The specific policy mix covers a range of policy instruments to enable changes in agro-food supply, processing and societal norms (Kugelberg et al. 2021). The government provides targeted funding and knowledge support to drive technological innovations on climate solutions to reduce emissions from food and in the agriculture, forestry and land use sectors. In addition, the Finnish government applies administrative means, such as legislation, advice, guidance on public procurement and support schemes to diversify and increase organic food production to 20% of arable land, which in turn improve the opportunities for small-scale food production and steer public bodies to purchase local and organic food. The Finnish government applies educational and informative instruments to enable a shift to healthy and sustainable dietary behaviours. The policy objective is to reduce consumption of meat and replace it with other sources of protein, aligned with nutrition recommendations and avoiding food waste. The Ministry of Agriculture and Forestry, in collaboration with the Finnish Farmer’s unions and the Union of Swedish-speaking Farmers and Forest Owners in Finland, ran a two-year multi-media campaign in 2018 with key messages on the sustainability, traceability and safety of locally-produced food (Ministry of Agriculture and Forestry 2021). A ’Food Facts’ website project (Luke 2021), funded by the Ministry of Agriculture and Forestry in collaboration with the Natural Resources Institute Finland and the Finnish Food Safety Authority, helps to raise knowledge about food, which could shape responsible individual food behaviour, for example choosing local and sustainable foods and reducing food waste.
A critical enabler for developing a shared food system strategy across sectors and political party boundaries was the implementation of a one-year inclusive, deliberative and consensual stakeholder engagement process. A wide range of stakeholders could exert real influence during the vision-building process, resulting in strong agreement on key policy objectives, and subsequently an important leverage point to policy change (Kugelberg et al. 2021). Moreover, cross-sectoral coordination of Food2030 and the government’s wider climate action programmes are enabled by a number of institutional mechanisms and collaborative structures, for example the advisory board for the food chain, formally established during the agenda-setting stage of Food2030, inter-ministerial committees to guide and assess policy implementation, and Our Common Dining Table, a multi-stakeholder partnership that assembles 18 food system actors to engage in reflexive discussions about the Finnish food system.
Box 12.2
Critical barriers to strategy and policy formulation include a lack of attention to integrated impact assessments (Kugelberg et al. 2021), which blurs a transparent overview of potential trade-offs and hidden conflicts. There were few policy evaluations from independent organisations to inform policymaking, reducing the opportunities for more progressive policy approaches. Monitoring and food policy evaluation is very close to the ministry in charge, which hampers critical thinking about policy measures (Hildén et al. 2014). In addition, there is a lack of standardised indicators covering the whole food system, which hinders comprehensive oversight of progress towards a sustainable food system (Kanter et al. 2018a). Some of the problems related to monitoring, reporting and verification (MRV) are typical for countries in the EU. To improve, MRV will probably require structural changes, such as efforts to build up institutional capacity and application of new technology, development of standardised indicators covering the whole food system, regulations on transparency and verification, and mechanisms to enable reflexive discussions between business, farmers, public, NGOs and the government (Meadowcroft and Steurer 2018; Kanter et al. 2020).
12.5Land-related Impacts, Risks and Opportunities Associated with Mitigation Options
12.5.1Introduction
This section provides a cross-sectoral perspective on land occupation and related impacts, risks and opportunities associated with land-based mitigation options, as well as mitigation options that are not designated land-based, yet occupy land. It builds on Chapter 7, which covers mitigation in agriculture, forestry and other land use (AFOLU, including future availability of biomass resources for mitigation in other sectors. It complements Section 12.4, which covers mitigation inherent in the food system, as well as Chapters 6, 9, 10 and 11, which cover mitigation in the energy, transport, building and industry sectors, and Chapters 3 and 4 which cover land and biomass use, primarily in energy applications, in mitigation and development pathways in the near- to mid-term (Chapter 4) and in pathways compatible with long-term goals (Chapter 3).
The deployment of climate change mitigation options often affects land and water conditions, and ecosystem capacity to support biodiversity and a range of ecosystem services (IPCC 2019a; IPBES 2019) (robust evidence, high agreement ). It can increase or decrease terrestrial carbon stocks and sink strength, hence impacting the mitigation effect positively or negatively. As for any other land uses, impacts, risks and opportunities associated with mitigation options that occupy land depend on deployment strategy and on contextual factors that vary geographically and over time (Doelman et al. 2018; Hurlbert et al. 2019; Smith et al. 2019a; Wu et al. 2020) (robust evidence, high agreement ).
The IPCC Special Report on Global Warming of 1.5°C (SR1.5) found that large areas may be utilised for A/R and energy crops in modelled pathways limiting warming to 1.5°C (Rogelj et al. 2018). The SRCCL investigated the implications of land-based mitigation measures for land degradation, food security and climate change adaptation. It focused on identification of synergies and trade-offs associated with individual land-based mitigation measures (Smith et al. 2019b). In this section we expand beyond the scope of the Special Report on Climate Change and Land (SRCCL) assessment to include also mitigation measures that occupy land while not being considered land-based measures, we discuss ways to minimise potential adverse effects, and we consider the potential for synergies through integrating mitigation measures with other land uses, by applying a systems perspective that seeks to meet multiple objectives from multi-functional landscapes. Mitigation measures with zero land occupation, e.g., offshore wind and kelp farming, are not considered.
12.5.2Land Occupation Associated with Different Mitigation Options
As reported in Chapter 3, in scenarios limiting warming to 1.5°C (>50%) with no or limited overshoot, median area dedicated for energy crops in 2050 is 1.99 (0.56 to 4.82) million square kilometres (Mkm 2) and median forest area increased 3.22 (–0.67 to 8.90) Mkm 2 in the period 2019 to 2050 (5–95th percentile range, scenario category C1). For comparison, the total global areas of forests, cropland and pasture (in 2015) are in the SRCCL estimated at about 40 Mkm 2, 15.6 Mkm 2, and 27.3 Mkm 2, respectively (additionally, 21 Mkm 2 of savannahs and shrublands are also used for grazing) (IPCC 2019a). The SRCCL concluded that conversion of land for A/R and bioenergy crops at the scale commonly found in pathways limiting warming to 1.5°C or 2°C is associated with multiple feasibility and sustainability constraints, including land carbon losses ( high confidence). Pathways in which warming exceeds 1.5°C require less land-based mitigation, but the impacts of higher temperatures on regional climate and land, including land degradation, desertification, and food insecurity, become more severe (Smith et al. 2019b).
Depending on emissions-reduction targets, the portfolio of mitigation options chosen, and the policies developed to support their implementation, different land-use pathways can arise with large differences in resulting agricultural and forest area. Some response options can be more effective when applied together (Smith et al. 2019b); for example, dietary change, efficiency increases, and reduced wastage can reduce emissions as well as the pressure on land resources, potentially enabling additional land-based mitigation such as A/R and cultivation of biomass crops for biochar, bioenergy and other bio-based products. The SRCCL (Smith et al. 2019b) report that dietary change combined with reduction in food loss and waste can reduce the land requirement for food production by up to 5.8 Mkm 2 (0.8–2.4 Mkm 2 for dietary change; about 2 Mkm 2 for reduced post-harvest losses, and 1.4 Mkm 2 for reduced food waste) (Parodi et al. 2018; Springmann et al. 2018; Clark et al. 2020; Rosenzweig et al. 2020b) (Sections 7.4 and 12.4). Stronger mitigation action in the near term targeting non-CO2 emissions reduction and deployment of other CDR options (DACCS, enhanced weathering, ocean-based approaches; see Section 12.3) can reduce the land requirement for land-based mitigation (Obersteiner et al. 2018; van Vuuren et al. 2018).
Global integrated assessment models (IAMs) provide insights into the roles of land-based mitigation in pathways limiting warming to 1.5°C or 2°C; interaction between land-based and other mitigation options such as wind and solar power; influence of land-based mitigation on food markets, land use and land carbon; and the role of BECCS vis-à-vis other CDR options (Chapter 3). However, IAMs do not capture more subtle changes in land management and in the associated industrial/energy systems due to relatively coarse temporal and spatial resolution, and limited representation of land quality and feedstocks/management practices, interactions between biomass production and conversion systems, and local context, for example, governance of land use (Daioglou et al. 2019; Rose et al. 2020; Welfle et al. 2020; Calvin et al. 2021). A/R have generally been modelled as forests managed for carbon sequestration alone, rather than forestry providing both carbon sequestration and biomass supply (Calvin et al. 2021). Because IAMs do not include options to integrate new biomass production with existing agricultural and forestry systems (Paré et al. 2016; Mansuy et al. 2018; Cossel et al. 2019; Braghiroli and Passarini 2020; Djomo et al. 2020; Moreira et al. 2020; Strapasson et al. 2020; Rinke Dias de Souza et al. 2021), they may over-estimate the total additional land area required for biomass production. On the other hand, some integrated biomass production systems may prove less attractive to landholders than growing biomass crops in large blocks, from logistic, economic, or other points of view (Ssegane et al. 2016; Busch 2017; Ferrarini et al. 2017).
Land occupation associated with mitigation options other than A/R and bioenergy is rarely quantified in global scenarios. Stressing large uncertainties (e.g., type of biomass used and share of solar PV integrated in buildings), Luderer et al. (2019) modelled land occupation and land transformation associated with a range of alternative power system decarbonisation pathways in the context of a global 2°C climate stabilisation effort. On a per-megawatt hour (MWh) basis, bioelectricity with CCS was most land intensive, followed by hydropower, coal with CCS, and concentrated solar power (CSP), which in turn were around five times as land-intensive as wind and solar photovoltaics (PV). A review of studies of power densities (electricity generation per unit land area) confirmed the relatively larger land occupation associated with biopower, although hydropower overlaps with biopower (van Zalk and Behrens 2018). This study also quantifies the low land occupation of nuclear energy, similar to fossil energy sources.
The land occupation of PV depends on the share of ground-mounted versus buildings-integrated PV, the latter assumed to reach 75% share by 2050 (Luderer et al. 2019). van de Ven et al. (2021) assumed a 3% share of urbanised land in 2050 available for rooftop PV; Capellán-Pérez et al. (2017) and Dupont et al. (2020) report 2–3% availability of urbanised surface area, when considering factors such as roof slopes and shadows between buildings, and threshold relating to energy return on investment. Land occupation of solar technologies is considered to be underestimated in studies assuming ideal conditions, with real occupation being five to ten times higher (De Castro et al. 2013; MacKay 2013; Ong et al. 2013; Smil 2015; Capellán-Pérez et al. 2017).
Production of hydrogen and synthetic hydrocarbon fuels via electrolysis and hydrocarbon synthesis is subject to conversion losses that vary depending on technology, system integration and source of carbon (Wulf et al. 2020; Ince et al. 2021) (Sections 6.4.4.1 and 6.4.5.1). Indicative electricity-to-hydrocarbon fuel efficiency loss is estimated at about 60% (Ueckerdt et al. 2021). The advantage of smaller land occupation for solar, wind, hydro and nuclear, compared with biomass-based options, is therefore smaller for hydrocarbon fuels than for electricity. Furthermore, biofuels are often co-produced with other bio-based products, which further reduces their land occupation, although comparisons are complicated by inconsistent approaches to allocating land occupation between co-products (Ahlgren et al. 2015; Czyrnek-Delêtre et al. 2017).
Note that comparisons on a per-MWh basis do not reflect the GHG emissions associated with the power options, or that the different options serve different functions in power systems. Reservoir hydropower and biomass-based dispatchable power can complement other balancing options (e.g., battery storage, grid extensions and demand-side management (Göransson and Johnsson 2018) (Chapter 6) to provide power stability and quality needed in power systems with large amounts of variable electricity generation from wind and solar power plants. Furthermore, the requirements of transport in grids, pipelines and so on differ. For example, electricity from buildings-integrated PV can be used in the same location as it is generated.
The character of land occupation, and, consequently, the associated impacts (Section 12.5.3), vary considerably among mitigation options and also for the same option depending on geographic location, scale, system design and deployment strategy (Olsson et al. 2019; Ioannidis and Koutsoyiannis 2020; van de Ven et al. 2021). Land occupation associated with different mitigation options can be large uniform areas (e.g., large solar farms, reservoir hydropower dams, or tree plantations), or more distributed, such as wind turbines, solar PV, and patches of biomass cultivation integrated with other land uses in heterogeneous landscapes (Cacho et al. 2018; Jager and Kreig 2018; Correa et al. 2019; Englund et al. 2020a). Studies with broader scope, covering total land use requirement induced by plant infrastructure, provide a more complete picture of land footprints. For example, Wu et al. (2021) quantified a land footprint for the infrastructure of a pilot solar plant being three times the onsite land area. Sonter et al. (2020b) found significant overlap of mining areas (82% targeting materials needed for renewable energy production) and biodiversity conservation sites and priorities, suggesting that strategic planning is critical to address mining threats to biodiversity (Section 12.5.4) along with recycling and exploration of alternative technologies that use that use abundant minerals (Box 10.6).
There are also situations where expanding mitigation is more or less decoupled from additional land use. The use of organic consumer waste, harvest residues and processing side-streams in the agriculture and forestry sectors can support significant volumes of bio-based products with relatively lower land-use change risks than dedicated biomass production systems (Hanssen et al. 2019; Spinelli et al. 2019; Mouratiadou et al. 2020). Such uses can provide waste management solutions while increasing the mitigation achieved from the land that is already used for agricultural and forest production. Bioenergy accounts for about 90% of renewable heat used in industrial applications, mainly in industries that can use their own biomass waste and residues, such as the pulp and paper industry, food industry, and ethanol production plants (IEA 2020c) (Chapters 6 and 11). Heat and electricity produced on-site from side-streams but not needed for the industrial processes can be sold to other users, such as district heating systems. Surplus waste and residues can also be used to produce solid and liquid biofuels, or be used as feedstock in other industries such as the petrochemical industry (IRENA 2018; Lock and Whittle 2018; Thunman et al. 2018; IRENA 2019; Haus et al. 2020) (Chapters 6 and 11). Electrification and improved process efficiencies can reduce GHG emissions and increase the share of harvested biomass that is used for production of bio-based products (Johnsson et al. 2019; Madeddu et al. 2020; Lipiäinen and Vakkilainen 2021; Rahnama Mobarakeh et al. 2021; Silva et al. 2021) (Chapter 11). Besides integrating solar thermal panels and solar PV into buildings and other infrastructure, floating solar PV panels in, for example, hydropower dams (Ranjbaran et al. 2019; Cagle et al. 2020; Haas et al. 2020; Lee et al. 2020; Gonzalez Sanchez et al. 2021), and over canals (Lee et al. 2020; McKuin et al. 2021) could decouple renewable energy generation from land use while simultaneously reducing evaporation losses and potentially mitigating aquatic weed growth and climate change impacts on water body temperature and stratification (Cagle et al. 2020; Exley et al. 2021; Gadzanku et al. 2021; Solomin et al. 2021).
12.5.3Consequences of Land Occupation: Biophysical and Socio-economic Risks, Impacts and Opportunities
Land occupation associated with mitigation options can present challenges related to impacts and trade-offs, but can also provide opportunities and in different ways support the achievement of additional societal objectives, including adaptation to climate change. This section focuses on mitigation options that have significant risks, impacts and/or co-benefits with respect to land resources, food security and the environment. Bioenergy (with or without CCS), biochar and bio-based products require biomass feedstocks that can be obtained from purpose-grown crops, residues from conventional agriculture and forestry systems, or from biomass wastes, each with different implications for the land. Here we consider separately (i) ‘biomass-based systems’, including dedicated biomass crops (e.g., perennial grasses, short rotation woody crops) and biomass produced as a co-product of conventional agricultural production (e.g., maize stover), and (ii) ‘afforestation/reforestation’, including forests established for ecological restoration and plantations grown for forest products and agroforestry, where biomass may also be a co-product. We then discuss impacts and opportunities common to both systems, before considering impacts and opportunities associated with non-land-based mitigation options that nevertheless occupy land.
Mitigation options that are based on the use of biomass, that is, bioenergy/BECCS, biochar, wood buildings, and other bio-based products, can have different positive and negative effects depending on the character of the mitigation option, the land use, the biomass conversion process, how the bio-based products are used and what other product they substitute (Leskinen et al. 2018; Howard et al. 2021; Myllyviita et al. 2021). The impacts of the same mitigation option can therefore vary significantly and the outcome in addition depends on previous land/biomass use (Cowie et al. 2021). As biomass-based systems commonly produce multiple food, material and energy products, it is difficult to disentangle impacts associated with individual bio-based products (Ahlgren et al. 2015; Djomo et al. 2017; Obydenkova et al. 2021). As for other mitigation options, governance has a critical influence on outcome, but larger scale and higher expansion rate generally translates into higher risk for negative outcomes such as competition for scarce land, freshwater and phosphorous resources, displacement of natural ecosystems, and diminishing capacity of agroecosystems to support biodiversity and essential ecosystem services, especially if produced without sustainable land management and in inappropriate contexts (Popp et al. 2017; Dooley and Kartha 2018; Hasegawa et al. 2018; Heck et al. 2018; Humpenöder et al. 2018; Fujimori et al. 2019; Hurlbert et al. 2019; IPBES 2019; Smith et al. 2019b; Drews et al. 2020; Hasegawa et al. 2020; Schulze et al. 2020; Stenzel et al. 2021) (medium evidence, high agreement ).
Removal of crop and forestry residues can cause land degradation through soil erosion and decline in nutrients and soil organic matter (Cherubin et al. 2018) (robust evidence, high agreement ). These risks can be reduced by retaining a proportion of the residues to protect the soil surface from erosion and moisture loss and maintain or increase soil organic matter (Section 7.4.3.6); incorporating a perennial groundcover into annual cropping systems (Moore et al. 2019); and by replacing nutrients removed, such as by applying ash from bioenergy combustion plants (Kludze et al. 2013; Harris et al. 2015; Warren Raffa et al. 2015; de Jong et al. 2017) while safeguarding against contamination risks (Pettersson et al. 2020) (medium evidence, high agreement ). Besides topography, soil, and climate conditions, sustainable residue removal rates also depend on the fate of extracted biomass. For example, to maintain the same level of soil organic carbon, the harvest of straw, if used for combustion (which would return no carbon to fields), was estimated to be only 26% of the rate that could be extracted if used for anaerobic digestion involving return of recalcitrant carbon to fields (Hansen et al. 2020). Similarly, biomass pyrolysis produces biochar which can be returned to soils to counteract carbon losses associated with biomass extraction (Joseph et al. 2021; Lehmann et al. 2021).
Expansion of biomass crops, especially monocultures of exotic species, can pose risks to natural ecosystems and biodiversity through introduction of invasive species and land use change, also impacting the mitigation value (robust evidence, high agreement ) (Liu et al. 2014; El Akkari et al. 2018). Cultivation of conventional oil, sugar, and starch crops tends to have larger negative impact than lignocellulosic crops (Núñez-Regueiro et al. 2020). Social and environmental outcomes can be enhanced through integration of suitable plants (such as perennial grasses and short rotation woody crops) into agricultural landscapes (within crop rotations or through strategic localisation, for example as contour belts, along fencelines and riparian buffers). Such integrated systems can provide shelter for livestock, retention of nutrients and sediment, erosion control, pollination, pest and disease control, and flood regulation (robust evidence, high agreement ) (Berndes et al. 2008; Christen and Dalgaard 2013; Asbjornsen et al. 2014; Holland et al. 2015; Ssegane et al. 2015; Dauber and Miyake 2016; Milner et al. 2016; Ssegane and Negri 2016; Styles et al. 2016; Zheng et al. 2016; Ferrarini et al. 2017; Crews et al. 2018; Henry et al. 2018a; Zalesny et al. 2019; Osorio et al. 2019; Englund et al. 2020b; Englund et al. 2021) (Figure 12.8, Box 12.3, and Cross-Working Group Box 3 in this chapter). Many of the land use practices described above align with agroecology principles (AR6 WGII Section 5.1 4, AR6 WGII Box 5.11 and AR6 WGII Cross-Chapter Box NATURAL) and can simultaneously contribute to climate change mitigation, climate change adaptation and reduced risk of land degradation (IPCC 2019a) (robust evidence, high agreement ).

Figure 12.8 | Overview of opportunities related to selected land-based climate change mitigation options.
When A/R activities comprise the establishment of natural forests, the risk to land is primarily associated with potential displacement of previous land use to new locations, which could indirectly cause land-use change including deforestation (Sections 7.4.2 and 7.6.2.4). A/R (including agroforestry) aimed at providing timber, fibre, biomass, non-timber resources and other ecosystem services can provide renewable resources to society and long-term livelihoods for communities. Forest management and harvesting regimes around the world will adjust in different ways as society seeks to meet climate goals. The outcome depends on forest type, climate, forest ownership and the character and product portfolio of the associated forest industry (Lauri et al. 2019; Favero et al. 2020). How forest carbon stocks, biodiversity, hydrology, and so on are affected by changes in forest management and harvesting in turn depends on both management practices and the characteristics of the forest ecosystems (Eales et al. 2018; Griscom et al. 2018; Kondo et al. 2018; Nieminen et al. 2018; Thom et al. 2018; Runting et al. 2019; Tharammal et al. 2019) (robust evidence, medium agreement ). As described above, the GHG savings achieved from producing and using bio-based products will in addition depend on the character of existing societal systems, including technical infrastructure and markets, as this determines the product substitution patterns.
Environmental and socio-economic co-benefits are enhanced when ecological restoration principles are applied (Gann et al. 2019) along with effective planning at landscape level and strong governance (Morgan et al., 2020). For example, restoration of natural vegetation and establishing plantations on degraded land enable organic matter to accumulate in the soil and have potential to deliver significant co-benefits for biodiversity, land resource condition and livelihoods (Box 12.3 and Cross-Working Group Box 3 in this chapter). Tree planting and agroforestry on cleared land can deliver biodiversity benefits (Seddon et al. 2009; Kavanagh and Stanton 2012; Law et al. 2014), with biodiversity outcomes influenced by block size, configuration and species mix (Cunningham et al. 2015; Paul et al. 2016) (robust evidence, high agreement ).
Biomass-based systems and A/R can contribute to addressing land degradation through land rehabilitation or restoration (Box 12.3). Land-based mitigation options that produce biomass for bioenergy/BECCS or biochar through land rehabilitation rather than land restoration imply a trade-off between production / carbon sequestration and biodiversity outcomes (Hua et al. 2016; Cowie et al. 2018). Restoration, seeking to establish native vegetation with the aim to maximise ecosystem integrity, landscape connectivity, and conservation of on-ground carbon stock, will have higher biodiversity benefits than rehabilitation measures (Lin et al. 2013). However, sequestration rate declines as forests mature, and the sequestered carbon is vulnerable to loss through disturbance such as wildfire, so there is a higher risk of reversal of the mitigation benefit compared with use of biomass for substitution of fossil fuels and GHG-intensive building materials (Russell and Kumar 2017; Dugan et al. 2018; Anderegg et al. 2020). Trade-offs between different ecosystem services, and between societal objectives including climate change mitigation and adaptation, can be managed through integrated landscape approaches that aim to create a mosaic of land uses, including conservation, agriculture, forestry and settlements (Freeman et al. 2015; Nielsen 2016; Reed et al. 2016; Sayer et al. 2017) where each is sited with consideration of land potential and socio-economic objectives and context (Cowie et al. 2018) (limited evidence, high agreement ).
Impacts of biomass production and A/R on the hydrological cycle and water availability and quality depend on scale, location, previous land use/cover and type of biomass production system. For example, extraction of logging residues in forests managed for timber production has little effect on hydrological flows, while land-use change to establish dedicated biomass production can have a significant effect (Teter et al. 2018; Drews et al. 2020). Deployment of A/R can affect temperature, albedo and precipitation locally and regionally, and can mitigate or enhance the effects of climate change in the affected areas (Stenzel et al. 2021b) (Section 7.2.4). A/R activities can increase evapotranspiration, impacting groundwater and downstream water availability, but can also result in increased infiltration to groundwater and improved water quality (Farley et al. 2005; Zhang et al. 2016; Zhang et al. 2017; Lu et al. 2018) and can be beneficial where historical clearing has caused soil salinisation and stream salinity (Farrington and Salama 1996; Marcar 2016). There is limited evidence that very large-scale land-use or vegetation cover changes can alter regional climate and precipitation patterns, for example downwind precipitation depends on upwind evapotranspiration from forests and other vegetation (Keys et al. 2016; Ellison et al. 2017; van der Ent and Tuinenburg 2017).
Another example of beneficial effects includes perennial grasses and woody crops planted to intercept runoff and subsurface lateral flow, reducing nitrate entering groundwater and surface waterbodies (Femeena et al. 2018; Woodbury et al. 2018; Griffiths et al. 2019). In India, Garg et al. (2011) found desirable effects as a result of planting Jatropha on wastelands previously used for grazing (which could continue in the Jatropha plantations): soil evaporation was reduced, as a larger share of the rainfall was channelled to plant transpiration and groundwater recharge, and less runoff resulted in reduced soil erosion and improved downstream water conditions. Thus, adverse effects can be reduced and synergies achieved when plantings are sited carefully, with consideration of potential hydrological impacts (Davis et al. 2013).
Several biomass conversion technologies can generate co-benefits for land and water. Anaerobic digestion of organic wastes (e.g., food waste, manure) produces a nutrient-rich digestate and biogas that can be utilised for heating and cooking or upgraded for use in electricity generation, industrial processes, or as transportation fuel (Chapter 6) (Parsaee et al. 2019; Hamelin et al. 2021). The digestate is a rich source of nitrogen, phosphorus and other plant nutrients, and its application to farmland returns exported nutrients as well as carbon (Cowie 2020b). Studies have identified potential risks, including manganese toxicity, copper and zinc contamination, and ammonia emissions, compared with application of undigested animal manure (Nkoa 2014). Although the anaerobic digestion process reduces pathogen risk compared with undigested manure feedstocks, it does not destroy all pathogens (Nag et al. 2019). Leakage of methane is a significant risk that needs to be managed, to ensure mitigation potential is achieved (Bruun et al. 2014). Anaerobic digestion of wastewater, such as sugarcane vinasse, reduces methane emissions and pollution loading as well as producing biogas (Parsaee et al. 2019).
Biorefineries can convert biomass to food, feed and biomaterials along with bioenergy (Aristizábal‐Marulanda and Cardona Alzate 2019; Schmidt et al. 2019). Biorefinery plants are commonly characterised by high process integration to achieve high resource use efficiency, minimise waste production and energy requirements, and maintain flexibility towards changing markets for raw materials and products (Schmidt et al. 2019). Emerging technologies can convert biomass that is indigestible for monogastric animals or humans (e.g., algae, grass, clover or alfalfa) into food and feed products. For example, lactic acid bacteria can facilitate the use of green plant biomass such as grasses and clover to produce a protein concentrate suitable for animal feed and other products for material or energy use (Lübeck and Lübeck 2019). Selection of crops suitable for co-production of protein feed along with biofuels and other bio-based products can significantly reduce the land conversion pressure by reducing the need to cultivate other crops (e.g., soybean) for animal feed (Bentsen and Møller 2017; Solati et al. 2018). Thus, such solutions, using alternatives to high-input, high-emissions grain-based feed, can enable sustainable intensification of agricultural systems with reduced environmental impacts (Jørgensen and Lærke 2016). The use of seaweed and algae as biorefinery feedstock can facilitate recirculation of nutrients from waters to agricultural land, thus reducing eutrophication while substituting purpose-grown feed (Thomas et al. 2021).
Pyrolysis can convert organic wastes, including agricultural and forestry residues, food waste, manure, poultry litter and sewage sludge, into combustible gas and biochar, which can be used as a soil amendment (Joseph et al. 2021; Schmidt et al. 2021) (Chapter 7). Pyrolysis facilitates nutrient recovery from biomass residues, enabling return to farmland as biochar, noting, however, that a large fraction of nitrogen is lost during pyrolysis (Joseph et al. 2021). Conversion to biochar aids the logistics of transport and land application of materials such as sewage sludge, by reducing mass and volume, improving flow properties, stability and uniformity, and decreasing odour. Pyrolysis is well suited for materials that may be contaminated with pathogens, microplastics, and per- and polyfluoroalkyl substances, such as abattoir and sewage wastes, removing these risks, and reduces availability of heavy metals in feedstock (Joseph et al. 2021). Applying biochar to soil sequesters biochar-carbon for hundreds to thousands of years and can further increase soil carbon by reducing mineralisation of soil organic matter and newly added plant carbon (Singh et al. 2012; Wang et al. 2016a; Weng et al. 2017; Lehmann et al. 2021). Biochars can improve a range of soil properties, but effects vary depending on biochar properties, which are determined by feedstock and production conditions (Singh et al. 2012; Wang et al. 2016a), and on the soil properties where biochar is applied (Razzaghi et al. 2020). Biochars can increase nutrient availability, reduce leaching losses (Singh et al. 2010; Haider et al. 2017) and enhance crop yields, particularly in infertile acidic soils (Jeffery et al. 2017), thus supporting food security under changing climate. Biochars can enhance infiltration and soil water-holding capacity, reducing runoff and leaching, increasing water retention in the landscape and improving drought tolerance and resilience to climate change (Quin et al. 2014; Omondi et al. 2016). (See Chapter 7 for a review of biochar’s potential contribution to climate change mitigation.)
Both A/R and dedicated biomass production could have adverse impacts on food security and cause indirect land-use change if deployed in locations used for food production (IPCC 2019a). But the degree of impact associated with a certain mitigation option also depends on how deployment takes place and the rate and total scale of deployment. The highest increases in food insecurity due to deployment of land-based mitigation are expected to occur in sub-Saharan Africa and Asia (Hasegawa et al. 2018). The land area that could be used for bioenergy or other land-based mitigation options with low to moderate risks to food security depends on patterns of socio-economic development, reaching limits between 1 and 4 million km 2 (Hurlbert et al. 2019; IPCC 2019a; Smith et al. 2019c).
The use of less productive, degraded/marginal lands has received attention as an option for biomass production and other land-based mitigation that can improve the productive and adaptive capacity of the lands (Liu et al. 2017; Qin et al. 2018; Dias et al. 2021; Kreig et al. 2021) (Section 7.4.4 and Cross-Working Group Box 3 in this chapter). The potential is however uncertain as biomass growth rates may be low, a variety of assessment approaches have been used, and the identification of degraded/marginal land as ‘available’ has been contested, as much low productivity land is used informally by impoverished communities, particularly for grazing, or may be economically infeasible or environmentally undesirable for development of energy crops (medium evidence, low agreement ) (Baka 2013; Fritz et al. 2013; Haberl et al. 2013; Baka 2014).
As many of the SDGs are closely linked to land use, the identification and promotion of mitigation options that rely on land uses described above can support a growing use of bio-based products while advancing several SDGs, such as SDG 2 (zero hunger), SDG 6 (clean water and sanitation), SDG 7 (affordable and clean energy) and SDG 15 (life on land) (Fritsche et al. 2017; IRP 2019; Blair et al. 2021). Policies supporting the target of Land Degradation Neutrality (LDN) (SDG 15.3) encourage planning of measures to counteract loss of productive land due to unsustainable agricultural practices and land conversion, through sustainable land management and strategic restoration and rehabilitation of degraded land (Cowie et al. 2018). LDN can thus be an incentive for land-based mitigation measures that build carbon in vegetation and soil, and can provide impetus for land-use planning to achieve multifunctional landscapes that integrate land-based mitigation with other land uses (Box 12.3). The application of sustainable land management practices that build soil carbon will enhance the productivity and resilience of crop and forestry systems, thereby enhancing biomass production (Henry et al. 2018a). Non-bio-based mitigation options can enhance land-based mitigation: (i) enhanced weathering, that is, adding ground silicate rock to soil to take up atmospheric CO2 through chemical weathering (Section 12.3), could supply nutrients and alleviate soil acidity, thereby boosting productivity of biomass crops and A/R, particularly when combined with biochar application (Haque et al. 2019; De Oliveira Garcia et al. 2020; Buss et al. 2021); and (ii) land rehabilitation and enhanced landscape diversity through production of biomass crops could simultaneously contribute to climate change mitigation, climate change adaptation, addressing land degradation, increasing biodiversity and improving food security in the longer term (Mackey et al. 2020) (Chapter 7).
The land requirement and impacts (including visual and noise impacts) of onshore wind turbines depend on the size and type of installation, and location (Ioannidis and Koutsoyiannis 2020). Wind power and agriculture can coexist in beneficial ways and wind power production on agriculture land is well established (Fritsche et al. 2017; Miller and Keith 2018a). Spatial planning and local stakeholder engagement can reduce opposition due to visual landscape impacts and noise (Frolova et al. 2019; Hevia-Koch and Ladenburg 2019). Repowering, that is, replacing with higher capacity wind turbines, can mitigate additional land requirement associated with deployment towards higher share of wind in power systems (Pryor et al. 2020).
Mortality and disturbance risks to birds, bats and insects are major ecological concerns associated with wind farms (Thaxter et al. 2017; Cook et al. 2018; Heuck et al. 2019; Coppes et al. 2020; Choi et al. 2020; Fernández-Bellon 2020; Marques et al. 2020; Voigt 2021). Careful siting is critical (May et al. 2021), while painting blades to increase the visibility can also reduce mortality due to collision (May et al. 2020). Theoretical studies have suggested that wind turbines could lead to warmer night temperatures due to atmospheric mixing (Keith et al. 2004), later confirmed through observation (Zhou et al. 2013), although Vautard et al. (2014) found limited impact at scales consistent with climate policies. More recent studies report mixed results: indications that the warming effect could be substantial with widespread deployment (Miller and Keith 2018b) and conversely limited impacts on regional climate at 20% of US electricity from wind. (Pryor et al. 2020).
As for wind power, land impacts of solar power depend on the location, size and type of installation (Ioannidis and Koutsoyiannis 2020). Establishment of large-scale solar farms could have positive or negative environmental effects at the site of deployment, depending on the location. Solar PV and CSP power installations can lock away land areas, displacing other uses (Mohan 2017). Solar PV can be deployed in ways that enhance agriculture: for example, Hassanpour Adeh et al. (2018) found that biomass production and water use efficiency of pasture increased under elevated solar panels. PV systems under development may achieve significant power generation without diminishing agricultural output (Miskin et al. 2019). Global mapping of solar panel efficiency showed that croplands, grasslands and wetlands are located in regions with the greatest solar PV potential (Adeh et al. 2019). Dual-use agrivoltaic systems are being developed that overcome previously recognised negative impact on crop growth, mainly due to shadows (Marrou et al. 2013a; Marrou et al. 2013b; Armstrong et al. 2016), thus facilitating synergistic co-location of solar photovoltaic power and cropping (Adeh et al. 2019; Miskin et al. 2019). Assessment of the potential for optimising deployment of solar PV and energy crops on abandoned cropland areas produced an estimate of the technical potential for optimal combination at 125 EJ per year (Leirpoll et al. 2021).
Deserts can be well suited for solar PV and CSP farms, especially at low latitudes where global horizontal irradiance is high, as there is lower competition for land and land carbon loss is minimal, although remote locations may pose challenges for power distribution (Xu et al. 2016). Solar arrays can reduce the albedo, particularly in desert landscapes, which can lead to local temperature increases and regional impacts on wind patterns (Millstein and Menon 2011). Modelling studies suggest that large-scale wind and solar farms, for example in the Sahara (Li et al. 2018), could increase rainfall through reduced albedo and increased surface roughness, stimulating vegetation growth and further increasing regional rainfall (Li et al. 2018) (limited evidence). Besides impacts at the site of deployment, wind and solar power affect land through mining of critical minerals required by these technologies (Viebahn et al. 2015; McLellan et al. 2016; Carrara et al. 2020).
Nuclear power has land impacts and risks associated with mining operations (Falck 2015; Winde et al. 2017; Srivastava et al. 2020) and disposal of spent fuel (IAEA 2006a; Ewing et al. 2016; Bruno et al. 2020), but the land occupation is small compared to many other mitigation options. Substantial volumes of water are required for cooling (Liao et al. 2016), as for all thermal power plants, but most of this water is returned to rivers and other water bodies after use (Sesma Martín and Rubio-Varas 2017). Negative impacts on aquatic systems can occur due to chemical and thermal pollution loading (Fricko et al. 2016; Raptis et al. 2016; Bonansea et al. 2020). The major risk to land from nuclear power is that a nuclear accident leads to radioactive contamination. An extreme example, the 1986 Chernobyl accident in Ukraine, resulted in radioactive contamination across Europe. Most of the fallout concentrated in Belarus, Ukraine and Russia, where some 125,000 km 2 of land (more than a third of which was in agricultural use) was contaminated. About 350,000 people were relocated away from these areas (IAEA 2006b; Sovacool 2008). About 116,000 people were permanently evacuated from the 4200 km Chernobyl exclusion zone (IAEA 2006a). New reactor designs with passive and enhanced safety systems reduce the risk of such accidents significantly (Section 6.4.2.4). An example of alternatives to land reclamation for productive purposes, a national biosphere reserve has been established around Chernobyl to conserve, enhance and manage carbon stocks and biodiversity (Deryabina et al. 2015; Ewing et al. 2016), although invertebrate and plant populations are affected (Mousseau and Møller 2014; Mousseau and Møller 2020).
Reservoir hydropower projects submerge areas as dams are established for water storage. Hydropower can be associated with significant and highly varying land occupation and carbon footprint (Poff and Schmidt 2016; Scherer and Pfister 2016a; dos Santos et al. 2017; Ocko and Hamburg 2019). The flooding of land causes CH4 emissions due to the anaerobic decomposition of submerged vegetation and there is also a loss of carbon sequestration due to mortality of submerged vegetation. The size of GHG emissions depends on the amount of vegetation submerged. The carbon in accumulated sediments in reservoirs may be released to the atmosphere as CO2 and CH4 upon decommissioning of dams, and while uncertain, estimates indicate that these emissions can make up a significant part of the cumulative GHG emissions of hydroelectric power plants (Moran et al. 2018; Almeida et al. 2019; Ocko and Hamburg 2019). Positive radiative forcing due to lower albedo of hydropower reservoirs compared to surrounding landscapes can reduce mitigation contribution significantly (Wohlfahrt et al. 2021).
Hydropower can have high water usage due to evaporation from dams (Scherer and Pfister 2016b). Hydropower projects may impact aquatic ecology and biodiversity, necessitate the relocation of local communities living within or near the reservoir or construction sites, and affect downstream communities (in positive or negative ways) (Moran et al. 2018; Barbarossa et al. 2020). Displacement as well as resettlement schemes can have both socio-economic and environmental consequences including those associated with establishment of new agricultural land (Ahsan and Ahmad 2016; Nguyen et al. 2017). Dam construction may also stimulate migration into the affected region, which can lead to deforestation and other negative impacts (Chen et al. 2015 ). Impacts can be mitigated through basin-scale dam planning that considers GHG emissions along with social and ecological effects (Almeida et al. 2019). Land occupation is minimal for run-of-river hydropower installations, but without storage they have no resilience to drought and installations inhibit dispersal and migration of organisms (Lange et al. 2018). Reservoir hydropower schemes can regulate water flows and reduce flood damage to agricultural production (Amjath-Babu et al. 2019). On the other hand, severe flooding due to failure of hydropower dams has caused fatalities, damage to infrastructure and loss of productive land (Farrington and Salama 1996; Farley et al. 2005; Zhang et al. 2016; Marcar 2016; Zhang et al. 2017; Kalinina et al. 2018; Lu et al. 2018).
12.5.4Governance of Land-related Impacts of Mitigation Options
The land sector (Chapter 7) contributes to mitigation via emissions reduction and enhancement of land carbon sinks, and by providing biomass for mitigation in other sectors. Key challenges for governance of land-based mitigation include social and environmental safeguards (Duchelle et al. 2017; Sills et al. 2017; Larson et al. 2018); insufficient financing (Turnhout et al. 2017); capturing co-benefits; ensuring additionality; addressing non-permanence of carbon sequestration; monitoring, reporting, and verification (MRV) of emissions reduction and carbon dioxide removals; and avoiding leakage or spillover effects. Governance approaches to addressing these challenges are discussed in Section 7.6, and include MRV systems and integrity criteria for project-level emissions trading; payments for ecosystem services; land-use planning and land zoning; certification schemes, standards and codes of practice.
With respect to renewable energy options that occupy land, the focus of governance has been directed to technological adoption and public acceptance (Sequeira and Santos 2018), rather than land use. Recent work has found that spatial processes shape the emerging energy transition, creating zones of friction between global investors, national and local governments, and civil society (Jepson and Caldas 2017; McEwan 2017). For example, Yenneti et al. (2016) have argued that hydropower and ground-based solar parks in India, which have involved enclosure of lands designated as degraded, displacing pastoral use by vulnerable communities, have constituted forms of spatial injustice. Hydropower leads to dam-induced displacement, and though this can be addressed through compensation mechanisms, governance is complicated by a lack of transparency in resettlement data (Kirchherr et al. 2016; Kirchherr et al. 2019). Renewable energy production is resulting in new land conflict frontiers where degraded land is framed as having mitigation value such as for palm oil production and wind power in Mexico (Backhouse and Lehmann 2020); land use conflict as well as impacts on wildlife from large-scale solar installations have also emerged in the southwestern United States (Mulvaney 2017). The renewable energy transition also involves the extraction of critical minerals used in renewable energy technologies, such as lithium and cobalt. Governance challenges include the lack of transparent greenhouse gas accounting for mining activities (Lee et al. 2020a), and threats to biodiversity from land disturbance, which require strategic planning to address (Sonter et al. 2020a). Strategic spatial planning is needed more generally to address trade-offs between using land for renewable energy and food: for example, agriculture can be co-located with solar photovoltaics (Barron-Gafford et al. 2019) or wind power (Miller and Keith 2018a). Integrative spatial planning can integrate renewable energy with not just agriculture, but mobility and housing (Hurlbert et al. 2019). Integrated planning is needed to avoid scalar pitfalls, and local and regional contextualised governance solutions need to be sited within a planetary frame of reference (Biermann et al. 2016). Greater planning and coordination are also needed to ensure co-benefits from land-based mitigation (Box 12.3) as well as from CDR and efforts to reduce food systems emissions.
In emerging domains for governance such as land-based mitigation, global institutions, private sector networks and civil society organisations are playing key roles in terms of norm-setting. The shared languages and theoretical frameworks, or cognitive linkages (Pattberg et al. 2018), that arise with polycentric governance can not only be helpful in creating expectations and establishing benchmarks for (in)appropriate practices where enforceable ‘hard law’ is missing (Karlsson-Vinkhuyzen et al. 2018; Gajevic Sayegh 2020), they can also form the basis of voluntary guidelines or niche markets (Box 12.3) However, the ability to apply participatory processes for developing voluntary guidelines and other participatory norm-setting endeavours varies from place to place. Social and cultural norms shape the ability of women, youth, and different ethnic groups to participate in governance fora, such as those around agroecological transformation (Anderson et al. 2019). Furthermore, establishing new norms alone does not solve structural challenges such as lack of access to food, nor does it confront power imbalances, or provide mechanisms to deal with uncooperative actors (Morrison et al. 2019).
Box 12.3 | Land Degradation Neutrality as a Framework to Manage Trade-offs in Land-based Mitigation
The United Nations Convention to Combat Desertification (UNCCD) introduced the concept of Land Degradation Neutrality (LDN), defined as ‘a state whereby the amount and quality of land resources necessary to support ecosystem functions and services and enhance food security remain stable or increase within specified temporal and spatial scales and ecosystems’ (UNCCD 2015), and it has been adopted as a target of SDG 15 (life on land). At December 2020, 124 (mostly developing) countries had committed to pursue voluntary LDN targets.
The goal of LDN is to maintain or enhance land-based natural capital, and its associated ecosystem services, such as provision of food and regulation of water and climate, while enhancing the resilience of the communities that depend on the land. LDN encourages a dual-pronged approach promoting sustainable land management (SLM) to avoid or reduce land degradation, combined with strategic effort in land restoration and rehabilitation to reverse degradation on degraded lands and thereby deliver the target of ‘no net loss’ of productive land (Orr et al. 2017).
In the context of LDN, land restoration refers to actions undertaken with the aim of reinstating ecosystem functionality, whereas land rehabilitation refers to actions undertaken with a goal of provision of goods and services (Cowie et al. 2018). Restoration interventions can include destocking to encourage regeneration of native vegetation; shelter belts of local species established from seed or seedlings, strategically located to provide wildlife corridors and link habitat; and rewetting drained peatland. ‘Farmer-managed natural regeneration’ is a low-cost restoration approach in which regeneration of tree stumps and roots is encouraged, stabilising soil and
enhancing soil nutrients and organic matter levels (Chomba et al. 2020; Lohbeck et al. 2020). Rehabilitation actions include establishment of energy crops, or afforestation with fast-growing exotic trees to sequester carbon or produce timber. Application of biochar can facilitate rehabilitation by enhancing nutrient retention and water-holding capacity, and stimulating microbial activity (Cowie 2020a).
SLM, rehabilitation and restoration activities undertaken towards national LDN targets have potential to deliver substantial CDR through carbon sequestration in vegetation and soil. In addition, biomass production, for bioenergy or biochar, could be an economically viable land use option for reversing degradation, through rehabilitation. Alternatively, a focus on ecological restoration (Gann et al. 2019) as the strategy for reversing degradation will deliver greater biodiversity benefits.

Box 12.3, Figure 1 | Schematic illustrating the elements of the Land Degradation Neutrality conceptual framework. Source: Cowie et al. (2018). Used with permission.
Achieving neutrality requires estimating the likely impacts of land-use and land-management decisions, to determine the area of land, of each land type, that is likely to be degraded (Orr et al. 2017). This information is used to plan interventions to reverse degradation on an equal area of the same land type. Therefore, pursuit of LDN requires concerted and coordinated efforts to integrate LDN objectives into land-use planning and land management, underpinned by sound understanding of the human–environment system and effective governance mechanisms.
Countries are advised to apply a landscape-scale approach for planning LDN interventions, in which land uses are matched to land potential, and resilience of current and proposed land uses is considered, to ensure that improvement in land condition is likely to be maintained (Cowie 2020a). A participatory approach that enables effective representation of all stakeholders is encouraged, to facilitate equitable outcomes from planning decisions, recognising that decisions on LDN interventions are likely to involve trade-offs between various environmental and socio-economic objectives (Schulze et al. 2021).
Planning and implementation of LDN programmes provides a framework in which locally-adapted land-based mitigation options can be integrated with use of land for production, conservation and settlements, in multifunctional landscapes where trade-offs are recognised and managed, and synergistic opportunities are sought. LDN is thus a vehicle to focus collaboration in pursuit of the multiple land-based objectives of the multilateral environmental agreements and the SDGs.
Table 12.10 collates risks, impacts and opportunities associated with different mitigation options that occupy land.
Table 12.10 | Summary of impacts, risks and co-benefits associated with land occupation by mitigation options considered in Section 12. 5.
Mitigation option | Impacts and risks | Opportunities for co-benefits |
Non-bio-based options that may displace food production | ||
Solar farms | Land use competition; loss of soil carbon; heat island effect (scale dependent) (Sections 12.5.3 and 12.5.4) | Target areas unsuitable for agriculture such as deserts (Section 12.5.3) |
Hydropower (dams) | Land use competition; displacement of natural ecosystems; CO2 and CH4 emissions (Sections 12.5.3 and 12.5.4) | Water storage (including for irrigation) and regulation of water flows; pumped storage can store excess energy from other renewable generation sources (Section 12.5.3) |
Non-bio-based options that can (to a varying degree) be integrated with food production | ||
Wind turbines | May affect local/regional weather and climate (scale dependent); impacts on wildlife; visual impacts (Section 12.5.3) | Design and siting informed by visual landscape impacts, relevant habitats, and flight trajectories of migratory birds (Section 12.5.3) |
Solar panels | Land use competition (Section 12.5.3) | Integration with buildings and other infrastructure; integration with food production is being explored (Section 12.5.2) |
Enhanced weathering (EW) | Disturbance at sites of extraction; ineffective in low rainfall regions (Section 12.3.1.2) | Increased crop yields and biomass production through nutrient supply and increasing pH of acid soils; synergies with biochar (Section 12.5.3) |
Bio-based options that may displace existing food production | ||
Afforestation/reforestation (A/R) | Land use competition, potentially leading to indirect land use change; reduced water availability; loss of biodiversity (Section 12.5.3) | Strategic siting to minimise adverse impacts on hydrology, land use, biodiversity (Section 12.5.3) |
Biomass crops | Land use competition, potentially leading to indirect land-use change; reduced water availability; reduced soil fertility; loss of biodiversity (Section 12.5.3) | Strategic siting to minimise adverse impacts/enhance beneficial effects on land use, landscape variability, biodiversity, soil organic matter, hydrology and water quality (Section 12.5.3) |
Bio-based options that can (to a varying degree) be combined with food production | ||
Agroforestry | Competition with adjacent crops and pastures reduces yields (Section 7.4.3.3) | Shelter for stock and crops, diversification, biomass production, increases soil organic matter and soil fertility; increased biodiversity and perennial vegetation enhance beneficial organisms; can reduce need for pesticides (Sections 7.4.3.3 and 12.5.3) |
Soil carbon management in croplands and grasslands | Increase in nitrous oxide emissions if fertiliser used to enhance crop production; reduced cereal production through increased crop legumes and pasture phases could lead to indirect land use change (Sections 7.4.3.1 and 7.4.3.6) | Increasing soil organic matter improves soil health, increases crop and pasture yields and resilience to drought, can reduce fertiliser requirement, nutrient leaching and need for land use change (Section 7.4.3.1) |
Biochar addition to soil | Land use competition if biochar is produced from purpose-grown biomass. Loss of forest carbon stock and impacts on biodiversity if biomass is harvested unsustainably. (Section 12.5.3) | Facilitate beneficial use of organic residues, to return nutrients to farmland. Increased land productivity; increased carbon sequestration in vegetation and soil; increased nutrient-use efficiency, and reduced requirement for chemical fertiliser (Sections 7.4.3.2 and 12.5.3) |
Harvest residue extraction and use for bioenergy, biochar and other bio-products | Decline in soil organic matter and soil fertility (Section 12.5.3) | Nutrients returned to soil e.g., as ash; reduced fuel load and wildfire risk (Sections 7.4.3.2 and 12.5.3) |
Manure management (i.e., for biogas) | Risk of fugitive emissions Can contain pathogens (Sections 7.4.3.7 and 12.5.3) | Biogas as renewable energy source, digestate as soil amendment (Section 12.5.3) |
Options that do not occupy land used for food production | ||
Management of organic waste (food waste, biosolids, organic component of municipal solid waste) | Can contain contaminants (heavy metals, persistent organic pollutants, pathogens) (Section 12.5.3) | Processing using anaerobic digestion or pyrolysis produces renewable gas and soil amendment, enabling return of nutrients to farmland. (Note that some feedstock nitrogen is lost in pyrolysis) (Section 12.5.3) |
A/R and biomass production on degraded non-forested land (e.g., abandoned agricultural land) | High labour and material inputs can be needed; abandoned land can support informal grazing and have significant biodiversity value. Reduced water availability (Section 12.5.3) | Application of biochar can re-establish nutrient cycling; bioenergy crops can add organic matter, restoring soil fertility, and can remove heavy metals, enabling food production (Sections 7.4.3.2 and 12.5.3) |

Cross-Working Group Box 3, Figure 1 | Left: High-input intensive agriculture, aiming for high yields of a few crop species, with large fields and no semi-natural habitats. Right: Agroecological agriculture, supplying a range of ecosystem services, relying on biodiversity and crop and animal diversity instead of external inputs, and integrating plant and animal production, with smaller fields and presence of semi-natural habitats. Source: Reprinted by permission from Springer Nature Customer Service Centre GmbH: Springer Nature, Nature Sustainability, Towards better representation of organic agriculture in life cycle assessment, Hayo M. G. van der Werf et al. © 2020.
Cross-Working Group Box 3 | Mitigation and Adaptation via the Bioeconomy
Authors: Henry Neufeldt (Denmark/Germany), Göran Berndes (Sweden), Almut Arneth (Germany), Rachel Bezner Kerr (the United States of America/Canada), Luisa F Cabeza (Spain), Donovan Campbell (Jamaica), Jofre Carnicer Cols (Spain), Annette Cowie (Australia), Vassilis Daioglou (Greece), Joanna House (United Kingdom), Adrian Leip (Italy/Germany), Francisco Meza (Chile), Michael Morecroft (United Kingdom), Gert-Jan Nabuurs (Netherlands), Camille Parmesan (United Kingdom/the United States of America), Julio C. Postigo (the United States of America/Peru), Marta G. Rivera-Ferre (Spain), Raphael Slade (United Kingdom), Maria Cristina Tirado von der Pahlen (the United States of America/Spain), Pramod K. Singh (India), Pete Smith (United Kingdom)
Summary statement
The growing demand for biomass offers both opportunities and challenges to mitigate and adapt to climate change and natural resource constraints ( high confidence). Increased technology innovation, stakeholder integration and transparent governance structures and procedures at local to global scales are key to successful bioeconomy deployment maximising benefits and managing trade-offs (high confidence).
Limited global land and biomass resources accompanied by growing demands for food, feed, fibre, and fuels, together with prospects for a paradigm shift towards phasing out fossil fuels, set the frame for potentially fierce competition for land 3 and biomass to meet burgeoning demands, even as climate change increasingly limits natural resource potentials ( high confidence).
Cross-Working Group Box 3
Sustainable agriculture and forestry, technology innovation in bio-based production within a circular economy, and international cooperation and governance of global trade in products to reflect and disincentivise their environmental and social externalities, can provide mitigation and adaptation via bioeconomy development that responds to the needs and perspectives of multiple stakeholders to achieve outcomes that maximise synergies while limiting trade-offs (high confidence).
Background
There is high confidence that climate change, population growth and changes in per capita consumption will increase pressures on managed as well as natural and semi-natural ecosystems, exacerbating existing risks to livelihoods, biodiversity, human and ecosystem health, infrastructure, and food systems (Conijn et al. 2018; IPCC 2018; IPCC 2019a; Lade et al. 2020). At the same time, many global mitigation scenarios presented in IPCC assessment reports rely on large GHG emissions reduction in the AFOLU sector and concurrent deployment of reforestation/afforestation and biomass use in a multitude of applications (Rogelj et al. 2018; Hanssen et al. 2020) (AR6 WGI Chapters 4 and 5, AR6 WGIII Chapters 3 and 7).
Given the finite availability of natural resources, there are invariably trade-offs that complicate land-based mitigation unless land productivity can be enhanced without undermining ecosystem services (Obersteiner et al. 2016; Campbell et al. 2017; Caron et al. 2018; Conijn et al. 2018; Heck et al. 2018; Searchinger 2018a; Smith et al. 2019). Management intensities can often be adapted to local conditions with consideration of other functions and ecosystem services, but at a global scale the challenge remains to avoid further deforestation and degradation of intact ecosystems, in particular biodiversity-rich systems (AR6 WGII Cross-Chapter Box NATURAL), while meeting the growing demands. Further, increased land-use competition can affect food prices and impact food security and livelihoods (To and Grafton 2015; Chakravorty et al. 2017), with possible knock-on effects related to civil unrest (Abbott et al. 2017; D’Odorico et al. 2018).
Developing new bio-based solutions while mitigating overall biomass demand growth
Many existing bio-based products have significant mitigation potential. Increased use of wood in buildings can reduce GHG emissions from cement and steel production while providing carbon storage (Churkina et al. 2020). Substitution of fossil fuels with biomass in manufacture of cement and steel can reduce GHG emissions where these materials are difficult to replace. Dispatchable power based on biomass can provide power stability and quality as the contribution from solar and wind power increases (AR6 WGIII Chapter 6), and biofuels can contribute to reducing fossil fuel emissions in the transport and industry sectors (AR6 WGIII Chapters 10 and 11). The use of bio-based plastics, chemicals and packaging could be increased, and biorefineries can achieve high resource-use efficiency in converting biomass into food, feed, fuels and other bio-based products (Aristizábal‐Marulanda and Cardona Alzate 2019; Schmidt et al. 2019). There is also scope for substituting existing bio-based products with more benign products. For example, cellulose-based textiles can replace cotton, which requires large amounts of water, chemical fertilisers and pesticides to ensure high yields.
While increasing and diversified use of biomass can reduce the need for fossil fuels and other GHG-intensive products, unfavourable GHG balances may limit the mitigation value. Growth in biomass use may in the longer term also be constrained by the need to protect biodiversity and ecosystems’ capacity to support essential ecosystem services. Biomass use may also be constrained by water scarcity and other resource scarcities, and/or challenges related to public perception and acceptance due to impacts caused by biomass production and use. Energy conservation and efficiency measures and deployment of technologies and systems that do not rely on carbon, such as carbon-free electricity supporting, inter alia, electrification of transport as well as industry processes and residential heating (IPCC 2018; UNEP 2019), can constrain the growth in biomass demand when countries seek to phase out fossil fuels and other GHG-intensive products while providing an acceptable standard of living. Nevertheless, demand for bio-based products may become high where full decoupling from carbon is difficult to achieve (e.g., aviation, bio-based plastics and chemicals) or where carbon storage is an associated benefit (e.g., wood buildings, BECCS, biochar for soil amendments), leading to challenging trade-offs (e.g., food security, biodiversity) that need to be managed in environmentally sustainable and socially just ways.
Changes on the demand side as well as improvements in resource-use efficiencies within the global food and other bio-based systems can also reduce pressures on the remaining land resources. For example, dietary changes toward more plant-based food (where appropriate) and reduced food waste can provide climate change mitigation along with health benefits (Willett et al. 2019) (AR6 WGIII Sections 7.4 and 12.4) and other co-benefits with regard to food security, adaptation and land use (Mbow et al. 2019; Smith et al. 2019a) (AR6 WGII Chapter 5). Advancements in the provision of novel food and feed sources (e.g., cultured meat, insects, grass-based protein feed and cellular agriculture) can also limit the pressures on finite natural resources (Parodi et al. 2018; Zabaniotou 2018) (AR6 WGIII Section 12.4).
Cross-Working Group Box 3
Circular bioeconomy
Circular economy approaches (AR6 WGIII Section 12.6) are commonly depicted by two cycles, where the biological cycle focuses on regeneration in the biosphere and the technical cycle focuses on reuse, refurbishment and recycling to maintain value and maximise material recovery (Mayer et al. 2019a). Biogenic carbon flows and resources are part of the biological carbon cycle, but carbon-based products can be included in, and affect, both the biological and the technical carbon cycles (Kirchherr et al. 2017; Winans et al. 2017; Velenturf et al. 2019). The integration of circular economy and bioeconomy principles has been discussed in relation to organic waste management (Teigiserova et al. 2020), societal transition and policy development (European Commission 2018; Bugge et al. 2019) as well as COVID-19 recovery strategies (Palahí et al. 2020). To maintain the natural resource base, circular bioeconomy emphasises sustainable land use and the return of biomass and nutrients to the biosphere when it leaves the technical cycle.
Scarcity is an argument for adopting circular economy principles for the management of biomass, as for non-renewable resources. Waste avoidance, product reuse and material recycling keep down resource use while maintaining product and material value. However, reuse and recycling are not always feasible, for example when biofuels are used for transport and bio-based biodegradable chemicals are used to reduce ecological impacts, where losses to the environment are unavoidable. A balanced approach to management of biomass resources could start from the perspective of value preservation within the carbon cycle, with possible routes for biomass use based on the carbon budget defined by the Paris Agreement, principles for sustainable land use and natural ecosystem protection.
Land-use opportunities and challenges in the bioeconomy
Analyses of synergies and trade-offs between adaptation and mitigation in the agriculture and forestry sectors show that outcomes depend on context, design and implementation, so actions have to be tailored to the specific conditions to minimise adverse effects (Kongsager 2018). This is supported in literature analysing the nexus between land, water, energy and food in the context of climate change, which consistently concludes that addressing these different domains together rather than in isolation would enhance synergies and reduce trade-offs (Obersteiner et al. 2016; D’Odorico et al. 2018; Soto Golcher and Visseren-Hamakers 2018; Froese et al. 2019; Momblanch et al. 2019).
Nature-based solutions addressing climate change can provide opportunities for sustainable livelihoods as well as multiple ecosystem services, such as flood risk management through floodplain restoration, saltmarshes, mangroves or peat renaturation (UNEP 2021; AR6 WGII Cross-Chapter Box NATURAL). Climate-smart agriculture can increase productivity while enhancing resilience and reducing GHG emissions inherent to production (Lipper et al. 2014; Bell et al. 2018; FAO 2019 b; Singh and Chudasama 2021). Similarly, climate-smart forestry considers the whole value chain and integrates climate objectives into forest sector management through multiple measures (from strict reserves to more intensively managed forests) providing mitigation and adaptation benefits (Nabuurs et al. 2018; Verkerk et al. 2020) (AR6 WGIII Section 7.3).
Cross-Working Group Box 3
Agroecological approaches can be integrated into a wide range of land management practices to support a sustainable bioeconomy and address equity considerations (HLPE 2019). Relevant land-use practices, such as agroforestry, intercropping, organic amendments, cover crops and rotational grazing, can provide mitigation and support adaption to climate change via food security, livelihoods, biodiversity and health co-benefits (Ponisio et al. 2015; Garibaldi et al. 2016; D’Annolfo et al. 2017; Bezner Kerr et al. 2019; Clark et al. 2019 b; Córdova et al. 2019; HLPE 2019; Mbow et al. 2019; Renard and Tilman 2019; Sinclair et al. 2019; Bharucha et al. 2020; Bezner Kerr et al. 2021) (AR6 WGII Cross-Chapter Box NATURAL). Strategic integration of appropriate biomass production systems into agricultural landscapes can provide biomass for bioenergy and other bio-based products while providing co-benefits such as enhanced landscape diversity, habitat quality, retention of nutrients and sediment, erosion control, climate regulation, flood regulation, pollination and biological pest and disease control (Christen and Dalgaard 2013; Asbjornsen et al. 2014; Holland et al. 2015; Ssegane et al. 2015; Dauber and Miyake 2016; Milner et al. 2016; Ssegane and Negri 2016; Styles et al. 2016; Zumpf et al. 2017; Cacho et al. 2018; Alam and Dwivedi 2019; Cubins et al. 2019; HLPE 2019; Olsson et al. 2019; Zalesny et al. 2019; Englund et al. 2020) (AR6 WGIII Box 12.3). Such approaches can help limit environmental impacts from intensive agriculture while maintaining or increasing land productivity and biomass output.
Transitions from conventional to new biomass production and conversion systems include challenges related to cross-sector integration and limited experience with new crops and land use practices, including needs for specialised equipment (Thornton and Herrero 2015; HLPE 2019) (AR6 WGII Section 5.1 0). Introduction of agroecological approaches and integrated biomass/food crop production can result in lower food crop yields per hectare, particularly during transition phases, potentially causing indirect landuse change, but can also support higher and more stable yields, reduce costs, and increase profitability under climate change (Muller et al. 2017; Seufert and Ramakutty 2017; Barbieri et al. 2019; HLPE 2019; Sinclair et al. 2019; Smith et al. 2019a; Smith et al. 2020). Crop diversification, organic amendments, and biological pest control (HLPE 2019) can reduce input costs and risks of occupational pesticide exposure and food and water contamination (González-Alzaga et al. 2014; EFSA 2017; Mie et al. 2017), reduce farmers’ vulnerability to climate change (e.g., droughts and spread of pests and diseases affecting plant and animal health) (Delcour et al. 2015; FAO 2020) and enhance provisioning and sustaining ecosystem services, such as pollination (D’Annolfo et al. 2017; Sinclair et al. 2019).
Barriers toward wider implementation include absence of policies that compensate land owners for providing enhanced ecosystem services and other environmental benefits, which can help overcome short-term losses during the transition from conventional practices before longer-term benefits can accrue. Other barriers include limited access to markets, knowledge gaps, financial, technological or labour constraints, lack of extension support and insecure land tenure (Jacobi et al. 2017; Kongsager 2017; Hernández-Morcillo et al. 2018; Iiyama et al. 2018; HLPE 2019). Regional-level agroecology transitions may be facilitated by co-learning platforms, farmer networks, private sector, civil society groups, regional and local administration and other incentive structures (e.g., price premiums, access to credit, regulation) (Coe et al. 2014; Pérez-Marin et al. 2017; Mier y Terán Giménez Cacho et al. 2018; HLPE 2019; Valencia et al. 2019; SAEPEA 2020). With the right incentives, improvements can be made with regard to profitability, making alternatives more attractive to land owners.
Governing the solution space
Literature analysing the synergies and trade-offs between competing demands for land suggest that solutions are highly contextualised in terms of their environmental, socio-economic and governance-related characteristics, making it difficult to devise generic solutions (Haasnoot et al. 2020). Aspects of spatial and temporal scale can further enhance the complexity, for instance where transboundary effects across jurisdictions or upstream-downstream characteristics need to be considered, or where climate change trajectories might alter relevant biogeophysical dynamics (Postigo and Young 2021). Nonetheless, there is broad agreement that taking the needs and perspectives of multiple stakeholders into account in a transparent process during negotiations improves the chances of achieving outcomes that maximise synergies while limiting trade-offs (Ariti et al. 2018; Metternicht 2018; Favretto et al. 2020; Kopáček 2021; Muscat et al. 2021). Yet differences in agency and power between stakeholders or anticipated changes in access to or control of resources can undermine negotiation results even if there is a common understanding of the overarching benefits of more integrated environmental agreements and the need for greater coordination and cooperation to avoid longer-term losses to all (Aarts and Leeuwis 2010; Weitz et al. 2017). There is also the risk that strong local participatory processes can become disconnected from broader national plans, and thus fail to support the achievement of national targets. Thus, connection between levels is needed to ensure that ambition for transformative change is not derailed at local level (Aarts and Leeuwis 2010; Postigo and Young 2021).
Decisions on land uses between biomass production for food, feed, fibre or fuel, as well as nature conservation or restoration and other uses (e.g., mining, urban infrastructure), depend on differences in perspectives and values. Because the availability of land for diverse biomass uses is invariably limited, setting priorities for land-use allocations therefore first depends on making the perspectives underlying what is considered as ‘high-value’ explicit (Fischer et al. 2007; Garnett et al. 2015; De Boer and Van Ittersum 2018;
Cross-Working Group Box 3
Muscat et al. 2020). Decisions can then be made transparently based on societal norms, needs and the available resource base. Prioritisation of land use for the common good therefore requires societal consensus building embedded in the socio-economic and cultural fabric of regions, societies and communities. Integration of local decision-making with national planning ensures local actions complement national development objectives.
International trade in the global economy today provides important opportunities to connect producers and consumers, effectively buffering price volatilities and potentially offering producer countries access to global markets, which can be seen as an effective adaptation measure (Baldos and Hertel 2015; Costinot et al. 2016; Hertel and Baldos 2016; Gouel and Laborde 2021) (AR6 WGII Section 5.1 1). But there is also clear evidence that international trade and the global economy can enhance price volatility, lead to food price spikes and affect food security due to climate and other shocks, as seen recently due to the COVID-19 pandemic (Cottrell et al. 2019; WFP-FSIN 2020; Verschuur et al. 2021) (AR6 WGII Section 5.1 2). The continued strong demand for food and other bio-based products, mainly from high- and middle-income countries, therefore requires better cooperation between nations and global governance of trade to more accurately reflect and disincentivise their environmental and social externalities. Trade in agricultural and extractive products driving land-use change in tropical forest and savanna biomes is of major concern because of the biodiversity impacts and GHG emissions incurred in their provision (Hosonuma et al. 2012; Forest Trends 2014; Smith et al. 2014; Henders et al. 2015; Curtis et al. 2018; Pendrill et al. 2019; Seymour and Harris 2019; Kissinger et al. 2021) (AR6 WGII Tropical Forests Cross-Chapter Paper).
In summary, there is significant scope for optimising use of land resources to produce more biomass while reducing adverse effects ( high confidence). Context-specific prioritisation, technology innovation in bio-based production, integrative policies, coordinated institutions and improved governance mechanisms to enhance synergies and minimise trade-offs can mitigate the pressure on managed as well as natural and semi-natural ecosystems (medium confidence). Yet, energy conservation and efficiency measures, and deployment of technologies and systems that do not rely on carbon-based energy and materials, are essential for mitigating biomass demand growth as countries pursue ambitious climate goals (high confidence).
12.6Other Cross-sectoral Implications of Mitigation
This section presents further cross-sectoral considerations related to GHG mitigation. Firstly, various cross-sectoral perspectives on mitigation actions are presented. Then, sectoral policy interactions are presented. Finally, implications in terms of international trade spillover effects and competitiveness, and finance flows and related spillover effects at the sectoral level, are addressed.
12.6.1 Cross-sectoral Perspectives on Mitigation Action
Chapters 5 to 11 present mitigation measures applicable in individual sectors, and potential co-benefits and adverse side effects 4 of these individual measures. This section builds on the sectoral analysis of mitigation action from a cross-sectoral perspective. Firstly, Section 12.6.1.1 brings together some of the observations presented in the sectoral chapters to show how different mitigation actions in different sectors can contribute to the same co-benefits and result in the same adverse side effects, thereby demonstrating the potential synergistic effects. The links between these co-benefits and adverse side effects and the SDGs is also demonstrated. In Section 12.6.1.2, the focus turns from sector-specific mitigation measures to mitigation measures which have cross-sectoral implications, including measures that have application in more than one sector and measures where implementation in one sector impacts on implementation in another. Finally, Section 12.6.1.3 notes the cross-sectoral relevance of a selection of general-purpose technologies, a topic that is covered further in Chapter 16.
12.6.1.1A Cross-sectoral Perspective on Co-benefits and Adverse Side Effects of Mitigation Measures, and Links with the SDGs
A body of literature has been developed which addresses the co-benefits of climate mitigation action (Karlsson et al. 2020). Adverse side effects of mitigation are also well documented. Co-benefits and adverse side effects in individual sectors and associated with individual mitigation measures are discussed in the individual sector chapters (Sections 5.2, 6.7.7, 7.4, 7.6, 8.2, 8.4, 9.8, 10.1.1 and 11.5.3), as well as in previous IPCC General and Special Assessment reports. The term ‘co-impacts’ has been proposed to capture both the co-benefits and adverse side effects of mitigation. An alternative framing is one of multiple objectives, where climate change mitigation is placed alongside other objectives when assessing policy decisions (Ürge-Vorsatz et al. 2014; Mayrhofer and Gupta 2016; Cohen et al. 2017; Bhardwaj et al. 2019).
The identification and assessment of co-benefits has been argued to serve a number of functions (Section 1.4) including using them as leverage for securing financial support for implementation, providing justification of actions which provide a balance of both short- and long-term benefits and obtaining stakeholder buy-in (robust evidence, low agreement ) (Karlsson et al. 2020). Assessment of adverse side effects has been suggested to be useful in avoiding unforeseen negative impacts of mitigation and providing policy- and decision-makers with the information required to make informed trade-offs between climate and other benefits of actions (Ürge-Vorsatz et al. 2014; Bhardwaj et al. 2019; Cohen et al. 2019) ( high evidence, low agreement ).
Various approaches to identifying and organising co-impacts in specific contexts and across sectors have been proposed towards providing more comparable and standardised analyses. However, consistent quantification of co-impacts, including cost-benefit analysis, and the utilisation of the resulting information, remain a challenge (Ürge-Vorsatz et al. 2014; Floater et al. 2016; Mayrhofer and Gupta 2016; Cohen et al. 2019; Karlsson et al. 2020). This challenge is further exacerbated when considering that co-impacts of a mitigation measure in one sector can either enhance or reduce the co-impacts associated with mitigation in another, or the achievement of co-benefits in one geographic location can lead to adverse side effects in another. For example, the production of lithium for batteries for energy storage has the potential to contribute to protecting water resources and reducing wastes associated with coal-fired power in many parts of the world, but mining of lithium has the potential for creating water and waste challenges if not managed properly (Agusdinata et al. 2018; Kaunda 2020).
While earlier literature has suggested that co-impacts assessments can support adoption of climate mitigation action, a more recent body of literature has suggested limitations in such framing (Ryan 2015; Bernauer and McGrath 2016; Walker et al. 2018). Presenting general information on co-impacts as a component of a mitigation analysis does not always lead to increased support for climate mitigation action. Rather, the most effective framing is determined by factors relating to local context, type of mitigation action under consideration and target stakeholder group. More work has been identified to be required to bring context into planning co-impacts assessments and communication thereof (Ryan 2015; Bernauer and McGrath 2016; Walker et al. 2018) (low evidence, low agreement ).
An area where the strong link between the cross-sectoral co-impacts of mitigation action and global government policies is being clearly considered is in the achievement of the SDGs (Obergassel et al. 2017; Doukas et al. 2018; Markkanen and Anger-Kraavi 2019; Smith et al. 2019; van Soest et al. 2019) (Chapters 1 and 17, individual sectoral chapters). Figure 12.9 demonstrates these relationships from a cross-sectoral perspective. It shows the links between sectors which give rise to emissions, the mitigation measures that can find application in the sector, and co-benefits and adverse side effects of mitigation measures and the SDGs (noting that the figure is not intended to be comprehensive). Such a framing of co-impacts from a cross-sectoral perspective in the context of the SDGs could help to further support climate mitigation action, particularly within the context of the Paris Agreement (Gomez-Echeverri 2018) (medium evidence, medium agreement ). Literature sources utilised in the compilation of this diagram are presented in Supplementary Material 12.SM.3.

Figure 12.9 | Co-benefits and adverse side effects of mitigation actions with links to the SDGs. The inner circle represents the sectors in which mitigation occurs. The second circle shows different generic types of mitigation actions (A to G), with the symbols showing which sectors they are applicable to. The third circle indicates different types of climate related co-benefits (green letters) and adverse side effects (red letters) that may be observed as a result of implementing each of the mitigation actions. Here I relates to climate resilience, II-IV economic co-impacts, V-VII environmental, VIII-XII social, and XIII political and institutional. The final circle maps co-benefits and adverse side effects relevant to the SDGs. Source: re-used with permission from Cohen et al. (2021).
12.6.1.2Mitigation Measures from a Cross-sectoral Perspective
Three aspects of mitigation from a cross-sectoral perspective are considered, following Barker et al. (2007):
• mitigation measures used in more than one sector;
• implications of mitigation measures for interaction and integration between sectors; and
• competition among sectors for scarce resources.
A number of mitigation measures find application in more than one sector. Renewable energy technologies such as solar and wind may be used for grid electricity supply, as embedded generation in the buildings sector and for energy supply in the agriculture sector (Shahsavari and Akbari 2018) (Chapters 6, 7 and 8). Hydrogen and fuel cells, coupled with low-carbon energy technologies for producing the hydrogen, are being explored in transport, urban heat, industry and for balancing electricity supply (Dodds et al. 2015; Staffell et al. 2019) (Chapters 6, 8 and 11). Electric vehicles are considered an option for balancing variable power (Kempton and Tomić 2005; Liu and Zhong 2019). Carbon capture and storage (CCS) and carbon capture and utilisation (CCU) have potential application in a number of industrial processes (cement, iron and steel, petroleum refining and pulp and paper) (Leeson et al. 2017; Garcia and Berghout 2019) (Chapters 6 and 11) and the fossil fuel electricity sector (Chapter 6). When coupled with energy recovery from biomass, CCS can provide a carbon sink (BECCS) (Section 12.5). On the demand side, energy efficiency options find application across the sectors (Chapters 6, 8, 9, 10, and 11), as do reducing demand for goods and services (Chapter 5) and improving material efficiency (Section 11.3.2).
A range of examples where mitigation measures result in cross-sectoral interactions and integration is identified. The mitigation potential of electric vehicles, including plug-in hybrids, is linked to the extent of decarbonisation of the electricity grid, as well as to the liquid fuel supply emissions profile (Lutsey 2015). Making buildings energy positive, where excess energy is used to charge vehicles, can increase the potential of electric and hybrid vehicles (Zhou et al. 2019). Advanced process control and process optimisation in industry can reduce energy demand and material inputs (Section 11.3), which in turn can reduce emissions linked to resource extraction and manufacturing. Reductions in coal-fired power generation through replacement with renewables or nuclear power result in a reduction in coal mining and its associated emissions. Increased recycling results in a reduction in emissions from primary resource extraction. CCU can contribute to the transition to more renewable energy systems via power-to-X technologies, which enables the production of CO2-based fuels/e-fuels and chemicals using carbon dioxide and hydrogen (Breyer et al. 2015; Anwar et al. 2020). Certain emissions reductions in the AFOLU sector are contingent on energy sector decarbonisation. Trees and green roofs planted to counter urban heat islands reduce the demand for energy for air conditioning and simultaneously sequester carbon (Kim and Coseo 2018; Kuronuma et al. 2018). Recycling of organic waste avoids methane generation if the waste would have been disposed of in landfill sites, can generate renewable energy if treated through anaerobic digestion, and can reduce requirements for synthetic fertiliser production if the nutrient value is recovered (Creutzig et al. 2015). Liquid transport biofuels link to the land, energy and transport sectors (Section 12.5.2.2).
Demand-side mitigation measures, discussed in Chapter 5, also have cross-sectoral implications which need to be taken into account when calculating mitigation potentials. Residential electrification has the potential to reduce emissions associated with lighting and heating, particularly in developing countries where these are currently met by fossil fuels and using inefficient technologies, but will increase demand for electricity (Chapters 5 and 8 and Sections 6.6.2.3 and 8.4.3.1). Many industrial processes can also be electrified in the move away from fossil reductants and direct energy carriers (Chapter 11). The impact of electrification on electricity sector emissions will depend on whether electricity generation is based on fossil fuels in the absence of CCS or low-carbon energy sources (Chapter 5).
At the same time, saving electricity in all sectors reduces the demand for electricity, thereby reducing mitigation potential of renewables and CCS. Demand-side flexibility measures and electrification of vehicle fleets are supportive of more intermittent renewable energy supply options (Sections 6.3.7, 6.4.3.1 and 10.3.4). Production of maize, wheat, rice and fresh produce requires lower energy inputs on a lifecycle basis than poultry, pork and ruminant-based meats (Clark and Tilman 2017) (Section 12.4). It also requires less land area per kilocalorie or protein output (Clark and Tilman 2017; Poore and Nemecek 2018), so replacing meat with these products makes land available for sequestration, biodiversity or other societal needs. However, production of co-products of the meat industry, such as leather and wool, is reduced, resulting in a need for substitutes. Further discussion and examples of cross-sectoral implications of mitigation, with respect to cost and potentials, are presented in Section 12.2. One final example on this topic included here is that of circular economy (Box 12.4).
Finally, in terms of competition among sectors for scarce resources, this issue is often considered in the assessments of mitigation potentials linked to bioenergy and diets (vegetable vs animal food products), land use and water (robust evidence, high agreement ) (Section 12.5 and Cross-Working Group Box 3 in this Chapter). It is, however, also relevant elsewhere. Constraints have been identified in the supply of indium, tellurium, silver, lithium, nickel and platinum that are required for implementation of some specific renewable energy technologies (Watari et al. 2018; Moreau et al. 2019). Other studies have shown constraints in supply of cobalt, one of the key elements used in production of lithium-ion batteries, which has been assessed for mitigation potential in energy, transport and buildings sectors (medium evidence, high agreement ) (Jaffe 2017; Olivetti et al. 2017), although alternatives to cobalt are being developed (Olivetti et al. 2017; Watari et al. 2018).
Box 12.4 | Circular Economy from a Cross-Sectoral Perspective
Circular economy approaches consider the entire lifecycle of goods and services, and seek to design out waste and pollution, keep products and materials in use, and regenerate natural systems (The Ellen MacArthur Foundation 2013; CIRAIG 2015). The use of circular economy for rethinking how society’s needs for goods and services is delivered in such a way as to minimise resource use and environmental impact and maximise societal benefit has been discussed elsewhere in this assessment report (Chapter 5 and Section 5.3.4). A wide range of potential application areas is identified, from food systems to bio-based products to plastics to metals and minerals to manufactured goods. Circular economy approaches are implicitly cross-sectoral, impacting the energy, industrial, AFOLU, waste and other sectors. They will have climate and non-climate co-benefits and trade-offs. The scientific literature mainly investigates incremental measures claiming but not demonstrating mitigation; highest mitigation potential is found in the industry, energy, and transport sectors; mid-range potential in the waste and building sectors; and lowest mitigation gains in agriculture (Cantzler et al. 2020). Circular economy thinking has been identified to support increased resilience to the physical effects of climate change and contribute to meeting other SDGs, notably SDG 12 (responsible consumption and production) (The Ellen MacArthur Foundation 2019).
Circular economy approaches to deployment of low-carbon infrastructure have been suggested to be important to optimise resource use and mitigate environmental and societal impacts caused by extraction and manufacturing of composite and critical materials as well as infrastructure decommissioning (Jensen and Skelton 2018; Sica et al. 2018; Salim et al. 2019; Watari et al. 2019; Jensen et al. 2020; Mignacca et al. 2020). The circular carbon economy is an approach inspired by the circular economy principles that rely on a combination of technologies, including CCU, CCS and CDR, to enable transition pathways especially relevant in economies dependent on fossil fuel exports (Lee et al. 2017; Alshammari 2020; Morrow and Thompson 2020; Zakkour et al. 2020). The integration of circular economy and bioeconomy principles (Cross-Working Group Box 3 in this chapter) is conceptualised in relation to policy development (European Commission 2018) as well as COVID-19 recovery strategies (Palahí et al. 2020), emphasising the use of renewable energy sources and sustainable management of ecosystems with transformation of biological resources into food, feed, energy and biomaterials.
At this stage, however, there is no single global agreement on how circular economy principles are best implemented, and differential government support for circular economy interventions is observed in different jurisdictions.
12.6.1.3 Cross-sectoral Considerations Relating to Emerging General-purpose Technologies
General-purpose technologies (GPTs) include, but are not limited to, additive manufacturing, artificial intelligence, biotechnology, hydrogen, digitalisation, electrification, nanotechnology and robots (de Coninck et al. 2018). Many of the individual sectoral chapters have identified the roles that such technologies can have in supporting mitigation of GHG emissions. Section 16.2.2.3 presents an overview of the individual technologies and specific applications thereof.
In this chapter, which focuses on cross-sectoral implications of mitigation, it is highlighted that certain of these GPTs will find application across the sectors, and there will be synergies and trade-offs when utilising these technologies in more than sector. One example here is the use of hydrogen as an energy carrier, which, when coupled with low-carbon energy, has potential for driving mitigation in energy, industry, transport, and buildings. The increased uptake of hydrogen across the economy requires establishment of hydrogen production, transport and storage infrastructure which could simultaneously support multiple sectors, although there is the potential to utilise existing infrastructure in some parts of the world (Alanne and Cao 2017).
Box 12.5 provides further details on hydrogen in the context of cross-sectoral mitigation specifically, while further details on the role of hydrogen in individual sectors are provided in Chapters 6, 8. 9, 10 and 11. In contrast, the benefits of digitalisation, which could potentially give rise to substantial energy savings across multiple sectors, need to be traded off against demand for electricity to operate consumer devices, data centres, and data networks. Measures are required to increase energy efficiency of these technologies (IEA 2017). Section 5.3.4.1 of this report provides further information on energy and emissions benefits and costs of digitalisation.
With respect to co-impacts of GPTs, the other focus of this chapter, it is highlighted that assessment of the environmental, social and economic implications of such technologies is challenging and context specific, with multiple potential cross-sectoral linkages (de Coninck et al. 2018). Each GPT would need to be explored in context of what it is being used for, and potentially in the geographical context, in order to understand the co-impacts of its use.
Box 12.5 | Hydrogen in the Context of Cross-sectoral Mit igation Options
Interest in hydrogen as an intermediary energy carrier has grown rapidly in the years since the 5th Assessment Report of WGIII (AR5) was published. This is reflected in this WGIII assessment report, where the term ‘hydrogen’ is used more than five times more often than in AR5. In Chapter 6 of this report, it is shown that hydrogen can be produced with low carbon impact from fossil fuels (Section 6.4.2.6), renewable electricity and nuclear energy (Section 6.4.5.1), or biomass (Section 6.4.2.5). In the energy sector, hydrogen is one of the options for storage of energy in low-carbon electricity systems (Sections 6.4.4.1 and 6.6.2.2). But, also importantly, hydrogen can be produced to be used as a fuel for sectors that are hard to decarbonise; this is possible directly in the form of hydrogen, but also in the form of ammonia or other energy carriers (Section 6.4.5.1). In the transport sector, fuel cell engines (Section 10.3.3) running on hydrogen can become important, especially for heavy duty vehicles (Section 10.4.3). In the industry sector hydrogen already plays an important role in the chemical sector (for ammonia and methanol production) (Box 11.1 in Chapter 11) and in the fuel sector (in oil refinery processes and for biofuel production) (IEA 2019b). Beyond the production of ammonia and methanol for both established and novel applications, the largest potential industrial application for low-carbon hydrogen is seen in steel-making (Section 11.4.1.1). Hydrogen and hydrogen derivatives can play a further role as substitute energy carriers (Section 11.3.5) and for the production of intermediate chemical products such as methanol, ethanol and ethylene when combined with CCU (Section 11.3.6). For the building sector, the exploration of the usefulness of hydrogen is at an early stage (Box 9.4).
An overview report (IEA 2019b) already sees opportunities in 2030 for buildings, road freight and passenger vehicles. This report also suggests a high potential application in iron and steel production, aviation and maritime transport, and for electricity storage. Several industry roadmaps have been published that map out a possible role for hydrogen until 2050. The most well known and ambitious is the roadmap by the Hydrogen Council (2017), which sketches a global scenario leading to 78 EJ hydrogen use in 2050, mainly for transport, industrial feedstock, industrial energy and to a lesser extent for buildings and power generation. Hydrogen makes up 18% of total final energy use in this vision. An analysis by IRENA on hydrogen from renewable sources comes to a substantially lower number: 8 EJ (excluding hydrogen use in power production and feedstock uses). On a regional level, most roadmaps and scenarios have been published for the European Union, for example by the Fuel Cell and Hydrogen Joint Undertaking (Blanco et al. 2018; EC 2018; FCH 2019; Navigant 2019). All these reports have scenario variants with hydrogen share in final energy use of 10% to over 20% by 2050.
When it comes to the production of low-carbon hydrogen, the focus of the attention is on production using electricity from renewable sources via electrolysis, so-called ‘green hydrogen’. However, ‘blue hydrogen’, produced out of natural gas with CCS, is also often considered. Since a significantly increasing role for hydrogen would require considerable infrastructure investments and would affect existing trade flows in raw materials, governments have started to set up national hydrogen strategies, both potential exporting (e.g., Australia) and importing (e.g., Japan) countries (METI 2017; COAG Energy Council 2019).
As already reported in Chapter 6 (Section 6.2.4.1), production costs of green hydrogen are expected to come down from the current levels of above USD100 MWh –1. Price expectations are: EUR40–60 MWh –1 for both green and blue hydrogen production in the EU by 2050 (Navigant 2019) with production costs already being lower in North Africa; 42–87 USD MWh –1 for green hydrogen in 2030 and 20–41 USD MWh –1 in 2050 (BNEF 2020); EUR75 MWh –1 in 2030 (Glenk and Reichelstein 2019). For fossil-based technologies combined with CCS, prices may range from USD33–80 MWh –1 (Table 6.8). Such prices can make hydrogen competitive for industrial feedstock applications, and probably for several transportation modes in combination with fuel cells, but without further incentives, not necessarily for stationary applications in the coming decades: wholesale natural gas prices are expected to range from USD7–31 MWh –1 across regions and scenarios, according to the World Energy Outlook (IEA 2020a); coal prices mostly are even lower than natural gas prices (all fossil fuel prices refer to unabated technology and untaxed fuels). The evaluation of macro-economic impacts is relatively rare. A study by Mayer et al. (2019b) indicated that a shift to hydrogen in iron and steel production would lead to regional GDP losses in the range of 0.4–2.7% in 2050 across EU+3, with some regions making gains under a low-cost electricity scenario.
The IAM scenarios imply a modest role played by hydrogen, with some scenarios featuring higher levels of penetration. The consumption of hydrogen is projected to increase by 2050 and onwards in scenarios likely limiting global warming to 2°C or below, and the median share of hydrogen in total final energy consumption is 2.1% in 2050 and 5.1% in 2100 (Box 12.4, Figure 1) (Numbers are based on the AR6 scenarios database). There is large variety in hydrogen shares, but the values of 10% and more of final energy use that occur in many roadmaps are only rarely reached in the scenarios. Hydrogen is predominantly used in the industry and transportation sectors. In the scenarios, hydrogen is produced mostly by electrolysis and by biomass energy conversion with CCS (Box 12.5, Figure 1). Natural gas with CCS is expected to play only a modest role; here a distinct difference between the roadmaps quoted before and the IAM results is observed.
It is concluded that there is increasing confidence that hydrogen can play a significant role, especially in the transport sector and the industrial sector. However, there is much less agreement on timing and volumes, and there is also a range of perspectives on the role of the various production methods of hydrogen.

Box 12.5, Figure 1 | Fraction of hydrogen (light blue) in total final energy consumption, and for each sector. Hinges represent the interquartile ranges and whiskers extend to 5th and 95th percentiles. Source: AR6 scenarios database.
12.6.2 Sectoral Policy Interactions (Synergies and Trade-offs)
A taxonomy of policy types and attributes is provided by Section 13.6. In addition, the sectoral chapters provide an in-depth discussion of important mitigation policy issues such as policy overlaps, policy mixes, and policy interaction as well as policy design considerations and governance. The point of departure for the assessment in this chapter is a focus on cross-sectoral perspectives aiming at maximising policy synergies and minimising policy trade-offs.
Synergies and trade-offs resulting from mitigation policies are not clearly discernible from either sector-level studies or global and regional top-down studies. Rather, they would require a cross-sectoral integrated policy framework (von Stechow et al. 2015; Monier et al. 2018; Pardoe et al. 2018; Singh et al. 2019) or multiple-objective-multiple-impact policy assessment framework identifying key co-impacts and avoiding trade-offs (robust evidence, high agreement ) (Ürge-Vorsatz et al. 2014).
Sectoral studies typically cover differentiated response measures while the IAM literature mostly uses uniform efficient market-based measures. This has important implications for understanding the differences in magnitude and distribution of mitigation costs and potentials of Section 12.2 (Karplus et al. 2013; Rausch and Karplus 2014). There is a comprehensive literature on the efficiency of uniform carbon pricing compared to sector-specific mitigation approaches, but relatively less literature on the distributional impacts of carbon taxes and measures to mitigate potential adverse distributional impacts (Rausch and Karplus 2014; Rausch and Reilly 2015; Wang et al. 2016b; Åhman et al. 2017; Mu et al. 2018). For example, in terms of cross-sectoral distributional implications, studies find negative competitiveness impacts for the energy-intensive industries (robust evidence, medium agreement ) (Rausch and Karplus 2014; Wang et al. 2016b; Åhman et al. 2017).
Strong interdependencies and cross-sectoral linkages create both opportunities for synergies and the need to address trade-offs. This calls for coordinated sectoral approaches to climate change mitigation policies that mainstream these interactions (Pardoe et al. 2018). Such an approach is also called for in the context of cross-sectoral interactions of adaptation and mitigation measures, examples are in the agriculture, biodiversity, forests, urban, and water sectors (Arent et al. 2014; Berry et al. 2015; Di Gregorio et al. 2017). Integrated planning and cross-sectoral alignment of climate change policies are particularly evident in developing countries’ NDCs pledged under the Paris Agreement, where key priority sectors such as agriculture and energy are closely aligned between the proposed mitigation and adaptation actions in the context of sustainable development and the SDGs. An example is the integration between climate-smart agriculture and low-carbon energy (robust evidence, high agreement ) (Antwi-Agyei et al. 2018; England et al. 2018). Yet, there appear to be significant challenges relating to institutional capacity and resources to coordinate and implement such cross-sectoral policy alignment, particularly in developing country contexts (Antwi-Agyei et al. 2018).
Another dimension of climate change policy interactions in the literature is related to trade-offs and synergies between climate change mitigation and other societal objectives. For example, in mitigation policies related to energy, trade-offs and synergies between universal electricity access and climate change mitigation would call for complementary policies such as pro-poor tariffs, fuel subsidies, and broadly integrated policy packages (Dagnachew et al. 2018). In agriculture and forestry, research suggests that integrated policy programmes enhance mitigation potentials across the land-use-agriculture-forestry nexus and lead to synergies and positive spillovers (Galik et al. 2019). To maximise synergies and deal with trade-offs in such a cross-sectoral context, evidence-based/informed and holistic policy analysis approaches like nexus approaches and multi-target back-casting approaches that take into account unanticipated outcomes and indirect consequences would be needed (robust evidence, high agreement ) (Klausbruckner et al. 2016; Hoff et al. 2019; van der Voorn et al. 2020) (Box 12.6).
The consequences of large-scale land-based mitigation for food security, biodiversity (Dasgupta 2021), the state of soil, water resources, and so on can be significant, depending on many factors, such as economic development (including distributional aspects), international trade patterns, agronomic development, diets, land-use governance and policy design, and not least climate change itself (Winchester and Reilly 2015; Fujimori et al. 2018; Hasegawa et al. 2018; Van Meijl et al. 2018). Policies and regulations that address other aspects apart from climate change can indirectly influence the attractiveness of land-based mitigation options. For example, farmers may find it attractive to shift from annual food/feed crops to perennial grasses and short rotation woody crops (suitable for bioenergy) if the previous land uses become increasingly restricted due to impacts on groundwater quality and eutrophication of water bodies (robust evidence, medium agreement ) (Sections 12.4 and 12.5).
Finally, there are knowledge gaps in the literature particularly in relation to policy scalability and the extent and magnitude of policy interactions when scaling the policy to a level consistent with low GHG emissions pathways such as 2°C and 1.5°C.
Box 12.6 | Case Study: Sahara Forest Project in Aqaba, Jordan
Nexus framing
Shifting to renewable (in particular solar) energy reduces dependency on fossil fuel imports and greenhouse gas emissions, which is crucial for mitigating climate change. Employing renewable energy for desalination of seawater and for cooling of greenhouses in integrated production systems can enhance water availability, increase crop productivity and generate co-products and co-benefits (e.g., algae, fish, dryland restoration, greening of the desert).
Nexus opportunities
The Sahara Forest project integrated production system uses amply available natural resources, namely solar energy and seawater, for improving water availability and agricultural/biomass production, while simultaneously providing new employment opportunities. Using hydroponic systems and humidity in the air, water needs for food production are 50% lower compared to other greenhouses.
Technical and economicnexus solutions
Several major technologies are combined in the Sahara Forest Project, namely electricity production through the use of solar power (PV or CSP), freshwater production through seawater desalination using renewable energy, seawater-cooled greenhouses for food production, and outdoor revegetation using run-off from the greenhouses.
Stakeholders involved
The key stakeholders which benefit from such an integrated production system are from the water sector, which urgently requires an augmentation of irrigation (and other) water, and the agricultural sector, which relies on the additional desalinated water to maintain and increase agricultural production. The project also involves public and private sector partners from Jordan and abroad, with little engagement of civil society so far.
Box 12.6
Frame work conditions
The Sahara Forest Project has been implemented at pilot scale so far, including the first pilot with one hectare and one greenhouse pilot in Qatar and a larger ‘launch station’ with three hectares and two greenhouses in Jordan. These pilots have been funded by international organisations such as the Norwegian Ministry of Climate and Environment, Norwegian Ministry of Foreign Affairs and the European Union. Alignment with national policies, institutions and funding, as well as upscaling of the project, is underway or planned.
Monitoring and evaluationand next steps
The multi-sectoral planning and investments that are needed to upscale the project require cooperation among the water, agriculture, and energy sectors and an active involvement of local actors, private companies, and investors. These cooperation and involvement mechanisms are currently being established in Jordan. Given the emphasis on the economic value of the project, public-private partnerships are considered as the appropriate business and governance model, when the project is upscaled. Scenarios for upscaling (seawater use primarily in low-lying areas close to the sea, to avoid energy-intensive pumping) include 50 MW of CSP, 50 hectares of greenhouses, which would produce 34,000 tonnes of vegetables annually, provide employment for over 800 people, and sequester more than 8000 tonnes of CO2-eq annually.
Source: SFP Foundation; Hoff et al. (2019).
12.6.3International Trade Spillover Effects and Competitiveness
International spillovers of mitigation policies are effects that carbon-abatement measures implemented in one country have on sectors in other countries. These effects include (i) carbon leakage in manufacture; (ii) the effects on energy trade flows and incomes related to fossil fuel exports from major exporters; (iii) technology and knowledge spillovers; and (iv) transfer of norms and preferences via various approaches to establish sustainability requirements on traded goods, such as EU-RED and environmental labelling systems to guide consumer choices (robust evidence, medium agreement ). This section focuses on cross-sectoral aspects of international spillovers related to the first two effects.
12.6.3.1 Cross-sectoral Aspects of Carbon Leakage
Carbon leakage occurs when mitigation measures implemented in one country or sector lead to a rise in emissions in other countries or sectors. Three types of spillovers are possible: (i) domestic cross-sectoral spillovers when mitigation policy in one sector leads to the re-allocation of labour and capital towards the other sectors of the same country; (ii) international spillovers within a single sector when mitigation policy leads to substitution of domestic production of carbon-intensive goods with their imports from abroad; and (iii) international cross-sectoral spillovers when mitigation policy in one sector in one country leads to the rise in emissions in other sectors in other countries. While the first two are described in Section 13.6, this section focuses on the third. Though some papers address this type of leakage, there is still a significant lack of knowledge on this topic.
One possible channel of cross-sectoral international carbon leakage is through global value chains. Mitigation policy in one country not only leads to shifts in competitiveness across industries producing final goods but also across those producing raw materials and intermediary goods all over the world.
This type of leakage is especially important because the countries that provide basic materials are usually emerging or developing economies, many of which have no or limited regulation of GHG emissions. For this reason, foreign direct investment in developing economies usually leads to an increase in emissions (Kivyiro and Arminen 2014; Shahbaz et al. 2015; Bakhsh et al. 2017): in the case of basic materials the effect of expansion of economic activity on emissions exceeds the effect of technological spillovers, while for developed countries the effect is opposite (Shahbaz et al. 2015; Pazienza 2019). Meng et al. (2018) calculated that environmental cost for generating one unit of GDP through international trade was 1.4 times higher than that through domestic production in 1995. By 2009, this difference increased to 1.8 times. Carbon leakage due to the differences in environmental regulation was the main driver of this increase.
In order to address emissions leakage through global value chains, Liu and Fan (2017) propose the value-added-based emissions accounting principle, which makes it possible to account for GHG emissions within the context of the economic benefit principle. Davis et al. (2011) notice that the analysis of value chains gives an opportunity to find the point where regulation would be the most efficient and the least vulnerable to leakage. For instance, transaction costs of global climate policy and the risks of leakage may be reduced if emissions are regulated at the extraction stage as there are far fewer agents involved in this process than in burning of fossil fuels or consumption of energy-intensive goods. Li et al. (2020) calls for coordinated efforts to reduce emissions embodied in trade flows in pairs of the economies with the highest leakage, such as China and the United States, China and Germany, China and Japan, Russia and Germany.
Unfortunately, these proposals either face difficulties in collection and verification of data on emissions along value chains or require a high level of international cooperation, which is hardly achievable at the moment. Neuhoff et al. (2016) and Pollitt et al. (2020) focus on the regulation of emissions embodied in global value chains through national policy instruments. They propose implementation of a charge on consumption of imported basic materials into the European emissions trading system. Such a charge, equivalent to around EUR80 tCO2–1, could reduce the EU’s total CO2 emissions by up to 10% by 2050 (Pollitt et al. 2020) without significant effects on competitiveness. This proposal is very close to the carbon border adjustment introduced in the EU and described in more detail in Sections 13.2 and 13.6.
Cross-sectoral effects of carbon leakage also occur through the multiplier effect, when the mitigation policy in any sector in country A leads to the increase of relative competitiveness and therefore production of the same sector in country B, which automatically leads to the expansion of economic activity in other sectors of country B. This expansion may in turn lead to the rise of production and emissions in country A as a result of feedback effects. These spillovers should be taken into consideration while designing climate policy, along with potential synergies that may appear due to joint efforts. However, the scale of these effects with regards to leakage should not be overestimated. Even for intrasectoral leakage, many ex ante modelling studies generally suggest limited carbon leakage rates (Chapter 13). Intersectoral leakage should be even less significant. Interregional spillover and feedback effects are well studied in China (Zhang 2017; Ning et al. 2019). Even within a single country, interregional spillover effects are much lower than intraregional effects, and feedback effects are even less intense. Cross-sectoral spillovers across national borders as a result of mitigation policy should be even smaller, although these are less well studied. In future, if the differences in carbon price between regions increase, leakage through cross-sectoral multipliers may play a more important role.
Another important cross-sectoral aspect of carbon leakage concerns the transport sector. If mitigation policy leads to the substitution of domestic carbon-intensive production with imports, one of the side effects of this substitution is the rise of emissions from transportation of imported goods. International transport is responsible for about a third of worldwide trade-related emissions, and over 75% of emissions for major manufacturing categories (Cristea et al. 2013). Carbon leakage would potentially increase the emissions from transportation significantly as the trade of major consuming economies of the EU and US would shift towards distant trading partners in East and South Asia. Meng et al. (2018) consider more distant transportation as one of the major contributors to the rise in emissions embodied in international trade from 1995 to 2009.
Emissions leakage due to international trade, investment and value chains is a significant obstacle to more ambitious climate policies in many regions. However, it does not mean that disruption of trade would reduce global emissions. Zhang et al. (2020) show that deglobalisation and the drop in international trade may result in emissions reductions in the short term, but in the longer term it will make each country build more complete industrial systems to satisfy their final demand, although they have comparative disadvantages in some production stages. As a result, emissions would increase. According to Zhang et al. (2020), for China, the decrease of the degree of global value chain participation (which ranges from 0 to 1) by 0.1 would lead to an increase in gross carbon intensity of China’s exports of 11.7%. On distributional implications, Parrado and De Cian (2014) report that trade-driven spillover effects transmitted through imports of materials and equipment result in significant inter-sectoral distributional effects, with some sectors witnessing substantial expansion in activity and emissions and others witnessing a decline in activities and emissions.
It should also be mentioned that international trade leads to important knowledge and technology spillovers (Sections 16.3 and 16.5) and is critically important for achieving other Sustainable Development Goals (Section 12.6.1). Any policies imposing additional barriers to international trade should therefore be implemented with great caution and require comprehensive evaluation of various economic, social and environmental effects.
12.6.3.2The Spillover Effects on the Energy Sector
Cross-sectoral trade-related spillovers of mitigation policies include their effect on energy prices. Other things being equal, regulation of emissions of industrial producers decreases the demand for fossil fuels that would reduce prices and encourage the rise of fossil fuel consumption in regions with no or weaker climate policies (robust evidence, medium agreement ).
Arroyo-Currás et al. (2015) studied the energy channel of carbon leakage with the REMIND IAM of the global economy. They came to the conclusion that the leakage rate through the energy channel is less than 16% of the emissions reductions of regions who introduce climate policies first. This result did not differ much for different sizes and compositions of the early mover coalition.
Bauer et al. (2015) built a multi-model scenario ensemble for the analysis of energy-related spillovers of mitigation policies and revealed huge uncertainty: energy-related carbon leakage rates varied from negative values to 50%, primarily depending on the trends in inter-fuel substitution.
Another kind of spillover in the energy sector concerns the ‘green paradox’: announcement of future climate policies causes an increase in production and trade in fossil fuels in the short term (Jensen et al. 2015; Kotlikoff et al. 2016). The delayed carbon tax should therefore be higher than an immediately implemented carbon tax in order to achieve the same temperature target (van der Ploeg 2016). Studies also make a distinction between a ‘weak’ and ‘strong’ green paradox (Gerlagh 2011). The former refers to a short-term rise in emissions in response to climate policy, while the latter refers to rising cumulative damage.
The green paradox may work in different ways for different kinds of fossil fuels. For instance, Coulomb and Henriet (2018) show that climate policies in the transport and power-generation sectors increase the discounted profits of the owners of conventional oil and gas, compared to the no-regulation baseline, but will decrease these profits for coal and unconventional oil and gas producers.
Many studies also distinguish different policy measures by the scale of green paradox they provide. The immediate carbon tax is the first-best instrument from the perspective of global welfare. Delayed carbon tax leads to some green paradox but less than in the case of support for renewables (Michielsen 2014; van der Ploeg and Rezai 2019). With respect to the latter, support for renewable electricity has a lower green paradox than support for biofuels (Michielsen 2014; Gronwald et al. 2017). The existence of the green paradox is an additional argument in favour of more decisive climate policy now: any postponements will lead to additional consumption of fossil fuels and consequently the need for more ambitious and costly efforts in future.
The effect of fossil fuel production expansion as a result of anticipated climate policy may be compensated by the effect of divestment. Delayed climate policy creates incentives for investors to divest from fossil fuels. Bauer et al. (2018) show that this divestment effect is stronger and thus announcing of climate policies leads to the reduction of energy-related emissions.
The implication of the effects of mitigation policies through the energy-related spillovers channel is of particular significance to oil-exporting countries (medium evidence, medium agreement ). Emissions-reduction measures lead to decreasing demand for fossil fuels and consequently to the decrease in exports from major oil- and gas-exporting countries. The case of Russia is one of the most illustrative. Makarov et al. (2020) show that the fulfilment by Paris Agreement Parties of their NDCs would lead to 25% reduction of Russia’s energy exports by 2030 with significant reduction of its economic growth rates. At the same time, the domestic consumption of fossil fuels is anticipated to increase in response to the drop in external demand that would provoke carbon leakage (Orlov and Aaheim 2017). Such spillovers demonstrate the need for dialogue between exporters and importers of fossil fuels while implementing the mitigation policies.
12.6.4Implications of Finance for Cross-sectoral Mitigation Synergies and Trade-offs
Finance is a principal enabler of GHG mitigation and an essential component of countries’ NDC packages submitted under the Paris Agreement (UNFCCC 2016). The assessment of investment requirements for mitigation along with their financing at sectoral levels are addressed in detail by sectoral chapters while the assessment of financial sources, instruments, and the overall mitigation financing gap is addressed by Chapter 15 (Sections 15.3, 15.4, and 15.5). The focus in this chapter with respect to finance is on the scope and potential for financing integrated solutions that create synergies between and among sectors.
Cross-sectoral considerations in mitigation finance are critical for the effectiveness of mitigation action as well as for balancing the often conflicting social, developmental and environmental policy goals at the sectoral level. True measures of mitigation policy impacts and hence plans for resource mobilisation that properly address costs and benefits cannot be developed in isolation from their cross-sectoral implications. Unaddressed cross-sectoral coordination and interdependency issues are identified as major constraints in raising the necessary financial resources for mitigation in a number of countries (Bazilian et al. 2011; Welsch et al. 2014; Hoff et al. 2019a).
Integrated financial solutions to leverage synergies between sectors, as opposed to purely sector-based financing, at international, national, and local levels are needed to scale up GHG mitigation potentials. At the international level, finance from multilateral development banks (MDBs) is a major source of GHG mitigation finance in developing countries (medium evidence, medium agreement ) (World Bank Group 2015; Ha et al. 2016; Bhattacharya et al. 2016; Bhattacharya et al. 2018). In 2018, MDBs reported a total of USD30.165 billion in financial commitments to climate change mitigation, with 71% of total mitigation finance being committed through investment loans and the rest in the form of equity, guarantees, and other instruments. GHG reduction activities eligible for MDB finance are limited to those compatible with low-emission pathways recognising the importance of long-term structural changes, such as the shift in energy production to low-carbon energy technologies and the modal shift to low-carbon modes of transport leveraging both greenfield and energy efficiency projects. Sector-wise, the MDBs’ mitigation finance for 2018 is allocated to renewable energy (29%), transport (18%), energy efficiency (18%), lower-carbon and efficient energy generation (7%), agriculture, forestry and land use (8%), waste and wastewater (8%), and other sectors (12%) (MDB 2019). Unfortunately, due to institutional and incentives issues, MDB finance has mostly focused on sectoral solutions and has not been able to properly leverage cross-sectoral synergies. At the national level, applied research has shown that integrated modelling of land, energy and water resources not only has the potential to identify superior solutions, but also reveals important differences in terms of investment requirements and required financing arrangements compared to the traditional sectoral financing toolkits (Welsch et al. 2014). Agriculture, forestry, nature-based solutions and other forms of land use are promising sectors for leveraging financing solutions to scale up GHG mitigation efforts (Section 15.4). Moving to more productive and resilient forms of land use is a complex task, given the cross-cutting nature of land use, which necessarily results in apparent trade-offs between mitigation, adaptation, and development objectives. Finance is one area to manage these trade-offs where there may be opportunities to redirect the hundreds of billions spent annually on land use around the world towards green activities, without sacrificing either productivity or economic development (Falconer et al. 2015). Nonetheless, that would require active public support in design of land-use mitigation and adaptation strategies, coordination between public and private instruments across land use sectors, and leveraging of policy and financial instruments to redirect finance toward greener land-use practices (limited evidence, medium agreement ). For example, the Welsch et al. (2014) study on Mauritius shows that the promotion of a local biofuel industry from sugar cane could be economically favourable in the absence of water constraints, leading to a reduction in petroleum imports and GHG emissions while enhancing energy security. Yet, under a water-constrained scenario as a result of climate change, the need for additional energy to expand irrigation to previously rain-fed sugar plantations and to power desalination plants yields the opposite result in terms of GHG emissions and energy costs, making biofuels a sub-optimal option, and negatively affects their economics and the prospects for financing.
At the local level, integrated planning and financing are needed to achieve more sustainable outcomes. For example, at a city level, integration is needed across sectors such as transport, energy systems, buildings, sewage and solid waste to optimise emissions footprints. How a city is designed will affect transportation demands, which makes it either more or less difficult to implement efficient public transportation, leading in turn to more or fewer emissions. Under such cases, solutions in terms of public and private investment paths and financing policies based on purely internal sector considerations are bound to cause adverse impacts on other sectors and poor overall outcomes (Gouldson et al. 2016).
Availability and access to finance are among the major barriers to GHG emissions mitigation across various sectors and technology options (robust evidence, high agreement ). Resource maturity mismatches and risk exposure are two main factors limiting ability of commercial banks and other private lenders to contribute to green finance (Mazzucato and Semieniuk 2018). At all levels, mobilising the necessary resources to leverage cross-sectoral mitigation synergies would require the combination of public and private financial sources (Jensen and Dowlatabadi 2018). Traditional public financing would be required to synergise mitigation across sectors where the risk-return and time profiles of investment are not sufficiently attractive for the business sector. Over the years, private development financing through public-private partnerships and other related variants has been a growing source of finance to leverage cross-sectoral synergies and manage trade-offs (Anbumozhi and Timilsina 2018; Attridge and Engen 2019; Ishiwatari et al. 2019). Promoting such blended approaches to finance along with result-based financing architectures to strengthen delivery institutions are advocated as effective means to mainstream cross-sectoral mitigation finance (limited evidence, high agreement ) (Attridge and Engen 2019; Ishiwatari et al. 2019). The World Bank group and the International Financial Corporation have used the blended finance results-based approach to climate financing that addresses institutional, infrastructure, and service needs across sectors targeting developing countries and marginalised communities (GPRBA 2019; IDA 2019).
12.7Knowledge Gaps
Finally, the literature review and analysis in Chapter 12 has taken account of the post-AR5 literature available and accessible to the chapter authors. Nonetheless, the assessment of the chapter is incomplete without mentioning knowledge gaps encountered during the assessment. These knowledge gaps include:
1. Interactions (synergies and trade-offs) between different CDR methods when deployed together are under-researched:
– co-benefits and trade-offs with biodiversity and ecosystem services associated with the implementation of CDR methods.
– constraining technical costs and potentials for CDR methods to define realistically achievable costs and potentials. Such research is useful for improving the representation of CDR methods in IAMs and country-level mitigation pathway modelling.
2. More work is required on how framing and communication of mitigation actions in terms of mitigation versus co-benefits potential affects public support in different contexts.
3. Additional research work is required to determine the cross-sectoral mitigation potential of emerging general-purpose technologies.
4. There is a lack of literature on mitigation finance frameworks promoting cross-sectoral mitigation linkages.
5. Additional research is needed to better quantify the net GHG emissions and co-benefits and adverse effects of emerging food technologies.
–Research in social and behavioural sciences should invest in assessing effectiveness of instruments aiming at shifting food choices in different national contexts.
–A better evidence basis is required to understand synergistic effects of policies in food system policy packages.
6. There is a lack of literature on regional and global mitigation potential of biomass production systems that are strategically deployed in agriculture and forestry landscapes, to achieve specific co-benefits.
7. There is a lack of knowledge on land occupation and associated co-benefits and adverse side effects from large-scale deployment of non-AFOLU mitigation options, and how such options can be integrated with agriculture and forestry to maximise synergies and minimise trade-offs.
Frequently Asked Questions (FAQs)
FAQ 12.1 | How could new technologies to remove carbon dioxide from the atmosphere contribute to climate change mitigation?
Limiting the increase in warming to well below 2°C, and achieving net zero CO2 or GHG emissions, will require anthropogenic CO2 removal from the atmosphere.
The carbon dioxide removal (CDR) methods studied so far have different removal potentials, costs, co-benefits and side effects. Some biological methods for achieving CDR, like afforestation/reforestation or wetland restoration, have long been practised. If implemented well, these practices can provide a range of co-benefits, but they can also have adverse side effects such as biodiversity loss or food price increases. Other chemical and geochemical approaches to CDR include direct air carbon capture and storage (DACCS), enhanced weathering or ocean alkalinity enhancement. They are generally less vulnerable to reversal than biological methods.
DACCS uses chemicals that bind to CO2 directly from the air; the CO2 is then removed from the sorbent and stored underground or mineralised. Enhanced weathering involves the mining of rocks containing minerals that naturally absorb CO2 from the atmosphere over geological timescales, which are crushed to increase the surface area and spread on soils (or elsewhere) where they absorb atmospheric CO2. Ocean alkalinity enhancement involves the extraction, processing, and dissolution of minerals and addition to the ocean where they enhance sequestration of CO2 as bicarbonate and carbonate ions in the ocean.
FAQ 12.2 | Why is it important to assess mitigation measures from a systemic perspective, rather than only looking at their potential to reduce greenhouse gas (GHG) emissions?
Mitigation measures do not only reduce GHGs, but have wider impacts. They can result in decreases or increases in GHG emissions in another sector or part of the value chain from where they are applied. They can have wider environmental (e.g., air and water pollution, biodiversity), social (e.g., employment creation, health) and economic (e.g., growth, investment) co-benefits or adverse side effects. Mitigation and adaptation can also be linked. Taking these considerations into account can help to enhance the benefits of mitigation action, and avoid unintended consequences, as well as provide a stronger case for achieving political and societal support and raising the finances required for implementation.
FAQ 12.3 | Why do we need a food systems approach for assessing GHG emissions and mitigation opportunities from food systems?
Activities associated with the food system caused about one-third of total anthropogenic GHG emissions in 2015, distributed across all sectors. Agriculture and fisheries produce crops and animal-source food, which are partly processed in the food industry, packed, distributed, retailed, cooked, and finally eaten. Each step is associated with resource use, waste generation, and GHG emissions.
A food systems approach helps identify critical areas as well as novel and alternative approaches to mitigation on both the supply side and the demand side of the food system. But complex co-impacts need to be considered and mitigation measures tailored to the specific context. International cooperation and governance of global food trade can support both mitigation and adaptation.
There is large scope for emissions reduction in both cropland and grazing production, and also in food processing, storage and distribution. Emerging options such as plant-based alternatives to animal food products and food from cellular agriculture are receiving increasing attention, but their mitigation potential is still uncertain and depends on the GHG intensity of associated energy systems due to relatively high energy needs. Diet changes can reduce GHG emissions and also improve health in groups with excess consumption of calories and animal food products, which is mainly prevalent in developed countries. Reductions in food loss and waste can help reduce GHG emissions further.
Recommendations to buy local food and avoid packaging can contribute to reducing GHG emissions but should not be generalised, as trade-offs exist with food waste, GHG footprint at farm gate, and accessibility to diverse healthy diets.
References
Aarts, N. and C. Leeuwis, 2010: Participation and Power: Reflections on the Role of Government in Land Use Planning and Rural Development. J. Agric. Educ. Ext. , 16(2) , 131–145, doi:10.1080/13892241003651381.
AASSA, 2018: Opportunities and challenges for research on food and nutrition security and agriculture in Asia. Association of Academies and Societies of Sciences in Asia, Gyeonggi-do, Republic of Korea, 70 pp.
Abbott, M., M. Bazilian, D. Egel, and H.H. Willis, 2017: Examining the food–energy–water and conflict nexus. Curr. Opin. Chem. Eng. , 18, 55–60, doi:10.1016/j.coche.2017.10.002.
Abebe, E., G. Gugsa, and M. Ahmed, 2020: Review on Major Food-Borne Zoonotic Bacterial Pathogens. J. Trop. Med. , 2020, doi:10.1155/2020/4674235.
Achterberg, E.P. et al., 2013: Natural iron fertilization by the Eyjafjallajökull volcanic eruption. Geophys. Res. Lett. , 40(5) , 921–926, doi:10.1002/grl.50221.
Adeh, E.H., S.P. Good, M. Calaf, and C.W. Higgins, 2019: Solar PV Power Potential is Greatest Over Croplands. Sci. Rep. , 9(1) , 11442, doi:10.1038/s41598-019-47803-3.
Adeyeye, S.A.O., 2017: The role of food processing and appropriate storage technologies in ensuring food security and food availability in Africa. Nutr. Food Sci. , 47(1) , 122–139, doi:10.1108/NFS-03-2016-0037.
Adeyeye, S.A.O. and O.B. Oyewole, 2016: An Overview of Traditional Fish Smoking In Africa. J. Culin. Sci. Technol. , 14(3) , 198–215, doi:10.1080/15428052.2015.1102785.
Agusdinata, D.B., W. Liu, H. Eakin, and H. Romero, 2018: Socio-environmental impacts of lithium mineral extraction: Towards a research agenda. Environ. Res. Lett. , 13(12) , 123001, doi:10.1088/1748-9326/aae9b1.
Ahlgren, S. et al., 2015: Review of methodological choices in LCA of biorefinery systems - key issues and recommendations. Biofuels, Bioprod. Biorefining, 9(5) , 606–619, doi:10.1002/BBB.1563.
Åhman, M., L.J. Nilsson, and B. Johansson, 2017: Global climate policy and deep decarbonization of energy-intensive industries. Clim. Policy, 17(5) , 634–649, doi:10.1080/14693062.2016.1167009.
Ahmed, S., S. Downs, and J. Fanzo, 2019: Advancing an Integrative Framework to Evaluate Sustainability in National Dietary Guidelines. Front. Sustain. Food Syst. , 3 (September), 1–20, doi:10.3389/fsufs.2019.00076.
Ahsan, R. and M. Ahmad, 2016: Development, displacement and resettlement a challenge for social sustainability: A study on mega development project (Bakun Dam) in Sarawak. Int’l J. Adv. Agric. Environ. Engg. , 3(1) , 47–51.
Aiking, H. and J. de Boer, 2019: Protein and sustainability – the potential of insects. J. Insects as Food Feed, 5(1) , 3–7, doi:10.3920/JIFF2018.0011.
Aiking, H. and J. de Boer, 2020: The next protein transition. Trends Food Sci. Technol. , 105 (May), 515–522, doi:10.1016/j.tifs.2018.07.008.
Akimoto, K., F. Sano, J. Oda, H. Kanaboshi, and Y. Nakano, 2021: Climate change mitigation measures for global net-zero emissions and the roles of CO2 capture and utilization and direct air capture. Energy Clim. Change, 2, 100057, doi:10.1016/j.egycc.2021.100057.
Al-Khudairy, L., O.A. Uthman, R. Walmsley, S. Johnson, and O. Oyebode, 2019: Choice architecture interventions to improve diet and/or dietary behaviour by healthcare staff in high-income countries: A systematic review. BMJ Open, 9(1) , 1–16, doi:10.1136/bmjopen-2018-023687.
Al-Kodmany, K., 2018: The vertical farm: A review of developments and implications for the vertical city. Buildings, 8(2) , 24, doi:10.3390/buildings8020024.
Alam, A. and P. Dwivedi, 2019: Modeling site suitability and production potential of carinata-based sustainable jet fuel in the southeastern United States. J. Clean. Prod. , 239, 117817, doi:10.1016/J.JCLEPRO.2019.117817.
Alanne, K. and S. Cao, 2017: Zero-energy hydrogen economy (ZEH2E) for buildings and communities including personal mobility. Renew. Sustain. Energy Rev. , 71 (October 2016), 697–711, doi:10.1016/j.rser.2016.12.098.
Alatiq, A. et al., 2021: Assessment of the carbon abatement and removal opportunities of the Arabian Gulf Countries. Clean Energy, 5(2) , 340–353, doi:10.1093/ce/zkab015.
Albizzati, P.F., D. Tonini, C.B. Chammard, and T.F. Astrup, 2019: Valorisation of surplus food in the French retail sector: Environmental and economic impacts. Waste Manag. , 90, 141–151, doi:10.1016/j.wasman.2019.04.034.
Albright, R. et al., 2016: Reversal of ocean acidification enhances net coral reef calcification. Nature, 531(7594) , 362–365, doi:10.1038/nature17155.
Alexander, P. et al., 2017: Could consumption of insects, cultured meat or imitation meat reduce global agricultural land use?Glob. Food Sec. , 15, 22–32, doi:10.1016/j.gfs.2017.04.001.
Almeida, R.M. et al., 2019: Reducing greenhouse gas emissions of Amazon hydropower with strategic dam planning. Nat. Commun. , 10(1) , 4281, doi:10.1038/s41467-019-12179-5.
Alshammari, Y.M., 2020: Achieving Climate Targets via the Circular Carbon Economy: The Case of Saudi Arabia. C—Journal Carbon Res. , 6(3) , 54, doi:10.3390/c6030054.
Amann, T. et al., 2020: Enhanced Weathering and related element fluxes – a cropland mesocosm approach. Biogeosciences, 17(1) , 103–119, doi:10.5194/bg-17-103-2020.
Amjath-Babu, T.S. et al., 2019: Integrated modelling of the impacts of hydropower projects on the water-food-energy nexus in a transboundary Himalayan river basin. Appl. Energy, 239 (April 2019), 494–503, doi:10.1016/j.apenergy.2019.01.147.
Amundson, R. et al., 2015: Soil and human security in the 21st century. Science, 348(6235) , doi:10.1126/science.1261071.
Anandarajah, G., O. Dessens, and W. McDowall, 2018: The Future for Bioenergy Systems: The Role of BECCS? In: Biomass Energy with Carbon Capture and Storage (BECCS) , Wiley Online Books, pp. 205–226.
Anastasiou, K., M. Miller, and K. Dickinson, 2019: The relationship between food label use and dietary intake in adults: A systematic review. Appetite, 138 (April), 280–291, doi:10.1016/j.appet.2019.03.025.
Anbumozhi, V., and P. Timilsina, 2018: Leveraging Private Finance Through Public Finance: Role of International Financial Institutions. In: Financing for Low-carbon Energy Transition: Unlocking the Potential of Private Capital[Anbumozhi, V., K. Kalirajan, and F. Kimura, (eds.)], Springer Singapore, Singapore, pp. 317–334.
Andam, K.S., D. Tschirley, S.B. Asante, R.M. Al-Hassan, and X. Diao, 2018: The transformation of urban food systems in Ghana: Findings from inventories of processed products. Outlook Agric. , 47(3) , 233–243, doi:10.1177/0030727018785918.
Anderegg, W.R.L. et al., 2020: Climate-driven risks to the climate mitigation potential of forests. Science, 368(6497) , doi:10.1126/SCIENCE.AAZ7005.
Anderson, C., J. Bruil, M.J. Chappell, C. Kiss, and M. Pimbert, 2019: From Transition to Domains of Transformation: Getting to Sustainable and Just Food Systems through Agroecology. Sustainability, 11, 5272, doi:10.3390/su11195272.
Anderson, K. and G. Peters, 2016: The trouble with negative emissions. Science, 354(6309) , 182–183, doi:10.1126/science.aah4567.
Andrée, P., M. Coulas, and P. Ballamingie, 2018: Governance recommendations from forty years of national food strategy development in Canada and beyond. Can. Food Stud. / La Rev. Can. des études sur l’alimentation, 5(3) , 6–27, doi:10.15353/cfs-rcea.v5i3.283.
Ansari, W.A. et al., 2020: Genome editing in cereals: Approaches, applications and challenges. Int. J. Mol. Sci. 21(11) , doi.org/10.3390/ijms21114040.
Antwi-Agyei, P., A.J. Dougill, T.P. Agyekum, and L.C. Stringer, 2018: Alignment between nationally determined contributions and the sustainable development goals for West Africa. Clim. Policy, 18(10) , 1296–1312, doi:10.1080/14693062.2018.1431199.
Anwar, M.N. et al., 2020: CO2 utilization: Turning greenhouse gas into fuels and valuable products. J. Environ. Manage. , 260, doi:10.1016/j.jenvman.2019.110059.
Apostolidis, C. and F. McLeay, 2016: Should we stop meating like this? Reducing meat consumption through substitution. Food Policy, 65, 74–89, doi:10.1016/j.foodpol.2016.11.002.
Arent, D. et al., 2014: Implications of high renewable electricity penetration in the U.S. for water use, greenhouse gas emissions, land-use, and materials supply. Appl. Energy, 123, 368–377, doi:10.1016/j.apenergy.2013.12.022.
Aristizábal‐Marulanda, V. and C.A. Cardona Alzate, 2019: Methods for designing and assessing biorefineries: Review. Biofuels, Bioprod. Biorefining, 13(3) , 789–808, doi:10.1002/bbb.1961.
Ariti, A.T., J. van Vliet, and P.H. Verburg, 2018: Farmers’ participation in the development of land use policies for the Central Rift Valley of Ethiopia. Land use policy, 71, 129–137, doi:10.1016/J.LANDUSEPOL.2017.11.051.
Armanda, D.T., J.B. Guinée, and A. Tukker, 2019: The second green revolution: Innovative urban agriculture’s contribution to food security and sustainability – A review. Glob. Food Sec. , 22 (August), 13–24, doi:10.1016/j.gfs.2019.08.002.
Armstrong, A., N.J. Ostle, and J. Whitaker, 2016: Solar park microclimate and vegetation management effects on grassland carbon cycling. Environ. Res. Lett. , 11(7) , 74016, doi:10.1088/1748-9326/11/7/074016.
Arno, A. and S. Thomas, 2016: The efficacy of nudge theory strategies in influencing adult dietary behaviour: A systematic review and meta-analysis. BMC Public Health, 16(1) , 1–11, doi:10.1186/s12889-016-3272-x.
Arroyo-Currás, T. et al., 2015: Carbon leakage in a fragmented climate regime: The dynamic response of global energy markets. Technol. Forecast. Soc. Change, 90 (PA), 192–203, doi:10.1016/j.techfore.2013.10.002.
Asbjornsen, H. et al., 2014: Targeting perennial vegetation in agricultural landscapes for enhancing ecosystem services. Renew. Agric. Food Syst. , 29(2) , 101–125, doi:10.1017/S1742170512000385.
Attridge, S. and L. Engen, 2019: Blended finance in the poorest countries: The need for a better approach. ODI, London, 75 pp.
Atuonwu, J.C. et al., 2018: Comparative assessment of innovative and conventional food preservation technologies: Process energy performance and greenhouse gas emissions. Innov. Food Sci. Emerg. Technol. , 50, 174–187, doi:10.1016/j.ifset.2018.09.008.
Aumont, O. and L. Bopp, 2006: Globalizing results from ocean in situ iron fertilization studies. Global Biogeochem. Cycles, 20(2) , doi:10.1029/2005GB002591.
Averchenkova, A., S. Fankhauser, and J.J. Finnegan, 2021: The impact of strategic climate legislation: evidence from expert interviews on the UK Climate Change Act. Clim. Policy, 21(2) , 251–263, doi:10.1080/14693062.2020.1819190.
Babin, A., C. Vaneeckhaute, and M.C. Iliuta, 2021: Potential and challenges of bioenergy with carbon capture and storage as a carbon-negative energy source: A review. Biomass and Bioenergy, 146, 105968, doi:10.1016/j.biombioe.2021.105968.
Bach, L.T., S.J. Gill, R.E.M. Rickaby, S. Gore, and P. Renforth, 2019: CO2 Removal With Enhanced Weathering and Ocean Alkalinity Enhancement: Potential Risks and Co-benefits for Marine Pelagic Ecosystems. Front. Clim. , 1, 7, doi:10.3389/fclim.2019.00007.
Bach, L.T. et al., 2021: Testing the climate intervention potential of ocean afforestation using the Great Atlantic Sargassum Belt. Nat. Commun. , 12(1) , 2556, doi:10.1038/s41467-021-22837-2.
Backhouse, M. and R. Lehmann, 2020: New ‘renewable’ frontiers: contested palm oil plantations and wind energy projects in Brazil and Mexico. J. Land Use Sci. , 15(2–3) , 373–388, doi:10.1080/1747423X.2019.1648577.
Bai, Y., R. Alemu, S.A. Block, D. Headey, and W.A. Masters, 2021: Cost and affordability of nutritious diets at retail prices: Evidence from 177 countries. Food Policy, 99, 101983, doi:10.1016/j.foodpol.2020.101983.
Baik, E. et al., 2018: Geospatial analysis of near-term potential for carbon-negative bioenergy in the United States. Proc. Natl. Acad. Sci. , 115(13) , 3290–3295, doi:10.1073/pnas.1720338115.
Bajželj, B. et al., 2014: Importance of food-demand management for climate mitigation. Nat. Clim. Change, 4(10) , 924–929, doi:10.1038/nclimate2353.
Bajželj, B., T.E. Quested, E. Röös, and R.P.J. Swannell, 2020: The role of reducing food waste for resilient food systems. Ecosyst. Serv. , 45 (June), 101140, doi:10.1016/j.ecoser.2020.101140.
Baka, J., 2013: The Political Construction of Wasteland: Governmentality, Land Acquisition and Social Inequality in South India. Dev. Change, 44(2) , 409–428, doi:10.1111/dech.12018.
Baka, J., 2014: What wastelands? A critique of biofuel policy discourse in South India. Geoforum, 54, 315–323, doi:10.1016/j.geoforum.2013.08.007.
Baker, P. and S. Friel, 2016: Food systems transformations, ultra-processed food markets and the nutrition transition in Asia. Global. Health, 12(1) , 80, doi:10.1186/s12992-016-0223-3.
Bakhsh, K., S. Rose, M.F. Ali, N. Ahmad, and M. Shahbaz, 2017: Economic growth, CO2 emissions, renewable waste and FDI relation in Pakistan: New evidences from 3SLS. J. Environ. Manage. , 196, 627–632, doi:10.1016/j.jenvman.2017.03.029.
Baldock, J.A. and J.O. Skjemstad, 2000: Role of the soil matrix and minerals in protecting natural organic materials against biological attack. Org. Geochem. , 31(7–8) , 697–710, doi:10.1016/S0146-6380(00)00049-8.
Baldos, U.L.C. and T.W. Hertel, 2015: The role of international trade in managing food security risks from climate change. Food Secur. , 7(2) , doi:10.1007/s12571-015-0435-z.
Barbarossa, V. et al., 2020: Impacts of current and future large dams on the geographic range connectivity of freshwater fish worldwide. Proc. Natl. Acad. Sci. , 117(7) , 3648 LP – 3655, doi:10.1073/pnas.1912776117.
Barbieri, P., S. Pellerin, V. Seufert, and T. Nesme, 2019: Changes in crop rotations would impact food production in an organically farmed world. Nat. Sustain. , 2(5) , 378–385, doi:10.1038/s41893-019-0259-5.
Barbieri, P. et al., 2021: Global option space for organic agriculture is delimited by nitrogen availability. Nat. Food, 2, 363–372, doi:10.1038/s43016-021-00276-y.
Barker, T. et al., 2007: Mitigation from a cross-sectoral perspective. In: Climate Change 2007: Mitigation. Contribution of Working Group III to the Fourth Assessment Report of the Intergovernmental Panel on Climate Change[Metz, B., O.R. Davidson, P.R. Bosch, R. Dave, and L.A. Meyer, (eds.)]. Cambridge University Press, Cambridge, UK and New York, NY, USA, pp. 621–687.
Barron-Gafford, G.A. et al., 2019: Agrivoltaics provide mutual benefits across the food–energy–water nexus in drylands. Nat. Sustain. , 2(9) , 848–855, doi:10.1038/s41893-019-0364-5.
Bascopé, M., P. Perasso, and K. Reiss, 2019: Systematic review of education for sustainable development at an early stage: Cornerstones and pedagogical approaches for teacher professional development. Sustainability, 11(3) , doi:10.3390/su11030719.
Batres, M. et al., 2021: Environmental and climate justice and technological carbon removal. Electr. J. , 34(7) , 107002, doi:10.1016/j.tej.2021.107002.
Bauer, J.M. and L.A. Reisch, 2019: Behavioural Insights and (Un)healthy Dietary Choices: a Review of Current Evidence. J. Consum. Policy, 42(1) , 3–45, doi:10.1007/s10603-018-9387-y.
Bauer, N. et al., 2015: CO2 emission mitigation and fossil fuel markets: Dynamic and international aspects of climate policies. Technol. Forecast. Soc. Change, 90 (PA), 243–256, doi:10.1016/j.techfore.2013.09.009.
Bauer, N. et al., 2018: Global energy sector emission reductions and bioenergy use: overview of the bioenergy demand phase of the EMF-33 model comparison. Clim. Change, 163, 1553–1568, doi:10.1007/s10584-018-2226-y.
Bayraktarov, E. et al., 2016: The cost and feasibility of marine coastal restoration. Ecol. Appl. , 26(4) , 1055–1074, doi:10.1890/15-1077.
Bazilian, M. et al., 2011: Considering the energy, water and food nexus: Towards an integrated modelling approach. Energy Policy, 39(12) , 7896–7906, doi:10.1016/j.enpol.2011.09.039.
Beacham, A.M., L.H. Vickers, and J.M. Monaghan, 2019: Vertical farming: a summary of approaches to growing skywards. J. Hortic. Sci. Biotechnol. , 94(3) , 277–283, doi:10.1080/14620316.2019.1574214.
Bechthold, A., H. Boeing, I. Tetens, L. Schwingshackl, and U. Nöthlings, 2018: Perspective: Food-Based Dietary Guidelines in Europe—Scientific Concepts, Current Status, and Perspectives. Adv. Nutr. , 9(5) , 544–560, doi:10.1093/advances/nmy033.
Bednar, J., M. Obersteiner, and F. Wagner, 2019: On the financial viability of negative emissions. Nat. Commun. , 10(1) , 1783, doi:10.1038/s41467-019-09782-x.
Beerling, D.J. et al., 2018: Farming with crops and rocks to address global climate, food and soil security. Nat. Plants, 4, 138–147, doi:10.1038/s41477-018-0108-y.
Beerling, D.J. et al., 2020: Potential for large-scale CO2 removal via enhanced rock weathering with croplands. Nature, 583, 242–248, doi:10.1038/s41586-020-2448-9.
Behfar, A., D. Yuill, and Y. Yu, 2018: Supermarket system characteristics and operating faults (RP-1615). Sci. Technol. Built Environ. , 24(10) , 1104–1113, doi:10.1080/23744731.2018.1479614.
Bell, P. et al., 2018: A Practical Guide to Climate-Smart Agriculture Technologies in Africa. CCAFS Working Paper no. 224. CGIAR Research Program on Climate Change, Agriculture and Food Security, Wageningen, Netherlands, http://www.ccafs.cgiar.org.
Bellamy, R., 2018: Incentivize negative emissions responsibly. Nat. Energy, 3(7) , 532–534, doi:10.1038/s41560-018-0156-6.
Bellamy, R. and O. Geden, 2019: Govern CO2 removal from the ground up. Nat. Geosci. , 12(11) , 874–876, doi:10.1038/s41561-019-0475-7.
Bellamy, R., J. Lezaun, and J. Palmer, 2019: Perceptions of bioenergy with carbon capture and storage in different policy scenarios. Nat. Commun. , 10(1) , 743, doi:10.1038/s41467-019-08592-5.
Béné, C. et al., 2020: Global drivers of food system (un)sustainability: A multi-country correlation analysis. PLoS One, 15(4) , e0231071, doi:10.1371/journal.pone.0231071.
Benke, K. and B. Tomkins, 2017: Future food-production systems: vertical farming and controlled-environment agriculture. Sustain. Sci. Pract. Policy, 13(1) , 13–26, doi:10.1080/15487733.2017.1394054.
Bennani, H. et al., 2020: Overview of evidence of antimicrobial use and antimicrobial resistance in the food chain. Antibiotics, 9(2) , 1–18, doi:10.3390/antibiotics9020049.
Benton, T.G., T. Bailey, and R. Bailey, 2019: The paradox of productivity: agricultural productivity promotes food system inefficiency. Glob. Sustain. , 2, 1–8, doi:10.1017/sus.2019.3.
Bentsen, N.S. and I.M. Møller, 2017: Solar energy conserved in biomass: Sustainable bioenergy use and reduction of land use change. Renew. Sustain. Energy Rev. , 71, 954–958, doi.org/10.1016/j.rser.2016.12.124.
Bergmann Madsen, B., 2018: Copenhagen: Organic Conversion in Public Kitchens., https://webgate.ec.europa.eu/dyna/bp-portal/getfile.cfm?fileid=332.
Bernauer, T. and L.F. McGrath, 2016: Simple reframing unlikely to boost public support for climate policy. Nat. Clim. Change, 6(7) , 680–683, doi:10.1038/nclimate2948.
Berndes, G., P. Börjesson, M. Ostwald, and M. Palm, 2008: Multifunctional biomass production systems –an overview with presentation of specific applications in India and Sweden. Biofuels, Bioprod. Biorefining, 2(1) , 16–25, doi:10.1002/bbb.52.
Berners-Lee, M., C. Kennelly, R. Watson, and C.N. Hewitt, 2018: Current global food production is sufficient to meet human nutritional needs in 2050 provided there is radical societal adaptation. Elem Sci Anth, 6(1) , 52, doi:10.1525/elementa.310.
Berry, P.M. et al., 2015: Cross-sectoral interactions of adaptation and mitigation measures. Clim. Change, 128(3–4) , 381–393, doi:10.1007/s10584-014-1214-0.
Bertram, C. and C. Merk, 2020: Public Perceptions of Ocean-Based Carbon Dioxide Removal: The Nature-Engineering Divide?Front. Clim. , 2, 31, doi:10.3389/fclim.2020.594194.
Beuttler, C., L. Charles, and J. Wurzbacher, 2019: The Role of Direct Air Capture in Mitigation of Anthropogenic Greenhouse Gas Emissions. Front. Clim. , 1, 10, doi:10.3389/fclim.2019.00010.
Bezner Kerr, R. et al., 2019: Participatory agroecological research on climate change adaptation improves smallholder farmer household food security and dietary diversity in Malawi. Agric. Ecosyst. Environ. , 279, 109–121, doi:10.1016/j.agee.2019.04.004.
Bezner Kerr, R. et al., 2021: Can agroecology improve food security and nutrition? A review. Glob. Food Sec. , 29, 100540, doi:10.1016/J.GFS.2021.100540.
Bhardwaj, A., M. Joshi, R. Khosla, and N.K. Dubash, 2019: More priorities, more problems? Decision-making with multiple energy, development and climate objectives. Energy Res. Soc. Sci. , 49, 143–157, doi:10.1016/J.ERSS.2018.11.003.
Bharucha, Z.P., S.B. Mitjans, and J. Pretty, 2020: Towards redesign at scale through zero budget natural farming in Andhra Pradesh, India. Int. J. Agric. Sustain. , 18(1) , doi:10.1080/14735903.2019.1694465.
Bhattacharya, A., J.P. Meltzer, J. Oppenheim, Z. Qureshi, and L.N. Stern, 2016: Delivering on sustainable infrastructure for better development and better climate. Brookings Institution, Washington, DC, USA, 160 pp. https://www.brookings.edu/research/delivering-on-sustainable-infrastructure-for-better-development-and-better-climate/ (Accessed December 3, 2019).
Bhattacharya, A., H. Kharas, M. Plant, and A. Prizzon, 2018: The new global agenda and the future of the multilateral development bank system. Brookings Institution, Washington, DC, USA, 24 pp. https://www.brookings.edu/research/the-new-global-agenda-and-the-future-of-the-multilateral-development-bank-system/ (Accessed December 3, 2019).
Bhunnoo, R., 2019: The need for a food-systems approach to policy making. Lancet , 393(10176) , 1097–1098, doi:10.1016/S0140-6736(18)32754-5.
Bianchi, E., C. Bowyer, J.A. Morrison, R. Vos, and L. Wellesley, 2018a: Redirecting investment for a global food system that is sustainable and promotes healthy diets. Economics Discussion Papers 2018-69, Kiel Institute for the World Economy, Kiel, Germany, http://hdl.handle.net/10419/182388.
Bianchi, F., E. Garnett, C. Dorsel, P. Aveyard, and S.A. Jebb, 2018b: Restructuring physical micro-environments to reduce the demand for meat: a systematic review and qualitative comparative analysis. Lancet Planet. Heal. , 2(9) , e384–e397, doi:10.1016/S2542-5196(18)30188-8.
Biermann, F. et al., 2016: Down to Earth: Contextualizing the Anthropocene. Glob. Environ. Change, 39, 341–350, doi.org/10.1016/j.gloenvcha. 2015.11.004.
Bindoff, N.L., W.W.L. Cheung, J.G. Kairo, J. Arístegui, V.A. Guinder, R. Hallberg, N. Hilmi, N. Jiao, M.S. Karim, L. Levin, S. O’Donoghue, S.R. Purca Cuicapusa, B. Rinkevich, T. Suga, A. Tagliabue, and P. Williamson, 2019: Changing Ocean, Marine Ecosystems, and Dependent Communities. In: IPCC Special Report on the Ocean and Cryosphere in a Changing Climate[Pörtner, H.-O., D.C. Roberts, V. Masson-Delmotte, P. Zhai, M. Tignor, E. Poloczanska, K. Mintenbeck, A. Alegría, M. Nicolai, A. Okem, J. Petzold, B. Rama and N.M. Weyer (eds.)]. Cambridge University Press, Cambridge, UK, and New York, NY, USA, pp. 447–587.
Bistline, J.E.T. and G.J. Blanford, 2021: Impact of carbon dioxide removal technologies on deep decarbonization of the electric power sector. Nat. Commun. , 12(1) , 3732, doi:10.1038/s41467-021-23554-6.
Blain, S., B. Quéguiner, and T. Trull, 2008: The natural iron fertilization experiment KEOPS (KErguelen Ocean and Plateau compared Study): An overview. Deep Sea Res. Part II Top. Stud. Oceanogr. , 55(5–7) , 559–565, doi:10.1016/J.DSR2.2008.01.002.
Blair, M.J., B. Gagnon, A. Klain, and B. Kulišić, 2021: Contribution of Biomass Supply Chains for Bioenergy to Sustainable Development Goals. L. 2021, 10(2) , 181, doi:10.3390/LAND10020181.
Blakely, T. et al., 2020: The effect of food taxes and subsidies on population health and health costs: a modelling study. Lancet Public Heal. , 5(7) , e404–e413, doi:10.1016/S2468-2667(20)30116-X. Blanco, H., W. Nijs, J. Ruf, and A. Faaij, 2018: Potential for hydrogen and Power-to-Liquid in a low-carbon EU energy system using cost optimization. Appl. Energy, 232, 617–639, doi:10.1016/j.apenergy.2018.09.216.
BNEF, 2020: Electric Vehicle Outlook 2020. BloombergNEF, London, UK, https://about.bnef.com/electric-vehicle-outlook/.
Bodirsky, B.L. et al., 2014: Reactive nitrogen requirements to feed the world in 2050 and potential to mitigate nitrogen pollution. Nat. Commun. , 5(1) , 3858, doi:10.1038/ncomms4858.
Bodirsky, B.L. et al., 2020: The Ongoing Nutrition Transition Thwarts Long-Term Targets for Food Security, Public Health and Environmental Protection. Sci. Rep. , 10(1) , 1–14, doi:10.1038/s41598-020-75213-3.
Boettcher, M. et al., 2021: Navigating Potential Hype and Opportunity in Governing Marine Carbon Removal. Front. Clim. , 3, 47, doi:10.3389/fclim.2021.664456.
Bonansea, M. et al., 2020: Assessing water surface temperature from Landsat imagery and its relationship with a nuclear power plant. doi.org/10.1080/02626667.2020.1845342, 66(1) , 50–58, doi:10.1080/02626667.2020.1845342.
Bonnet, C., Z. Bouamra-Mechemache, and T. Corre, 2018: An Environmental Tax Towards More Sustainable Food: Empirical Evidence of the Consumption of Animal Products in France. Ecol. Econ. , 147 (January), 48–61, doi:10.1016/j.ecolecon.2017.12.032.
Bopp, L. et al., 2013: Multiple stressors of ocean ecosystems in the 21st century: Projections with CMIP5 models. Biogeosciences, 10(10) , 6225–6245, doi:10.5194/BG-10-6225-2013.
Boukid, F., 2021: Plant-based meat analogues: from niche to mainstream. Eur. Food Res. Technol. , 247(2) , 297–308, doi:10.1007/s00217-020-03630-9.
Boyd, P.W., 2008: Introduction and synthesis. Mar. Ecol. Prog. Ser. , 364, 213–218, doi:10.3354/meps07541.
Boysen, L.R. et al., 2017: The limits to global-warming mitigation by terrestrial carbon removal. Earth’s Futur. , 5(5) , 463–474, doi:10.1002/2016EF000469.
Braghiroli, F.L., and L. Passarini, 2020: Valorization of Biomass Residues from Forest Operations and Wood Manufacturing Presents a Wide Range of Sustainable and Innovative Possibilities. Curr. For. Reports 2020 62, 6(2) , 172–183, doi:10.1007/S40725-020-00112-9.
Brander, M., F. Ascui, V. Scott, and S. Tett, 2021: Carbon accounting for negative emissions technologies. Clim. Policy, 21(5) , 699–717, doi:10.1080/14693062.2021.1878009.
Breyer, C., E. Tsupari, V. Tikka, and P. Vainikka, 2015: Power-to-gas as an emerging profitable business through creating an integrated value chain. Energy Procedia, 73, 182–189, 10.1016/J.EGYPRO.2015.07.668
Breyer, C., M. Fasihi, C. Bajamundi, and F. Creutzig, 2019: Direct Air Capture of CO2: A Key Technology for Ambitious Climate Change Mitigation. Joule, 3(9) , 2053–2057, doi:10.1016/j.joule.2019.08.010.
Breyer, C., M. Fasihi, and A. Aghahosseini, 2020: Carbon dioxide direct air capture for effective climate change mitigation based on renewable electricity: a new type of energy system sector coupling. Mitig. Adapt. Strateg. Glob. Change, 25(1) , 43–65, doi:10.1007/s11027-019-9847-y.
Broers, V.J.V., C. De Breucker, S. Van Den Broucke, and O. Luminet, 2017: A systematic review and meta-analysis of the effectiveness of nudging to increase fruit and vegetable choice. Eur. J. Public Health, 27(5) , 912–920, doi:10.1093/eurpub/ckx085.
Brouwer, I.D., J. McDermott, and R. Ruben, 2020: Food systems everywhere: Improving relevance in practice. Glob. Food Sec. , 26 (June), 100398, doi:10.1016/j.gfs.2020.100398.
Bruno, J., L. Duro, and F. Diaz-Maurin, 2020: Spent nuclear fuel and disposal. In: Advances in Nuclear Fuel Chemistry [Piro, M.H.H (ed.)]. , Woodhead Publishing, Cambridge, UK, pp 527–553, doi:10.1016/B978-0-08-102571- 0.00014-8.
Bruun, S., L.S. Jensen, V.T. Khanh Vu, and S. Sommer, 2014: Small-scale household biogas digesters: An option for global warming mitigation or a potential climate bomb?Renew. Sustain. Energy Rev. , 33, 736–741, doi:10.1016/j.rser.2014.02.033.
Bucher, T. et al., 2016: Nudging consumers towards healthier choices: a systematic review of positional influences on food choice. Br. J. Nutr. , 115(12) , 2252–2263, doi:10.1017/S0007114516001653.
Buck, H.J., 2016: Rapid scale-up of negative emissions technologies: social barriers and social implications. Clim. Change, 139(2) , 155–167, doi:10.1007/s10584-016-1770-6.
Buck, H.J., 2021: Social science for the next decade of carbon capture and storage. Electr. J. , 34(7) , 107003, doi:10.1016/j.tej.2021.107003.
Buck, H.J., J. Furhman, D.R. Morrow, D.L. Sanchez, and F.M. Wang, 2020: Adaptation and Carbon Removal. One Earth, 3(4) , 425–435, doi:10.1016/j.oneear.2020.09.008.
Bugge, M.M., S. Bolwig, T. Hansen, and A.N. Tanner, 2019: Theoretical perspectives on innovation for waste valorisation in the bioeconomy. In: From Waste to Value[Klitkou, A., A.M. Fevolden, and M. Capasso, (eds.)], Routledge, London, UK, pp. 51–70.
Bui, M. et al., 2018: Carbon capture and storage (CCS): the way forward. Energy Environ. Sci. , 11(5) , 1062–1176, doi:10.1039/C7EE02342A. Bui, M., D. Zhang, M. Fajardy, and N. Mac Dowell, 2021: Delivering carbon negative electricity, heat and hydrogen with BECCS – Comparing the options. Int. J. Hydrogen Energy, 46(29) , 15298–15321, doi:10.1016/j.ijhydene.2021.02.042.
Buisman, M.E., R. Haijema, and J.M. Bloemhof-Ruwaard, 2019: Discounting and dynamic shelf life to reduce fresh food waste at retailers. Int. J. Prod. Econ. , 209, 274–284, doi:10.1016/j.ijpe.2017.07.016.
Burdige, D.J., 2005: Burial of terrestrial organic matter in marine sediments: A re-assessment. Global Biogeochem. Cycles, 19(4) , n/a-n/a, doi:10.1029/2004GB002368.
Burns, W. and C.R. Corbett, 2020: Antacids for the Sea? Artificial Ocean Alkalinization and Climate Change. One Earth, 3(2) , 154–156, doi:10.1016/j.oneear.2020.07.016.
Busch, G., 2017: A spatial explicit scenario method to support participative regional land-use decisions regarding economic and ecological options of short rotation coppice (SRC) for renewable energy production on arable land: case study application for the Göttingen district, Germany. Energy, Sustain. Soc. 2017 71, 7(1) , 1–23, doi:10.1186/S13705-017-0105-4.
Buss, W., K. Yeates, E.J. Rohling, and J. Borevitz, 2021: Enhancing natural cycles in agro-ecosystems to boost plant carbon capture and soil storage. Oxford Open Clim. Change, 1(1) , doi:10.1093/OXFCLM/KGAB006.
Buylova, A., M. Fridahl, N. Nasiritousi, and G. Reischl, 2021: Cancel (Out) Emissions? The Envisaged Role of Carbon Dioxide Removal Technologies in Long-Term National Climate Strategies. Front. Clim. , 3, 63, doi:10.3389/fclim.2021.675499.
C40 Cities, 2019: Good Food Cities: Achieving a Planetary Health Diet for All. 2 pp. https://c40-production-images.s3.amazonaws.com/press_releases/ images/415_C40_Good_Food_Cities_Declaration_EN_Final_-_CLEAN_3_. original. pdf?1570699994.
Cacho, J.F., M.C. Negri, C.R. Zumpf, and P. Campbell, 2018: Introducing perennial biomass crops into agricultural landscapes to address water quality challenges and provide other environmental services. Wiley Interdiscip. Rev. Energy Environ. , 7(2) , e275, doi:10.1002/wene.275.
Cadario, R. and P. Chandon, 2018: Which Healthy Eating Nudges Work Best? A Meta-Analysis of Field Experiments. Marketing Science 39(3):465-486, https://doi.org/10.1287/mksc.2018.1128.
Cagle, A.E. et al., 2020: The Land Sparing, Water Surface Use Efficiency, and Water Surface Transformation of Floating Photovoltaic Solar Energy Installations. Sustainability, 12(19) , 8154, doi:10.3390/su12198154.
Cairns, R. and A. Krzywoszynska, 2016: Anatomy of a buzzword: The emergence of ‘the water-energy-food nexus’ in UK natural resource debates. Environ. Sci. Policy, 64, 164–170, doi:10.1016/j.envsci.2016.07.007.
Caldeira, C. et al., 2020: Sustainability of food waste biorefinery: A review on valorisation pathways, techno-economic constraints, and environmental assessment. Bioresour. Technol. , 312 (March), 123575, doi:10.1016/j.biortech.2020.123575.
Calvin, K. et al., 2021: Bioenergy for climate change mitigation: scale and sustainability. GCB Bioenergy, 13(9) , 1346–1371, doi:10.1111/gcbb.12863.
Camaratta, R., T.M. Volkmer, and A.G. Osorio, 2020: Embodied energy in beverage packaging. J. Environ. Manage. , 260, 110172, doi.org/10.1016/j.jenvman.2020.110172.
Campbell, B.M. et al., 2017: Agriculture production as a major driver of the earth system exceeding planetary boundaries. Ecol. Soc. , 22(4) , doi:10.5751/ES-09595-220408.
Campbell, B.M. et al., 2018: Urgent action to combat climate change and its impacts (SDG 13): transforming agriculture and food systems. Curr. Opin. Environ. Sustain. , 34 (Sdg 13), 13–20, doi:10.1016/j.cosust.2018.06.005.
Candel, J.J.L., 2014: Food security governance: a systematic literature review. Food Secur. , 6(4) , 585–601, doi:10.1007/s12571-014-0364-2.
Candel, J.J.L., 2019: What’s on the menu? A global assessment of MUFPP signatory cities’ food strategies. Agroecol. Sustain. Food Syst. , 44(7) , 1–28, doi:10.1080/21683565.2019.1648357.
Cantzler, J. et al., 2020: Saving resources and the climate? A systematic review of the circular economy and its mitigation potential. Environ. Res. Lett. , 15(12) , 123001, doi:10.1088/1748-9326/abbeb7.
Cao, L. and K. Caldeira, 2010: Can ocean iron fertilization mitigate ocean acidification?Clim. Chang. 2010 991, 99(1) , 303–311, doi:10.1007/S10584-010-9799-4.
Capellán-Pérez, I., C. de Castro, and I. Arto, 2017: Assessing vulnerabilities and limits in the transition to renewable energies: Land requirements under 100% solar energy scenarios. Renew. Sustain. Energy Rev. , 77, 760–782, doi:10.1016/J.RSER.2017.03.137.
Capros, P. et al., 2019: Energy-system modelling of the EU strategy towards climate-neutrality. Energy Policy, 134, 110960, doi:10.1016/j.enpol.2019.110960.
Caron, P. et al., 2018: Food systems for sustainable development: proposals for a profound four-part transformation. Agron. Sustain. Dev. , 38, doi:10.1007/s13593-018-0519-1.
Carrara, S., P. Alves Dias, B. Plazzotta, C. Pavel, and European Commission. Joint Research Centre., 2020: Raw materials demand for wind and solar PV technologies in the transition towards a decarbonised energy system. JCR, EUR 30095 EN, Publications Office of the European Union, Luxembourg, 2020, doi:10.2760/160859.
Carrenõ, I. and T. Dolle, 2018: Tofu steaks? Developments on the naming and marketing of plant-based foods in the aftermath of the TofuTown judgement. Eur. J. Risk Regul. , 9(3) , 575–584, doi:10.1017/err.2018.43.
Carton, W., 2019: “Fixing” Climate Change by Mortgaging the Future: Negative Emissions, Spatiotemporal Fixes, and the Political Economy of Delay. Antipode, 51(3) , 750–769, doi:10.1111/anti.12532.
Carton, W., A. Asiyanbi, S. Beck, H.J. Buck, and J.F. Lund, 2020: Negative emissions and the long history of carbon removal. WIREs Clim. Change, 11(6) , e671, doi:10.1002/wcc.671.
Caserini, S. et al., 2019: Affordable CO2 negative emission through hydrogen from biomass, ocean liming, and CO2 storage. Mitig. Adapt. Strateg. Glob. Change, 24(7) , 1231–1248, doi:10.1007/s11027-018-9835-7.
Caserini, S. et al., 2021: Potential of Maritime Transport for Ocean Liming and Atmospheric CO2 Removal. Front. Clim. , 3, 22, doi:10.3389/fclim.2021.575900.
Cazzolla Gatti, R., J. Liang, A. Velichevskaya, and M. Zhou, 2019: Sustainable palm oil may not be so sustainable. Sci. Total Environ. , 652, 48–51, doi:10.1016/j.scitotenv.2018.10.222.
Centola, D., J. Becker, D. Brackbill, and A. Baronchelli, 2018: Experimental evidence for tipping points in social convention. Science, 360(6393) , 1116–1119, doi:10.1126/science.aas8827.
Chai, B.C. et al., 2019: Which Diet Has the Least Environmental Impact on Our Planet? A Systematic Review of Vegan, Vegetarian and Omnivorous Diets. Sustainability, 11(15) , 4110, doi:10.3390/su11154110.
Chakravorty, U., M.H. Hubert, M. Moreaux, and L. Nøstbakken, 2017: Long-Run Impact of Biofuels on Food Prices. Scand. J. Econ. , 119(3) , doi:10.1111/sjoe.12177.
Chaomuang, N., D. Flick, and O. Laguerre, 2017: Experimental and numerical investigation of the performance of retail refrigerated display cabinets. Trends Food Sci. Technol. , 70, 95–104, doi:10.1016/j.tifs.2017.10.007.
Chatterjee, S. and K.-W. Huang, 2020: Unrealistic energy and materials requirement for direct air capture in deep mitigation pathways. Nat. Commun. , 11(1) , 3287, doi:10.1038/s41467-020-17203-7.
Chaudhary, A., D.I. Gustafson, and A. Mathys, 2018: Multi-indicator sustainability assessment of global food systems. Nat. Commun. , 9(1) , 848, doi:10.1038/s41467-018-03308-7.
Chen, C. and M. Tavoni, 2013: Direct air capture of CO2 and climate stabilization: A model based assessment. Clim. Change, 118(1) , 59–72, doi:10.1007/s10584-013-0714-7.
Chen, C., A. Chaudhary, and A. Mathys, 2019: Dietary Change Scenarios and Implications for Environmental, Nutrition, Human Health and Economic Dimensions of Food Sustainability. Nutrients, 11(4) , 856, doi:10.3390/nu11040856.
Chen, D., E.C. Jaenicke, and R.J. Volpe, 2016: Food Environments and Obesity: Household Diet Expenditure Versus Food Deserts. Am. J. Public Health, 106(5) , 881–888, doi:10.2105/AJPH.2016.303048.
Chen, G., R.P. Powers, L.M.T. de Carvalho, and B. Mora, 2015: Spatiotemporal patterns of tropical deforestation and forest degradation in response to the operation of the Tucuruí hydroelectric dam in the Amazon basin. Appl. Geogr. , 63, 1–8, doi.org/10.1016/j.apgeog.2015.06.001.
Chen, H., D. Zhou, G. Luo, S. Zhang, and J. Chen, 2015: Macroalgae for biofuels production: Progress and perspectives. Renew. Sustain. Energy Rev. , 47, 427–437, doi:10.1016/j.rser.2015.03.086.
Cheng, W., A. Appolloni, A. D’Amato, and Q. Zhu, 2018: Green Public Procurement, missing concepts and future trends – A critical review. J. Clean. Prod. , 176, 770–784, doi:10.1016/j.jclepro.2017.12.027.
Cherubin, M.R. et al., 2018: Crop residue harvest for bioenergy production and its implications on soil functioning and plant growth: A review. Sci. Agric. , 75, 255–272, https://doi.org/10.1590/1678-992X-2016-0459
Choi, D.Y., T.W. Wittig, and B.M. Kluever, 2020: An evaluation of bird and bat mortality at wind turbines in the Northeastern United States. PLoS One, 15(8) , e0238034.
Chomba, S., F. Sinclair, P. Savadogo, M. Bourne, and M. Lohbeck, 2020: Opportunities and Constraints for Using Farmer Managed Natural Regeneration for Land Restoration in Sub-Saharan Africa. Front. For. Glob. Change, 0, 122, doi:10.3389/FFGC.2020.571679.
Chriki, S., and J.F. Hocquette, 2020: The Myth of Cultured Meat: A Review. Front. Nutr. , 7 (February), 1–9, doi:10.3389/fnut.2020.00007.
Christen, B. and T. Dalgaard, 2013: Buffers for biomass production in temperate European agriculture: A review and synthesis on function, ecosystem services and implementation. Biomass and Bioenergy, 55, 53–67, doi:10.1016/j.biombioe.2012.09.053.
Churkina, G. et al., 2020: Buildings as a global carbon sink. Nat. Sustain. , 3, 269–276, doi:10.1038/s41893-019-0462-4.
Cialdini, R.B. and R.P. Jacobson, 2021: Influences of social norms on climate change-related behaviors. Curr. Opin. Behav. Sci. , 42, 1–8, doi:10.1016/j.cobeha.2021.01.005.
Cipolla, G., S. Calabrese, L.V. Noto, and A. Porporato, 2021: The role of hydrology on enhanced weathering for carbon sequestration II. From hydroclimatic scenarios to carbon-sequestration efficiencies. Adv. Water Resour. , 154, 103949, doi:10.1016/j.advwatres.2021.103949.
CIRAIG, 2015: Circular Economy: a critical literature review of concepts. International Reference Centre for the Life Cycle of Products, Processes and Services (CIRAIG), Montréal, QC, Canada, 53 pp.
Clapp, J., 2017: The trade-ification of the food sustainability agenda. J. Peasant Stud. , 44(2) , 335–353, doi:10.1080/03066150.2016.1250077.
Clapp, J., 2019: The rise of financial investment and common ownership in global agrifood firms. Rev. Int. Polit. Econ. , 26(4) , 604–629, doi:10.1080/09692290.2019.1597755.
Clark, M. and D. Tilman, 2017: Comparative analysis of environmental impacts of agricultural production systems, agricultural input efficiency, and food choice. Environ. Res. Lett. , 12(6) , 064016, doi:10.1088/1748-9326/aa6cd5.
Clark, M., J. Hill, and D. Tilman, 2018: The Diet, Health, and Environment Trilemma. Annu. Rev. Environ. Resour. , 43(1) , 109–134, doi:10.1146/annurev-environ-102017-025957.
Clark, M.A., M. Springmann, J. Hill, and D. Tilman, 2019: Multiple health and environmental impacts of foods. Proc. Natl. Acad. Sci. , 116(46) , 23357–23362, doi:10.1073/pnas.1906908116.
Clark, M.A. et al., 2020: Global food system emissions could preclude achieving the 1.5° and 2°C climate change targets. Science, 370(6517) , 705–708, doi:10.1126/science.aba7357.
Clery, D.S. et al., 2021: Bringing greenhouse gas removal down to earth: Stakeholder supply chain appraisals reveal complex challenges. Glob. Environ. Change, 71, 102369, doi:10.1016/j.gloenvcha.2021.102369.
Climate Change Committee, 2021: Progress in reducing emissions: 2021 Report to Parliament . Climate Change Committee, London, UK, 223 pp. www.theccc.org.uk/publication/2021-progress-report-to-parliament/.
Clune, S., E. Crossin, and K. Verghese, 2017: Systematic review of greenhouse gas emissions for different fresh food categories. J. Clean. Prod. , 140, 766–783, doi:10.1016/j.jclepro.2016.04.082.
COAG Energy Council, 2019: Austrialia’s National Hydrogen Strategy. Commonwealth of Australia, 136 pp.
Coe, R., F. Sinclair, and E. Barrios, 2014: Scaling up agroforestry requires research ‘in’ rather than ‘for’ development. Curr. Opin. Environ. Sustain. , 6(1) , 73–77, doi:10.1016/j.cosust.2013.10.013.
Coelho, P.M., B. Corona, R. ten Klooster, and E. Worrell, 2020: Sustainability of reusable packaging–Current situation and trends. Resour. Conserv. Recycl. X, 6 (March), 100037, doi:10.1016/j.rcrx.2020.100037.
Cohen, B., E. Tyler, and M. Torres Gunfaus, 2017: Lessons from co-impacts assessment under the Mitigation Action Plans and Scenarios (MAPS) Programme. Clim. Policy, 17(8) , 1065–1075, doi:10.1080/14693062.2016.1222258.
Cohen, B. et al., 2019: Multi-criteria decision analysis in policy-making for climate mitigation and development. Clim. Dev. , 11(3) , 212–222, doi:10.1080/17565529.2018.1445612.
Cohen, B., A. Cowie, M. Babiker, A. Leip, and P. Smith, 2021: Co-benefits and trade-offs of climate change mitigation actions and the Sustainable Development Goals. Sustain. Prod. Consum. , 26, 805–813, doi:10.1016/j.spc.2020.12.034.
Colvin, R.M. et al., 2020: Learning from the Climate Change Debate to Avoid Polarisation on Negative Emissions. Environ. Commun. , 14(1) , 23–35, doi:10.1080/17524032.2019.1630463.
Conijn, J.G., P.S. Bindraban, J.J. Schröder, and R.E.E. Jongschaap, 2018: Can our global food system meet food demand within planetary boundaries?Agric. Ecosyst. Environ. , 251, 244–256, doi:10.1016/j.agee.2017.06.001.
Cook, A.S.C. P., E.M. Humphreys, F. Bennet, E.A. Masden, and N.H.K. Burton, 2018: Quantifying avian avoidance of offshore wind turbines: Current evidence and key knowledge gaps. Mar. Environ. Res. , 140, 278–288, doi.org/10.1016/j.marenvres.2018.06.017.
Cool Food, 2020: The Cool Food Pledge. https://coolfood.org/pledge/ (Accessed December 1, 2020).
Coppes, J. et al., 2020: The impact of wind energy facilities on grouse: a systematic review. J. Ornithol. , 161(1) , 1–15, doi:10.1007/s10336-019-01696-1.
Córdova, R., N.J. Hogarth, and M. Kanninen, 2019: Mountain Farming Systems’ Exposure and Sensitivity to Climate Change and Variability: Agroforestry and Conventional Agriculture Systems Compared in Ecuador’s Indigenous Territory of Kayambi People. Sustain. , 11(9) , doi:10.3390/su11092623.
Cornelsen, L., R. Green, A. Dangour, and R. Smith, 2015: Why fat taxes won’t make us thin. J. Public Heal. (United Kingdom) , 37(1) , 18–23, doi:10.1093/pubmed/fdu032.
Correa, D.F. et al., 2019: Towards the implementation of sustainable biofuel production systems. Renew. Sustain. Energy Rev. , 107, 250–263, doi:10.1016/j.rser.2019.03.005.
Corvalán, C., M. Reyes, M.L. Garmendia, and R. Uauy, 2019: Structural responses to the obesity and non‐communicable diseases epidemic: Update on the Chilean law of food labelling and advertising. Obes. Rev. , 20(3) , 367–374, doi:10.1111/obr.12802.
Cossel, M. Von et al., 2019: Prospects of Bioenergy Cropping Systems for A More Social-Ecologically Sound Bioeconomy. Agron. 2019, Vol. 9, Page 605, 9(10) , 605, doi:10.3390/AGRONOMY9100605.
Costa Leite, J., S. Caldeira, B. Watzl, and J. Wollgast, 2020: Healthy low nitrogen footprint diets. Glob. Food Sec. , 24, doi:10.1016/j.gfs.2019.100342.
Costinot, A., D. Donaldson, and C. Smith, 2016: Evolving Comparative Advantage and the Impact of Climate Change in Agricultural Markets: Evidence from 1.7 Million Fields around the World. J. Polit. Econ. , 124(1) , 205–248, doi:10.1086/684719.
Cottrell, R.S. et al., 2019: Food production shocks across land and sea. Nat. Sustain. , 2(2) , doi:10.1038/s41893-018-0210-1.
Coulomb, R. and F. Henriet, 2018: The Grey Paradox: How fossil-fuel owners can benefit from carbon taxation. J. Environ. Econ. Manage. , 87, 206–223, doi:10.1016/j.jeem.2017.07.001.
Cowie, A., 2020a: Guidelines for Land Degradation Neutrality: A report prepared for stapgethe Scientific and Technical Advisory Panel of the Global Environment Facility. Washington DC, USA, 60 pp. https://catalogue.unccd.int/1474_LDN_Technical_Report_web_version.pdf .
Cowie, A.L., 2020b: Bioenergy in the circular economy. In: Handbook of the Circular Economy, [Brandão, M., Lazarevic, D., and Finnveden, G. (eds.)] Edward Elgar Publishing, Cheltenham, UK, pp. 382–395.
Cowie, A.L. et al., 2018: Land in balance: The scientific conceptual framework for Land Degradation Neutrality. Environ. Sci. Policy, 79, 25–35, doi:10.1016/j.envsci.2017.10.011.
Cowie, A.L. et al., 2021: Applying a science-based systems perspective to dispel misconceptions about climate effects of forest bioenergy. GCB Bioenergy, 13(8) , 1210–1231, doi:10.1111/GCBB.12844.
Cox, E. and N.R. Edwards, 2019: Beyond carbon pricing: policy levers for negative emissions technologies. Clim. Policy, 19(9) , 1144–1156, doi:10.1080/14693062.2019.1634509.
Cox, E., E. Spence, and N. Pidgeon, 2020a: Public perceptions of carbon dioxide removal in the United States and the United Kingdom. Nat. Clim. Change, 10(8) , 744–749, doi:10.1038/s41558-020-0823-z.
Cox, E., E. Spence, and N. Pidgeon, 2020b: Incumbency, Trust and the Monsanto Effect: Stakeholder Discourses on Greenhouse Gas Removal. Environ. Values, 29(2) , 197–220, doi:10.3197/096327119X15678473650947.
Creutzig, F. et al., 2015: Bioenergy and climate change mitigation: An assessment. GCB Bioenergy, 7(5) , 916–944, doi:10.1111/gcbb.12205.
Creutzig, F. et al., 2019: The mutual dependence of negative emission technologies and energy systems. Energy Environ. Sci. , 12(6) , 1805–1817, doi:10.1039/C8EE03682A. Crimarco, A. et al., 2020: A randomized crossover trial on the effect of plant-based compared with animal-based meat on trimethylamine-N-oxide and cardiovascular disease risk factors in generally healthy adults: Study with Appetizing Plantfood-Meat Eating Alternative Trial (SWAP-MEAT). Am. J. Clin. Nutr. , 112(5) , 1188–1199, doi:10.1093/ajcn/nqaa203.
Crippa, M. et al., 2019: Fossil CO2and GHG emissions of all world countries - 2019 Report . Publications Office of the European Union, Luxembourg, 251 pp.
Crippa, M. et al., 2021a: EDGAR v6.0 Greenhouse Gas Emissions.
Crippa, M., E. Solazzo, D. Guizzardi, F. Monforti-Ferrario, and A. Leip, 2021b: Food systems are responsible for a third of global anthropogenic GHG emissions. Nat. Food,. 2, 198–209, https://www.nature.com/articles/s43016-021-00225-9.
Cripps, G., S. Widdicombe, J. Spicer, and H. Findlay, 2013: Biological impacts of enhanced alkalinity in Carcinus maenas. Mar. Pollut. Bull. , 71(1–2) , 190–198, doi:10.1016/j.marpolbul.2013.03.015.
Cristea, A., D. Hummels, L. Puzzello, and M. Avetisyan, 2013: Trade and the greenhouse gas emissions from international freight transport. J. Environ. Econ. Manage. , 65(1) , 153–173, doi:10.1016/j.jeem.2012.06.002.
Cubins, J.A. et al., 2019: Management of pennycress as a winter annual cash cover crop. A review. Agron. Sustain. Dev. , 39(5) , 1–11, doi:10.1007/S13593-019-0592-0.
Cunningham, S.C. et al., 2015: Balancing the environmental benefits of reforestation in agricultural regions. Perspect. Plant Ecol. Evol. Syst. , 17(4) , 301–317, doi:10.1016/j.ppees.2015.06.001.
Curtain, F. and S. Grafenauer, 2019: Plant-Based Meat Substitutes in the Flexitarian Age: An Audit of Products on Supermarket Shelves. Nutrients, 11(11) , 2603, doi:10.3390/nu11112603.
Curtis, P.G., C.M. Slay, N.L. Harris, A. Tyukavina, and M.C. Hansen, 2018: Classifying drivers of global forest loss. Science, 361(6407) , 1108–1111, doi:10.1126/science.aau3445.
Czyrnek-Delêtre, M.M., B.M. Smyth, and J.D. Murphy, 2017: Beyond carbon and energy: The challenge in setting guidelines for life cycle assessment of biofuel systems. Renew. Energy, 105, 436–448, doi:10.1016/J.RENENE.2016.11.043.
D’Annolfo, R., B. Gemmill-Herren, B. Graeub, and L.A. Garibaldi, 2017: A review of social and economic performance of agroecology. Int. J. Agric. Sustain. , 15(6) , doi:10.1080/14735903.2017.1398123.
D’Odorico, P. et al., 2018: The Global Food-Energy-Water Nexus. Rev. Geophys. , 56(3) , 456–531, doi:10.1029/2017RG000591.
Daggash, H.A. et al., 2018: Closing the carbon cycle to maximise climate change mitigation: power-to-methanol vs. power-to-direct air capture. Sustain. Energy Fuels, 2(6) , 1153–1169, doi:10.1039/C8SE00061A. Dagnachew, A.G., P.L. Lucas, A.F. Hof, and D.P. van Vuuren, 2018: Trade-offs and synergies between universal electricity access and climate change mitigation in Sub-Saharan Africa. Energy Policy, 114, 355–366, doi:10.1016/j.enpol.2017.12.023.
Daioglou, V., J.C. Doelman, B. Wicke, A. Faaij, and D.P. van Vuuren, 2019: Integrated assessment of biomass supply and demand in climate change mitigation scenarios. Glob. Environ. Change, 54, 88–101, doi:10.1016/j.gloenvcha.2018.11.012.
Damerau, K., A.G. Patt, and O.P.R. van Vliet, 2016: Water saving potentials and possible trade-offs for future food and energy supply. Glob. Environ. Change, 39, 15–25, doi:10.1016/j.gloenvcha.2016.03.014.
Dasgupta, P., 2021: The Economics of Biodiversity: The Dasgupta Review. HM Treasury, London, UK, 610 pp. https://www.gov.uk/government/publications/final-report-the-economics-of-biodiversity-the-dasgupta-review (Accessed August 24, 2021).
Dauber, J. and S. Miyake, 2016: To integrate or to segregate food crop and energy crop cultivation at the landscape scale? Perspectives on biodiversity conservation in agriculture in Europe. Energy. Sustain. Soc. , 6 (1), 25, doi:10.1186/s13705-016-0089-5.
Davis, S.C. et al., 2013: Management swing potential for bioenergy crops. GCB Bioenergy, 5 (6), 623–638, doi:10.1111/gcbb.12042.
Davis, S.J., G.P. Peters, and K. Caldeira, 2011: The supply chain of CO2 emissions. Proc. Natl. Acad. Sci. , 108(45) , 18554–18559, doi:10.1073/pnas.1107409108.
De Boer, I.J.M. and M.K. Van Ittersum, 2018: Circularity in agricultural production. Wageningen University & Research, Wageningen, Netherlands, https://edepot.wur.nl/470625.
de Boer, J., H. Aiking, J. De Boer, and H. Aiking, 2018: Prospects for pro-environmental protein consumption in Europe: Cultural, culinary, economic and psychological factors. Appetite, 121, 29–40, doi:10.1016/j.appet.2017.10.042.
De Castro, C., M. Mediavilla, L.J. Miguel, and F. Frechoso, 2013: Global solar electric potential: A review of their technical and sustainable limits. Renew. Sustain. Energy Rev. , 28, 824–835, doi:10.1016/J.RSER.2013.08.040.
de Coninck, H., A. Revi, M. Babiker, P. Bertoldi, M. Buckeridge, A. Cartwright, W. Dong, J. Ford, S. Fuss, J.-C. Hourcade, D. Ley, R. Mechler, P. Newman, A. Revokatova, S. Schultz, L. Steg, and T. Sugiyama, 2018: Strengthening and implementing the global response. In: Global warming of 1.5°C. An IPCC Special Report on the impacts of global warming of 1.5°C above pre-industrial levels and related global greenhouse gas emission pathways, in the context of strengthening the global response to the threat of climate change[Masson-Delmotte, V., P. Zhai, H.-O. Pörtner, D. Roberts, J. Skea, P.R. Shukla, A. Pirani, W. Moufouma-Okia, C. Péan, R. Pidcock, S. Connors, J.B.R. Matthews, Y. Chen, X. Zhou, M.I. Gomis, E. Lonnoy, T. Maycock, M. Tignor, and T. Waterfield (eds.)], Cambridge University Press, Cambridge, UK, and New York, NY, USA, pp. 313–443.
de Jong, J., C. Akselsson, G. Egnell, S. Löfgren, and B.A. Olsson, 2017: Realizing the energy potential of forest biomass in Sweden – How much is environmentally sustainable?For. Ecol. Manage. , 383, 3–16, doi:10.1016/J.FORECO.2016.06.028.
de Lannoy, C.F. et al., 2018: Indirect ocean capture of atmospheric CO2: Part I. Prototype of a negative emissions technology. Int. J. Greenh. Gas Control, 70, 243–253, doi:10.1016/J.IJGGC.2017.10.007.
De Oliveira Garcia, W. et al., 2020: Impacts of enhanced weathering on biomass production for negative emission technologies and soil hydrology. Biogeosciences, 17(7) , 2107–2133, doi:10.5194/BG-17-2107-2020.
Delaney, A. et al., 2018: Governance of food systems across scales in times of social-ecological change: a review of indicators. Food Secur. , 10(2) , 287–310, doi:10.1007/s12571-018-0770-y.
Delcour, I., P. Spanoghe, and M. Uyttendaele, 2015: Literature review: Impact of climate change on pesticide use. Food Res. Int. , 68, 7–15, doi.org/10.1016/j.foodres.2014.09.030.
Deryabina, T.G. et al., 2015: Long-term census data reveal abundant wildlife populations at Chernobyl. Curr. Biol. , 25(19) , R824–R826, doi.org/10.1016/j.cub.2015.08.017.
Deutz, S. and A. Bardow, 2021: Life-cycle assessment of an industrial direct air capture process based on temperature–vacuum swing adsorption. Nat. Energy, 6(2) , 203–213, doi:10.1038/s41560-020-00771-9.
DFO, 2010: Ocean Fertilization: Mitigating environmental impacts of future scientific research. DFO Canadian Science Advisory Secretarat, Ottawa, Canada, 14 pp.
Di Gregorio, M. et al., 2017: Climate policy integration in the land use sector: Mitigation, adaptation and sustainable development linkages. Environ. Sci. Policy, 67, 35–43, doi:10.1016/j.envsci.2016.11.004.
Dias, T.A. da C., E.E.S. Lora, D.M.Y. Maya, and O.A. del Olmo, 2021: Global potential assessment of available land for bioenergy projects in 2050 within food security limits. Land use policy, 105, 105346, doi:10.1016/J.LANDUSEPOL.2021.105346.
Diercks, G., H. Larsen, and F. Steward, 2019: Transformative innovation policy: Addressing variety in an emerging policy paradigm. Res. Policy, 48(4) , 880–894, doi:10.1016/j.respol.2018.10.028.
Digdaya, I.A. et al., 2020: A direct coupled electrochemical system for capture and conversion of CO2 from oceanwater. Nat. Commun. , 11(1) , 4412, doi:10.1038/s41467-020-18232-y.
Diniz Oliveira, T. et al., 2021: A mixed-effect model approach for assessing land-based mitigation in integrated assessment models: A regional perspective. Glob. Chang. Biol. , 27(19) , 4671–4685, doi:10.1111/gcb.15738.
Djomo, S.N. et al., 2017: Solving the multifunctionality dilemma in biorefineries with a novel hybrid mass–energy allocation method. GCB Bioenergy, 9(11) , 1674–1686, doi:10.1111/GCBB.12461.
Djomo, S.N. et al., 2020: Green proteins: An energy-efficient solution for increased self-sufficiency in protein in Europe. Biofuels, Bioprod. Biorefining, 14(3) , 605–619, doi:10.1002/BBB.2098.
Dodds, P.E. et al., 2015: Hydrogen and fuel cell technologies for heating: A review. Int. J. Hydrogen Energy, 40(5) , 2065–2083, doi:10.1016/j.ijhydene.2014.11.059.
Doelman, J.C. et al., 2018: Exploring SSP land-use dynamics using the IMAGE model: Regional and gridded scenarios of land-use change and land-based climate change mitigation. Glob. Environ. Change, 48, 119–135, doi:10.1016/j.gloenvcha.2017.11.014.
Doney, S.C., V.J. Fabry, R.A. Feely, and J.A. Kleypas, 2009: Ocean Acidification: The Other CO2Problem. Ann. Rev. Mar. Sci. , 1(1) , 169–192, doi:10.1146/annurev.marine.010908.163834.
Dooley, K. and S. Kartha, 2018: Land-based negative emissions: risks for climate mitigation and impacts on sustainable development. Int. Environ. Agreements Polit. Law Econ. , 18(1) , 79–98, doi:10.1007/s10784-017-9382-9.
Dooley, K., E. Harrould‐Kolieb, and A. Talberg, 2021: Carbon‐dioxide Removal and Biodiversity: A Threat Identification Framework. Glob. Policy, 12 (S1), 34–44, doi:10.1111/1758-5899.12828.
dos Santos, M.A. et al., 2017: Estimates of GHG emissions by hydroelectric reservoirs: The Brazilian case. Energy, 133, 99–107, doi:10.1016/j.energy.2017.05.082.
Doukas, H., A. Nikas, M. González-Eguino, I. Arto, and A. Anger-Kraavi, 2018: From Integrated to Integrative: Delivering on the Paris Agreement. Sustainability, 10(7) , 2299, doi:10.3390/su10072299.
Drews, M., M.A.D. Larsen, and J.G. Peña Balderrama, 2020: Projected water usage and land-use-change emissions from biomass production (2015–2050). Energy Strateg. Rev. , 29, 100487, doi:10.1016/J.ESR.2020.100487.
Dries, L., T. Reardon, and J.F.M. Swinnen, 2004: The rapid rise of supermarkets in Central and Eastern Europe: Implications for the agrifood sector and rural development. Dev. Policy Rev. , 22(5) , 525–556, doi:10.1111/j.1467-7679.2004.00264.x.
Duarte, C.M., I.J. Losada, I.E. Hendriks, I. Mazarrasa, and N. Marbà, 2013: The role of coastal plant communities for climate change mitigation and adaptation. Nat. Clim. Change, 3(11) , 961–968, doi:10.1038/nclimate1970.
Duarte, C.M., J. Wu, X. Xiao, A. Bruhn, and D. Krause-Jensen, 2017: Can Seaweed Farming Play a Role in Climate Change Mitigation and Adaptation?Front. Mar. Sci. , 4, 100, doi:10.3389/fmars.2017.00100.
Duchelle, A.E. et al., 2017: Balancing carrots and sticks in REDD+: implications for social safeguards. Ecol. Soc. , 22(3) , art2, doi:10.5751/ES-09334-220302.
Dugan, A.J. et al., 2018: A systems approach to assess climate change mitigation options in landscapes of the United States forest sector. Carbon Balance Manag. , 13(1) , 13, doi:10.1186/s13021-018-0100-x.
Duncan, J., 2015: “Greening” global food governance. Can. Food Stud. / La Rev. Can. des études sur l’alimentation, 2(2) , 335, doi:10.15353/cfs-rcea.v2i2.104.
Dupont, E., R. Koppelaar, and H. Jeanmart, 2020: Global available solar energy under physical and energy return on investment constraints. Appl. Energy, 257, 113968, doi:10.1016/J.APENERGY.2019.113968.
Eakin, H., X. Rueda, and A. Mahanti, 2017: Transforming governance in telecoupled food systems. Ecol. Soc. , 22(4) , art32, doi:10.5751/ES-09831-220432.
Eales, J. et al., 2018: What is the effect of prescribed burning in temperate and boreal forest on biodiversity, beyond pyrophilous and saproxylic species? A systematic review. Environ. Evid. , 7(1) , 19, doi:10.1186/s13750-018-0131-5.
EASAC, 2017: Opportunities and challenges for research on food and nutrition security and agriculture in Europe. EASAC policy report 34. German National Academy of Sciences, Halle (Saale), Germany.
EC, 2018: In-Depth Analysis in Support of the Commission Communication COM (2018) 773 “A Clean Planet for All.”, 393 pp.
ECDC, EFSA, and EMA, 2015: ECDC/EFSA/EMA first joint report on the integrated analysis of the consumption of antimicrobial agents and occurrence of antimicrobial resistance in bacteria from humans and food-producing animals. EFSA J. , 13(1) , 4006, doi:10.2903/j.efsa.2015.4006.
Eckerstorfer, M.F. et al., 2021: Biosafety of genome editing applications in plant breeding: Considerations for a focused case-specific risk assessment in the eu. BioTech, 10(3) , 1–14, doi:10.3390/biotech10030010.
Eckert, M., M. Kauffeld, and V. Siegismund, eds., 2021: Natural Refrigerants: Applications and Practical Guidelines. Vde Verlag GmbH, Berlin, Germany.
Edwards, D.P. et al., 2017: Climate change mitigation: potential benefits and pitfalls of enhanced rock weathering in tropical agriculture. Biol. Lett. , 13(4) , 20160715, doi:10.1098/rsbl.2016.0715.
EFSA, 2017: Scientific Opinion of the PPR Panel on the follow‐up of the findings of the External Scientific Report ‘Literature review of epidemiological studies linking exposure to pesticides and health effects.’EFSA J. , 15(10) , doi:10.2903/j.efsa.2017.5007.
Eisaman, M.D., 2020: Negative Emissions Technologies: The Tradeoffs of Air-Capture Economics. Joule, 4(3) , 516–520, doi:10.1016/J.JOULE.2020.02.007.
Eisaman, M.D. et al., 2012: CO2 extraction from seawater using bipolar membrane electrodialysis. Energy Environ. Sci. , 5(6) , 7346–7352, doi:10.1039/C2EE03393C. Eisaman, M.D. et al., 2018: Indirect ocean capture of atmospheric CO2: Part II. Understanding the cost of negative emissions. Int. J. Greenh. Gas Control, 70, 254–261, doi:10.1016/J.IJGGC.2018.02.020.
El Akkari, M., O. Réchauchère, A. Bispo, B. Gabrielle, and D. Makowski, 2018: A meta-analysis of the greenhouse gas abatement of bioenergy factoring in land use changes. Sci. Rep. , 8, doi:10.1038/s41598-018-26712-x.
El Bilali, H., 2019: Research on agro-food sustainability transitions: A systematic review of research themes and an analysis of research gaps. J. Clean. Prod. , 221, 353–364, doi:10.1016/j.jclepro.2019.02.232.
Elgaaied-Gambier, L., E. Monnot, and F. Reniou, 2018: Using descriptive norm appeals effectively to promote green behavior. J. Bus. Res. , 82, 179–191, doi:10.1016/j.jbusres.2017.09.032.
Ellison, D. et al., 2017: Trees, forests and water: Cool insights for a hot world. Glob. Environ. Change, 43, 51–61, doi:10.1016/j.gloenvcha.2017.01.002.
Emanuel, N. and H.K. Sandhu, 2019: Food Packaging Development: Recent Perspective. Journal of Thin Films, Coating Science Technology and Application, 6(3) , ISSN: 2455-3344
Eme, P., J. Douwes, N. Kim, S. Foliaki, and B. Burlingame, 2019: Review of Methodologies for Assessing Sustainable Diets and Potential for Development of Harmonised Indicators. Int. J. Environ. Res. Public Health, 16(7) , 1184, doi:10.3390/ijerph16071184.
Emmerling, J. et al., 2019: The role of the discount rate for emission pathways and negative emissions. Environ. Res. Lett. , 14(10) , doi:10.1088/1748-9326/ab3cc9.
England, M.I., L.C. Stringer, A.J. Dougill, and S. Afionis, 2018: How do sectoral policies support climate compatible development? An empirical analysis focusing on southern Africa. Environ. Sci. Policy, 79, 9–15, doi:10.1016/j.envsci.2017.10.009.
Englund, O. et al., 2020a: Beneficial land use change: Strategic expansion of new biomass plantations can reduce environmental impacts from EU agriculture. Glob. Environ. Change, 60, 101990, doi:10.1016/j.gloenvcha.2019.101990.
Englund, O. et al., 2020b: Multifunctional perennial production systems for bioenergy: performance and progress. Wiley Interdiscip. Rev. Energy Environ. , 9(5) , e375, doi:10.1002/WENE.375.
Englund, O. et al., 2021: Strategic deployment of riparian buffers and windbreaks in Europe can co-deliver biomass and environmental benefits. Commun. Earth Environ. 2021 21, 2(1) , 1–18, doi:10.1038/s43247-021-00247-y.
Erb, K.-H. et al., 2018: Unexpectedly large impact of forest management and grazing on global vegetation biomass. Nature, 553(7686) , 73–76, doi:10.1038/nature25138.
Ericksen, P.J., 2008: What Is the Vulnerability of a Food System to Global Environmental Change?Ecol. Soc. , 13(2) , art14, doi:10.5751/ES-02475-130214.
Ernstoff, A. et al., 2020: Towards win–win policies for healthy and sustainable diets in switzerland. Nutrients, 12(9) , 1–24, doi:10.3390/nu12092745.
EU, 2015: Regulation (EU) 2015/2283 of the European Parliament and of the Council of 25 November 2015 on novel foods, amending Regulation (EU) No 1169/2011 of the European Parliament and of the Council and repealing Regulation (EC) No 258/97 of the European Parliam. Off. J. Eur. Union, 327(258) , 1–22.
European Commission, 2018: Sustainable & circular bioeconomy, the European way Outcome report . Brussels, Belgium.
European Commission, J.R.C., 2019: Restrictions on marketing of food, non-alcoholic and alcoholic beverages to protect health. [Dataset] PID: doi:http://data.europa.eu/89h/a5798df4-da80-4576-9502-218d6c2fff19.
Ewing, R.C., R.A. Whittleston, and B.W.D. Yardley, 2016: Geological Disposal of Nuclear Waste: a Primer. Elements, 12(4) , 233–237, doi:10.2113/GSELEMENTS.12.4.233.
Exley, G., A. Armstrong, T. Page, and I.D. Jones, 2021: Floating photovoltaics could mitigate climate change impacts on water body temperature and stratification. Sol. Energy, 219, 24–33, doi:10.1016/J.SOLENER.2021.01.076.
Fajardy, M. and N. Mac Dowell, 2020: Recognizing the Value of Collaboration in Delivering Carbon Dioxide Removal. One Earth, 3(2) , 214–225, doi:10.1016/j.oneear.2020.07.014.
Fajardy, M., P. Patrizio, H.A. Daggash, and N. Mac Dowell, 2019: Negative Emissions: Priorities for Research and Policy Design. Front. Clim. , 1, 6, doi:10.3389/fclim.2019.00006.
Falck, W.E., 2015: Radioactive and other environmental contamination from uranium mining and milling. In: Environmental Remediation and Restoration of Contaminated Nuclear and Norm Sites[van Velzen, L. ed.)], pp 3–34, doi:10.1016/B978-1-78242-231-0.00001-6.
Falconer, A., C. Parker, P. Keenlyside, A. Dontenville, and J. Wilkinson, 2015: Three tools to unlock finance for land-use mitigation and adaptation. Climate Focus and Climate Policy Initiative, 41 pp. https://climatepolicyinitiative.org/publication/three-tools-to-unlock-finance-for-land-use-mitigation-and-adaptation/ (Accessed December 3, 2019).
Fan, W. et al., 2020: A sea trial of enhancing carbon removal from Chinese coastal waters by stimulating seaweed cultivation through artificial upwelling. Appl. Ocean Res. , 101, 102260, doi:10.1016/J.APOR.2020.102260.
Fanzo, J., 2017: From big to small: the significance of smallholder farms in the global food system. Lancet Planet. Heal. , 1(1) , e15--e16, doi:10.1016/S2542-5196(17)30011-6.
Fanzo, J. et al., 2020: The Food Systems Dashboard is a new tool to inform better food policy. Nat. Food, 1(5) , 243–246, doi:10.1038/s43016-020-0077-y.
FAO, 2011: “Energy-Smart” Food for People Climate- Issue Paper. Food and Agriculture Organization of the United Nations, Rome, Italy, 78 pp.
FAO, 2012: Voluntary Guidelines on the Responsible Governance of Tenure of Land, Fisheries and Forests in the Context of National Food Security. Food and Agriculture Organization of the United Nations, Rome, Italy, 77 pp.
FAO, 2018a: Sustainable food systems: Concept and framework. Food and Agriculture Organization of the United Nations, Rome, Italy, http://www.fao.org/3/ca2079en/CA2079EN.pdf .
FAO, 2018b: The future of food and agriculture: Alternative pathways to 2050. Food and Agriculture Organization of the United Nations, Rome, Italy, 228 pp.
FAO, 2019 a: The State of Food and Agriculture 2019. Moving forward on food loss and waste reduction. Food and Agriculture Organization of the United Nations, Rome, Italy.
FAO, 2019 b: Climate-smart agriculture and the Sustainable Development Goals: Mapping interlinkages, synergies and trade-offs and guidelines for integrated implementation. Food and Agriculture Organization of the United Nations, Rome, Italy, 144 pp. http://www.fao.org/climate-smart-agriculture/resources/publications/en/.
FAO, 2020: Climate change: Unpacking the burden on food safety. Food and Agriculture Organization of the United Nations,, Rome, Italy, 1–176 pp.
FAO, 2021: The share of food systems in total greenhouse gas emissions. Global, regional and country trends. FAOSTAT Analytical Brief. Food and Agriculture Organization of the United Nations, Rome, Italy,
FAO, and WHO, 2019: Sustainable healthy diets - Guiding principles. Food and Agriculture Organization of the United Nations, Rome, Italy.
FAO, IFAD, UNICEF, WFP, and WHO, 2019: The state of food security and nutrition in the world. Safeguarding against economic slowdwns. Food and Agriculture Organization of the United Nations, Rome, Italy, 202 pp.
FAO, IFAD, UNICEF, WFP, and WHO, 2020: The State of Food Security and Nutrition in the World 2020. Transforming food systems for affordable healthy diets. Food and Agriculture Organization of the United Nations, Rome, Italy.
Fardet, A. and E. Rock, 2019: Ultra-processed foods: A new holistic paradigm?Trends Food Sci. Technol. , 93 (February), 174–184, doi:10.1016/j.tifs.2019.09.016.
Farfan, J., A. Lohrmann, and C. Breyer, 2019: Integration of greenhouse agriculture to the energy infrastructure as an alimentary solution. Renew. Sustain. Energy Rev. , 110 (May), 368–377, doi:10.1016/j.rser.2019.04.084.
Farhadi, S. and R. Ovchinnikov, 2018: The relationship between nutrition and infectious diseases: A review. Biomed. Biotechnol. Res. J. , 2(3) , 168, doi:10.4103/bbrj.bbrj_69_18.
Farley, K.A., E.G. Jobbagy, and R.B. Jackson, 2005: Effects of afforestation on water yield: a global synthesis with implications for policy. Glob. Chang. Biol. , 11(10) , 1565–1576, doi:10.1111/j.1365-2486.2005.01011.x.
Farrington, P. and R.B. Salama, 1996: Controlling dryland salinity by planting trees in the best hydrogeological setting. L. Degrad. Dev. , 7(3) , 183–204, doi:10.1002/(SICI)1099-145X(199609)7:3<183::AID-LDR221>3.0.CO;2-Y.
Fasihi, M., O. Efimova, and C. Breyer, 2019: Techno-economic assessment of CO2 direct air capture plants. J. Clean. Prod. , 224, 957–980, doi:10.1016/j.jclepro.2019.03.086.
Fasolin, L.H. et al., 2019: Emergent food proteins – Towards sustainability, health and innovation. Food Res. Int. , 125 (July), 108586, doi:10.1016/j.foodres.2019.108586.
Favero, A., A. Daigneault, and B. Sohngen, 2020: Forests: Carbon sequestration, biomass energy, or both?Sci. Adv. , 6(13) , doi:10.1126/sciadv.aay6792.
Favretto, N. et al., 2020: Delivering Climate-Development Co-Benefits through Multi-Stakeholder Forestry Projects in Madagascar: Opportunities and Challenges. Land, 9(5) , 157, doi:10.3390/LAND9050157.
FCH, 2019: Hydrogen Roadmap Europe. Fuel Cells and Hydrogen 2 Joint Undertaking, Luxembourg, 70 pp.
Fellmann, T. et al., 2018: Major challenges of integrating agriculture into climate change mitigation policy frameworks. Mitig. Adapt. Strateg. Glob. Change, 23(3) , 451–468, doi:10.1007/s11027-017-9743-2.
Femeena, P. V, K.P. Sudheer, R. Cibin, and I. Chaubey, 2018: Spatial optimization of cropping pattern for sustainable food and biofuel production with minimal downstream pollution. J. Environ. Manage. , 212, 198–209, doi:10.1016/j.jenvman.2018.01.060.
Feng, E.Y., D.P. Keller, W. Koeve, and A. Oschlies, 2016: Could artificial ocean alkalinization protect tropical coral ecosystems from ocean acidification?Environ. Res. Lett. , 11(7) , 074008, doi:10.1088/1748-9326/11/7/074008.
Fernández-Bellon, D., 2020: Limited accessibility and bias in wildlife-wind energy knowledge: A bilingual systematic review of a globally distributed bird group. Sci. Total Environ. , 737, 140238, doi.org/10.1016/j.scitotenv.2020.140238.
Ferrari, L., A. Cavaliere, E. De Marchi, and A. Banterle, 2019: Can nudging improve the environmental impact of food supply chain? A systematic review. Trends Food Sci. Technol. , 91 (April), 184–192, doi:10.1016/j.tifs.2019.07.004.
Ferrarini, A., P. Serra, M. Almagro, M. Trevisan, and S. Amaducci, 2017: Multiple ecosystem services provision and biomass logistics management in bioenergy buffers: A state-of-the-art review. Renew. Sustain. Energy Rev. , 73, 277–290, doi.org/10.1016/j.rser.2017.01.052.
Field, C.B., and K.J. Mach, 2017: Rightsizing carbon dioxide removal. Science, 356(6339) , 706–707, doi:10.1126/science.aam9726.
Finaret, A.B. and W.A. Masters, 2019: Beyond Calories: The New Economics of Nutrition. Annu. Rev. Resour. Econ. , 11(1) , 237–259, doi:10.1146/annurev-resource-100518-094053.
Finger, R., S.M. Swinton, N. El Benni, and A. Walter, 2019: Precision Farming at the Nexus of Agricultural Production and the Environment. Annu. Rev. Resour. Econ. , 11(1) , 313–335, doi:10.1146/annurev-resource-100518-093929.
Fiorini, M. et al., 2019: Institutional design of voluntary sustainability standards systems: Evidence from a new database. Dev. Policy Rev. , 37(S2) , O193–O212, doi:10.1111/dpr.12379.
Fischer, J. et al., 2007: Mind the sustainability gap. Trends Ecol. Evol. , 22(12) , 621–4, doi:10.1016/j.tree.2007.08.016.
Floater, G. et al., 2016: Co-benefits of urban climate action: A framework for cities. Economics of Green Cities Programme, LSE Cities, London School of Economics and Political Science, London, UK, 86 pp. http://eprints.lse.ac.uk/id/eprint/68876.
Folberth, C. et al., 2020: The global cropland-sparing potential of high-yield farming. Nat. Sustain. , 3(4) , 281–289, doi:10.1038/s41893-020-0505-x.
Folke, C. et al., 2019: Transnational corporations and the challenge of biosphere stewardship. Nat. Ecol. Evol. , 3(10) , 1396–1403, doi:10.1038/s41559-019-0978-z.
Forest Trends, 2014: Consumer goods and deforestation: An analysis of the extent and nature of illegality in forest conversation for agriculture and timber plantations, Washington, DC, USA.
Forster, J., N.E. Vaughan, C. Gough, I. Lorenzoni, and J. Chilvers, 2020: Mapping feasibilities of greenhouse gas removal: Key issues, gaps and opening up assessments. Glob. Environ. Change, 63, 102073, doi:10.1016/j.gloenvcha.2020.102073.
Foyer, C.H. et al., 2016: Neglecting legumes has compromised human health and sustainable food production. Nat. Plants, 2(8) , 1–10, doi:10.1038/NPLANTS.2016.112.
França, T. et al., 2009: Impact of malnutrition on immunity and infection. J. Venom. Anim. Toxins Incl. Trop. Dis. , 15(3) , 374–390, doi:10.1590/S1678-91992009000300003.
Frank, S. et al., 2017: Reducing greenhouse gas emissions in agriculture without compromising food security?Environ. Res. Lett. , 12(10) , 105004, doi:10.1088/1748-9326/aa8c83.
Freeman, O.E., L.A. Duguma, and P.A. Minang, 2015: Operationalizing the integrated landscape approach in practice. Ecol. Soc. , 20(1) , doi:10.5751/ES-07175-200124.
Fresán, U., M.A. Mejia, W.J. Craig, K. Jaceldo-Siegl, and J. Sabaté, 2019: Meat Analogs from Different Protein Sources: A Comparison of Their Sustainability and Nutritional Content. Sustainability, 11(12) , 3231, doi:10.3390/su11123231.
Fricko, O. et al., 2016: Energy sector water use implications of a 2°C climate policy. Environ. Res. Lett. , 11(3) , 034011, doi:10.1088/1748-9326/11/3/034011.
Fricko, O. et al., 2017: The marker quantification of the Shared Socioeconomic Pathway 2: A middle-of-the-road scenario for the 21st century. Glob. Environ. Change, 42, 251–267, doi:10.1016/j.gloenvcha.2016.06.004.
Fridahl, M., 2017: Socio-political prioritization of bioenergy with carbon capture and storage. Energy Policy, 104, 89–99, doi:10.1016/J.ENPOL.2017.01.050.
Fridahl, M., R. Bellamy, A. Hansson, and S. Haikola, 2020: Mapping Multi-Level Policy Incentives for Bioenergy With Carbon Capture and Storage in Sweden. Front. Clim. , 2, 25, doi:10.3389/fclim.2020.604787.
Friedmann, S.J., 2019: Engineered CO2 Removal, Climate Restoration, and Humility. Front. Clim. , 1, 3, doi:10.3389/fclim.2019.00003.
Fritsche, U.R. et al., 2017: Global Land Outlook Working Paper: Energy and Land Use. UNCCD and IRENA, Darmstadt, Germany, 60 pp.
Fritz, S. et al., 2013: Downgrading Recent Estimates of Land Available for Biofuel Production. Environ. Sci. Technol. , 47(3) , 1688–1694, 130128103203003, doi:10.1021/es303141h.
Froehlich, H.E., J.C. Afflerbach, M. Frazier, and B.S. Halpern, 2019: Blue Growth Potential to Mitigate Climate Change through Seaweed Offsetting. Curr. Biol. , 29(18) , 3087-3093.e3, doi:10.1016/j.cub.2019.07.041.
Froese, R., J. Schilling, Froehse, and Schilling, 2019: The Nexus of Climate Change, Land Use, and Conflicts. Curr. Clim. Chang. Reports, 5, 24–35, doi:10.1007/s40641-019-00122-1.
Frolova, M. et al., 2019: Effects of renewable energy on landscape in Europe: Comparison of hydro, wind, solar, bio-, geothermal and infrastructure energy landscapes. Hungarian Geogr. Bull. , 68(4) , 317–339, doi:10.15201/hungeobull.68.4.1.
Fuhrman, J., H. McJeon, S.C. Doney, W. Shobe, and A.F. Clarens, 2019: From Zero to Hero?: Why Integrated Assessment Modeling of Negative Emissions Technologies Is Hard and How We Can Do Better. Front. Clim. , 1, 11, doi:10.3389/fclim.2019.00011.
Fuhrman, J. et al., 2020: Food–energy–water implications of negative emissions technologies in a +1.5°C future. Nat. Clim. Change, 10(10) , 920–927, doi:10.1038/s41558-020-0876-z.
Fuhrman, J. et al., 2021a: The Role of Direct Air Capture and Negative Emissions Technologies in the Shared Socioeconomic Pathways towards +1.5°C and +2°C Futures. Environ. Res. Lett. , 16(11) , 114012, doi:10.1088/1748-9326/ac2db0.
Fuhrman, J. et al., 2021b: The role of negative emissions in meeting China’s 2060 carbon neutrality goal. Oxford Open Clim. Change, 1(1) , doi:10.1093/oxfclm/kgab004.
Fuhrman, J.A. and D.G. Capone, 1991: Possible biogeochemical consequences of ocean fertilization. Limnol. Oceanogr. , 36(8) , 1951–1959, doi:10.4319/lo.1991.36.8.1951.
Fujimori, S. et al., 2018: Inclusive climate change mitigation and food security policy under 1.5°C climate goal. Environ. Res. Lett. , 13(7) , doi:10.1088/1748-9326/aad0f7.
Fujimori, S. et al., 2019: A multi-model assessment of food security implications of climate change mitigation. Nat. Sustain. 2019 25, 2(5) , 386–396, doi:10.1038/s41893-019-0286-2.
Fuss, S. et al., 2018: Negative emissions - Part 2: Costs, potentials and side effects. Environ. Res. Lett. , 13(6) , 063002, doi:10.1088/1748-9326/aabf9f.
Fuss, S. et al., 2020: Moving toward Net-Zero Emissions Requires New Alliances for Carbon Dioxide Removal. One Earth, 3, 145–149, doi:10.1016/j.oneear.2020.08.002.
Fyson, C.L. and M.L. Jeffery, 2019: Ambiguity in the Land Use Component of Mitigation Contributions Toward the Paris Agreement Goals. Earth’s Futur. , 7(8) , 873–891, doi:10.1029/2019EF001190.
Gadzanku, S., H. Mirletz, N. Lee, J. Daw, and A. Warren, 2021: Benefits and Critical Knowledge Gaps in Determining the Role of Floating Photovoltaics in the Energy-Water-Food Nexus. Sustain. 2021, 13(8) , 4317, doi:10.3390/SU13084317.
Gajevic Sayegh, A., 2020: Moral duties, compliance and polycentric climate governance. Int. Environ. Agreements Polit. Law Econ. , 20(3) , 483–506, doi:10.1007/s10784-020-09494-4.
Galik, C.S., G.S. Latta, and C. Gambino, 2019: Piecemeal or combined? Assessing greenhouse gas mitigation spillovers in US forest and agriculture policy portfolios. Clim. Policy, 19(10) , 1270–1283, doi:10.1080/14693062.2019.1663719.
Gallo, M., L. Ferrara, A. Calogero, D. Montesano, and D. Naviglio, 2020: Relationships between food and diseases: What to know to ensure food safety. Food Res. Int. , 137 (January), 109414, doi:10.1016/j.foodres.2020.109414.
Gan, Y. et al., 2020: Research progress on coronavirus prevention and control in animal-source foods. J. Multidiscip. Healthc. , 13, 743–751, doi:10.2147/JMDH.S265059.
Gann, G.D. et al., 2019: International principles and standards for the practice of ecological restoration. Second edition. Restor. Ecol. , 27 (S1), S1–S46, doi:10.1111/rec.13035.
García-Freites, S., C. Gough, and M. Röder, 2021: The greenhouse gas removal potential of bioenergy with carbon capture and storage (BECCS) to support the UK’s net-zero emission target. Biomass and Bioenergy, 151, 106164, doi:10.1016/j.biombioe.2021.106164.
Garcia, M. and N. Berghout, 2019: Toward a common method of cost-review for carbon capture technologies in the industrial sector: cement and iron and steel plants. Int. J. Greenh. Gas Control, 87, 142–158, doi:10.1016/j.ijggc.2019.05.005.
Garg, K.K., L. Karlberg, S.P. Wani, and G. Berndes, 2011: Jatropha production on wastelands in India: opportunities and trade-offs for soil and water management at the watershed scale. Biofuels, Bioprod. Biorefining, 5(4) , 410–430, doi:10.1002/bbb.312.
Garibaldi, L.A. et al., 2016: Mutually beneficial pollinator diversity and crop yield outcomes in small and large farms. Science, 351(6271) , 388–391, doi:10.1126/science.aac7287.
Garnett, T., E. Röös, and D. Little, 2015: Lean, green, mean, obscene…? What is efficiency? And is it sustainable? Animal production and consumption reconsidered. Food Climate Research Network, University of Oxford, Oxford, UK, 48 pp.
Garofalo, C. et al., 2019: Current knowledge on the microbiota of edible insects intended for human consumption: A state-of-the-art review. Food Res. Int. , 125 (June), 108527, doi:10.1016/j.foodres.2019.108527.
Gattuso, J.-P. et al., 2018: Ocean solutions to address climate change and its effects on marine ecosystems. Front. Mar. Sci. , 5, 337, doi:10.3389/fmars.2018.00337.
Gattuso, J.-P., P. Williamson, C.M. Duarte, and A.K. Magnan, 2021: The Potential for Ocean-Based Climate Action: Negative Emissions Technologies and Beyond. Front. Clim. , 2, 37, doi:10.3389/fclim.2020.575716.
Gava, O. et al., 2018: A Reflection of the Use of the Life Cycle Assessment Tool for Agri-Food Sustainability. Sustainability, 11(1) , 71, doi:10.3390/su11010071.
GBD 2017 Diet Collaborators, 2018: Global, regional, and national comparative risk assessment of 84 behavioural, environmental and occupational, and metabolic risks or clusters of risks for 195 countries and territories, 1990–2017: a systematic analysis for the Global Burden of Disease Stu. Lancet , 392(10159) , 1923–1994, doi:10.1016/S0140-6736(18)32225-6.
GBD 2017 Diet Collaborators et al., 2019: Health effects of dietary risks in 195 countries, 1990–2017: a systematic analysis for the Global Burden of Disease Study 2017. Lancet , 393(10184) , 1958–1972, doi:10.1016/S0140-6736(19)30041-8.
Geden, O., 2016: The Paris Agreement and the inherent inconsistency of climate policymaking. Wiley Interdiscip. Rev. Clim. Change, 7(6) , 790–797, doi:10.1002/wcc.427.
Geden, O., G.P. Peters, and V. Scott, 2019: Targeting carbon dioxide removal in the European Union. Clim. Policy, 19(4) , 487–494, doi:10.1080/14693062.2018.1536600.
Geden, O., V. Scott, and J. Palmer, 2018: Integrating carbon dioxide removal into EU climate policy: Prospects for a paradigm shift. Wiley Interdiscip. Rev. Clim. Change, 9, 1–10, doi:10.1002/wcc.521.
Gentry, R.R. et al., 2020: Exploring the potential for marine aquaculture to contribute to ecosystem services. Rev. Aquac. , 12(2) , 499–512, doi:10.1111/raq.12328.
Gerhardt, C. et al., 2019: How Will Cultured Meat and Meat Alternatives Disrupt the Agricultural and Food Industry?A. T. Kearney, 20 pp.
Gerlagh, R., 2011: Too much oil. CESifo Econ. Stud. , 57(1) , 79–102, doi:10.1093/cesifo/ifq004.
GESAMP, 2019: High level review of a wide range of proposed marine geoengineering techniques. International Maritime Organization, London, UK, 144 pp.
Geyik, O., M. Hadjikakou, B. Karapinar, and B.A. Bryan, 2021: Does global food trade close the dietary nutrient gap for the world’s poorest nations?Glob. Food Sec. , 28 (December 2020), 100490, doi:10.1016/j.gfs.2021.100490.
Gheuens, J. and S. Oberthür, 2021: Eu climate and energy policy: How myopic is it?Polit. Gov. , 9(3) , 337–347, doi:10.17645/pag.v9i3.4320.
Ghosh, N. and C.K. Sen, 2019: The Promise of Dietary Supplements: Research Rigor and Marketing Claims. In: Nutrition and Enhanced Sports Performance, Elsevier, pp. 759–766.
Gillman, G.P., 1980: The Effect of Crushed Basalt Scoria on the Cation Exchange Properties of a Highly Weathered Soil. Soil Sci. Soc. Am. J. , 44(3) , 465–468, doi:10.2136/sssaj1980.03615995004400030005x.
Gillman, G.P., D.C. Burkett, and R.J. Coventry, 2001: A laboratory study of application of basalt dust to highly weathered soils: Effect on soil cation chemistry. Aust. J. Soil Res. , 39(4) , 799–811, doi:10.1071/SR00073.
Glenk, G. and S. Reichelstein, 2019: Economics of converting renewable power to hydrogen. Nat. Energy, 4(3) , 216–222, doi:10.1038/s41560-019-0326-1.
Global Alliance for the Future of Food, 2020: Systemic Solutions for Healthy Food Systems: A Guide to Government Action. Global Alliance for the Future of Food,.
Zimmermann A.W. et al., 2020: Techno-Economic Assessment Guidelines for CO2 Utilization. Front. Energy Res. 8(5) doi: 10.3389/fenrg.2020.00005
Global Panel on Agriculture and Food Systems for Nutrition, 2020: Future Food Systems: For people, our planet, and prosperit y. London, UK,.
Göbel, C., N. Langen, A. Blumenthal, P. Teitscheid, and G. Ritter, 2015: Cutting food waste through cooperation along the food supply chain. Sustainability, 7(2) , 1429–1445, doi:10.3390/su7021429.
Goggins, G., 2018: Developing a sustainable food strategy for large organizations: The importance of context in shaping procurement and consumption practices. Bus. Strateg. Environ. , 27(7) , 838–848, doi:10.1002/bse.2035.
Goggins, G. and H. Rau, 2016: Beyond calorie counting: Assessing the sustainability of food provided for public consumption. J. Clean. Prod. , 112, 257–266, doi:10.1016/j.jclepro.2015.06.035.
Goll, D.S. et al., 2021: Potential CO2 removal from enhanced weathering by ecosystem responses to powdered rock. Nat. Geosci. , 14(8) , 545–549, doi:10.1038/s41561-021-00798-x.
Gomez-Echeverri, L., 2018: Climate and development: Enhancing impact through stronger linkages in the implementation of the Paris Agreement and the Sustainable Development Goals (SDGs). Philos. Trans. R. Soc. A Math. Phys. Eng. Sci. , 376(2119) , doi:10.1098/rsta.2016.0444.
Gómez, C. and L. Gennaro Izzo, 2018: Increasing efficiency of crop production with LEDs. AIMS Agric. Food, 3(2) , 135–153, doi:10.3934/agrfood.2018.2.135.
Gómez, M.I. and K.D. Ricketts, 2013: Food value chain transformations in developing countries: Selected hypotheses on nutritional implications. Food Policy, 42(13) , 139–150, doi:10.1016/j.foodpol.2013.06.010.
González-Alzaga, B. et al., 2014: A systematic review of neurodevelopmental effects of prenatal and postnatal organophosphate pesticide exposure. Toxicol. Lett. , 230(2) , 104–21, doi:10.1016/j.toxlet.2013.11.019.
González, M.F. and T. Ilyina, 2016: Impacts of artificial ocean alkalinization on the carbon cycle and climate in Earth system simulations. Geophys. Res. Lett. , 43(12) , 6493–6502, doi:10.1002/2016GL068576.
González, M.F., T. Ilyina, S. Sonntag, and H. Schmidt, 2018: Enhanced Rates of Regional Warming and Ocean Acidification After Termination of Large-Scale Ocean Alkalinization. Geophys. Res. Lett. , 45(14) , 7120–7129, doi:10.1029/2018GL077847.
Gonzalez Sanchez, R., I. Kougias, M. Moner-Girona, F. Fahl, and A. Jäger-Waldau, 2021: Assessment of floating solar photovoltaics potential in existing hydropower reservoirs in Africa. Renew. Energy, 169, 687–699, doi:10.1016/J.RENENE.2021.01.041.
Göransson, L. and F. Johnsson, 2018: A comparison of variation management strategies for wind power integration in different electricity system contexts. Wind Energy, 21(10) , 837–854, doi:10.1002/WE.2198.
Gore, S., P. Renforth, and R. Perkins, 2019: The potential environmental response to increasing ocean alkalinity for negative emissions. Mitig. Adapt. Strateg. Glob. Change, 24(7) , 1191–1211, doi:10.1007/s11027-018-9830-z.
Gouel, C. and D. Laborde, 2021: The crucial role of domestic and international market-mediated adaptation to climate change. J. Environ. Econ. Manage. , 106, 102408, doi:10.1016/j.jeem.2020.102408.
Gough, C. and S. Mander, 2019: Beyond Social Acceptability: Applying Lessons from CCS Social Science to Support Deployment of BECCS. Curr. Sustain. Energy Reports, 6(4) , 116–123, doi:10.1007/s40518-019-00137-0.
Gouldson, A. et al., 2016: Cities and climate change mitigation: Economic opportunities and governance challenges in Asia. Cities, 54, 11–19, doi.org/10.1016/j.cities.2015.10.010.
Government of Finland, 2017: Government report on food policy: Food 2030 – Finland feeds us and the world. Helsinki, Finland, 42 pp.
Govorushko, S., 2019: Global status of insects as food and feed source: A review. Trends Food Sci. Technol. , 91 (July 2018), 436–445, doi:10.1016/j.tifs.2019.07.032.
GPRBA, 2019: New Perspectives on Results-Based Blended Finance for Cities: Innovative Finance Solutions for Climate-Smart Infrastructure. Global Partnership for Results-Based Approaches, Washington, DC, USA, 82 pp.
Graamans, L., E. Baeza, A. van den Dobbelsteen, I. Tsafaras, and C. Stanghellini, 2018: Plant factories versus greenhouses: Comparison of resource use efficiency. Agric. Syst. , 160 (July 2017), 31–43, doi:10.1016/j.agsy.2017.11.003.
Grant, N., A. Hawkes, S. Mittal, and A. Gambhir, 2021: The policy implications of an uncertain carbon dioxide removal potential. Joule, 5(10) , 2593–2605, doi:10.1016/j.joule.2021.09.004.
Grassi, G. et al., 2021: Critical adjustment of land mitigation pathways for assessing countries’ climate progress. Nat. Clim. Change, 11(5) , 425–434, doi:10.1038/s41558-021-01033-6.
Grebitus, C., B. Steiner, and M.M. Veeman, 2016: Paying for sustainability: A cross-cultural analysis of consumers’ valuations of food and non-food products labeled for carbon and water footprints. J. Behav. Exp. Econ. 63, 50–58, doi:10.1016/j.socec.2016.05.003.
Gren, I.M., E. Moberg, S. Säll, and E. Röös, 2019: Design of a climate tax on food consumption: Examples of tomatoes and beef in Sweden. J. Clean. Prod. , 211, 1576–1585, doi:10.1016/j.jclepro.2018.11.238.
Griffiths, N.A. et al., 2019: Environmental effects of short-rotation woody crops for bioenergy: What is and isn’t known. GCB Bioenergy, 11(4) , 554–572, doi:10.1111/GCBB.12536.
Griscom, B.W., R.C. Goodman, Z. Burivalova, and F.E. Putz, 2018: Carbon and Biodiversity Impacts of Intensive Versus Extensive Tropical Forestry. Conserv. Lett. , 11(1) , e12362, doi:10.1111/conl.12362.
Gronwald, M., N. Van Long, and L. Roepke, 2017: Simultaneous Supplies of Dirty Energy and Capacity Constrained Clean Energy: Is There a Green Paradox?Environ. Resour. Econ. , 68(1) , 47–64, doi:10.1007/s10640-017-0151-6.
Group of Chief Scientific Advisors, 2020: Towards a Sustainable Food System. European Commission, DG for Research and Innovation, Brussels, Belgium.
Gruber, N. et al., 2019: The oceanic sink for anthropogenic CO2 from 1994 to 2007. Science, 363(6432) , 1193–1199, doi:10.1126/science.aau5153.
Grubler, A. et al., 2018: A low energy demand scenario for meeting the 1.5°C target and sustainable development goals without negative emission technologies. Nat. Energy, 3(6) , 515–527, doi:10.1038/s41560-018-0172-6.
Grundnig, P.W. et al., 2006: Influence of air humidity on the suppression of fugitive dust by using a water-spraying system. China Particuology, 4(5) , 229–233, doi:10.1016/S1672-2515(07)60265-6.
Gullo, P., K. Tsamos, A. Hafner, Y. Ge, and S.A. Tassou, 2017: State-of-the-art technologies for transcritical R744 refrigeration systems – a theoretical assessment of energy advantages for European food retail industry. Energy Procedia, 123, 46–53, doi:10.1016/J.EGYPRO.2017.07.283.
Gunnarsson, I. et al., 2018: The rapid and cost-effective capture and subsurface mineral storage of carbon and sulfur at the CarbFix2 site. Int. J. Greenh. Gas Control, 79, 117–126, doi:10.1016/j.ijggc.2018.08.014.
Guntzer, F., C. Keller, and J.-D. Meunier, 2012: Benefits of plant silicon for crops: a review. Agron. Sustain. Dev. , 32(1) , 201–213, doi:10.1007/s13593-011-0039-8.
Gustafson, D.I. et al., 2016: Seven food system metrics of sustainable nutrition security. Sustainability, 8(3) , 196, doi:10.3390/su8030196.
Gustafson, D.I., M.S. Edge, T.S. Griffin, A.M. Kendall, and S.D. Kass, 2019: Growing Progress in the Evolving Science, Business, and Policy of Sustainable Nutrition. Curr. Dev. Nutr. , 3(6) , 1–5, doi:10.1093/cdn/nzz059.
Ha, S., T. Hale, and P. Ogden, 2016: Climate Finance in and between Developing Countries: An Emerging Opportunity to Build On. Glob. Policy, 7(1) , 102–108, doi:10.1111/1758-5899.12293.
Haas, J. et al., 2020: Floating photovoltaic plants: Ecological impacts versus hydropower operation flexibility. Energy Convers. Manag. , 206, 112414, doi:10.1016/j.enconman.2019.112414.
Haasnoot, M. et al., 2020: Defining the solution space to accelerate climate change adaptation. Reg. Environ. Change, 20(2) , doi:10.1007/s10113-020-01623-8.
Haberl, H. et al., 2013: Bioenergy: How much can we expect for 2050?Environ. Res. Lett. , 8(3) , doi:10.1088/1748-9326/8/3/031004.
Hadi, J. and G. Brightwell, 2021: Safety of alternative proteins: Technological, environmental and regulatory aspects of cultured meat, plant-based meat, insect protein and single-cell protein. Foods, 10(6) , doi:10.3390/foods10061226.
Hagenaars, L.L., P.P.T. Jeurissen, and N.S. Klazinga, 2017: The taxation of unhealthy energy-dense foods (EDFs) and sugar-sweetened beverages (SSBs): An overview of patterns observed in the policy content and policy context of 13 case studies. Health Policy (New. York) , 121(8) , 887–894, doi:10.1016/j.healthpol.2017.06.011.
Haider, G., D. Steffens, G. Moser, C. Müller, and C.I. Kammann, 2017: Biochar reduced nitrate leaching and improved soil moisture content without yield improvements in a four-year field study. Agric. Ecosyst. Environ. , 237, 80–94, doi:10.1016/j.agee.2016.12.019.
Halloran, A., N. Roos, J. Eilenberg, A. Cerutti, and S. Bruun, 2016: Life cycle assessment of edible insects for food protein: a review. Agron. Sustain. Dev. , 36(4) , 57, doi:10.1007/s13593-016-0392-8.
Hallström, E., J. Davis, A. Woodhouse, and U. Sonesson, 2018: Using dietary quality scores to assess sustainability of food products and human diets: A systematic review. Ecol. Indic. , 93 (September 2017), 219–230, doi:10.1016/j.ecolind.2018.04.071.
Hamelin, L., H.B. Møller, and U. Jørgensen, 2021: Harnessing the full potential of biomethane towards tomorrow’s bioeconomy: A national case study coupling sustainable agricultural intensification, emerging biogas technologies and energy system analysis. Renew. Sustain. Energy Rev. , 138, 110506, doi:10.1016/J.RSER.2020.110506.
Hamilton, I. et al., 2021: The public health implications of the Paris Agreement: a modelling study. Lancet Planet. Heal. , 5(2) , e74–e83, doi:10.1016/S2542-5196(20)30249-7.
Hamilton, S.E., and D.A. Friess, 2018: Global carbon stocks and potential emissions due to mangrove deforestation from 2000 to 2012. Nat. Clim. Change, 8(3) , 240–244, doi:10.1038/s41558-018-0090-4.
Han Weng, Z. et al., 2017: Biochar built soil carbon over a decade by stabilizing rhizodeposits. Nat. Clim. Change, 7(5) , 371–376, doi:10.1038/nclimate3276.
Hanna, R., A. Abdulla, Y. Xu, and D.G. Victor, 2021: Emergency deployment of direct air capture as a response to the climate crisis. Nat. Commun. , 12(1) , 368, doi:10.1038/s41467-020-20437-0.
Hansen, J.H., L. Hamelin, A. Taghizadeh-Toosi, J.E. Olesen, and H. Wenzel, 2020: Agricultural residues bioenergy potential that sustain soil carbon depends on energy conversion pathways. GCB Bioenergy, 12(11) , 1002–1013, doi:10.1111/GCBB.12733.
Hanssen, S.V. et al., 2019: Biomass residues as twenty-first century bioenergy feedstock—a comparison of eight integrated assessment models. Clim. Chang. 2019 1633, 163(3) , 1569–1586, doi:10.1007/S10584-019-02539-X. Hanssen, S. V et al., 2020: The climate change mitigation potential of bioenergy with carbon capture and storage. Nat. Clim. Change, 10(11) , 1023–1029, doi:10.1038/s41558-020-0885-y.
Hansson, A. et al., 2021: Biochar as multi-purpose sustainable technology: experiences from projects in Tanzania. Environ. Dev. Sustain. , 23(4) , 5182–5214, doi:10.1007/s10668-020-00809-8.
Haque, F., R.M. Santos, A. Dutta, M. Thimmanagari, and Y.W. Chiang, 2019: Co-Benefits of Wollastonite Weathering in Agriculture: CO2 Sequestration and Promoted Plant Growth. ACS Omega, 4(1) , 1425–1433, doi:10.1021/acsomega.8b02477.
Harmsen, J.H.M. et al., 2019: Long-term marginal abatement cost curves of non-CO2 greenhouse gases. Environ. Sci. Policy, 99, 136–149, doi:10.1016/j.envsci.2019.05.013.
Harris, Z.M., R. Spake, and G. Taylor, 2015: Land use change to bioenergy: A meta-analysis of soil carbon and GHG emissions. Biomass and Bioenergy, 82, 27–39, doi:10.1016/j.biombioe.2015.05.008.
Harrison, D.P., 2013: A method for estimating the cost to sequester carbon dioxide by delivering iron to the ocean. Int. J. Glob. Warm. , 5(3) , 231–254, doi:10.1504/ijgw.2013.055360.
Harrison, D.P., 2017: Global negative emissions capacity of ocean macronutrient fertilization. Environ. Res. Lett. , 12(3) , 035001, doi:10.1088/1748-9326/AA5EF5.
Hartmann, C. and M. Siegrist, 2017: Consumer perception and behaviour regarding sustainable protein consumption: A systematic review. Trends Food Sci. Technol. , 61, 11–25, doi:10.1016/j.tifs.2016.12.006.
Hartmann, J. et al., 2013: Enhanced chemical weathering as a geoengineering strategy to reduce atmospheric carbon dioxide, supply nutrients, and mitigate ocean acidification. Rev. Geophys. , 51(2) , 113–149, doi:10.1002/rog.20004.
Harvey, L.D.D., 2008: Mitigating the atmospheric CO2 increase and ocean acidification by adding limestone powder to upwelling regions. J. Geophys. Res. , 113 (C4), C04028, doi:10.1029/2007JC004373.
Hasegawa, T. et al., 2018: Risk of increased food insecurity under stringent global climate change mitigation policy. Nat. Clim. Change, 8(8) , 699–703, doi:10.1038/s41558-018-0230-x.
Hasegawa, T. et al., 2020: Food security under high bioenergy demand toward long-term climate goals. Clim. Chang. 2020 1633, 163(3) , 1587–1601, doi:10.1007/S10584-020-02838-8.
Hasegawa, T. et al., 2021: Land-based implications of early climate actions without global net-negative emissions. Nat. Sustain. , 4, 1052–1059, doi:10.1038/s41893-021-00772-w.
Hassanpour Adeh, E., J.S. Selker, and C.W. Higgins, 2018: Remarkable agrivoltaic influence on soil moisture, micrometeorology and water-use efficiency. PLoS One, 13(11) , e0203256, doi:10.1371/journal.pone.0203256.
Haus, S., L. Björnsson, and P. Börjesson, 2020: Lignocellulosic Ethanol in a Greenhouse Gas Emission Reduction Obligation System—A Case Study of Swedish Sawdust Based-Ethanol Production. Energies 2020, Vol. 13, Page 1048, 13(5) , 1048, doi:10.3390/EN13051048.
Hayek, M.N., H. Harwatt, W.J. Ripple, and N.D. Mueller, 2021: The carbon opportunity cost of animal-sourced food production on land. Nat. Sustain. , 4 (January), 21–24, doi:10.1038/s41893-020-00603-4.
Hebinck, A. et al., 2021: A Sustainability Compass for policy navigation to sustainable food systems. Glob. Food Sec. , 9 (June), 100546, doi:10.1016/j.gfs.2021.100546.
Heck, V., D. Gerten, W. Lucht, and A. Popp, 2018: Biomass-based negative emissions difficult to reconcile with planetary boundaries. Nat. Clim. Change, 8(2) , 151–155, doi:10.1038/s41558-017-0064-y.
Hedenus, F., S. Wirsenius, and D.J.A. Johansson, 2014: The importance of reduced meat and dairy consumption for meeting stringent climate change targets. Clim. Change, 124, 79–91, doi:10.1007/s10584-014-1104-5.
Henders, S., U.M. Persson, and T. Kastner, 2015: Trading forests: Land-use change and carbon emissions embodied in production and exports of forest-risk commodities. Environ. Res. Lett. , 10(12) , doi:10.1088/1748-9326/10/12/125012.
Henderson, B. et al., 2018: The power and pain of market-based carbon policies: a global application to greenhouse gases from ruminant livestock production. Mitig. Adapt. Strateg. Glob. Change, 23(3) , 349–369, doi:10.1007/s11027-017-9737-0.
Henry, B., B. Murphy, and A. Cowie, 2018a: Sustainable Land Management for Environmental Benefits and Food Security A synthesis report for the GEF. GEF, Washington DC, USA, 127 pp.
Henry, R.C. et al., 2018b: Food supply and bioenergy production within the global cropland planetary boundary. PLoS One, 13(3) , e0194695, doi:10.1371/journal.pone.0194695.
Hepburn, C. et al., 2019: The technological and economic prospects for CO2 utilization and removal. Nature, 575(7781) , 87–97, doi:10.1038/s41586-019-1681-6.
Herforth, A. et al., 2019: A Global Review of Food-Based Dietary Guidelines. Adv. Nutr. , 10(4) , 590–605, doi:10.1093/advances/nmy130.
Hernández-Morcillo, M., P. Burgess, J. Mirck, A. Pantera, and T. Plieninger, 2018: Scanning agroforestry-based solutions for climate change mitigation and adaptation in Europe. Environ. Sci. Policy, 80 (February) 44–52, doi:10.1016/j.envsci.2017.11.013.
Herrero, M. et al., 2017: Farming and the geography of nutrient production for human use: a transdisciplinary analysis. Lancet Planet. Heal. , 1(1) , e33--e42, doi:10.1016/S2542-5196(17)30007-4.
Herrero, M. et al., 2020: Innovation can accelerate the transition towards a sustainable food system. Nat. Food, 1(5) , 266–272, doi:10.1038/s43016-020-0074-1.
Herrero, M. et al., 2021: Articulating the effect of food systems innovation on the Sustainable Development Goals. Lancet Planet. Heal. , 5(1) , e50–e62, doi:10.1016/S2542-5196(20)30277-1.
Hertel, T.W. and U.L.C. Baldos, 2016: Attaining food and environmental security in an era of globalization. Glob. Environ. Change, 41, 195–205, doi:10.1016/j.gloenvcha.2016.10.006.
Hertzler, S.R., J.C. Lieblein-Boff, M. Weiler, and C. Allgeier, 2020: Plant proteins: Assessing their nutritional quality and effects on health and physical function. Nutrients, 12(12) , 1–27, doi:10.3390/nu12123704.
Heuck, C. et al., 2019: Wind turbines in high quality habitat cause disproportionate increases in collision mortality of the white-tailed eagle. Biol. Conserv. , 236, 44–51, doi.org/10.1016/j.biocon.2019.05.018.
Hevia-Koch, P. and J. Ladenburg, 2019: Where should wind energy be located? A review of preferences and visualisation approaches for wind turbine locations. Energy Res. Soc. Sci. , 53, 23–33, doi.org/10.1016/j.erss.2019.02.010.
Hieke, S. and J.L. Harris, 2016: Nutrition information and front-of-pack labelling: Issues in effectiveness. Public Health Nutr. , 19(12) , 2103–2105, doi:10.1017/S1368980016001890.
Hilaire, J. et al., 2019: Negative emissions and international climate goals—learning from and about mitigation scenarios. Clim. Change, 157(2) , 189–219, doi:10.1007/s10584-019-02516-4.
Hilborn, R., J. Banobi, S.J. Hall, T. Pucylowski, and T.E. Walsworth, 2018: The environmental cost of animal source foods. Front. Ecol. Environ. , 16(6) , 329–335, doi:10.1002/fee.1822.
Hildén, M., A. Jordan, and T. Rayner, 2014: Climate policy innovation: developing an evaluation perspective. Env. Polit. , 23(5) , 884–905, doi:10.1080/09644016.2014.924205.
Hirvonen, K., Y. Bai, D. Headey, and W.A. Masters, 2019: Affordability of the EAT–Lancet reference diet: a global analysis. Lancet Glob. Heal. , 8, e59–66, doi:10.1016/S2214-109X(19)30447-4.
HLPE, 2014: Food Losses and Waste in the Context of Sustainable Food Systems. A Report by the High Level Panel of Experts on Food Security and Nutrition of the Committee on World Food Security. High Level Panel of Experts on Food Security and Nutrition, Rome, Italy, 6 pp.
HLPE, 2017: Nutrition and food systems. A report by The High Level Panel of Experts on Food Security and Nutrition Nutrition on World Food Security. High Level Panel of Experts on Food Security and Nutrition, Rome, Italy, 11 pp.
HLPE, 2019: Agroecological and other innovative approaches for sustainable agriculture and food systems that enhance food security and nutrition. A report by the High Level Panel of Experts on Food Security and Nutrition of the Committee on World Food Security., Rome, Italy, 162 pp.
HLPE, 2020: Food security and nutrition: building a global narrative towards 2030. V0 Draft report . Food and Agriculture Organization of the United Nations, Rome, Italy.
HM Government, 2011: The carbon plan: delivering our low carbon future. HM Government, London, UK, 218 pp.
HM Government, 2021: Net Zero Strategy: Build Back Greener. HM Government, London, UK, 367 pp.
Hoegh-Guldberg, O., D. Jacob, M. Taylor, M. Bindi, S. Brown, I. Camilloni, A. Diedhiou, R. Djalante, K.L. Ebi, F. Engelbrecht, J. Guiot, Y. Hijioka, S. Mehrotra, A. Payne, S.I. Seneviratne, A. Thomas, R. Warren, and G. Zhou, 2018: Impacts of 1.5°C Global Warming on Natural and Human Systems. In: Global Warming of 1.5°C. An IPCC special report on the impacts of global warming of 1.5°C above pre-industrial levels and related global greenhouse gas emission pathways, in the context of strengthening the global response to the threat of climate change, sustainable development, and efforts to eradicate poverty. [Masson-Delmotte, V., P. Zhai, H.-O. Pörtner, D. Roberts, J. Skea, P.R. Shukla, A. Pirani, W. Moufouma-Okia, C. Péan, R. Pidcock, S. Connors, J.B.R. Matthews, Y. Chen, X. Zhou, M.I. Gomis, E. Lonnoy, T. Maycock, M. Tignor, and T. Waterfield (eds.)]. Cambridge University Press, Cambridge, UK, and New York, NY, USA.
Hoff, H. et al., 2019a: A Nexus Approach for the MENA Region—From Concept to Knowledge to Action. Front. Environ. Sci. , 7 (APR), 48, doi:10.3389/fenvs.2019.00048.
Hoff, H. et al., 2019b: International spillovers in SDG implementation The case of soy from Argentina. SEI Policy Brief, Stockholm Environment Institute. Stockholm, Sweden, 8 pp.
Höglund-Isaksson, L. et al., 2020: Technical potentials and costs for reducing global anthropogenic methane emissions in the 2050 timeframe –results from the GAINS model. Environ. Res. Commun. , 2(2) , 25004, doi:10.1088/2515-7620/ab7457.
Holland, R.A. et al., 2015: A synthesis of the ecosystem services impact of second generation bioenergy crop production. Renew. Sustain. Energy Rev. , 46, 30–40, doi:10.1016/j.rser.2015.02.003.
Holz, C., L.S. Siegel, E. Johnston, A.P. Jones, and J. Sterman, 2018: Ratcheting ambition to limit warming to 1.5 °C–trade-offs between emission reductions and carbon dioxide removal. Environ. Res. Lett. , 13(6) , 64028, doi:10.1088/1748-9326/aac0c1.
Honegger, M. and D. Reiner, 2018: The political economy of negative emissions technologies: consequences for international policy design. Clim. Policy, 18(3) , 306–321, doi:10.1080/14693062.2017.1413322.
Honegger, M., A. Michaelowa, and J. Roy, 2020: Potential implications of carbon dioxide removal for the sustainable development goals. Clim. Policy, 21(5) , 678–698, doi:10.1080/14693062.2020.1843388.
Honegger, M., W. Burns, and D.R. Morrow, 2021a: Is carbon dioxide removal ‘mitigation of climate change’?Rev. Eur. Comp. Int. Environ. Law, 00, 1–9, doi:10.1111/reel.12401.
Honegger, M., M. Poralla, A. Michaelowa, and H.-M. Ahonen, 2021b: Who Is Paying for Carbon Dioxide Removal? Designing Policy Instruments for Mobilizing Negative Emissions Technologies. Front. Clim. , 3, 50, doi:10.3389/fclim.2021.672996.
Hosonuma, N. et al., 2012: An assessment of deforestation and forest degradation drivers in developing countries. Environ. Res. Lett. , 7(4) , doi:10.1088/1748-9326/7/4/044009.
House, K.Z., C.H. House, D.P. Schrag, and M.J. Aziz, 2007: Electrochemical Acceleration of Chemical Weathering as an Energetically Feasible Approach to Mitigating Anthropogenic Climate Change. Environ. Sci. Technol. , 41(24) , 8464–8470, doi:10.1021/es0701816.
Howard, C., C.C. Dymond, V.C. Griess, D. Tolkien-Spurr, and G.C. van Kooten, 2021: Wood product carbon substitution benefits: a critical review of assumptions. Carbon Balanc. Manag. 2021 161, 16(1) , 1–11, doi:10.1186/S13021-021-00171-W.
Howard, J. et al., 2017: Clarifying the role of coastal and marine systems in climate mitigation. Front. Ecol. Environ. , 15(1) , 42–50, doi:10.1002/FEE.1451.
Hua, F. et al., 2016: Opportunities for biodiversity gains under the world’s largest reforestation programme. Nat. Commun. , 7, doi:10.1038/ncomms12717.
Humpenöder, F. et al., 2014: Investigating afforestation and bioenergy CCS as climate change mitigation strategies. Environ. Res. Lett. , 9(6) , 064029, doi:10.1088/1748-9326/9/6/064029.
Humpenöder, F. et al., 2018: Large-scale bioenergy production: how to resolve sustainability trade-offs?Environ. Res. Lett. , 13(2) , 024011, doi:10.1088/1748-9326/AA9E3B.
Hurlbert, M., J. Krishnaswamy, E. Davin, F.X. Johnson, C.F. Mena, J. Morton, S. Myeong, D. Viner, K. Warner, A. Wreford, S. Zakieldeen, Z. Zommers, 2019: Risk Management and Decision Making in Relation to Sustainable Development. In: Climate Change and Land: An IPCC Special Report on climate change, desertification, land degradation, sustainable land management, food security, and greenhouse gas fluxes in terrestrial ecosystems[Shukla, P.R., J. Skea, E. Calvo Buendia, V. Masson-Delmotte, H.-O. Pörtner, D.C. Roberts, P. Zhai, R. Slade, S. Connors, R. van Diemen, M. Ferrat, E. Haughey, S. Luz, S. Neogi, M. Pathak, J. Petzold, J. Portugal Pereira, P. Vyas, E. Huntley, K. Kissick, M. Belkacemi, J. Malley, (eds.)]. Cambridge University Press, Cambridge, UK, and New York, NY, USA.
Hydrogen Council, 2017: Hydrogen Scaling up. A sustainable pathway for the global energy transition. Hydrogen Council, 80 pp.
Hyland, J.J., M. Henchion, M. McCarthy, and S.N. McCarthy, 2017: The role of meat in strategies to achieve a sustainable diet lower in greenhouse gas emissions: A review. Meat Sci. , 132, 189–195, doi:10.1016/j.meatsci.2017.04.014.
IAEA, 2006a: Environmental Consequences of the Chernobyl Accident and their Remediation: Twenty Years of Experience. Report of the Chernobyl Forum Expert Group ‘Environment’’.’International Atomic Energy Agency, Vienna, Austria, 180 pp.
IAEA, 2006b: Environmental Consequences of the Chernobyl Accident and their Remediation: Twenty Years of Experience. International Atomic Energy Agency, Vienna, Austria.
IANAS, 2018: Opportunities and challenges for research on food and nutrition security and agriculture in the Americas. Regional analysis prepared from country assessments by IANAS. Inter-American Network of Academies of Sciences, Mexico City, Mexico, 49 pp.
IAP, 2018: Opportunities for future research and innovation on food and nutrition security and agriculture. The InterAcademy Partnership’s global perspective. Synthesis by IAP based on four regional academy network studies. InterAcademy Partnership, Trieste, Italy, and Washington, DC, USA, 94 pp.
IDA, 2019: International Development Association. http://ida.worldbank.org/ (Accessed December 15, 2019).
IEA, 2017: Digitalization & Energy. International Energy Agency, Paris, France, 188 pp.
IEA, 2018: World Energy Outlook 2018. International Energy Agency, Paris, France, 661 pp.
IEA, 2019a: World Energy Outlook 2019. International Energy Agency, Paris, France, 810 pp.
IEA, 2019b: The Future of Hydrogen. Seizing today’s opportunities. International Energy Agency, Paris, France, 203 pp.
IEA, 2020a: World Energy Outlook 2020. International Energy Agency, Paris, France, 461 pp.
IEA, 2020b: Energy Technology Perspectives 2020. International Energy Agency, Paris, France, 397 pp.
IEA, 2020c: Renewables 2020. International Energy Agency, Paris, France, https://www.iea.org/reports/renewables-2020 (Accessed December 23, 2020).
IEA, 2021a: Methane Tracker Database. https://www.iea.org/articles/methane- tracker-database (Accessed September 20, 2021).
IEA, 2021b: World Energy Outlook 2021. International Energy Agency, Paris, France, 383 pp.
IHME, 2018: Findings from the Global Burden of Disease Study 2017. Institute for Health Metrics and Evaluation, Seattle, USA, 27 pp.
IIASA, 2021: AR6 Scenario Explorer (submissions) hosted by IIASA. International Institute for Applied Systems Analysis, https://data.ene.iiasa.ac.at/ar6-scenario-submission/ (Accessed October 14, 2021).
Iiyama, M. et al., 2018: Addressing the paradox – the divergence between smallholders’ preference and actual adoption of agricultural innovations. Int. J. Agric. Sustain. , 16(6) , 472–485, doi:10.1080/14735903.2018.1539384.
Ikonen, I., F. Sotgiu, A. Aydinli, and P.W.J. Verlegh, 2019: Consumer effects of front-of-package nutrition labeling: an interdisciplinary meta-analysis. J. Acad. Mark. Sci. , 48, 360–383, doi:10.1007/s11747-019-00663-9.
Ingram, J., 2020: Nutrition security is more than food security. Nat. Food, 1(1) , 2–2, doi:10.1038/s43016-019-0002-4.
Ince, A.C., C.O. Colpan, A. Hagen, and M.F. Serincan, 2021: Modeling and simulation of Power-to-X systems: A review. Fuel, 304, 121354, doi:10.1016/j.fuel.2021.121354.
Ioannidis, R., and D. Koutsoyiannis, 2020: A review of land use, visibility and public perception of renewable energy in the context of landscape impact. Appl. Energy, 276, 115367, doi:10.1016/j.apenergy.2020.115367.
IPBES, 2019: Summary for Policymakers. In: Global Assessment Report on Biodiversity and Ecosystem Services[Brondizio, E.S., J. Settele, S. Díaz, and H.T. Ngo, (eds.)], Intergovernmental Science-Policy Platform on Biodiversity and Ecosystem Services, Bonn, Germany.
IPCC, 2006: 2006 IPCC Guidelines for National Greenhouse Gas Inventories — IPCC. [Eggelston, S., L. Buendia, K. Miwa, T. Ngara, and K. Tanabe, (eds.)]. Institute for Global Environmental Strategies for the IPCC,.
IPCC, 2018: Summary for Policymakers. In: Global Warming of 1.5°C an IPCC special report on the impacts of global warming of 1.5°C above pre-industrial levels and related global greenhouse gas emission pathways, in the context of strengthening the global response to the threat of climate change, sustainable development, and efforts to eradicate poverty[Masson-Delmotte, V., P. Zhai, H.-O. Pörtner, D. Roberts, J. Skea, P.R. Shukla, A. Pirani, W. Moufouma-Okia, C. Péan, R. Pidcock, S. Connors, J.B.R. Matthews, Y. Chen, X. Zhou, M.I. Gomis, E. Lonnoy, T. Maycock, M. Tignor, and T. Waterfield (eds.)]. World Meteorological Organization, Geneva, Switzerland, 32 pp.
IPCC, 2019a: Climate Change and Land. An IPCC Special Report on climate change, desertification, land degradation, sustainable land management, food security, and greenhouse gas fluxes in terrestrial ecosystems[Shukla, P.R., J. Skea, E. Calvo Buendia, V. Masson-Delmotte, H.-O. Pörtner, D. C. Roberts, P. Zhai, R. Slade, S. Connors, R. van Diemen, M. Ferrat, E. Haughey, S. Luz, S. Neogi, M. Pathak, J. Petzold, J. Portugal Pereira, P. Vyas, E. Huntley, K. Kissick, M. Belkacemi, J. Malley, (eds.)]. In press.
IPCC, 2019b: IPCC Special Report on the Ocean and Cryosphere in a Changing Climate[H.-O. Pörtner, D.C. Roberts, V. Masson-Delmotte, P. Zhai, M. Tignor, E. Poloczanska, K. Mintenbeck, A. Alegría, M. Nicolai, A. Okem, J. Petzold, B. Rama, N.M. Weyer (eds.)]. Cambridge University Press, Cambridge, UK and New York, NY, USA, 755 pp. https://doi.org/10.1017/9781009157964.
iPES Food, 2019: Towards a Common Food Policy for the European Union: The Policy Reform and Realignment that is Required to Build Sustainable Food Systems in Europe. International Panel of Experts on Sustainable Food Systems, Brussels, Belgium, 112 pp.
IRENA, 2018: Hydrogen from renewable power: Technology outlook for the energy transition. International Renewable Energy Agency, Abu Dhabi, 52 pp.
IRENA, 2019: Bioenergy from boreal forests: Swedish approach to sustainable wood use. Abu Dhabi, https://www.irena.org/publications/2019/Mar/Bioenergy-from-boreal-forests-Swedish-approach-to-sustainable-wood-use (Accessed November 9, 2021).
IRP, 2019: Land Restoration for Achieving the Sustainable Development Goals: An International Resource Panel Think Piece. [Herrick, J.E. et al., (eds.)]. United Nations Environment Programme, Nairobi, Kenya, 135 pp.https://www.resourcepanel.org/reports/land-restoration-achieving-sustainable-development-goals (Accessed December 5, 2019).
Ishimoto, Y. et al., 2017: Putting Costs of Direct Air Capture in Context . Forum for Climate Engineering Assessment, Washington, DC, USA, 21 pp.
Ishiwatari, M. et al., 2019: Climate Fragility Risks (CFR) In Development Sectors: Six Principles for Managing Synergies and Trade-Offs. The University of Tokyo, United Nations University Institute for the Advanced Study of Sustainability, Keio University, Ritsumeikan Asia Pacific University, Institute for Global Environmental Strategies, Japan, https://collections.unu.edu/view/UNU:7334#.XSYRAOfvY5o.mendeley.
Iyer, G. et al., 2021: The role of carbon dioxide removal in net-zero emissions pledges. Energy Clim. Change, 2, 100043, doi:10.1016/j.egycc.2021.100043.
Jaccard, S.L. et al., 2013: Two Modes of Change in Southern Ocean Productivity Over the Past Million Years. Science, 339(6126) , 1419–1423, doi:10.1126/science.1227545.
Jackson, R.B., E.I. Solomon, J.G. Canadell, M. Cargnello, and C.B. Field, 2019: Methane removal and atmospheric restoration. Nat. Sustain. , 2(6) , 436–438, doi:10.1038/s41893-019-0299-x.
Jackson, R.B. et al., 2021: Atmospheric methane removal: a research agenda. Philos. Trans. R. Soc. A Math. Phys. Eng. Sci. , 379(2210) , 20200454, doi:10.1098/rsta.2020.0454.
Jacobi, J., S. Rist, and M.A. Altieri, 2017: Incentives and disincentives for diversified agroforestry systems from different actors’ perspectives in Bolivia. Int. J. Agric. Sustain. , 15(4) , doi:10.1080/14735903.2017.1332140.
Jacobson, M., 2019: The Health and Climate Impacts of Carbon Capture and Direct Air Capture. Energy Environ. Sci. , 12, doi:10.1039/C9EE02709B. Jaffe, S., 2017: Vulnerable Links in the Lithium-Ion Battery Supply Chain. Joule, 1(2) , 225–228, doi:10.1016/J.JOULE.2017.09.021.
Jager, H.I. and J.A.F. Kreig, 2018: Designing landscapes for biomass production and wildlife. Glob. Ecol. Conserv. , 16, doi:10.1016/j.gecco.2018.e00490.
James, S.J., and C. James, 2010: The food cold-chain and climate change. Food Res. Int. , 43(7) , 1944–1956, doi:10.1016/j.foodres.2010.02.001.
Jarmul, S. et al., 2020: Climate change mitigation through dietary change: a systematic review of empirical and modelling studies on the environmental footprints and health effects of ‘sustainable diets.’Environ. Res. Lett. , 15(12) , 123014, doi:10.1088/1748-9326/abc2f7.
Jeffery, S. et al., 2017: Biochar boosts tropical but not temperate crop yields. Environ. Res. Lett. , 12(5) , doi:10.1088/1748-9326/aa67bd.
Jensen, J.P., and K. Skelton, 2018: Wind turbine blade recycling: Experiences, challenges and possibilities in a circular economy. Renew. Sustain. Energy Rev. , 97, 165–176, doi:10.1016/j.rser.2018.08.041.
Jensen, P.D., P. Purnell, and A.P.M. Velenturf, 2020: Highlighting the need to embed circular economy in low carbon infrastructure decommissioning: The case of offshore wind. Sustain. Prod. Consum. , 24, 266–280, doi:10.1016/j.spc.2020.07.012.
Jensen, S., K. Mohlin, K. Pittel, and T. Sterner, 2015: An Introduction to the Green Paradox: The Unintended Consequences of Climate Policies. Rev. Environ. Econ. Policy, 9(2) , 246–265, doi:10.1093/reep/rev010.
Jensen, T. and H. Dowlatabadi, 2018: Challenges in financing public sector low-carbon initiatives: lessons from private finance for a school district in British Columbia, Canada. Clim. Policy, 18(7) , 878–888, doi:10.1080/14693062.2017.1387512.
Jepson, W. and M. Caldas, 2017: Changing energy systems and land-use change. J. Land Use Sci. , 12(6) , 405–406, doi:10.1080/1747423X.2017.1408889.
Jia, G., E. Shevliakova, P. Artaxo, N. De Noblet-Ducoudré, R. Houghton, J. House, K. Kitajima, C. Lennard, A. Popp, A. Sirin, R. Sukumar, L. Verchot, 2019: Land–Climate Interactions. In: Climate Change and Land. An IPCC Special Report on climate change, desertification, land degradation, sustainable land management, food security, and greenhouse gas fluxes in terrestrial ecosystems. [P.R. Shukla, J. Skea, E. Calvo Buendia, V. Masson-Delmotte, H.-O. Pörtner, D.C. Roberts, P. Zhai, R. Slade, S. Connors, R. van Diemen, M. Ferrat, E. Haughey, S. Luz, S. Neogi, M. Pathak, J. Petzold, J. Portugal Pereira, P. Vyas, E. Huntley, K. Kissick, M. Belkacemi, J. Malley, (eds.)]. Cambridge University Press, Cambridge, UK, and New York, NY, USA.
Jin, X., and N. Gruber, 2003: Offsetting the radiative benefit of ocean iron fertilization by enhancing N2O emissions. Geophys. Res. Lett. , 30(24) , 2249, doi:10.1029/2003GL018458.
Johansson, D.J.A., C. Azar, M. Lehtveer, and G.P. Peters, 2020: The role of negative carbon emissions in reaching the Paris climate targets: The impact of target formulation in integrated assessment models. Environ. Res. Lett. , 15(12) , 124024, doi:10.1088/1748-9326/abc3f0.
Johnsson, S., E. Andersson, P. Thollander, and M. Karlsson, 2019: Energy savings and greenhouse gas mitigation potential in the Swedish wood industry. Energy, 187, 115919, doi:10.1016/J.ENERGY.2019.115919.
Jones, I.S.., 2014: The cost of carbon management using ocean nourishment. Int. J. Clim. Chang. Strateg. Manag. , 6(4) , 391–400, doi:10.1108/IJCCSM-11-2012-0063.
Jönsson, E., T. Linné, and A. McCrow-Young, 2019: Many Meats and Many Milks? The Ontological Politics of a Proposed Post-animal Revolution. Sci. Cult. (Lond). , 28(1) , 70–97, doi:10.1080/09505431.2018.1544232.
Joppa, L. et al., 2021: Microsoft’s million-tonne CO2-removal purchase - lessons for net zero. Nature, 597(7878) , 629–632, doi:10.1038/d41586-021-02606-3.
Jørgensen, U. and P.E. Lærke, 2016: Perennial grasses for sustainable European protein production. In: Perennial Biomass Crops for a Resource-Constrained World.
Joseph, S. et al., 2021: How biochar works, and when it doesn’t: A review of mechanisms controlling soil and plant responses to biochar. GCB Bioenergy, 13(11) , 1731–1764, doi:10.1111/gcbb.12885.
Junge, R., B. König, M. Villarroel, T. Komives, and M.H. Jijakli, 2017: Strategic points in aquaponics. Water (Switzerland) , 9(3) , 1–9, doi:10.3390/w9030182.
Kalinina, A., M. Spada, and P. Burgherr, 2018: Application of a Bayesian hierarchical modeling for risk assessment of accidents at hydropower dams. Saf. Sci. , 110, 164–177, doi:10.1016/J.SSCI.2018.08.006.
Kanter, D.R. et al., 2018a: Evaluating agricultural trade-offs in the age of sustainable development. Agric. Syst. , 163, 73–88, doi:10.1016/j.agsy.2016.09.010.
Kanter, D.R. et al., 2020: Nitrogen pollution policy beyond the farm. Nat. Food, 1(1) , 27–32, doi:10.1038/s43016-019-0001-5.
Kanter, R., L. Vanderlee, and S. Vandevijvere, 2018b: Front-of-package nutrition labelling policy: Global progress and future directions. Public Health Nutr. , 21(8) , 1399–1408, doi:10.1017/S1368980018000010.
Kantola, I.B., M.D. Masters, D.J. Beerling, S.P. Long, and E.H. DeLucia, 2017: Potential of global croplands and bioenergy crops for climate change mitigation through deployment for enhanced weathering. Biol. Lett. , 13(4) , 20160714, doi:10.1098/rsbl.2016.0714.
Karlsson-Vinkhuyzen, S.I. et al., 2018: Entry into force and then? The Paris agreement and state accountability. Clim. Policy, 18(5) , 593–599, doi:10.1080/14693062.2017.1331904.
Karlsson, M., E. Alfredsson, and N. Westling, 2020: Climate policy co-benefits: a review. Clim. Policy, 20(3) , 1–25, doi:10.1080/14693062.2020.1724070.
Karplus, V.J., S. Paltsev, M. Babiker, and J.M. Reilly, 2013: Should a vehicle fuel economy standard be combined with an economy-wide greenhouse gas emissions constraint? Implications for energy and climate policy in the United States. Energy Econ. , 36, 322–333, doi:10.1016/j.eneco.2012.09.001.
Kato, E. and A. Kurosawa, 2019: Evaluation of Japanese energy system toward 2050 with TIMES-Japan - Deep decarbonization pathways. Energy Procedia, 158, 4141–4146, doi:10.1016/j.egypro.2019.01.818.
Kato, E. and A. Kurosawa, 2021: Role of negative emissions technologies (NETs) and innovative technologies in transition of Japan’s energy systems toward net-zero CO2 emissions. Sustain. Sci. , 16(2) , 463–475, doi:10.1007/s11625-021-00908-z.
Kaunda, R.B., 2020: Potential environmental impacts of lithium mining. J. Energy Nat. Resour. Law, 38(3) , 237–244, doi:10.1080/02646811.2020.1754596.
Kavanagh, R.P. and M.A. Stanton, 2012: Koalas use young Eucalyptus plantations in an agricultural landscape on the Liverpool Plains, New South Wales. Ecol. Manag. Restor. , 13(3) , 297–305, doi:10.1111/emr.12005.
Kc, B. K. et al., 2018: When too much isn’t enough: Does current food production meet global nutritional needs?PLoS One, 13(10) , 1–16, doi:10.1371/journal.pone.0205683.
Keith, D.W. et al., 2004: The influence of large-scale wind power on global climate. Proc. Natl. Acad. Sci. , 101(46) , 16115–16120, doi:10.1073/pnas.0406930101.
Kelland, M.E. et al., 2020: Increased yield and CO2 sequestration potential with the C4 cereal Sorghum bicolor cultivated in basaltic rock dust-amended agricultural soil. Glob. Chang. Biol. , 26(6) , 3658–3676, doi:10.1111/GCB.15089.
Keller, D.P., E.Y. Feng, and A. Oschlies, 2014: Potential climate engineering effectiveness and side effects during a high carbon dioxide-emission scenario. Nat. Commun. , 5, 3304, doi:10.1038/ncomms4304.
Kempton, W. and J. Tomić, 2005: Vehicle-to-grid power implementation: From stabilizing the grid to supporting large-scale renewable energy. J. Power Sources, 144(1) , 280–294, doi:10.1016/j.jpowsour.2004.12.022.
Kersh, R., 2015: Of nannies and nudges: The current state of U.S. obesity policymaking. Public Health, 129(8) , 1083–1091, doi:10.1016/j.puhe.2015.05.018.
Keys, P.W., L. Wang-Erlandsson, and L.J. Gordon, 2016: Revealing Invisible Water: Moisture Recycling as an Ecosystem Service. PLoS One, 11(3) , e0151993.
Kheshgi, H.S., 1995: Sequestering atmospheric carbon dioxide by increasing ocean alkalinity. Energy, 20(9) , 915–922, doi:10.1016/0360-5442(95)00035-F.
Kim, B.F. et al., 2019: Country-specific dietary shifts to mitigate climate and water crises. Glob. Environ. Change, 62 (June 2018), 101926, doi:10.1016/j.gloenvcha.2019.05.010.
Kim, G. and P. Coseo, 2018: Urban Park Systems to Support Sustainability: The Role of Urban Park Systems in Hot Arid Urban Climates. Forests, 9(7) , 439, doi:10.3390/f9070439.
Kirchherr, J., H. Pohlner, and K.J. Charles, 2016: Cleaning up the big muddy: A meta-synthesis of the research on the social impact of dams. Environ. Impact Assess. Rev. , 60, 115–125, doi:10.1016/j.eiar.2016.02.007.
Kirchherr, J., D. Reike, and M. Hekkert, 2017: Conceptualizing the circular economy: An analysis of 114 definitions. Resour. Conserv. Recycl. , 127, 221–232, doi:10.1016/j.resconrec.2017.09.005.
Kirchherr, J., M.-P. Ahrenshop, and K. Charles, 2019: Resettlement lies: Suggestive evidence from 29 large dam projects. World Dev. , 114, 208–219, doi:10.1016/j.worlddev.2018.10.003.
Kissinger, G., M. Brockhaus, and S.R. Bush, 2021: Policy integration as a means to address policy fragmentation: Assessing the role of Vietnam’s national REDD+ action plan in the central highlands. Environ. Sci. Policy, 119, 85–92, doi:10.1016/j.envsci.2021.02.011.
Kivyiro, P. and H. Arminen, 2014: Carbon dioxide emissions, energy consumption, economic growth, and foreign direct investment: Causality analysis for Sub-Saharan Africa. Energy, 74, 595–606, doi.org/10.1016/j.energy.2014.07.025.
Klausbruckner, C., H. Annegarn, L.R.F. Henneman, and P. Rafaj, 2016: A policy review of synergies and trade-offs in South African climate change mitigation and air pollution control strategies. Environ. Sci. Policy, 57, 70–78, doi:10.1016/j.envsci.2015.12.001.
Klerkx, L. and D. Rose, 2020: Dealing with the game-changing technologies of Agriculture 4.0: How do we manage diversity and responsibility in food system transition pathways?Glob. Food Sec. , 24 (October 2019), 100347, doi:10.1016/j.gfs.2019.100347.
Kludze, H. et al., 2013: Estimating sustainable crop residue removal rates and costs based on soil organic matter dynamics and rotational complexity. Biomass and Bioenergy, 56, 607–618, doi.org/10.1016/j.biombioe.2013.05.036.
Knowler, D. et al., 2020: The economics of Integrated Multi-Trophic Aquaculture: where are we now and where do we need to go?Rev. Aquac. , 12(3) , 1579–1594, doi:10.1111/raq.12399.
Köberle, A.C., 2019: The Value of BECCS in IAMs: a Review. Curr. Sustain. Energy Reports, 6(4) , 107–115, doi:10.1007/s40518-019-00142-3.
Köhler, P., J. Hartmann, and D.A. Wolf-Gladrow, 2010: Geoengineering potential of artificially enhanced silicate weathering of olivine. Proc. Natl. Acad. Sci. , 107(47) , 20228–20233, doi:10.1073/pnas.1000545107.
Köhler, P., J.F. Abrams, C. Volker, J. Hauck, and D.A. Wolf-Gladrow, 2013: Geoengineering impact of open ocean dissolution of olivine on atmospheric CO2, surface ocean pH and marine biology. Environ. Res. Lett. , 8(1) , 014009, doi:10.1088/1748-9326/8/1/014009.
Kolokotroni, M., S.A. Tassou, and B.L. Gowreesunker, 2015: Energy aspects and ventilation of food retail buildings. Adv. Build. Energy Res. , 9(1) , 1–19, doi:10.1080/17512549.2014.897252.
Kondo, M. et al., 2018: Plant Regrowth as a Driver of Recent Enhancement of Terrestrial CO2 Uptake. Geophys. Res. Lett. , 45(10) , 4820–4830, doi:10.1029/2018GL077633.
Kongsager, R., 2017: Barriers to the adoption of alley cropping as a climate-smart agriculture practice: Lessons from maize cultivation among the Maya in southern Belize. Forests, 8(7) , 260, doi:10.3390/f8070260.
Kongsager, R., 2018: Linking Climate Change Adaptation and Mitigation: A Review with Evidence from the Land-Use Sectors. Land, 7, 158, doi:10.3390/land7040158.
Kopáček, M., 2021: Land-Use Planning and the Public: Is There an Optimal Degree of Civic Participation?L. 2021, 10(1) , 90, doi:10.3390/LAND10010090.
Kotlikoff, L.J., A. Polbin, and A. Zubarev, 2016: Will the Paris Accord Accelerate Climate Change?National Bureau of Economic Research, Cambridge, MA, USA, 44 pp. https://www.nber.org/system/files/working_papers/w22731/w22731.pdf .
Kovic, Y., J.K. Noel, J.A. Ungemack, and J.A. Burleson, 2018: The impact of junk food marketing regulations on food sales: an ecological study. Obes. Rev. , 19(6) , 761–769, doi:10.1111/obr.12678.
Koweek, D.A., D.A. Mucciarone, and R.B. Dunbar, 2016: Bubble Stripping as a Tool to Reduce High Dissolved CO2 in Coastal Marine Ecosystems. Environ. Sci. Technol. , 50(7) , 3790–3797, doi:10.1021/ACS.EST.5B04733/SUPPL_FILE/ES5B04733_SI_001.PDF.
Kraak, V.I., T. Englund, S. Misyak, and E.L. Serrano, 2017: A novel marketing mix and choice architecture framework to nudge restaurant customers toward healthy food environments to reduce obesity in the United States. Obes. Rev. , 18(8) , 852–868, doi:10.1111/obr.12553.
Krause-Jensen, D. and C.M. Duarte, 2016: Substantial role of macroalgae in marine carbon sequestration. Nat. Geosci. , 9(10) , 737–742, doi:10.1038/ngeo2790.
Krause-Jensen, D. et al., 2018: Sequestration of macroalgal carbon: the elephant in the Blue Carbon room. Biol. Lett. , 14(6) , 20180236, doi:10.1098/rsbl.2018.0236.
Kraxner, F. et al., 2014: BECCS in South Korea—Analyzing the negative emissions potential of bioenergy as a mitigation tool. Renew. Energy, 61, 102–108, doi:10.1016/J.RENENE.2012.09.064.
Kreig, J.A.F., E. Parish, and H.I. Jager, 2021: Growing grasses in unprofitable areas of US Midwest croplands could increase species richness. Biol. Conserv. , 261, 109289, doi:10.1016/J.BIOCON.2021.109289.
Krey, V. et al., 2019: Looking under the hood: A comparison of techno-economic assumptions across national and global integrated assessment models. Energy, 172, 1254–1267, doi:10.1016/j.energy.2018.12.131.
Kriewald, S., P. Pradhan, L. Costa, A.G.C. Ros, and J.P. Kropp, 2019: Hungry cities: how local food self-sufficiency relates to climate change, diets, and urbanisation. Environ. Res. Lett. , 14(9) , 094007, doi:10.1088/1748-9326/ab2d56.
Kugelberg, S. et al., 2021: Implications of a food system approach for policy agenda-setting design. Glob. Food Sec. , 28 (Forthcoming), 100451, doi:10.1016/j.gfs.2020.100451.
Kumar, P. et al., 2017: Meat analogues: Health promising sustainable meat substitutes. Crit. Rev. Food Sci. Nutr. , 57(5) , 923–932, doi:10.1080/10408398.2014.939739.
Kummu, M. et al., 2020: Interplay of trade and food system resilience: Gains on supply diversity over time at the cost of trade independency. Glob. Food Sec. , 24 (February), 100360, doi:10.1016/j.gfs.2020.100360.
Kuronuma, T. et al., 2018: CO2 Payoff of extensive green roofs with different vegetation species. Sustainability, 10(7) , 1–12, doi:10.3390/su10072256.
Kuwae, T., and M. Hori, 2019: The Future of Blue Carbon: Addressing Global Environmental Issues. In: Blue Carbon in Shallow Coastal Ecosystems[Kuwae, T. and M. Hori, (eds.)], Springer Singapore, Singapore, pp. 347–373.
Kwiatkowski, L., K.L. Ricke, and K. Caldeira, 2015: Atmospheric consequences of disruption of the ocean thermocline. Environ. Res. Lett. , 10(3) , 034016, doi:10.1088/1748-9326/10/3/034016.
La Plante, E.C. et al., 2021: Saline Water-Based Mineralization Pathway for Gigatonne-Scale CO2 Management. ACS Sustain. Chem. Eng. , 9(3) , 1073–1089, doi:10.1021/acssuschemeng.0c08561.
Lackner, K.S. et al., 2012: The urgency of the development of CO 2 capture from ambient air. Proc. Natl. Acad. Sci. , 109(33) , 13156–13162, doi:10.1073/pnas.1108765109.
Lade, S.J. et al., 2020: Human impacts on planetary boundaries amplified by Earth system interactions. Nat. Sustain. , 3, 119–128, doi:10.1038/s41893-019-0454-4.
Lampitt, R. et al., 2008: Ocean fertilization: a potential means of geoengineering?Philos. Trans. R. Soc. A Math. Phys. Eng. Sci. , 366(1882) , 3919–3945, doi:10.1098/RSTA.2008.0139.
Lange, K. et al., 2018: Basin-scale effects of small hydropower on biodiversity dynamics. Front. Ecol. Environ. , 16(7) , 397–404, doi:10.1002/fee.1823.
Larkin, A., J. Kuriakose, M. Sharmina, and K. Anderson, 2018: What if negative emission technologies fail at scale? Implications of the Paris Agreement for big emitting nations. Clim. Policy, 18(6) , 690–714, doi:10.1080/14693062.2017.1346498.
Larsen, J., W. Herndon, M. Grant, and P. Marster, 2019: Capturing Leadership - Policies for the US to Advance Direct Air Capture Technology. Rhodium Group, New York, USA, 68 pp.
Larson, A.M. et al., 2018: Gender lessons for climate initiatives: A comparative study of REDD+ impacts on subjective wellbeing. World Dev. , 108, 86–102, doi.org/10.1016/j.worlddev.2018.02.027.
Latka, C. et al., 2021: Paying the price for environmentally sustainable and healthy EU diets. Glob. Food Sec. , 28, 100437, doi:10.1016/j.gfs.2020.100437.
Latu, C. et al., 2018: Barriers and Facilitators to Food Policy Development in Fiji. Food Nutr. Bull. , 39(4) , 621–631, doi:10.1177/0379572118797083.
Lauri, P. et al., 2019: Global Woody Biomass Harvest Volumes and Forest Area Use Under Different SSP-RCP Scenarios. J. For. Econ. , 34(3–4) , 285–309, doi:10.1561/112.00000504.
Law, B.S., M. Chidel, T. Brassil, G. Turner, and A. Kathuria, 2014: Trends in bird diversity over 12years in response to large-scale eucalypt plantation establishment: Implications for extensive carbon plantings. For. Ecol. Manage. , 322, 58–68, doi:10.1016/j.foreco.2014.02.032.
Law, C.S., 2008: Predicting and monitoring the effects of large-scale ocean iron fertilization on marine trace gas emissions. Mar. Ecol. Prog. Ser. , 364, 283–288, doi:10.3354/meps07549.
Lawrence, M.G. et al., 2018: Evaluating climate geoengineering proposals in the context of the Paris Agreement temperature goals. Nat. Commun. , 9(1) , 3734, doi:10.1038/s41467-018-05938-3.
Leach, A.M. et al., 2016: Environmental impact food labels combining carbon, nitrogen, and water footprints. Food Policy, 61, 213–223, doi:10.1016/j.foodpol.2016.03.006.
Lee, H. et al., 2019: Implementing land-based mitigation to achieve the Paris Agreement in Europe requires food system transformation. Environ. Res. Lett. , 14(10) , doi:10.1088/1748-9326/ab3744.
Lee, J., M. Bazilian, B. Sovacool, and S. Greene, 2020a: Responsible or reckless? A critical review of the environmental and climate assessments of mineral supply chains. Environ. Res. Lett. , 15(10) , 103009, doi:10.1088/1748-9326/ab9f8c.
Lee, K., C. Fyson, and C.-F. Schleussner, 2021: Fair distributions of carbon dioxide removal obligations and implications for effective national net-zero targets. Environ. Res. Lett. , 16(9) , 094001, doi:10.1088/1748-9326/ac1970.
Lee, N. et al., 2020b: Hybrid floating solar photovoltaics-hydropower systems: Benefits and global assessment of technical potential. Renew. Energy, 162, 1415–1427.
Lee, R.P., F. Keller, and B. Meyer, 2017: A concept to support the transformation from a linear to circular carbon economy: net zero emissions, resource efficiency and conservation through a coupling of the energy, chemical and waste management sectors. Clean Energy, 1(1) , 102–113, doi:10.1093/ce/zkx004.
Leeson, D. et al., 2017: A Techno-economic analysis and systematic review of carbon capture and storage (CCS) applied to the iron and steel, cement, oil refining and pulp and paper industries, as well as other high purity sources. Int. J. Greenh. Gas Control, 61 (June), 71–84, doi:10.1016/j.ijggc.2017.03.020.
Leger, D. et al., 2021: Photovoltaic-driven microbial protein production can use land and sunlight more efficiently than conventional crops. Proc. Natl. Acad. Sci. , 118(26) , doi:10.1073/pnas.2015025118.
Lehmann, J. et al., 2021: Biochar in climate change mitigation. Nat. Geosci. , 14, 883–892, doi.org/10.1038/s41561-021-00852-8.
Leinonen, I. et al., 2019: Lysine Supply Is a Critical Factor in Achieving Sustainable Global Protein Economy. Front. Sustain. Food Syst. , 3 (April), 1–11, doi:10.3389/fsufs.2019.00027.
Leip, A., B.L. Bodirsky, and S. Kugelberg, 2021: The role of nitrogen in achieving sustainable food systems for healthy diets. Glob. Food Sec. , 28, 100408, doi:10.1016/j.gfs.2020.100408.
Leirpoll, M.E. et al., 2021: Optimal combination of bioenergy and solar photovoltaic for renewable energy production on abandoned cropland. Renew. Energy, 168, 45–56, doi.org/10.1016/j.renene.2020.11.159.
Lemma, Y., D. Kitaw, and G. Gatew, 2014: Loss in Perishable Food Supply Chain: An Optimization Approach Literature Review. Int. J. Sci. Eng. Res. , 5(5) , 302–311.
Lenton, T.M., 2014: The Global Potential for Carbon Dioxide Removal. In: Geoengineering of the Climate System[Harrison, R.M. and R.E. Hester, (eds.)], The Royal Society of Chemistry, Cambridge, UK, pp. 52–79.
Lenzi, D., 2018: The ethics of negative emissions. Glob. Sustain. , 1, e7, doi:10.1017/sus.2018.5.
Lenzi, D., W.F. Lamb, J. Hilaire, M. Kowarsch, and J.C. Minx, 2018: Don’t deploy negative emissions technologies without ethical analysis. Nature, 561(7723) , 303–305, doi:10.1038/d41586-018-06695-5.
Leskinen, P. et al., 2018: Substitution effects of wood-based products in climate change mitigation. European Forest Institute, 28 pp.
Lever, J., R. Sonnino, and F. Cheetham, 2019: Reconfiguring local food governance in an age of austerity: towards a place-based approach?J. Rural Stud. , 69, 97–105, doi.org/10.1016/j.jrurstud.2019.04.009.
Lezaun, J., P. Healey, T. Kruger, and S.M. Smith, 2021: Governing Carbon Dioxide Removal in the UK: Lessons Learned and Challenges Ahead. Front. Clim. , 3, 89, doi:10.3389/fclim.2021.673859.
Li, Y. et al., 2018: Climate model shows large-scale wind and solar farms in the Sahara increase rain and vegetation. Science, 361(6406) , 1019–1022, doi:10.1126/science.aar5629.
Li, Y.L., B. Chen, and G.Q. Chen, 2020: Carbon network embodied in international trade: Global structural evolution and its policy implications. Energy Policy, 139, 111316, doi.org/10.1016/j.enpol.2020.111316.
Liao, X., J.W. Hall, and N. Eyre, 2016: Water use in China’s thermoelectric power sector. Glob. Environ. Change, 41, 142–152, doi:10.1016/J.GLOENVCHA.2016.09.007.
Lin, B.B., S. Macfadyen, A.R. Renwick, S.A. Cunningham, and N.A. Schellhorn, 2013: Maximizing the Environmental Benefits of Carbon Farming through Ecosystem Service Delivery. Bioscience, 63(10) , 793–803, doi:10.1525/bio.2013.63.10.6.
Lindh, H., H. Williams, A. Olsson, and F. Wikström, 2016: Elucidating the Indirect Contributions of Packaging to Sustainable Development: A Terminology of Packaging Functions and Features. Packag. Technol. Sci. , 29(4–5) , 225–246, doi:10.1002/pts.2197.
Lipiäinen, S., and E. Vakkilainen, 2021: Role of the Finnish forest industry in mitigating global change: energy use and greenhouse gas emissions towards 2035. Mitig. Adapt. Strateg. Glob. Change, 26(2) , 1–19, doi:10.1007/S11027-021-09946-5/FIGURES/3.
Lipper, L. et al., 2014: Climate-smart agriculture for food security. Nat. Clim. Change, 4(12) , 1068–1072, doi:10.1038/nclimate2437.
Liu, C. et al., 2016: Food waste in Japan: Trends, current practices and key challenges. J. Clean. Prod. , 133(2016) , 557–564, doi:10.1016/j.jclepro.2016.06.026.
Liu, H., and X. Fan, 2017: Value-added-based accounting of CO2 emissions: A multi-regional input-output approach. Sustainability, 9(12) , 2220, doi:10.3390/su9122220.
Liu, J., and C. Zhong, 2019: An economic evaluation of the coordination between electric vehicle storage and distributed renewable energy. Energy, 186, 115821, doi:10.1016/J.ENERGY.2019.07.151.
Liu, T. et al., 2017: Bioenergy production on marginal land in Canada: Potential, economic feasibility, and greenhouse gas emissions impacts. Appl. Energy, 205, 477–485, doi:10.1016/J.APENERGY.2017.07.126.
Liu, Y., Y. Xu, F. Zhang, J. Yun, and Z. Shen, 2014: The impact of biofuel plantation on biodiversity: a review. Chinese Sci. Bull. , 59(34) , 4639–4651, doi:10.1007/s11434-014-0639-1.
Lock, P. and L. Whittle, 2018: Future opportunities for using forest and sawmill residues in Australia. Australian Bureau of Agricultural and Resource Economics and Sciences, Canberra, Australia, https://www.awe.gov.au/abares/research-topics/forests/forest-economics/forest-economic-research/forest-sawmill-residues-report (Accessed November 9, 2021).
Lohbeck, M. et al., 2020: Drivers of farmer-managed natural regeneration in the Sahel. Lessons for restoration. Sci. Rep. , 10, 15038, doi:10.1038/s41598-020-70746-z.
Lomax, G., M. Workman, T. Lenton, and N. Shah, 2015: Reframing the policy approach to greenhouse gas removal technologies. Energy Policy, 78, 125–136, doi:10.1016/j.enpol.2014.10.002.
Longva, Y. et al., 2017: The potential effects of land-based mitigation on the climate system and the wider environment: A synthesis of current knowledge in support of policy. LUC4C, Edinburgh, UK, 73 pp.
Loon, M.P. et al., 2019: Impacts of intensifying or expanding cereal cropping in sub‐Saharan Africa on greenhouse gas emissions and food security. Glob. Chang. Biol. , 25(11) , 3720–3730, doi:10.1111/gcb.14783.
Love, D.C., M.S. Uhl, and L. Genello, 2015: Energy and water use of a small-scale raft aquaponics system in Baltimore, Maryland, United States. Aquac. Eng. , 68, 19–27, doi:10.1016/j.aquaeng.2015.07.003.
Lu, C., T. Zhao, X. Shi, and S. Cao, 2018: Ecological restoration by afforestation may increase groundwater depth and create potentially large ecological and water opportunity costs in arid and semiarid China. J. Clean. Prod. , 176, 1213–1222, doi:10.1016/j.jclepro.2016.03.046.
Lübeck, M. and P.S. Lübeck, 2019: Application of lactic acid bacteria in green biorefineries. FEMS Microbiol. Lett. , 366(3) , 1–8, doi:10.1093/femsle/fnz024.
Luderer, G. et al., 2019: Environmental co-benefits and adverse side-effects of alternative power sector decarbonization strategies. Nat. Commun. , 10(1) , doi:10.1038/s41467-019-13067-8.
Luisetti, T. et al., 2020: Climate action requires new accounting guidance and governance frameworks to manage carbon in shelf seas. Nat. Commun. , 11(1) , 4599, doi:10.1038/s41467-020-18242-w.
Luke, 2021: Food facts: Finnish food production methods in international comparison, https://projects.luke.fi/ruokafakta/en/frontpage/.
Lutsey, N., 2015: Global climate change mitigation potential from a transition to electric vehicles. Working paper 2015-5, International Council on Clean Transportation.
Macdiarmid, J.I., F. Douglas, and J. Campbell, 2016: Eating like there’s no tomorrow: Public awareness of the environmental impact of food and reluctance to eat less meat as part of a sustainable diet. Appetite, 96, 487–493, doi:10.1016/j.appet.2015.10.011.
Mace, M.J., C.L. Fyson, M. Schaeffer, and W.L. Hare, 2021: Large‐Scale Carbon Dioxide Removal to Meet the 1.5°C Limit: Key Governance Gaps, Challenges and Priority Responses. Glob. Policy, 12 (S1), 67–81, doi:10.1111/1758-5899.12921.
MacKay, D.J.C., 2013: Solar energy in the context of energy use, energy transportation and energy storage. Philos. Trans. R. Soc. A Math. Phys. Eng. Sci. , 371(1996) , doi:10.1098/RSTA.2011.0431.
Mackey, B. et al., 2020: Understanding the importance of primary tropical forest protection as a mitigation strategy. Mitig. Adapt. Strateg. Glob. Chang. 2020 255, 25(5) , 763–787, doi:10.1007/S11027-019-09891-4.
Mackler, S., X. Fishman, and D. Broberg, 2021: A policy agenda for gigaton-scale carbon management. Electr. J. , 34(7) , 106999, doi:10.1016/j.tej.2021.106999.
Macreadie, P.I. et al., 2021: Blue carbon as a natural climate solution. Nat. Rev. Earth Environ. , 2, 826–839, doi:10.1038/s43017-021-00224-1.
Madeddu, S. et al., 2020: The CO2 reduction potential for the European industry via direct electrification of heat supply (power-to-heat). Environ. Res. Lett. , 15(12) , 124004, doi:10.1088/1748-9326/ABBD02.
Madhu, K., S. Pauliuk, S. Dhathri, and F. Creutzig, 2021: Understanding environmental trade-offs and resource demand of direct air capture technologies through comparative life-cycle assessment. Nat. Energy, 6, 1035–1044, doi:10.1038/s41560-021-00922-6.
Makarov, I., H. Chen, and S. Paltsev, 2020: Impacts of climate change policies worldwide on the Russian economy. Clim. Policy, 20(10) , 1242–1256, doi:10.1080/14693062.2020.1781047.
Makkonen, M., S. Huttunen, E. Primmer, A. Repo, and M. Hildén, 2015: Policy coherence in climate change mitigation: An ecosystem service approach to forests as carbon sinks and bioenergy sources. For. Policy Econ. , 50, 153–162, doi:10.1016/j.forpol.2014.09.003.
Manning, D.A.C., 2008: Phosphate Minerals, Environmental Pollution and Sustainable Agriculture. Elements, 4(2) , 105–108, doi:10.2113/GSELEMENTS.4.2.105.
Manning, D.A.C., 2010: Mineral sources of potassium for plant nutrition. A review. Agron. Sustain. Dev. , 30(2) , 281–294, doi:10.1051/agro/2009023.
Mansuy, N. et al., 2018: Salvage harvesting for bioenergy in Canada: From sustainable and integrated supply chain to climate change mitigation. Wiley Interdiscip. Rev. Energy Environ. , 7(5) , e298, doi:10.1002/WENE.298.
Marcano-Olivier, M.I., P.J. Horne, S. Viktor, and M. Erjavec, 2020: Using Nudges to Promote Healthy Food Choices in the School Dining Room: A Systematic Review of Previous Investigations. J. Sch. Health, 90(2) , 143–157, doi:10.1111/josh.12861.
Marcar, N., 2016: Prospects for Managing Salinity in Southern Australia Using Trees on Farmland. In: Agroforestry for the Management of Waterlogged Saline Soils and Poor-Quality Waters[Dagar, J. and P. Minhas, (eds.)], Springer, New Delhi, India, pp. 49–71.
Marcucci, A., S. Kypreos, and E. Panos, 2017: The road to achieving the long-term Paris targets: energy transition and the role of direct air capture. Clim. Change, 144(2) , 181–193, doi:10.1007/s10584-017-2051-8.
Markkanen, S. and A. Anger-Kraavi, 2019: Social impacts of climate change mitigation policies and their implications for inequality. Clim. Policy, 19(7) , 827–844, doi:10.1080/14693062.2019.1596873.
Markusson, N., D. McLaren, and D. Tyfield, 2018: Towards a cultural political economy of mitigation deterrence by negative emissions technologies (NETs). Glob. Sustain. , 1, e10, doi:10.1017/sus.2018.10.
Marques, A.T. et al., 2020: Wind turbines cause functional habitat loss for migratory soaring birds. J. Anim. Ecol. , 89(1) , 93–103, doi.org/ 10.1111/1365-2656.12961.
Marrou, H., L. Dufour, and J. Wery, 2013a: How does a shelter of solar panels influence water flows in a soil-crop system?Eur. J. Agron. , 50, 38–51, doi:10.1016/j.eja.2013.05.004.
Marrou, H., L. Guilioni, L. Dufour, C. Dupraz, and J. Wery, 2013b: Microclimate under agrivoltaic systems: Is crop growth rate affected in the partial shade of solar panels?Agric. For. Meteorol. , 177, 117–132, doi:10.1016/j.agrformet.2013.04.012.
Martin-Roberts, E. et al., 2021: Carbon capture and storage at the end of a lost decade. One Earth, 4, doi:10.1016/j.oneear.2021.10.002.
Martínez-García, A. et al., 2014: Iron fertilization of the subantarctic ocean during the last ice age. Science, 343(6177) , 1347–1350, doi:10.1126/science.1246848.
Mattick, C.S., 2018: Cellular agriculture: The coming revolution in food production. Bull. At. Sci. , 74(1) , 32–35, doi:10.1080/00963402.2017.1413059.
Mattick, C.S., A.E. Landis, B.R. Allenby, and N.J. Genovese, 2015: Anticipatory Life Cycle Analysis of In Vitro Biomass Cultivation for Cultured Meat Production in the United States. Environ. Sci. Technol. , 49(19) , 11941–11949, doi:10.1021/acs.est.5b01614.
Maucieri, C. et al., 2018: Hydroponic systems and water management in aquaponics: A review. Ital. J. Agron. , 13(1) , 1–11, doi:10.4081/ija.2017.1012.
Mausch, K., A. Hall, and C. Hambloch, 2020: Colliding paradigms and trade-offs: Agri-food systems and value chain interventions. Glob. Food Sec. , 26, 1–20, doi:10.1016/j.gfs.2020.100439.
May, R. et al., 2020: Paint it black: Efficacy of increased wind turbine rotor blade visibility to reduce avian fatalities. Ecol. Evol. , 10(16) , 8927–8935, doi.org/10.1002/ece3.6592.
May, R., C.R. Jackson, H. Middel, B.G. Stokke, and F. Verones, 2021: Life-cycle impacts of wind energy development on bird diversity in Norway. Environ. Impact Assess. Rev. , 90, 106635, doi:10.1016/J.EIAR.2021.106635.
Mayer, A. et al., 2019a: Measuring Progress towards a Circular Economy: A Monitoring Framework for Economy-wide Material Loop Closing in the EU28. J. Ind. Ecol. , 23(1) , 62–76, doi:10.1111/jiec.12809.
Mayer, J., G. Bachner, and K.W. Steininger, 2019b: Macroeconomic implications of switching to process-emission-free iron and steel production in Europe. J. Clean. Prod. , 210, 1517–1533, doi:10.1016/j.jclepro.2018.11.118.
Mayrhofer, J.P., and J. Gupta, 2016: The science and politics of co-benefits in climate policy. Environ. Sci. Policy, 57, 22–30, doi:10.1016/j.envsci.2015.11.005.
Mazzocchi, G., and D. Marino, 2019: Does food public procurement boost food democracy? Theories and evidences from some case studies. Econ. Agro-Alimentare, 21(2) , 379–404, doi:10.3280/ECAG2019-002011.
Mazzocchi, M., 2017: Ex-post evidence on the effectiveness of policies targeted at promoting healthier diets. Food and Agriculture Organization of the United Nations, Rome, Italy, 17 pp.
Mazzucato, M., and G. Semieniuk, 2018: Financing renewable energy: Who is financing what and why it matters. Technol. Forecast. Soc. Change, 127, 8–22, doi:10.1016/j.techfore.2017.05.021.
Mbow, C., C. Rosenzweig, L.G. Barioni, T.G. Benton, M. Herrero, M. Krishnapillai, E. Liwenga, P. Pradhan, M.G. Rivera-Ferre, T. Sapkota, F.N. Tubiello, Y. Xu, 2019: Food Security. In: Climate Change and Land: anIPCC special report on climate change, desertification, land degradation, sustainable land management, food security, and greenhouse gas fluxes in terrestrial ecosystems. [Shukla, P.R., J. Skea, E. Calvo Buendia, V. Masson-Delmotte, H.-O. Pörtner, D.C. Roberts, P. Zhai, R. Slade, S. Connors, R. van Diemen, M. Ferrat, E. Haughey, S. Luz, S. Neogi, M. Pathak, J. Petzold, J. Portugal Pereira, P. Vyas, E. Huntley, K. Kissick, M. Belkacemi, J. Malley, (eds.)]. Cambridge University Press, Cambridge, UK, and New York, NY, USA.
McBey, D., D. Watts, and A.M. Johnstone, 2019: Nudging, formulating new products, and the lifecourse: A qualitative assessment of the viability of three methods for reducing Scottish meat consumption for health, ethical, and environmental reasons. Appetite, 142 (July), 104349, doi:10.1016/j.appet.2019.104349.
McDermott, J. and A.J. Wyatt, 2017: The role of pulses in sustainable and healthy food systems. Ann. N. Y. Acad. Sci. , 1392(1) , 30–42, doi:10.1111/nyas.13319.
McEwan, C., 2017: Spatial processes and politics of renewable energy transition: Land, zones and frictions in South Africa. Polit. Geogr. , 56, 1–12, doi.org/10.1016/j.polgeo.2016.10.001.
McKeon, N., 2015: Global food governance in an era of crisis: Lessons from the United Nations Committee on World Food Security. Can. Food Stud. / La Rev. Can. des études sur l’alimentation, 2(2) , 328–334, doi:10.15353/cfs-rcea.v2i2.134.
McKinsey, 2009: Pathways to a low-carbon economy: Version 2 of the global greenhouse gas abatement cost curve. McKinsey & Company, 192 pp.
McKuin, B. et al., 2021: Energy and water co-benefits from covering canals with solar panels. Nat. Sustain. , 4(7) , 609–617, doi:10.1038/s41893-021-00693-8.
McLaren, D., D. Tyfield, R. Willis, B. Szerszynski, and N. Markusson, 2019: Beyond “Net-Zero”: A Case for Separate Targets for Emissions Reduction and Negative Emissions. Front. Clim. , 1, 4, doi:10.3389/fclim.2019.00004.
McLellan, B.C. et al., 2016: Critical Minerals and Energy–Impacts and Limitations of Moving to Unconventional Resources. Resour. , 5(2) , 19, doi:10.3390/RESOURCES5020019.
McLinden, M.O., J.S. Brown, R. Brignoli, A.F. Kazakov, and P.A. Domanski, 2017: Limited options for low-global-warming-potential refrigerants. Nat. Commun. , 8(1) , 1–9, doi:10.1038/ncomms14476.
McQueen, N. et al., 2020: Cost Analysis of Direct Air Capture and Sequestration Coupled to Low-Carbon Thermal Energy in the United States ̀. Environ. Sci. Technol. , 54, 7542–7551, doi:10.1021/acs.est.0c00476.
McQueen, N. et al., 2021: A review of direct air capture (DAC): scaling up commercial technologies and innovating for the future. Prog. Energy, 3(3) , 032001, doi:10.1088/2516-1083/abf1ce.
MDB, 2019: Joint Report on Multilateral Development Banks’ Climate Finance. Group of Multilateral Development Banks (MDBs). World Bank Group, Washington, DC, USA, 56 pp. http://documents.worldbank.org/curated/en/247461561449155666/Joint-Report-on-Multilateral-Development-Banks-Climat e-Finance-2018.
Meadowcroft, J. and R. Steurer, 2018: Assessment practices in the policy and politics cycles: a contribution to reflexive governance for sustainable development?J. Environ. Policy Plan. , 20(6) , 734–751, doi:10.1080/1523908X.2013.829750.
Meckling, J. and E. Biber, 2021: A policy roadmap for negative emissions using direct air capture. Nat. Commun. , 12(1) , 2051, doi:10.1038/s41467-021-22347-1.
Meijaard, E. et al., 2020: The environmental impacts of palm oil in context. Nat. Plants, 6(12) , 1418–1426, doi:10.1038/s41477-020-00813-w.
Mejia, M.A. et al., 2019: Life Cycle Assessment of the Production of a Large Variety of Meat Analogs by Three Diverse Factories. J. Hunger Environ. Nutr. , 0(0) , 1–13, doi:10.1080/19320248.2019.1595251.
Mendly-Zambo, Z., L.J. Powell, and L.L. Newman, 2021: Dairy 3.0: cellular agriculture and the future of milk. Food, Cult. Soc. , 24(5) , 675–693, doi:10.1080/15528014.2021.1888411.
Meng, B., G.P. Peters, Z. Wang, and M. Li, 2018: Tracing CO2 emissions in global value chains. Energy Econ. , 73, 24–42, doi.org/10.1016/j.eneco.2018.05.013.
METI, 2017: Basic Hydrogen Strategy. Ministerial Council on Renewable Energy, Hydrogen and Related Issues of Japan, Tokyo, Japan, 37 pp.https://www.meti.go.jp/english/press/2017/1226_003.html.
Metternicht, G., 2018: Land Use and Spatial Planning. Springer International Publishing, Cham, Switzerland.
Meyer, M.A., 2020: The role of resilience in food system studies in low- and middle-income countries. Glob. Food Sec. , 24, 100356, doi:10.1016/j.gfs.2020.100356.
Meysman, F.J.R. and F. Montserrat, 2017: Negative CO2 emissions via enhanced silicate weathering in coastal environments. Biol. Lett. , 13(4) , 20160905, doi:10.1098/rsbl.2016.0905.
Michielsen, T.O., 2014: Brown backstops versus the green paradox. J. Environ. Econ. Manage. , 68(1) , 87–110, doi:10.1016/j.jeem.2014.04.004.
Mie, A. et al., 2017: Human health implications of organic food and organic agriculture: a comprehensive review. Environ. Heal. , 16(1) , 111, doi:10.1186/s12940-017-0315-4.
Mier y Terán Giménez Cacho, M. et al., 2018: Bringing agroecology to scale: key drivers and emblematic cases. Agroecol. Sustain. Food Syst. , 42(6) , doi:10.1080/21683565.2018.1443313.
Mignacca, B., G. Locatelli, and A. Velenturf, 2020: Modularisation as enabler of circular economy in energy infrastructure. Energy Policy, 139, 111371, doi:10.1016/j.enpol.2020.111371.
Milford, A.B. and C. Kildal, 2019: Meat Reduction by Force: The Case of “Meatless Monday” in the Norwegian Armed Forces. Sustainability, 11(10) , 2741, doi:10.3390/su11102741.
Milford, A.B., C. Le Mouël, B.L. Bodirsky, and S. Rolinski, 2019: Drivers of meat consumption. Appetite, 141 (June), 104313, doi:10.1016/j.appet.2019.06.005.
Miller, C.L. et al., 2019: Are Australians ready for warning labels, marketing bans and sugary drink taxes? Two cross-sectional surveys measuring support for policy responses to sugar-sweetened beverages. BMJ Open, 9(6) , 1–13, doi:10.1136/bmjopen-2018-027962.
Miller, L.A. and P.M. Orton, 2021: Achieving negative emissions through oceanic sequestration of vegetation carbon as Black Pellets. Clim. Change, 167(3–4) , 29, doi:10.1007/s10584-021-03170-5.
Miller, L.M. and D.W. Keith, 2018a: Observation-based solar and wind power capacity factors and power densities. Environ. Res. Lett. , 13(10) , doi:10.1088/1748-9326/aae102.
Miller, L.M. and D.W. Keith, 2018b: Climatic Impacts of Wind Power. Joule, 2(12) , 2618–2632, doi:10.1016/j.joule.2018.09.009.
Millstein, D. and S. Menon, 2011: Regional climate consequences of large-scale cool roof and photovoltaic array deployment. Environ. Res. Lett. , 6, 034001, doi:10.1088/1748-9326/6/3/034001.
Milne, S. et al., 2019: Learning from “actually existing” REDD+: A synthesis of ethnographic findings. Conserv. Soc. , 17(1) , 84–95, doi:10.4103/cs.cs_18_13.
Milner, S. et al., 2016: Potential impacts on ecosystem services of land use transitions to second-generation bioenergy crops in GB. GCB Bioenergy, 8(2) , 317–333, doi:10.1111/gcbb.12263.
Ministry of Agriculture and Forestry, 2021: Kampanjen om matens ursprung ökade uppskattningen av inhemsk mat. Finland, https://mmm.fi/sv/-/ruuan-alkuperaa-korostanut-kampanja-lisasi-kotimaisen-ruuan-arvostusta.
Minx, J.C. et al., 2018: Negative emissions - Part 1: Research landscape and synthesis. Environ. Res. Lett. , 13(6) , 063001, doi:10.1088/1748-9326/aabf9b.
Miskin, C.K. et al., 2019: Sustainable co-production of food and solar power to relax land-use constraints. Nat. Sustain. , 2(10) , 972–980, doi:10.1038/s41893-019-0388-x.
Mitter, H. et al., 2020: Shared Socio-economic Pathways for European agriculture and food systems: The Eur-Agri-SSPs. Glob. Environ. Change, 65 (December 2019), 102159, doi:10.1016/j.gloenvcha.2020.102159.
Moe, E. and J.-K.S. Røttereng, 2018: The post-carbon society: Rethinking the international governance of negative emissions. Energy Res. Soc. Sci. , 44, 199–208, doi:10.1016/j.erss.2018.04.031.
Mohan, A., 2017: Whose land is it anyway? Energy futures & land use in India. Energy Policy, 110, 257–262, doi:10.1016/J.ENPOL.2017.08.025.
Mohan, A., O. Geden, M. Fridahl, H.J. Buck, and G.P. Peters, 2021: UNFCCC must confront the political economy of net-negative emissions. One Earth, 4(10) , 1348–1351, doi:10.1016/j.oneear.2021.10.001.
Molina-Besch, K., F. Wikström, and H. Williams, 2019: The environmental impact of packaging in food supply chains—does life cycle assessment of food provide the full picture?Int. J. Life Cycle Assess. , 24(1) , 37–50, doi:10.1007/s11367-018-1500-6.
Momblanch, A. et al., 2019: Untangling the water-food-energy-environment nexus for global change adaptation in a complex Himalayan water resource system. Sci. Total Environ. , 655, 35–47, doi:10.1016/j.scitotenv.2018.11.045.
Mongin, M., M.E. Baird, A. Lenton, C. Neill, and J. Akl, 2021: Reversing ocean acidification along the Great Barrier Reef using alkalinity injection. Environ. Res. Lett. , 16(6) , 064068, doi:10.1088/1748-9326/ac002d.
Monier, E. et al., 2018: Toward a consistent modeling framework to assess multi-sectoral climate impacts. Nat. Commun. , 9(1) , doi:10.1038/s41467-018-02984-9.
Montserrat, F. et al., 2017: Olivine Dissolution in Seawater: Implications for CO2 Sequestration through Enhanced Weathering in Coastal Environments. Environ. Sci. Technol. , 51(7) , 3960–3972, doi:10.1021/acs.est.6b05942.
Moore, K.J. et al., 2019: Regenerating Agricultural Landscapes with Perennial Groundcover for Intensive Crop Production. Agron. 2019, Vol. 9, Page 458, 9(8) , 458, doi:10.3390/AGRONOMY9080458.
Moosdorf, N., P. Renforth, and J. Hartmann, 2014: Carbon Dioxide Efficiency of Terrestrial Enhanced Weathering. Environ. Sci. Technol. , 48(9) , 4809–4816, doi:10.1021/es4052022.
Mora, O. et al., 2020: Exploring the future of land use and food security: A new set of global scenarios. PLoS One, 15 (7 July), 1–29, doi:10.1371/journal.pone.0235597.
Moragues-Faus, A., 2021: The emergence of city food networks: Rescaling the impact of urban food policies. Food Policy, 103, 102107, doi:10.1016/j.foodpol.2021.102107.
Moragues-Faus, A., R. Sonnino, and T. Marsden, 2017: Exploring European food system vulnerabilities: Towards integrated food security governance. Environ. Sci. Policy, 75 (C), 184–215, doi:10.1016/j.envsci.2017.05.015.
Moran, E.F., M.C. Lopez, N. Moore, N. Müller, and D.W. Hyndman, 2018: Sustainable hydropower in the 21st century. Proc. Natl. Acad. Sci. , 115(47) , 11891 LP – 11898, doi:10.1073/pnas.1809426115.
Moreau, V., P. Dos Reis, and F. Vuille, 2019: Enough Metals? Resource Constraints to Supply a Fully Renewable Energy System. Resources, 8(1) , 29, doi:10.3390/resources8010029.
Moreira, M.M.R. et al., 2020: Socio-environmental and land-use impacts of double-cropped maize ethanol in Brazil. Nat. Sustain. 2020 33, 3(3) , 209–216, doi:10.1038/s41893-019-0456-2.
Morrison, T.H. et al., 2019: The black box of power in polycentric environmental governance. Glob. Environ. Change, 57, 101934, doi.org/10.1016/j.gloenvcha.2019.101934.
Morrow, D.R. and M.S. Thompson, 2020: Reduce, Remove, Recycle: Clarifying the Overlap between Carbon Removal and CCUS. ICRLP Working Paper No. 2, Institute for Carbon Removal Law and Policy, American University, Washington, DC, USA, http://research.american.edu/carbonremoval/wp-content/uploads/sites/3/2020/12/reduce-remove-recycle_final.pdf .
Mouat, M.J. and R. Prince, 2018: Cultured meat and cowless milk: on making markets for animal-free food. J. Cult. Econ. , 11(4) , 315–329, doi:10.1080/17530350.2018.1452277.
Mouratiadou, I. et al., 2020: Sustainable intensification of crop residue exploitation for bioenergy: Opportunities and challenges. GCB Bioenergy, 12(1) , 71–89, doi:10.1111/gcbb.12649.
Mousseau, T.A. and A.P. Møller, 2014: Genetic and Ecological Studies of Animals in Chernobyl and Fukushima. J. Hered. , 105(5) , 704–709, doi:10.1093/JHERED/ESU040.
Mousseau, T.A. and A.P. Møller, 2020: Plants in the Light of Ionizing Radiation: What Have We Learned From Chernobyl, Fukushima, and Other “Hot” Places?Front. Plant Sci. , 0, 552, doi:10.3389/FPLS.2020.00552.
Mozaffarian, D., S.Y. Angell, T. Lang, and J.A. Rivera, 2018: Role of government policy in nutrition—barriers to and opportunities for healthier eating. BMJ, 361, k2426, doi:10.1136/bmj.k2426.
Mu, Y., S. Evans, C. Wang, and W. Cai, 2018: How will sectoral coverage affect the efficiency of an emissions trading system? A CGE-based case study of China. Appl. Energy, 227, 403–414, doi:10.1016/j.apenergy.2017.08.072.
Muinzer, T., 2019: Climate and Energy Governance for the UK Low Carbon Transition: The Climate Change Act 2008. 1st ed. Palgrave Macmillan, Cham, Switzerland, 146 pp.
Muller, A. et al., 2017: Strategies for feeding the world more sustainably with organic agriculture. Nat. Commun. , 8(1290) , doi:10.1038/s41467-017-01410-w.
Müller, P. and M. Schmid, 2019: Intelligent packaging in the food sector: A brief overview. Foods, 8(1) , doi:10.3390/foods8010016.
Mulvaney, D., 2017: Identifying the roots of Green Civil War over utility-scale solar energy projects on public lands across the American Southwest. J. Land Use Sci. , 12, 493–515, doi:10.1080/1747423X.2017.1379566.
Muratori, M. et al., 2020: EMF-33 insights on bioenergy with carbon capture and storage (BECCS). Clim. Change, 163(3) , 1621–1637, doi:10.1007/s10584-020-02784-5.
Muscat, A., E.M. de Olde, I.J.M. de Boer, and R. Ripoll-Bosch, 2020: The battle for biomass: A systematic review of food-feed-fuel competition. Glob. Food Sec. , 25 (June), doi:10.1016/j.gfs.2019.100330.
Muscat, A., E.M. de Olde, Z. Kovacic, I.J.M. de Boer, and R. Ripoll-Bosch, 2021: Food, energy or biomaterials? Policy coherence across agro-food and bioeconomy policy domains in the EU. Environ. Sci. Policy, 123, 21–30, doi:10.1016/J.ENVSCI.2021.05.001.
Myllyviita, T., S. Soimakallio, J. Judl, and J. Seppälä, 2021: Wood substitution potential in greenhouse gas emission reduction–review on current state and application of displacement factors. For. Ecosyst. 2021 81, 8(1) , 1–18, doi:10.1186/S40663-021-00326-8.
Mylona, K. et al., 2018: Viewpoint: Future of food safety and nutrition - Seeking win-wins, coping with trade-offs. Food Policy, 74 (November 2017), 143–146, doi:10.1016/j.foodpol.2017.12.002.
N’Yeurt, A.D.R., D.P. Chynoweth, M.E. Capron, J.R. Stewart, and M.A. Hasan, 2012: Negative carbon via ocean afforestation. Process Saf. Environ. Prot. , 90(6) , 467–474, doi:10.1016/J.PSEP.2012.10.008.
Nabuurs, G.-J., P.J. Verkerk, M.-J. Schelhaas, J.R. González Olabarria, A. Trasobares, and E. Cienciala, 2018: Climate-Smart Forestry: mitigation impacts in three European regions. European Forest Institute.
Nag, R. et al., 2019: Anaerobic digestion of agricultural manure and biomass – Critical indicators of risk and knowledge gaps. Sci. Total Environ. , 690, 460–479, doi:10.1016/j.scitotenv.2019.06.512.
Nakhimovsky, S.S. et al., 2016: Taxes on sugar-sweetened beverages to reduce overweight and obesity in middle-income countries: A systematic review. PLoS One, 11(9) , 1–22, doi:10.1371/journal.pone.0163358.
Narayan, S. et al., 2016: Coastal Wetlands and Flood Damage Reduction: Using Risk Industry-based Models to Assess Natural Defenses in the Northeastern USA. Lloyd’s Tercentenary Research Foundation, London, UK, 23 pp.
NASAC, 2018: Opportunities and challenges for research on food and nutrition security and agriculture in Africa. Network of African Science Academies, Nairobi, Kenya.
NASEM, 2019: Negative Emissions Technologies and Reliable Sequestration: A Research Agenda. National Academy of Sciences Engineering and Medicine, Washington DC, USA, 510 pp.
Neff, R.A. et al., 2018: Reducing meat consumption in the USA: A nationally representative survey of attitudes and behaviours. Public Health Nutr. , 21(10) , 1835–1844, doi:10.1017/S1368980017004190.
Negri, V. et al., 2021: Life cycle optimization of BECCS supply chains in the European Union. Appl. Energy, 298, 117252, doi:10.1016/j.apenergy.2021.117252.
Nemet, G.F. et al., 2018: Negative emissions - Part 3: Innovation and upscaling. Environ. Res. Lett. , 13(6) , 063003, doi:10.1088/1748-9326/aabff4.
Neto, B. and M. Gama Caldas, 2018: The use of green criteria in the public procurement of food products and catering services: a review of EU schemes. Environ. Dev. Sustain. , 20(5) , 1905–1933, doi:10.1007/s10668-017-9992-y.
Neuhoff, K. et al., 2016: Inclusion of Consumption of carbon intensive materials in emissions trading – An option for carbon pricing post-2020. Climate Strategies, 17 pp. https://climatestrategies.org/publication/inclusion-of-consumption-of-carbon-intensive-materials-in-emissions-trading-an-option-for-carbon-pricing-post-2020/ (Accessed December 16, 2020).
Neven, D. and T. Reardon, 2004: The rise of Kenyan supermarkets and the evolution of their horticulture product procurement systems. Dev. Policy Rev. , 22(6) , 669–699, doi:10.1111/j.1467-7679.2004.00271.x.
Nguyen, H.T., T.H. Pham, and L.L. de Bruyn, 2017: Impact of Hydroelectric Dam Development and Resettlement on the Natural and Social Capital of Rural Livelihoods in Bo Hon Village in Central Vietnam. Sustain. 2017, Vol. 9, Page 1422, 9(8) , 1422, doi:10.3390/SU9081422.
Niebylski, M.L., K.A. Redburn, T. Duhaney, and N.R. Campbell, 2015: Healthy food subsidies and unhealthy food taxation: A systematic review of the evidence. Nutrition, 31(6) , 787–795, doi:10.1016/j.nut.2014.12.010.
Nielsen, T.D., 2016: From REDD+ forests to green landscapes? Analyzing the emerging integrated landscape approach discourse in the UNFCCC. For. Policy Econ. , 73, 177–184, doi:10.1016/j.forpol.2016.09.006.
Nieminen, M. et al., 2018: A synthesis of the impacts of ditch network maintenance on the quantity and quality of runoff from drained boreal peatland forests. Ambio, 47(5) , 523–534, doi:10.1007/s13280-017-0966-y.
Nijdam, D., T. Rood, and H. Westhoek, 2012: The price of protein: Review of land use and carbon footprints from life cycle assessments of animal food products and their substitutes. Food Policy, 37(6) , 760–770, doi:10.1016/j.foodpol.2012.08.002.
Niles, M.T. et al., 2018: Climate change mitigation beyond agriculture: a review of food system opportunities and implications. Renew. Agric. Food Syst. , 33(3) , 297–308, doi:10.1017/S1742170518000029.
Ning, Y., L. Miao, T. Ding, and B. Zhang, 2019: Carbon emission spillover and feedback effects in China based on a multiregional input-output model. Resour. Conserv. Recycl. , 141, 211–218, doi:10.1016/j.resconrec.2018.10.022.
Nkoa, R., 2014: Agricultural benefits and environmental risks of soil fertilization with anaerobic digestates: a review. Agron. Sustain. Dev. , 34(2) , 473–492, doi:10.1007/s13593-013-0196-z.
Noonan, K., D. Miller, K. Sell, and D. Rubin, 2013: A procurement-based pathway for promoting public health: Innovative purchasing approaches for state and local government agencies. J. Public Health Policy, 34(4) , 528–537, doi:10.1057/jphp.2013.30.
Núñez-Regueiro, M.M., S.F. Siddiqui, and R.J. Fletcher Jr, 2020: Effects of bioenergy on biodiversity arising from land-use change and crop type. Conserv. Biol. , 35(1) 77–87, doi.org/10.1111/cobi.13452.
O’Sullivan, C.A., G.D. Bonnett, C.L. McIntyre, Z. Hochman, and A.P. Wasson, 2019: Strategies to improve the productivity, product diversity and profitability of urban agriculture. Agric. Syst. , 174 (December 2018), 133–144, doi:10.1016/j.agsy.2019.05.007.
Obergassel, W., F. Mersmann, and H. Wang-Helmreich, 2017: Two for one: Integrating the sustainable development agenda with international climate policy. Gaia, 26(3) , 249–253, doi:10.14512/gaia.26.3.8.
Obersteiner, M. et al., 2016: Assessing the land resource–food price nexus of the Sustainable Development Goals. Sci. Adv. , 2(9) , doi:10.1126/sciadv.1501499.
Obersteiner, M. et al., 2018: How to spend a dwindling greenhouse gas budget. Nat. Clim. Change, 8(1) , 7–10, doi:10.1038/s41558-017-0045-1.
Obydenkova, S.V, P.D. Kouris, D.M.J. Smeulders, M.D. Boot, and Y. van der Meer, 2021: Modeling life-cycle inventory for multi-product biorefinery: tracking environmental burdens and evaluation of uncertainty caused by allocation procedure. Biofuels, Bioprod. Biorefining, 15(5) , 1281–1300, doi:10.1002/BBB.2214.
Ocko, I.B. and S.P. Hamburg, 2019: Climate Impacts of Hydropower: Enormous Differences among Facilities and over Time. Environ. Sci. Technol. , 53(23) , 14070–14082, doi:10.1021/acs.est.9b05083.
OECD, 2021: Making Better Policies for Food Systems. OECD, Paris, France.
Olgun, N. et al., 2013: Geochemical evidence of oceanic iron fertilization by the Kasatochi volcanic eruption in 2008 and the potential impacts on Pacific sockeye salmon. Mar. Ecol. Prog. Ser. , 488, 81–88, doi:10.3354/meps10403.
Olivetti, E.A., G. Ceder, G.G. Gaustad, and X. Fu, 2017: Lithium-Ion Battery Supply Chain Considerations: Analysis of Potential Bottlenecks in Critical Metals. Joule, 1(2) , 229–243, doi:10.1016/J.JOULE.2017.08.019.
Olsson, L., H. Barbosa, S. Bhadwal, A. Cowie, K. Delusca, D. Flores-Renteria, K. Hermans, E. Jobbagy, W. Kurz, D. Li, D.J. Sonwa, L. Stringer, 2019: Land Degradation. In: Climate Change and Land: An IPCC Special Report on climate change, desertification, land degradation, sustainable land management, food security, and greenhouse gas fluxes in terrestrial ecosystems. [Shukla, P.R., J. Skea, E. Calvo Buendia, V. Masson-Delmotte, H.-O. Pörtner, D. C. Roberts, P. Zhai, R. Slade, S. Connors, R. van Diemen, M. Ferrat, E. Haughey, S. Luz, S. Neogi, M. Pathak, J. Petzold, J. Portugal Pereira, P. Vyas, E. Huntley, K. Kissick, M. Belkacemi, J. Malley, (eds.)]. Cambridge University Press, Cambridge, UK, and New York, NY, USA.
Omondi, M.O. et al., 2016: Quantification of biochar effects on soil hydrological properties using meta-analysis of literature data. Geoderma, 274, 28–34, doi:10.1016/j.geoderma.2016.03.029.
Ong, S., C. Campbell, P. Denholm, R. Margolis, and G. Heath, 2013: Land-Use Requirements for Solar Power Plants in the United States. National Renewable Energy Laboratory, Denver, CO, USA, 47 pp. https://www.nrel.gov/docs/fy13osti/56290.pdf (Accessed November 9, 2021).
Orlov, A. and A. Aaheim, 2017: Economy-wide effects of international and Russia’s climate policies. Energy Econ. , 68, 466–477, doi:10.1016/j.eneco.2017.09.019.
Orr, B.J. et al., 2017: Scientific conceptual framework for land degradation neutrality. United Nations Convention to Combat Desertification, Bonn, Germany.
Osaka, S., R. Bellamy, and N. Castree, 2021: Framing “nature-based” solutions to climate change. WIREs Clim. Change, 12(5) , e729, doi:10.1002/wcc.729.
Oschlies, A., 2009: Impact of atmospheric and terrestrial CO2 feedbacks on fertilization-induced marine carbon uptake. Biogeosciences, 6(8) , 1603–1613, doi:10.5194/BG-6-1603-2009.
Oschlies, A., W. Koeve, W. Rickels, and K. Rehdanz, 2010: Side effects and accounting aspects of hypothetical large-scale Southern Ocean iron fertilization. Biogeosciences, 7, 4017–4035, doi:10.5194/bg-7-4017-2010.
Oschlies, A., M. Pahlow, A. Yool, and R.J. Matear, 2010: Climate engineering by artificial ocean upwelling: Channelling the sorcerer’s apprentice. Geophys. Res. Lett. , 37(4) , doi:10.1029/2009GL041961.
Osorio, R.J., C.J. Barden, and I.A. Ciampitti, 2019: GIS approach to estimate windbreak crop yield effects in Kansas–Nebraska. Agrofor. Syst. , 93(4) , 1567–1576, doi:10.1007/s10457-018-0270-2.
Pahl-Wostl, C., A. Bhaduri, and A. Bruns, 2018: Editorial special issue: The Nexus of water, energy and food – An environmental governance perspective. Environ. Sci. Policy, 90, 161–222, doi:10.1016/j.envsci.2018.06.021.
Palahí, M. et al., 2020: Investing in Nature as the true engine of our economy: A 10-point Action Plan for a Circular Bioeconomy of Wellbeing. Knowledge to Action 02. European Forest Institute.
Pan, Y. et al., 2016: Research progress in artificial upwelling and its potential environmental effects. Sci. China Earth Sci. , 59(2) , 236–248, doi:10.1007/s11430-015-5195-2.
Pardoe, J. et al., 2018: Climate change and the water–energy–food nexus: insights from policy and practice in Tanzania. Clim. Policy, 18(7) , 863–877, doi:10.1080/14693062.2017.1386082.
Paré, D., E. Thiffault, G. Cyr, and L. Guindon, 2016: Quantifying Forest Biomass Mobilisation Potential in the Boreal and Temperate Biomes. In: Mobilisation of Forest Bioenergy in the Boreal and TemperateBiomes [Thiffault, E., Smith, C.T., Junginger, M., and Berndes, G. (eds.)]., 36–49, doi:10.1016/B978-0-12-804514-5.00003-2.
Park, H. and S. Yu, 2019: Policy review: Implication of tax on sugar-sweetened beverages for reducing obesity and improving heart health. Heal. Policy Technol. , 8(1) , 92–95, doi:10.1016/j.hlpt.2018.12.002.
Parker, R.W.R. et al., 2018: Fuel use and greenhouse gas emissions of world fisheries. Nat. Clim. Change, 8(4) , 333–337, doi:10.1038/s41558-018-0117-x.
Parodi, A. et al., 2018: The potential of future foods for sustainable and healthy diets. Nat. Sustain. , 1(12) , 782–789, doi:10.1038/s41893-018-0189-7.
Parrado, R. and E. De Cian, 2014: Technology spillovers embodied in international trade: Intertemporal, regional and sectoral effects in a global CGE framework. Energy Econ. , 41, 76–89, doi:10.1016/j.eneco.2013.10.016.
Parsaee, M., M. Kiani Deh Kiani, and K. Karimi, 2019: A review of biogas production from sugarcane vinasse. Biomass and Bioenergy, 122, 117–125, doi.org/10.1016/j.biombioe.2019.01.034.
Patrizio, P. et al., 2018: Reducing US Coal Emissions Can Boost Employment. Joule, 2(12) , 2633–2648, doi:10.1016/J.JOULE.2018.10.004.
Pattberg, P., S. Chan, L. Sanderink, and O. Widerberg, 2018: Linkages: Understanding their Role in Polycentric Governance. In: Governing Climate Change: Polycentricity in Action?[Jordan, A., D. Huitema, H. Van Asselt, and J. Forster, (eds.)], Cambridge University Press, Cambridge, UK, pp. 169–187.
Patterson, G.T., L.F. Thomas, L.A. Coyne, and J. Rushton, 2020: Moving health to the heart of agri-food policies; mitigating risk from our food systems. Glob. Food Sec. , 26 (August), 100424, doi:10.1016/j.gfs.2020.100424.
Paul, K.I. et al., 2016: Managing reforestation to sequester carbon, increase biodiversity potential and minimize loss of agricultural land. Land use policy, 51, 135–149, doi:10.1016/j.landusepol.2015.10.027.
Pazienza, P., 2019: The impact of FDI in the OECD manufacturing sector on CO2 emission: Evidence and policy issues. Environ. Impact Assess. Rev. , 77, 60–68, doi.org/10.1016/j.eiar.2019.04.002.
Pegg, S., 2006: Mining and poverty reduction: Transforming rhetoric into reality. J. Clean. Prod. , 14(3–4) , 376–387, doi:10.1016/j.jclepro.2004.06.006.
Peñalver, R. et al., 2020: Seaweeds as a functional ingredient for a healthy diet. Mar. Drugs, 18(6) , 1–27, doi:10.3390/md18060301.
Pendrill, F. et al., 2019: Agricultural and forestry trade drives large share of tropical deforestation emissions. Glob. Environ. Change, 56 (December 2018), 1–10, doi:10.1016/j.gloenvcha.2019.03.002.
Penne, T. and T. Goedemé, 2020: Can low-income households afford a healthy diet? Insufficient income as a driver of food insecurity in Europe. Food Policy, 99 (September), 101978, doi:10.1016/j.foodpol.2020.101978.
Pereira, L.M., S. Drimie, K. Maciejewski, P.B. Tonissen, and R. Biggs, 2020: Food system transformation: Integrating a political–economy and social–ecological approach to regime shifts. Int. J. Environ. Res. Public Health, 17(4) , doi:10.3390/ijerph17041313.
Pérez-Marin, A.M. et al., 2017: Agroecological and social transformations for coexistence with semi-aridity in Brazil. Sustainability, 9(6) , doi:10.3390/su9060990.
Petersen, T., M. Hartmann, and S. Hirsch, 2021: Which meat (substitute) to buy? Is front of package information reliable to identify the healthier and more natural choice?Food Qual. Prefer. , 94 (November 2020), 104298, doi:10.1016/j.foodqual.2021.104298.
Pettersson, M., L. Björnsson, and P. Börjesson, 2020: Recycling of ash from co-incineration of waste wood and forest fuels: An overlooked challenge in a circular bioenergy system. Biomass and Bioenergy, 142, 105713, doi:10.1016/J.BIOMBIOE.2020.105713.
Pikaar, I. et al., 2018: Carbon emission avoidance and capture by producing in-reactor microbial biomass based food, feed and slow release fertilizer: Potentials and limitations. Sci. Total Environ. , 644, 1525–1530, doi:10.1016/j.scitotenv.2018.07.089.
Pirard, R. et al., 2020: Corporate ownership and dominance of Indonesia’s palm oil supply chains. INFOBRIEF 9, Trase, (January), 7 pp.
Pisanello, D. and L. Ferraris, 2018: Ban on Designating Plant Products as Dairy: Between Market Regulation and Over-Protection of the Consumer. Eur. J. Risk Regul. , 9(1) , 170–176, doi:10.1017/err.2018.4.
Poff, N.L.R. and J.C. Schmidt, 2016: How dams can go with the flow. Science, 353(6304) , 1099–1100, doi:10.1126/science.aah4926.
Pollitt, H., K. Neuhoff, and X. Lin, 2020: The impact of implementing a consumption charge on carbon-intensive materials in Europe. Clim. Policy, 20 (sup1), S74–S89, doi:10.1080/14693062.2019.1605969.
Ponisio, L.C. et al., 2015: Diversification practices reduce organic to conventional yield gap. Proc. R. Soc. B Biol. Sci. , 282, 20141396, doi:10.1098/rspb.2014.1396.
Poore, J. and T. Nemecek, 2018a: Reducing food’s environmental impacts through producers and consumers. Science, 360(6392) , 987–992, doi:10.1126/science.aaq0216.
Popkin, B.M. and T. Reardon, 2018: Obesity and the food system transformation in Latin America. Obes. Rev. , 19(8) , 1028–1064, doi:10.1111/obr.12694.
Popp, A. et al., 2017: Land-use futures in the shared socio-economic pathways. Glob. Environ. Change, 42, 331–345, doi:10.1016/j.gloenvcha.2016.10.002.
Pörtner, H.-O. et al., 2021: Scientific outcome of the IPBES-IPCC co-sponsored workshop on biodiversity and climate change (Version 5). IPBES secretariat, Bonn, Germany.
Post, M.J., 2012: Cultured meat from stem cells: challenges and prospects. Meat Sci. , 92(3) , 297–301, doi:10.1016/j.meatsci.2012.04.008.
Post, M.J. et al., 2020: Scientific, sustainability and regulatory challenges of cultured meat. Nat. Food, 1(7) , 403–415, doi:10.1038/s43016-020-0112-z.
Postigo, J.C. and K.R. Young, 2021: Preparing for a diminished cryosphere. Sustain. Sci. 2021, 16(6) , 1–4, doi:10.1007/S11625-021-01023-9.
Poyatos-Racionero, E., J.V. Ros-Lis, J.L. Vivancos, and R. Martínez-Máñez, 2018: Recent advances on intelligent packaging as tools to reduce food waste. J. Clean. Prod. , 172, 3398–3409, doi:10.1016/j.jclepro.2017.11.075.
Pozo, C., Á. Galán-Martín, D.M. Reiner, N. Mac Dowell, and G. Guillén-Gosálbez, 2020: Equity in allocating carbon dioxide removal quotas. Nat. Clim. Change, 10(7) , 640–646, doi:10.1038/s41558-020-0802-4.
Pradhan, P., M.K.B. Lüdeke, D.E. Reusser, and J.P. Kropp, 2014: Food Self-Sufficiency across scales: How local can we go?Environ. Sci. Technol. , 48(16) , 9463–9470, doi:10.1021/es5005939.
Prudhomme, R., T. Brunelle, P. Dumas, A. Le Moing, and X. Zhang, 2020: Assessing the impact of increased legume production in Europe on global agricultural emissions. Reg. Environ. Change, 20(3) , 91, doi:10.1007/s10113-020-01651-4.
Pryor, S.C., R.J. Barthelmie, and T.J. Shepherd, 2020: 20% of US electricity from wind will have limited impacts on system efficiency and regional climate. Sci. Reports 2020 101, 10(1) , 1–14, doi:10.1038/s41598-019-57371-1.
Purohit, P. and L. Höglund-Isaksson, 2017: Global emissions of fluorinated greenhouse gases 2005–2050 with abatement potentials and costs. Atmos. Chem. Phys. , 17(4) , 2795–2816, doi:10.5194/acp-17-2795-2017.
Qin, Z. et al., 2018: Biomass and biofuels in China: Toward bioenergy resource potentials and their impacts on the environment. Renew. Sustain. Energy Rev. , 82, 2387–2400, doi:10.1016/J.RSER.2017.08.073.
Quin, P.R. et al., 2014: Oil mallee biochar improves soil structural properties-A study with x-ray micro-CT. Agric. Ecosyst. Environ. , 191, 142–149, doi:10.1016/j.agee.2014.03.022.
Raheem, D. et al., 2019a: Traditional consumption of and rearing edible insects in Africa, Asia and Europe. Crit. Rev. Food Sci. Nutr. , 59(14) , 2169–2188, doi:10.1080/10408398.2018.1440191.
Raheem, D. et al., 2019b: Entomophagy: Nutritional, ecological, safety and legislation aspects. Food Res. Int. , 126 (September), 108672, doi:10.1016/j.foodres.2019.108672.
Rahnama Mobarakeh, M., M. Santos Silva, and T. Kienberger, 2021: Pulp and Paper Industry: Decarbonisation Technology Assessment to Reach CO2 Neutral Emissions—An Austrian Case Study. Energies, 14(4) , 1161, doi:10.3390/EN14041161.
Rajamani, L. et al., 2021: National ‘fair shares’ in reducing greenhouse gas emissions within the principled framework of international environmental law. Clim. Policy, 21(8) , 983–1004, doi:10.1080/14693062.2021.1970504.
Ranjbaran, P., H. Yousefi, G.B. Gharehpetian, and F.R. Astaraei, 2019: A review on floating photovoltaic (FPV)power generation units. Renew. Sustain. Energy Rev. , 110, 332–347, doi:10.1016/j.rser.2019.05.015.
Raptis, C.E., M.T.H. van Vliet, and S. Pfister, 2016: Global thermal pollution of rivers from thermoelectric power plants. Environ. Res. Lett. , 11(10) , 104011, doi:10.1088/1748-9326/11/10/104011.
Rau, G.H., Willauer, H.D., Ren, Z.J., 2018: The global potential for converting renewable electricity to negative-CO2-emissions hydrogen. Nat. Clim. Change, 8, 621–625.
Rau, G.H., 2008: Electrochemical splitting of calcium carbonate to increase solution alkalinity: Implications for mitigation of carbon dioxide and ocean acidity. Environ. Sci. Technol. , 42(23) , 8935–8940, doi:10.1021/es800366q.
Rau, G.H., 2011: CO2 mitigation via capture and chemical conversion in seawater. Env. Sci Technol, 45(3) , 1088–1092, doi:10.1021/es102671x.
Rau, G.H. and K. Caldeira, 1999: Enhanced carbonate dissolution: a means of sequestering waste CO2 as ocean bicarbonate. Energy Convers. Manag. , 40(17) , 1803–1813, doi:10.1016/S0196-8904(99)00071-0.
Rau, G.H., E.L. McLeod, and O. Hoegh-Guldberg, 2012: The need for new ocean conservation strategies in a high-carbon dioxide world. Nat. Clim. Change, 2(10) , 720–724, doi:10.1038/Nclimate1555.
Rau, G.H. et al., 2013: Direct electrolytic dissolution of silicate minerals for air CO2 mitigation and carbon-negative H2 production. Proc. Natl. Acad. Sci. , 110(25) , 10095–10100, doi:10.1073/pnas.1222358110.
Rausch, S. and V.J. Karplus, 2014: Markets versus Regulation: The Efficiency and Distributional Impacts of U.S. Climate Policy Proposals. Joint Program Report Series Report 263, Massachusetts Institute of Technology, Cambridge, MA, USA, 32 pp. https://globalchange.mit.edu/publication/15897 (Accessed December 3, 2019).
Rausch, S. and J. Reilly, 2015: Carbon Taxes, Deficits, and Energy Policy Interactions. Natl. Tax J. , 68(1) , 157–178.
Razzaghi, F., P.B. Obour, and E. Arthur, 2020: Does biochar improve soil water retention? A systematic review and meta-analysis. Geoderma, 361, 114055, doi:10.1016/J.GEODERMA.2019.114055.
Realmonte, G. et al., 2019: An inter-model assessment of the role of direct air capture in deep mitigation pathways. Nat. Commun. , 10(1) , 1–12, doi:10.1038/s41467-019-10842-5.
Reardon, T. et al., 2019: Rapid transformation of food systems in developing regions: Highlighting the role of agricultural research & innovations. Agric. Syst. , 172 (December 2017), 47–59, doi:10.1016/j.agsy.2018.01.022.
Reed, J., J. Van Vianen, E.L. Deakin, J. Barlow, and T. Sunderland, 2016: Integrated landscape approaches to managing social and environmental issues in the tropics: learning from the past to guide the future. Glob. Chang. Biol. , 22(7) , 2540–2554, doi:10.1111/gcb.13284.
Renard, D. and D. Tilman, 2019: National food production stabilized by crop diversity. Nature, 571, 257–260, doi:10.1038/s41586-019-1316-y.
Renforth, P., Jenkins, B.G., Kruger, T., 2013: Engineering challenges of ocean liming. Energy, 60, 442–452, doi:10.1016/j.energy.2013.08.006.
Renforth, P. and Kruger, T., 2013: Coupling Mineral Carbonation and Ocean Liming. Energy Fuels, 27(8) , 4199–4207, doi:10.1021/ef302030w.
Renforth, P., 2012: The potential of enhanced weathering in the UK. Int. J. Greenh. Gas Control, 10, 229–243, doi:10.1016/j.ijggc.2012.06.011.
Renforth, P. and G. Henderson, 2017: Assessing ocean alkalinity for carbon sequestration. Rev. Geophys. , 55(3) , 636–674, doi:10.1002/2016RG000533.
Renforth, P., P.A.E. Pogge von Strandmann, and G.M. Henderson, 2015: The dissolution of olivine added to soil: Implications for enhanced weathering. Appl. Geochemistry, 61, 109–118, doi:10.1016/J.APGEOCHEM.2015.05.016.
Ricci, A. et al., 2017: Guidance on the requirements for the development of microbiological criteria. EFSA J. , 15(11) , doi:10.2903/j.efsa.2017.5052.
Rickels, W., C. Merk, F. Reith, D.P. Keller, and A. Oschlies, 2019: (Mis)conceptions about modeling of negative emissions technologies. Environ. Res. Lett. , 14(10) , 104004, doi:10.1088/1748-9326/ab3ab4.
Rickels, W., A. Proelß, O. Geden, J. Burhenne, and M. Fridahl, 2021: Integrating Carbon Dioxide Removal Into European Emissions Trading. Front. Clim. , 3, 62, doi:10.3389/fclim.2021.690023.
Rinke Dias de Souza, N., T. Lopes Junqueira, and O. Cavalett, 2021: Opportunities and challenges for bioenergy-livestock integrated systems in Brazil. Ind. Crops Prod. , 173, 114091, doi:10.1016/J.INDCROP.2021.114091.
Rischer, H., G.R. Szilvay, and K.M. Oksman-Caldentey, 2020: Cellular agriculture — industrial biotechnology for food and materials. Curr. Opin. Biotechnol. , 61, 128–134, doi:10.1016/j.copbio.2019.12.003.
Ritchie, H., D.S. Reay, and P. Higgins, 2018: The impact of global dietary guidelines on climate change. Glob. Environ. Change, 49 (January), 46–55, doi:10.1016/j.gloenvcha.2018.02.005.
Roberts, D.A., N.A. Paul, S.A. Dworjanyn, M.I. Bird, and R. de Nys, 2015: Biochar from commercially cultivated seaweed for soil amelioration. Sci. Rep. , 5(1) , 9665, doi:10.1038/srep09665.
Rogelj, J., D. Shindell, K. Jiang, S. Fifita, P. Forster, V. Ginzburg, C. Handa, H. Kheshgi, S. Kobayashi, E. Kriegler, L. Mundaca, R. Séférian, and M.V. Vilariño, 2018: Mitigation pathways compatible with 1.5°C in the context of sustainable development. In: Global warming of 1.5°C. An IPCC Special Report on the impacts of global warming of 1.5°C above pre-industrial levels and related global greenhouse gas emission pathways, in the context of strengthening the global response to the threat of climate change, sustainable development, and efforts to eradicate poverty[Masson-Delmotte, V., P. Zhai, H.-O. Pörtner, D. Roberts, J. Skea, P.R. Shukla, A. Pirani, W. Moufouma-Okia, C. Péan, R. Pidcock, S. Connors, J.B.R. Matthews, Y. Chen, X. Zhou, M.I. Gomis, E. Lonnoy, T. Maycock, M. Tignor, and T. Waterfield (eds.)]. Cambridge University Press, Cambridge, UK, and New York, NY, USA.
Rogelj, J., O. Geden, A. Cowie, and A. Reisinger, 2021: Three ways to improve net-zero emissions targets. Nature, 591, 365–368, doi:10.1038/d41586-021-00662-3.
Röös, E., M. Patel, J. Spångberg, G. Carlsson, and L. Rydhmer, 2016: Limiting livestock production to pasture and by-products in a search for sustainable diets. Food Policy, 58, 1–13, doi:10.1016/j.foodpol.2015.10.008.
Rose, D., 2018: Environmental nudges to reduce meat demand. Lancet Planet. Heal. , 2(9) , e374–e375, doi:10.1016/S2542-5196(18)30185-2.
Rose, S.K. et al., 2020: An overview of the Energy Modeling Forum 33rd study: assessing large-scale global bioenergy deployment for managing climate change. Clim. Change, 163(3) , 1539–1551, doi:10.1007/s10584-020-02945-6.
Rosenzweig, C. et al., 2020a: Food system approach offers new opportunities for climate change responses. Nat. Clim. Change, 1, 94–97.
Rosenzweig, C. et al., 2020b: Climate change responses benefit from a global food system approach. Nat. Food, 1(2) , 94–97, doi:10.1038/s43016-020-0031-z.
Royal Society, and Royal Academy of Engineering, 2018: Greenhouse Gas Removal. Royal Society, London, UK, 134 pp.
Rubio, N.R., K.D. Fish, B.A. Trimmer, and D.L. Kaplan, 2019: In Vitro Insect Muscle for Tissue Engineering Applications. ACS Biomater. Sci. Eng. , 5(2) , 1071–1082, doi:10.1021/acsbiomaterials.8b01261.
Rueda, O., J.M. Mogollón, A. Tukker, and L. Scherer, 2021: Negative-emissions technology portfolios to meet the 1.5°C target. Glob. Environ. Change, 67, 102238, doi:10.1016/j.gloenvcha.2021.102238.
Rufí-Salís, M., M.J. Calvo, A. Petit-Boix, G. Villalba, and X. Gabarrell, 2020: Exploring nutrient recovery from hydroponics in urban agriculture: An environmental assessment. Resour. Conserv. Recycl. , 155 (November 2019), 104683, doi:10.1016/j.resconrec.2020.104683.
Runting, R.K. et al., 2019: Larger gains from improved management over sparing–sharing for tropical forests. Nat. Sustain. , 2(1) , 53–61, doi:10.1038/s41893-018-0203-0.
Russell, A.E. and B.M. Kumar, 2017: Forestry for a Low-Carbon Future: Integrating Forests and Wood Products Into Climate Change Strategies. Environ. Sci. Policy Sustain. Dev. , 59(2) , 16–23, doi:10.1080/00139157.2017.1274580.
Ryaboshapko, A.G. and A.P. Revokatova, 2015: A potential role of the negative emission of carbon dioxide in solving the climate problem. Russ. Meteorol. Hydrol. , 40(7) , 443–455, doi:10.3103/S106837391507002X.
Ryan, D., 2015: From commitment to action: a literature review on climate policy implementation at city level. Clim. Change, 131(4) , 519–529, doi:10.1007/s10584-015-1402-6.
Salim, H.K., R.A. Stewart, O. Sahin, and M. Dudley, 2019: Drivers, barriers and enablers to end-of-life management of solar photovoltaic and battery energy storage systems: A systematic literature review. J. Clean. Prod. , 211, 537–554, doi:10.1016/j.jclepro.2018.11.229.
Säll, S., 2018: Environmental food taxes and inequalities: Simulation of a meat tax in Sweden. Food Policy, 74 (June 2017), 147–153, doi:10.1016/j.foodpol.2017.12.007.
Samant, S.S. and H.S. Seo, 2016: Effects of label understanding level on consumers’ visual attention toward sustainability and process-related label claims found on chicken meat products. Food Qual. Prefer. , 50, 48–56, doi:10.1016/j.foodqual.2016.01.002.
Sanchez, D.L., N. Johnson, S.T. McCoy, P.A. Turner, and K.J. Mach, 2018: Near-term deployment of carbon capture and sequestration from biorefineries in the United States. Proc. Natl. Acad. Sci. U. S. A. , 115(19) , 4875–4880, doi:10.1073/pnas.1719695115.
Sandalow, D., J. Friedmann, C. McCormick, and S. McCoy, 2018: Direct Air Capture of Carbon Dioxide: ICEF Roadmap 2018. Innovation for Cool Earth Forum, 43 pp.
Sandström, V. et al., 2018: The role of trade in the greenhouse gas footprints of EU diets. Glob. Food Sec. , 19 (May), 48–55, doi:10.1016/j.gfs.2018.08.007.
Santo, R. and A. Moragues-Faus, 2019: Towards a trans-local food governance: Exploring the transformative capacity of food policy assemblages in the US and UK. Geoforum, 98, 75–87, doi.org/10.1016/j.geoforum.2018.10.002.
Santo, R.E. et al., 2020: Considering Plant-Based Meat Substitutes and Cell-Based Meats: A Public Health and Food Systems Perspective. Front. Sustain. Food Syst. , 4 (August), 1–23, doi:10.3389/fsufs.2020.00134.
Sanz-Lazaro, C. and P. Sanchez-Jerez, 2020: Regional Integrated Multi-Trophic Aquaculture (RIMTA): Spatially separated, ecologically linked. J. Environ. Manage. , 271 (July 2019), 110921, doi:10.1016/j.jenvman.2020.110921.
Sarink, D. et al., 2016: The impact of menu energy labelling across socioeconomic groups: A systematic review. Appetite, 99, 59–75, doi:10.1016/j.appet.2015.12.022.
Sayer, J.A. et al., 2017: Measuring the effectiveness of landscape approaches to conservation and development. Sustain. Sci. , 12(3) , 465–476, doi:10.1007/s11625-016-0415-z.
Schade, S., G.I. Stangl, and T. Meier, 2020: Distinct microalgae species for food – Part 2: Comparative life cycle assessment of microalgae and fish for eicosapentaenoic acid (EPA), docosahexaenoic acid (DHA), and protein. J. Appl. Phycol. , 32, 2997–3013.
Schebesta, H. and J.J.L. Candel, 2020: Game-changing potential of the EU’s Farm to Fork Strategy. Nat. Food, 1(10) , 586–588, doi:10.1038/s43016-020-00166-9.
Schenuit, F. et al., 2021: Carbon Dioxide Removal Policy in the Making: Assessing Developments in 9 OECD Cases. Front. Clim. , 3, 638805, doi:10.3389/fclim.2021.638805.
Scherer, L., and S. Pfister, 2016a: Hydropower’s Biogenic Carbon Footprint. PLoS One, 11(9) , e0161947, doi:10.1371/journal.pone.0161947.
Scherer, L. and S. Pfister, 2016b: Global water footprint assessment of hydropower. Renew. Energy, 99, 711–720, doi:10.1016/j.renene.2016.07.021.
Schleicher, J. et al., 2019: Protecting half of the planet could directly affect over one billion people. Nat. Sustain. , 2(12) , 1094–1096, doi:10.1038/s41893-019-0423-y.
Schmidinger, K. and E. Stehfest, 2012: Including CO2 implications of land occupation in LCAs—method and example for livestock products. Int. J. Life Cycle Assess. , 17, 962–972, doi:10.1007/s11367-012-0434-7.
Schmidt, H.-P. et al., 2021: Biochar in agriculture – A systematic review of 26 global meta-analyses. GCB Bioenergy, 13(11) , 1708–1730, doi:10.1111/GCBB.12889.
Schmidt, L.M., L.F. Andersen, C. Dieckmann, A. Lamp, and M. Kaltschmitt, 2019: The Biorefinery Approach. In: Energy from Organic Materials (Biomass) , Springer New York, New York, NY, USA, pp. 1383–1412.
Schösler, H. and J. De Boer, 2018: Towards more sustainable diets: Insights from the food philosophies of “gourmets” and their relevance for policy strategies. Appetite, 127 (April), 59–68, doi:10.1016/j.appet.2018.04.022.
Schuiling, R.D. and P. Krijgsman, 2006: Enhanced Weathering: An Effective and Cheap Tool to Sequester CO2. Clim. Change, 74(1) , 349–354, doi:10.1007/s10584-005-3485-y.
Schulze, K., Ž. Malek, and P.H. Verburg, 2020: The Impact of Accounting for Future Wood Production in Global Vertebrate Biodiversity Assessments. Environ. Manag. 2020 663, 66(3) , 460–475, doi:10.1007/S00267-020-01322-4.
Schulze, K., Ž. Malek, and P.H. Verburg, 2021: How will land degradation neutrality change future land system patterns? A scenario simulation study. Environ. Sci. Policy, 124, 254–266, doi:10.1016/J.ENVSCI.2021.06.024.
Searchinger, T., R. Waite, C. Hanson and J. Ranganathan, 2018a: Creating a sustainable food future: A menu of solutions to feed nearly 10 billion people by 2050 (Synthesis Report). World Resources Institute, Washington, DC, USA, 96 pp.
Searchinger, T.D., S. Wirsenius, T. Beringer, and P. Dumas, 2018b: Assessing the efficiency of changes in land use for mitigating climate change. Nature, 564(7735) , 249–253, doi:10.1038/s41586-018-0757-z.
Seddon, J., S. Doyle, M. Bourne, R. Maccallum, and S. Briggs, 2009: Biodiversity benefits of alley farming with old man saltbush in central western New South Wales. Anim. Prod. Sci. , 49(10) , 860, doi:10.1071/EA08280.
Sekera, J. and A. Lichtenberger, 2020: Assessing Carbon Capture: Public Policy, Science, and Societal Need. Biophys. Econ. Sustain. , 5(3) , 14, doi:10.1007/s41247-020-00080-5.
Semba, R.D. et al., 2020: Adoption of the ‘planetary health diet’ has different impacts on countries’ greenhouse gas emissions. Nat. Food, 1(8) , 481–484, doi:10.1038/s43016-020-0128-4.
Semba, R.D., R. Ramsing, N. Rahman, K. Kraemer, and M.W. Bloem, 2021: Legumes as a sustainable source of protein in human diets. Glob. Food Sec. , 28 (June 2020), 100520, doi:10.1016/j.gfs.2021.100520.
Sequeira, T.N. and M.S. Santos, 2018: Renewable energy and politics: A systematic review and new evidence. J. Clean. Prod. , 192, 553–568, doi.org/10.1016/j.jclepro.2018.04.190.
Sesma Martín, D. and M. del M. Rubio-Varas, 2017: Freshwater for Cooling Needs: A Long-Run Approach to the Nuclear Water Footprint in Spain. Ecol. Econ. , 140, 146–156, doi:10.1016/J.ECOLECON.2017.04.032.
Seufert, V. and N. Ramakutty, 2017: Many shades of gray - The context-dependent perfornance of organic agriculture. Sci. Adv. , 3 (e1602638 NV-3).
Seymour, F. and N.L. Harris, 2019: Reducing tropical deforestation. Science, 365(6455) , 756–757, doi:10.1126/science.aax8546.
Shahbaz, M., S. Nasreen, F. Abbas, and O. Anis, 2015: Does foreign direct investment impede environmental quality in high-, middle-, and low-income countries?Energy Econ. , 51, 275–287, doi.org/10.1016/j.eneco.2015.06.014.
Shahid, M., B. Neal, and A. Jones, 2020: Uptake of Australia’s Health Star Rating System 2014–2019. Nutr. 2020, Vol. 12, Page 1791, 12(6) , 1791, doi:10.3390/NU12061791.
Shahsavari, A. and M. Akbari, 2018: Potential of solar energy in developing countries for reducing energy-related emissions. Renew. Sustain. Energy Rev. , 90 (June 2017), 275–291, doi:10.1016/j.rser.2018.03.065.
Shamshiri, R.R. et al., 2018: Advances in greenhouse automation and controlled environment agriculture: A transition to plant factories and urban agriculture. Int. J. Agric. Biol. Eng. , 11(1) , 1–22, doi:10.25165/j.ijabe.20181101.3210.
Shangguan, S. et al., 2019: A Meta-Analysis of Food Labeling Effects on Consumer Diet Behaviors and Industry Practices. Am. J. Prev. Med. , 56(2) , 300–314, doi:10.1016/j.amepre.2018.09.024.
Shayegh, S., V. Bosetti, and M. Tavoni, 2021: Future Prospects of Direct Air Capture Technologies: Insights From an Expert Elicitation Survey. Front. Clim. , 3, 630893, doi:10.3389/fclim.2021.630893.
Shiraki, H. and M. Sugiyama, 2020: Back to the basic: toward improvement of technoeconomic representation in integrated assessment models. Clim. Change, 162(1) , 13–24, doi:10.1007/s10584-020-02731-4.
Shrum, T.R. et al., 2020: Behavioural frameworks to understand public perceptions of and risk response to carbon dioxide removal. Interface Focus, 10(5) , 20200002, doi:10.1098/rsfs.2020.0002.
Shue, H., 2018: Mitigation gambles: uncertainty, urgency and the last gamble possible. Philos. Trans. R. Soc. A Math. Phys. Eng. Sci. , 376(2119) , 20170105, doi:10.1098/rsta.2017.0105.
Sica, D., O. Malandrino, S. Supino, M. Testa, and M.C. Lucchetti, 2018: Management of end-of-life photovoltaic panels as a step towards a circular economy. Renew. Sustain. Energy Rev. , 82, 2934–2945, doi:10.1016/j.rser.2017.10.039.
Siegel, D.A., T. Devries, S.C. Doney, and T. Bell, 2021: Assessing the sequestration time scales of some ocean-based carbon dioxide reduction strategies. Environ. Res. Lett. , 16(10) , 104003, doi:10.1088/1748-9326/AC0BE0.
Siegrist, M. and C. Hartmann, 2020: Consumer acceptance of novel food technologies. Nat. Food, 1 (June), 343–350, doi:10.1038/s43016-020-0094-x.
Siikamäki, J., J.N. Sanchirico, and S.L. Jardine, 2012: Global economic potential for reducing carbon dioxide emissions from mangrove loss. Proc. Natl. Acad. Sci. , 109(36) , 14369–14374, doi:10.1073/PNAS.1200519109.
Sillman, J. et al., 2019: Bacterial protein for food and feed generated via renewable energy and direct air capture of CO2: Can it reduce land and water use?Glob. Food Sec. , 22 (September), 25–32, doi:10.1016/j.gfs.2019.09.007.
Sills, E.O. et al., 2017: Building the evidence base for REDD+: Study design and methods for evaluating the impacts of conservation interventions on local well-being. Glob. Environ. Change, 43, 148–160, doi.org/10.1016/j.gloenvcha.2017.02.002.
Silva, A.F.R., Y.L. Brasil, K. Koch, and M.C.S. Amaral, 2021: Resource recovery from sugarcane vinasse by anaerobic digestion – A review. J. Environ. Manage. , 295, 113137, doi:10.1016/J.JENVMAN.2021.113137.
Silva, V.L. and N. Sanjuán, 2019: Opening up the black box: A systematic literature review of life cycle assessment in alternative food processing technologies. J. Food Eng. , 250 (June 2018), 33–45, doi:10.1016/j.jfoodeng.2019.01.010.
Silver, M.W. et al., 2010: Toxic diatoms and domoic acid in natural and iron enriched waters of the oceanic Pacific. Proc. Natl. Acad. Sci. , 107(48) , 20762–20767, doi:10.1073/pnas.1006968107.
Simsa, R. et al., 2019: Extracellular heme proteins influence bovine myosatellite cell proliferation and the color of cell-based meat. Foods, 8(10) , doi:10.3390/foods8100521.
Sinclair, F. et al., 2019: Background Paper the Contribution of Agroecological Approaches To Realizing Climate-Resilient Agriculture. Global Commission on Adaptation, Rotterdam, Netherlands, and Washington, DC, USA, 12 pp. www.gca.org/wp-content/uploads/2020/12/TheContributionsOfAgroecologicalApproaches.pdf .
Singh, A., N. Winchester, and V.J. Karplus, 2019: Evaluating India’s climate targets: the implications of economy-wide and sector specific policies. Clim. Chang. Econ. , 10(03) , doi:10.1142/S201000781950009X. Singh, B.P., B.J. Hatton, B. Singh, A.L. Cowie, and A. Kathuria, 2010: Influence of Biochars on Nitrous Oxide Emission and Nitrogen Leaching from Two Contrasting Soils. J. Environ. Qual. , 39(4) , 1224, doi:10.2134/jeq2009.0138.
Singh, B.P., A.L. Cowie, and R.J. Smernik, 2012: Biochar Carbon Stability in a Clayey Soil As a Function of Feedstock and Pyrolysis Temperature. Environ. Sci. Technol. , 46(21) , 11770–11778, doi:10.1021/es302545b.
Singh, P.K. and H. Chudasama, 2021: Pathways for climate change adaptations in arid and semi-arid regions. J. Clean. Prod. , 284, 124744, doi:10.1016/J.JCLEPRO.2020.124744.
Skuce, P.J., E.R. Morgan, J. van Dijk, and M. Mitchell, 2013: Animal health aspects of adaptation to climate change: beating the heat and parasites in a warming Europe. Animal, 7 Suppl 2, 333–345, doi:10.1017/S175173111300075X. Slade, P., 2018: If you build it, will they eat it? Consumer preferences for plant-based and cultured meat burgers. Appetite, 125, 428–437, doi:10.1016/j.appet.2018.02.030.
Smetana, S., A. Mathys, A. Knoch, and V. Heinz, 2015: Meat alternatives: life cycle assessment of most known meat substitutes. Int. J. Life Cycle Assess. , 20(9) , 1254–1267, doi:10.1007/s11367-015-0931-6.
Smil, V., 2015: Power density: a key to understanding energy sources and uses. MIT Press, Cambridge, MA, USA, 306 pp.
Smith, P., M. Bustamante, H. Ahammad, H. Clark, H. Dong, E.A. Elsiddig, H. Haberl, R. Harper, J. House, M. Jafari, O. Masera, C. Mbow, N.H. Ravindranath, C.W. Rice, C. Robledo Abad, A. Romanovskaya, F. Sperling, and F. Tubiello, 2014: Agriculture, Forestry and Other Land Use (AFOLU). In: Climate Change 2014: Mitigation of Climate Change. Contribution of Working Group III to the Fifth Assessment Report of the Intergovernmental Panel on Climate Change[Edenhofer, O., R. Pichs-Madruga, Y. Sokona, E. Farahani, S. Kadner, K. Seyboth, A. Adler, I. Baum, S. Brunner, P. Eickemeier, B. Kriemann, J. Savolainen, S. Schlömer, C. von Stechow, T. Zwickel and J.C. Minx (eds.)]. Cambridge University Press, Cambridge, UK and New York, NY, USA, pp. 811–922.
Smith, P. et al., 2016: Biophysical and economic limits to negative CO2 emissions. Nat. Clim. Change, 6(1) , 42–50, doi:10.1038/nclimate2870.
Smith, P. et al., 2017: Bridging the gap – Carbon dioxide removal. In: The UNEP Emissions Gap Report , United Nations Environment Programme, Nairobi, Kenya, pp. 58–66.
Smith, P. et al., 2019a: Impacts of Land-Based Greenhouse Gas Removal Options on Ecosystem Services and the United Nations Sustainable Development Goals. Annu. Rev. Environ. Resour. , 44(1) , 1–32, doi:10.1146/annurev-environ-101718-033129.
Smith, P., J. Nkem, K. Calvin, D. Campbell, F. Cherubini, G. Grassi, V. Korotkov, A.L. Hoang, S. Lwasa, P. McElwee, E. Nkonya, N. Saigusa, J.-F. Soussana and M.A. Taboada., 2019b: Interlinkages between Desertification, Land Degradation, Food Security and GHG fluxes: Synergies, Trade-offs and Integrated Response Options. In: Climate Change and Land: an IPCC special report on climate change, desertification, land degradation, sustainable land management, food security, and greenhouse gas fluxes in terrestrial ecosystems. [P.R. Shukla, J. Skea, E. Calvo Buendia, V. Masson-Delmotte, H.- O. Portner, D. C. Roberts, P. Zhai, R. Slade, S. Connors, R. van Diemen, M. Ferrat, E. Haughey, S. Luz, S. Neogi, M. Pathak, J. Petzold, J. Portugal Pereira, P. Vyas, E. Huntley, K. Kissick, M. Belkacemi and J. Malley, (eds.)]. Cambridge University Press, Cambridge, UK, and New York, NY, USA.
Smith, P. et al., 2020: Which practices co-deliver food security, climate change mitigation and adaptation, and combat land degradation and desertification?Glob. Chang. Biol. , 26(3) , 1532–1575, doi:10.1111/gcb.14878.
Smith, S.M., 2021: A case for transparent net-zero carbon targets. Commun. Earth Environ. , 2(1) , 24, doi:10.1038/s43247-021-00095-w.
Socolow, R. et al., 2011: Direct Air Capture of CO2 with Chemicals: A Technology Assessment for the APS Panel on Public Affairs. American Physical Society, 100 pp.
Solati, Z. et al., 2018: Crude protein yield and theoretical extractable true protein of potential biorefinery feedstocks. Ind. Crops Prod. , 115, 214–226, doi.org/10.1016/j.indcrop.2018.02.010.
Solazzo, E. et al., 2020: Uncertainties in the EDGAR emission inventory of greenhouse gases. Atmos. Chem. Phys. Discuss. , 2020, 1–46, doi:10.5194/acp-2020-1102.
Solomin, E., E. Sirotkin, E. Cuce, S.P. Selvanathan, and S. Kumarasamy, 2021: Hybrid Floating Solar Plant Designs: A Review. Energies 2021, Vol. 14, Page 2751, 14(10) , 2751, doi:10.3390/EN14102751.
Sonter, L., M. Dade, J. Watson, and R. Valenta, 2020a: Renewable energy production will exacerbate mining threats to biodiversity. Nat. Commun. , 11, 4174, doi:10.1038/s41467-020-17928-5.
Sonter, L.J., M.C. Dade, J.E.M. Watson, and R.K. Valenta, 2020b: Renewable energy production will exacerbate mining threats to biodiversity. Nat. Commun. 2020 111, 11(1) , 1–6, doi:10.1038/s41467-020-17928-5.
Soto Golcher, C. and I.J. Visseren-Hamakers, 2018: Framing and integration in the global forest, agriculture and climate change nexus. Environ. and Plan. C: Polit. and Sp. , 36(8) , doi:10.1177/2399654418788566.
Souza Filho, P.F., D. Andersson, J.A. Ferreira, and M.J. Taherzadeh, 2019: Mycoprotein: environmental impact and health aspects. World J. Microbiol. Biotechnol. , 35(10) , 1–8, doi:10.1007/s11274-019-2723-9.
Sovacool, B.K., 2008: The costs of failure: A preliminary assessment of major energy accidents, 1907-2007. Energy Policy, 36(5) , 1802–1820, doi:10.1016/j.enpol.2008.01.040.
Spence, E., E. Cox, and N. Pidgeon, 2021: Exploring cross-national public support for the use of enhanced weathering as a land-based carbon dioxide removal strategy. Clim. Change, 165(1) , 23, doi:10.1007/s10584-021-03050-y.
Spinelli, R., R. Visser, R. Björheden, and D. Röser, 2019: Recovering Energy Biomass in Conventional Forest Operations: a Review of Integrated Harvesting Systems. Curr. For. Reports, 5(2) , 90–100, doi:10.1007/s40725-019-00089-0.
Springmann, M., H.C.J. Godfray, M. Rayner, and P. Scarborough, 2016: Analysis and valuation of the health and climate change cobenefits of dietary change. Proc. Natl. Acad. Sci. , 113(15) , 4146–4151, doi:10.1073/pnas.1523119113.
Springmann, M. et al., 2017: Mitigation potential and global health impacts from emissions pricing of food commodities. Nat. Clim. Change, 7(1) , 69–74, doi:10.1038/nclimate3155.
Springmann, M. et al., 2018a: Options for keeping the food system within environmental limits. Nature, 562(7728) , 519–525, doi:10.1038/s41586-018-0594-0.
Springmann, M. et al., 2018b: Health and nutritional aspects of sustainable diet strategies and their association with environmental impacts: a global modelling analysis with country-level detail. Lancet Planet. Heal. , 2(10) , e451–e461, doi:10.1016/S2542-5196(18)30206-7.
Springmann, M. et al., 2020: The healthiness and sustainability of national and global food based dietary guidelines: modelling study. BMJ, 44(0) , m2322, doi:10.1136/bmj.m2322.
Springmann, M., P. Webb, M. Rayner, and P. Scarborough, 2021: The global and regional costs of healthy and sustainable dietary patterns. Lancet Planet. Heal. , 5(11) , E797–E807.
Srivastava, R.R., P. Pathak, and M. Perween, 2020: Environmental and Health Impact Due to Uranium Mining. In: Uranium in Plants and the Environment [Gupta, D.K. and C. Walther [eds.] Springer International Publishing, 69–89, doi:10.1007/978-3-030-14961-1_3.
Ssegane, H. and M.C. Negri, 2016: An integrated landscape designed for commodity and bioenergy crops for a tile-drained agricultural watershed. J. Environ. Qual. , 45(5) , 1588–1596, doi:10.2134/jeq2015.10.0518.
Ssegane, H., M.C. Negri, J. Quinn, and M. Urgun-Demirtas, 2015: Multifunctional landscapes: Site characterization and field-scale design to incorporate biomass production into an agricultural system. Biomass and Bioenergy, 80, 179–190, doi:10.1016/j.biombioe.2015.04.012.
Ssegane, H. et al., 2016: The economics of growing shrub willow as a bioenergy buffer on agricultural fields: A case study in the Midwest Corn Belt. Biofuels, Bioprod. Biorefining, 10(6) , 776–789, doi:10.1002/BBB.1679.
Staffell, I. et al., 2019: The role of hydrogen and fuel cells in the global energy system. Energy Environ. Sci. , 12(2) , 463–491, doi:10.1039/c8ee01157e.
Steinwand, M.A., and P.C. Ronald, 2020: Crop biotechnology and the future of food. Nat. Food, 1(5) , 273–283, doi:10.1038/s43016-020-0072-3.
Stenzel, F., D. Gerten, and N. Hanasaki, 2021a: Global scenarios of irrigation water abstractions for bioenergy production: A systematic review. Hydrol. Earth Syst. Sci. , 25(4) , 1711–1726, doi:10.5194/HESS-25-1711-2021.
Stenzel, F. et al., 2021b: Irrigation of biomass plantations may globally increase water stress more than climate change. Nat. Commun. 2021 121, 12(1) , 1–9, doi:10.1038/s41467-021-21640-3.
Stephens, N. et al., 2018: Bringing cultured meat to market: Technical, socio-political, and regulatory challenges in cellular agriculture. Trends Food Sci. Technol. , 78 (June 2017), 155–166, doi:10.1016/j.tifs.2018.04.010.
Stoll-Kleemann, S. and U.J. Schmidt, 2017: Reducing meat consumption in developed and transition countries to counter climate change and biodiversity loss: a review of influence factors. Reg. Environ. Change, 17(5) , 1261–1277, doi:10.1007/s10113-016-1057-5.
Storcksdieck genannt Bonsmann, S., G. Marandola, E. Ciriolo, R. Van Bavel, and J. Wollgast, 2020: Front-of-pack nutrition labelling schemes: a comprehensive review. EUR 29811 EN, Publications Office of the European Union, Luxembourg.
Strand, S.E. and G. Benford, 2009: Ocean Sequestration of Crop Residue Carbon: Recycling Fossil Fuel Carbon Back to Deep Sediments. Environ. Sci. Technol. , 43(4) , 1000–1007, doi:10.1021/es8015556.
Strapasson, A. et al., 2020: EU land use futures: modelling food, bioenergy and carbon dynamics. Energy Strateg. Rev. , 31, 100545, doi:10.1016/J.ESR.2020.100545.
Strefler, J., T. Amann, N. Bauer, E. Kriegler, and J. Hartmann, 2018: Potential and costs of carbon dioxide removal by enhanced weathering of rocks. Environ. Res. Lett. , 13(3) , 034010, doi:10.1088/1748-9326/aaa9c4.
Strefler, J. et al., 2021: Carbon dioxide removal technologies are not born equal. Environ. Res. Lett. , 16(7) , 074021, doi:10.1088/1748-9326/ac0a11.
Styles, D. et al., 2016: Climate regulation, energy provisioning and water purification: Quantifying ecosystem service delivery of bioenergy willow grown on riparian buffer zones using life cycle assessment. Ambio, 45(8) , 872–884, doi:10.1007/s13280-016-0790-9.
Stylianou, K.S., V.L. Fulgoni, and O. Jolliet, 2021: Prioritization of healthy and sustainable foods for small targeted dietary changes can yield substantial gains for human health and the environment. Nat. Food, 2, 616–627
Sussman, R.L., A.T. McMahon, and E.P. Neale, 2019: An Audit of the Nutrition and Health Claims on Breakfast Cereals in Supermarkets in the Illawarra Region of Australia. Nutrients, 11(7) , doi:10.3390/nu11071604.
Sustainable Energy for All, 2018: Chilling Prospects: Providing Sustainable Cooling for All. https://www.seforall.org/sites/default/files/SEforALL_CoolingForAll-Report.pdf .
Sweet, S.K., J.P. Schuldt, J. Lehmann, D.A. Bossio, and D. Woolf, 2021: Perceptions of naturalness predict US public support for Soil Carbon Storage as a climate solution. Clim. Change, 166(1) , 22, doi:10.1007/s10584-021-03121-0.
Swinnen, J.F.M. and M. Maertens, 2007: Globalization, privatization, and vertical coordination in food value chains in developing and transition countries. Agric. Econ. , 37 (S1), 89–102, doi:10.1111/j.1574-0862.2007.00237.x.
Taillie, L.S., E. Busey, F.M. Stoltze, and F.R. Dillman Carpentier, 2019: Governmental policies to reduce unhealthy food marketing to children. Nutr. Rev. , 77(11) , 787–816, doi:10.1093/nutrit/nuz021.
Tan, R.R., K.B. Aviso, and S. Bandyopadhyay, 2021: Pinch-based planning of terrestrial carbon management networks. Clean. Eng. Technol. , 4, 100141, doi:10.1016/j.clet.2021.100141.
Tanzer, S.E. and A. Ramírez, 2019: When are negative emissions negative emissions?Energy Environ. Sci. , 12(4) , 1210–1218, doi:10.1039/C8EE03338B.
Tanzer, S.E., K. Blok, and A. Ramírez, 2020: Can bioenergy with carbon capture and storage result in carbon negative steel?Int. J. Greenh. Gas Control, 100, 103104, doi:10.1016/j.ijggc.2020.103104.
Tanzer, S.E., K. Blok, and A. Ramírez, 2021: Decarbonising Industry via BECCS: Promising Sectors, Challenges, and Techno-economic Limits of Negative Emissions. Curr. Sustain. Energy Reports, 8, 253–262, doi:10.1007/s40518-021-00195-3.
Tavoni, M. and R. Socolow, 2013: Modeling meets science and technology: an introduction to a special issue on negative emissions. Clim. Change, 118(1) , 1–14, doi:10.1007/s10584-013-0757-9.
Taylor, L.L. et al., 2016: Enhanced weathering strategies for stabilizing climate and averting ocean acidification. Nat. Clim. Change, 6(4) , 402–406, doi:10.1038/nclimate2882.
Taylor, M., 2018: Climate-smart agriculture: what is it good for?J. Peasant Stud. , 45(1) , 89–107, doi:10.1080/03066150.2017.1312355.
Teigiserova, D.A., L. Hamelin, and M. Thomsen, 2020: Towards transparent valorization of food surplus, waste and loss: Clarifying definitions, food waste hierarchy, and role in the circular economy. Sci. Total Environ. , 706, 136033, doi:10.1016/j.scitotenv.2019.136033.
Temme, E.H.M. et al., 2020: Demand-Side Food Policies for Public and Planetary Health. Sustainability, 12(15) , 5924, doi:10.3390/su12155924.
Temple, N.J., 2019: Front-of-package food labels: A narrative review. Appetite, 144 (September 2019), 104485, doi:10.1016/j.appet.2019.104485.
Terlouw, T., K. Treyer, C. Bauer, and M. Mazzotti, 2021: Life Cycle Assessment of Direct Air Carbon Capture and Storage with Low-Carbon Energy Sources. Environ. Sci. Technol. , 55(16) , 11397–11411, doi:10.1021/acs.est.1c03263.
Termeer, C.J.A. M., S. Drimie, J. Ingram, L. Pereira, and M.J. Whittingham, 2018: A diagnostic framework for food system governance arrangements: The case of South Africa. NJAS - Wageningen J. Life Sci. , 84 (August 2017), 85–93, doi:10.1016/j.njas.2017.08.001.
Teter, J., S. Yeh, M. Khanna, and G. Berndes, 2018: Water impacts of U.S. biofuels: Insights from an assessment combining economic and biophysical models. PLoS One, 13(9) , e0204298, doi:10.1371/JOURNAL.PONE.0204298.
Tharammal, T., G. Bala, N. Devaraju, and R. Nemani, 2019: A review of the major drivers of the terrestrial carbon uptake: model-based assessments, consensus, and uncertainties. Environ. Res. Lett. , 14(9) , 93005, doi:10.1088/1748-9326/ab3012.
Thaxter, C.B. et al., 2017: Bird and bat species’ global vulnerability to collision mortality at wind farms revealed through a trait-based assessment. Proc. R. Soc. B Biol. Sci. , 284(1862) , 20170829, doi:10.1098/rspb.2017.0829.
The Ellen MacArthur Foundation, 2013: Towards a Circular Economy - Economic and Business Rationale for an Accelerated Transition. Founding Partners of the Ellen MacArthur Foundation, 98 pp.
The Ellen MacArthur Foundation, 2019: Completing the Picture: How the Circular Economy Tackles Climate Change. Ellen MacArthur Foundation, 62 pp.
Theurl, M.C. et al., 2020: Food systems in a zero-deforestation world: Dietary change is more important than intensification for climate targets in 2050. Sci. Total Environ. , 735, 139353, doi:10.1016/j.scitotenv.2020.139353.
Thom, D., W. Rammer, R. Garstenauer, and R. Seidl, 2018: Legacies of past land use have a stronger effect on forest carbon exchange than future climate change in a temperate forest landscape. Biogeosciences, 15(18) , 5699–5713, doi:10.5194/bg-15-5699-2018.
Thomas, G., N. Pidgeon, and E. Roberts, 2018: Ambivalence, naturalness and normality in public perceptions of carbon capture and storage in biomass, fossil energy, and industrial applications in the United Kingdom. Energy Res. Soc. Sci. , 46, 1–9, doi:10.1016/j.erss.2018.06.007.
Thomas, J.-B.E. et al., 2021: Marine biomass for a circular blue-green bioeconomy?: A life cycle perspective on closing nitrogen and phosphorus land-marine loops. J. Ind. Ecol. , doi:10.1111/JIEC.13177.
Thornton, P.K. and M. Herrero, 2015: Adapting to climate change in the mixed crop and livestock farming systems in sub-Saharan Africa. Nat. Clim. Change, 5(9) , doi:10.1038/nclimate2754.
Thorrez, L. and H. Vandenburgh, 2019: Challenges in the quest for ‘clean meat.’Nat. Biotechnol. , 37(3) , 215–216, doi:10.1038/s41587-019-0043-0.
Thow, A.M. and N. Nisbett, 2019: Trade, nutrition, and sustainable food systems. Lancet , 394(10200) , 716–718, doi:10.1016/S0140-6736(19)31292-9.
Thunman, H. et al., 2018: Advanced biofuel production via gasification – lessons learned from 200 man-years of research activity with Chalmers’ research gasifier and the GoBiGas demonstration plant. Energy Sci. Eng. , 6(1) , 6–34, doi:10.1002/ESE3.188.
Tisserant, A. and F. Cherubini, 2019: Potentials, Limitations, Co-Benefits, and Trade-Offs of Biochar Applications to Soils for Climate Change Mitigation. Land, 8(12) , 179, doi:10.3390/LAND8120179.
To, H. and R.Q. Grafton, 2015: Oil prices, biofuels production and food security: past trends and future challenges. Food Secur. , 7, 323–336, doi:10.1007/s12571-015-0438-9.
Torres-Tiji, Y., F.J. Fields, and S.P. Mayfield, 2020: Microalgae as a future food source. Biotechnol. Adv. , 41 (August 2019), doi:10.1016/j.biotechadv.2020.107536.
Tørris, C. and H. Mobekk, 2019: Improving Cardiovascular Health through Nudging Healthier Food Choices: A Systematic Review. Nutrients, 11(10) , 1–19, doi:10.3390/nu11102520.
Torvanger, A., 2019: Governance of bioenergy with carbon capture and storage (BECCS): accounting, rewarding, and the Paris agreement. Clim. Policy, 19(3) , 329–341, doi:10.1080/14693062.2018.1509044.
Townsend, R., R. Benfica, and A. Prasann, 2017: Future of Food: Shaping the Food System to Deliver Jobs. World Bank, Washington, DC, USA. Traverso, S. and S. Schiavo, 2020: Fair trade or trade fair? International food trade and cross-border macronutrient flows. World Dev. , 132, 104976, doi:10.1016/j.worlddev.2020.104976.
Trick, C.G. et al., 2010: Iron enrichment stimulates toxic diatom production in high-nitrate, low-chlorophyll areas. Proc. Natl. Acad. Sci. , 107(13) , 5887–5892, doi:10.1073/pnas.0910579107.
Trull, T.W. et al., 2015: Chemometric perspectives on plankton community responses to natural iron fertilisation over and downstream of the Kerguelen Plateau in the Southern Ocean. Biogeosciences, 12, 1029–1056, doi:10.5194/bg-12-1029-2015.
Tubana, B.S., T. Babu, and L.E. Datnoff, 2016: A Review of Silicon in Soils and Plants and Its Role in US Agriculture. Soil Sci. , 181(9/10) , 1, doi:10.1097/SS.0000000000000179.
Tubiello, F.N. et al., 2021: Greenhouse gas emissions from food systems: Building the evidence base. Environ. Res. Lett. , 16(6) , doi:10.1088/1748-9326/ac018e.
Tuomisto, H.L., 2019: The eco‐friendly burger. EMBO Rep. , 20(1) , 1–6, doi:10.15252/embr.201847395.
Tuomisto, H.L. and M.J. Teixeira de Mattos, 2011: Environmental Impacts of Cultured Meat Production. Environ. Sci. Technol. , 45(14) , 6117–6123, doi:10.1021/es200130u.
Turnhout, E. et al., 2017: Envisioning REDD+ in a post-Paris era: between evolving expectations and current practice. Wiley Interdiscip. Rev. Clim. Change, 8(1) , e425, doi:10.1002/wcc.425.
Tzachor, A., C.E. Richards, and L. Holt, 2021: Future foods for risk-resilient diets. Nat. Food, 2 (May), doi:10.1038/s43016-021-00269-x.
Uden, S., P. Dargusch, and C. Greig, 2021: Cutting through the noise on negative emissions. Joule, 5(8) , 1956–1970, doi:10.1016/j.joule.2021.06.013.
Ueckerdt, F. et al., 2021: Potential and risks of hydrogen-based e-fuels in climate change mitigation. Nat. Clim. Chang. 2021 115, 11(5) , 384–393, doi:10.1038/s41558-021-01032-7.
Unar-Munguía, M., E. Monterubio Flores, and M.A. Colchero, 2019: Apparent consumption of caloric sweeteners increased after the implementation of NAFTA in Mexico. Food Policy, 84(655) , 103–110, doi:10.1016/j.foodpol.2019.03.004.
UNEP, 2017: The Emissions Gap Report 2017. United Nations Environment Programme, Nairobi, Kenya, 112 pp.
UNEP, 2019: Emissions Gap Report 2019. United Nations Environment Programme, Nairobi, Kenya, 108 pp.
UNEP, 2021: The Adaptation Gap Report 2020. United Nations Environment Programme, Nairobi, Kenya, https://www.unep.org/resources/adaptation-gap-report-2020.
UNFCCC, 2016: Decision 1/CP.21: Adoption of the Paris Agreement. In: Report of the Conference of the Parties on its twenty-first session, held in Paris from 30 November to 13 December 2015. Addendum: Part two: Action taken by the Conference of the Parties at its twenty-first session, FCCC/CP/2015/10/Add.1, United Nations Framework Convention on Climate Change (UNFCCC), pp. 1–36.
UNICEF, 2019: The State of the World’s Children 2019. Children, Food and Nutrition: Growing well in a changing world. UNICEF, New York, USA, 258 pp.
University of Birmingham, 2018: A Cool World: Defining the Energy Conundrum of Cooling for All. University of Birmingham, Birmingham, UK,https://www.birmingham.ac.uk/Documents/college-eps/energy/Publications/2018-clean-cold-report.pdf .
Urbinatti, A.M., M. Dalla Fontana, A. Stirling, and L.L. Giatti, 2020: ‘Opening up’ the governance of water-energy-food nexus: Towards a science-policy-society interface based on hybridity and humility. Sci. Total Environ. , 744, 140945, doi.org/10.1016/j.scitotenv.2020.140945.
Ürge-Vorsatz, D., S.T. Herrero, N.K. Dubash, and F. Lecocq, 2014: Measuring the Co-Benefits of Climate Change Mitigation. Annu. Rev. Environ. Resour. , 39(1) , 549–582, doi:10.1146/annurev-environ-031312-125456.
US EPA, 2019: Global Non-CO2 Greenhouse Gas Emission Projections & Mitigation 2015-2050. United States Environmental Protection Agency, Washington, DC, USA, 78 pp.
Václavík, T., S. Lautenbach, T. Kuemmerle, and R. Seppelt, 2013: Mapping global land system archetypes. Glob. Environ. Change, 23(6) , 1637–1647, doi:10.1016/j.gloenvcha.2013.09.004.
Vågsholm, I., N.S. Arzoomand, and S. Boqvist, 2020: Food Security, Safety, and Sustainability—Getting the Trade-Offs Right. Front. Sustain. Food Syst. , 4 (February), 1–14, doi:10.3389/fsufs.2020.00016.
Valencia, V., H. Wittman, and J. Blesh, 2019: Structuring Markets for Resilient Farming Systems. Agron. Sustain. Dev. , 39(25) , doi:10.1007/s13593-019-0572-4.
van de Ven, D.-J. et al., 2021: The potential land requirements and related land use change emissions of solar energy. Sci. Reports 2021 111, 11(1) , 1–12, doi:10.1038/s41598-021-82042-5.
van der Ent, R.J. and O.A. Tuinenburg, 2017: The residence time of water in the atmosphere revisited. Hydrol. Earth Syst. Sci. , 21(2) , 779–790, doi:10.5194/hess-21-779-2017.
van der Ploeg, F., 2016: Second-best carbon taxation in the global economy: The Green Paradox and carbon leakage revisited. J. Environ. Econ. Manage. , 78, 85–105, doi:10.1016/j.jeem.2016.02.006.
van der Ploeg, F. and A. Rezai, 2019: The risk of policy tipping and stranded carbon assets. J. Environ. Econ. Manage. , 100 (March), doi:10.1016/j.jeem.2019.102258.
van der Voorn, T., Å. Svenfelt, K.E. Björnberg, E. Fauré, and R. Milestad, 2020: Envisioning carbon-free land use futures for Sweden: a scenario study on conflicts and synergies between environmental policy goals. Reg. Environ. Change, 20(2) , 35, doi:10.1007/s10113-020-01618-5.
van der Werf, H.M.G., M.T. Knudsen, and C. Cederberg, 2020: Towards better representation of organic agriculture in life cycle assessment. Nat. Sustain. , 3, 419–425, doi:10.1038/s41893-020-0489-6.
van der Wijst, K.-I., A.F. Hof, and D.P. van Vuuren, 2021: Costs of avoiding net negative emissions under a carbon budget. Environ. Res. Lett. , 16(6) , 64071, doi:10.1088/1748-9326/ac03d9.
van Hal, O. et al., 2019: Upcycling food leftovers and grass resources through livestock: Impact of livestock system and productivity. J. Clean. Prod. , 219, 485–496, doi:10.1016/j.jclepro.2019.01.329.
Van Loo, E.J., V. Caputo, R.M. Nayga, and W. Verbeke, 2014: Consumers’ valuation of sustainability labels on meat. Food Policy, 49 (P1), 137–150, doi:10.1016/j.foodpol.2014.07.002.
Van Meijl, H. et al., 2018: Comparing impacts of climate change and mitigation on global agriculture by 2050. Environ. Res. Lett. , 13(6) , 064021, doi:10.1088/1748-9326/aabdc4.
van Soest, H.L. et al., 2019: Analysing interactions among Sustainable Development Goals with Integrated Assessment Models. Glob. Transitions, 1, 210–225, doi:10.1016/j.glt.2019.10.004.
van Vuuren, D.P. et al., 2018: Alternative pathways to the 1.5°C target reduce the need for negative emission technologies. Nat. Clim. Change, 8(5) , 391–397, doi:10.1038/s41558-018-0119-8.
van Zalk, J. and P. Behrens, 2018: The spatial extent of renewable and non-renewable power generation: A review and meta-analysis of power densities and their application in the U.S. Energy Policy, 123, 83–91, doi:10.1016/j.enpol.2018.08.023.
Van Zanten, H.H.E., M.K. Van Ittersum, and I.J.M. De Boer, 2019: The role of farm animals in a circular food system. Glob. Food Sec. , 21, 18–22, doi:10.1016/j.gfs.2019.06.003.
Van Zanten, H.H.E. et al., 2018: Defining a land boundary for sustainable livestock consumption. Glob. Chang. Biol. , 24(9) , 4185–4194, doi:10.1111/gcb.14321.
Vanham, D. et al., 2019: Environmental footprint family to address local to planetary sustainability and deliver on the SDGs. Sci. Total Environ. , 693 (June), 133642, doi:10.1016/j.scitotenv.2019.133642.
Vanham, D., M.M. Mekonnen, and A.Y. Hoekstra, 2020: Treenuts and groundnuts in the EAT-Lancet reference diet: Concerns regarding sustainable water use. Glob. Food Sec. , 24 (December 2019), doi:10.1016/j.gfs.2020.100357.
Varelas, 2019: Food Wastes as a Potential new Source for Edible Insect Mass Production for Food and Feed: A review. Fermentation, 5(3) , 81, doi:10.3390/fermentation5030081.
Vautard, R. et al., 2014: Regional climate model simulations indicate limited climatic impacts by operational and planned European wind farms. Nat. Commun. , 5, doi:10.1038/ncomms4196.
Vecchio, R., and C. Cavallo, 2019: Increasing healthy food choices through nudges: A systematic review. Food Qual. Prefer. , 78 (June 2018), 103714, doi:10.1016/j.foodqual.2019.05.014.
Velenturf, A.P.M. et al., 2019: Circular economy and the matter of integrated resources. Sci. Total Environ. , 689, 963–969, doi:10.1016/j.scitotenv.2019.06.449.
Verkerk, P.J. et al., 2020: Climate-Smart Forestry: the missing link. For. Policy Econ. , 115 (June), doi:10.1016/j.forpol.2020.102164.
Vermeulen, S.J., T. Park, C.K. Khoury, and C. Béné, 2020: Changing diets and the transformation of the global food system. Ann. N. Y. Acad. Sci. , 1478(1) , 3–17, doi.org/10.1111/nyas.14446.
Verschuur, J., S. Li, P. Wolski, and F.E.L. Otto, 2021: Climate change as a driver of food insecurity in the 2007 Lesotho-South Africa drought. Sci. Rep. , 11(1) , 1–9, doi:10.1038/s41598-021-83375-x.
Viebahn, P. et al., 2015: Assessing the need for critical minerals to shift the German energy system towards a high proportion of renewables. Renew. Sustain. Energy Rev. , 49, 655–671, doi:10.1016/J.RSER.2015.04.070.
Vogliano, C. et al., 2020: Assessing Diet Quality of Indigenous Food Systems in Three Geographically Distinct Solomon Islands Sites (Melanesia, Pacific Islands). Nutrients, 13(1) , 30, doi:10.3390/nu13010030.
Vogt-Schilb, A., G. Meunier, and S. Hallegatte, 2018: When starting with the most expensive option makes sense: Optimal timing, cost and sectoral allocation of abatement investment. J. Environ. Econ. Manage. , 88, 210–233, doi:10.1016/j.jeem.2017.12.001.
Voigt, C.C., 2021: Insect fatalities at wind turbines as biodiversity sinks. Conserv. Sci. Pract. , 3(5) , e366, doi:10.1111/CSP2.366.
von Stechow, C. et al., 2015: Integrating Global Climate Change Mitigation Goals with Other Sustainability Objectives: A Synthesis. Annu. Rev. Environ. Resour. , 40(1) , 363–394, doi:10.1146/annurev-environ-021113-095626.
VonHedemann, N., Z. Wurtzebach, T.J. Timberlake, E. Sinkular, and C.A. Schultz, 2020: Forest policy and management approaches for carbon dioxide removal. Interface Focus, 10(5) , 20200001, doi:10.1098/rsfs.2020.0001.
Voskian, S., and T.A. Hatton, 2019: Faradaic electro-swing reactive adsorption for CO 2 capture. Energy Environ. Sci. , 12(12) , 3530–3547, doi:10.1039/C9EE02412C.
Walker, B.J.A., T. Kurz, and D. Russel, 2018: Towards an understanding of when non-climate frames can generate public support for climate change policy. Environ. Behav. , 50(7) , 781–806, doi:10.1177/0013916517713299.
Waller, L. et al., 2020: Contested framings of greenhouse gas removal and its feasibility: Social and political dimensions. WIREs Clim. Change, 11(4) , e649, doi.org/10.1002/wcc.649.
Wang, J., Z. Xiong, and Y. Kuzyakov, 2016a: Biochar stability in soil: meta-analysis of decomposition and priming effects. GCB Bioenergy, 8(3) , 512–523, doi:10.1111/gcbb.12266.
Wang, N., K. Akimoto, and G.F. Nemet, 2021: What went wrong? Learning from three decades of carbon capture, utilization and sequestration (CCUS) pilot and demonstration projects. Energy Policy, 158, 112546, doi:10.1016/j.enpol.2021.112546.
Wang, Q., K. Hubacek, K. Feng, Y.M. Wei, and Q.M. Liang, 2016b: Distributional effects of carbon taxation. Appl. Energy, 184, 1123–1131, doi:10.1016/j.apenergy.2016.06.083.
Warren Raffa, D., A. Bogdanski, and P. Tittonell, 2015: How does crop residue removal affect soil organic carbon and yield? A hierarchical analysis of management and environmental factors. Biomass and Bioenergy, 81, 345–355, doi.org/10.1016/j.biombioe.2015.07.022.
Watari, T., B.C. McLellan, S. Ogata, and T. Tezuka, 2018: Analysis of potential for critical metal resource constraints in the international energy agency’s long-term low-carbon energy scenarios. Minerals, 8(4) , doi:10.3390/min8040156.
Watari, T. et al., 2019: Total material requirement for the global energy transition to 2050: A focus on transport and electricity. Resour. Conserv. Recycl. , 148, 91–103, doi:10.1016/j.resconrec.2019.05.015.
Weber, H. et al., 2020: What are the ingredients for food systems change towards sustainability? - Insights from the literature. Environ. Res. Lett. , 15(11) , doi:10.1088/1748-9326/ab99fd.
Wedding, L.M. et al., 2021: Incorporating blue carbon sequestration benefits into sub-national climate policies. Glob. Environ. Change, 69, 102206, doi:10.1016/j.gloenvcha.2020.102206.
Wegener, J., D. Fong, and C. Rocha, 2018: Education, practical training and professional development for public health practitioners: a scoping review of the literature and insights for sustainable food system capacity-building. Public Health Nutr. , 21(9) , 1771–1780, doi:10.1017/S1368980017004207.
Weiler, V., H.M.J. Udo, T. Viets, T.A. Crane, and I.J.M. De Boer, 2014: Handling multi-functionality of livestock in a life cycle assessment: The case of smallholder dairying in Kenya. Curr. Opin. Environ. Sustain. , 8, 29–38, doi:10.1016/j.cosust.2014.07.009.
Weindl, I. et al., 2017a: Livestock production and the water challenge of future food supply: Implications of agricultural management and dietary choices. Glob. Environ. Change, 47 (March), 121–132, doi:10.1016/j.gloenvcha.2017.09.010.
Weindl, I. et al., 2017b: Livestock and human use of land: Productivity trends and dietary choices as drivers of future land and carbon dynamics. Glob. Planet. Change, 159 (April), 1–10, doi:10.1016/j.gloplacha.2017.10.002.
Weindl, I. et al., 2020: Sustainable food protein supply reconciling human and ecosystem health: A Leibniz Position. Glob. Food Sec. , 25, 100367, doi:10.1016/j.gfs.2020.100367.
Weinrich, R., and O. Elshiewy, 2019: Preference and willingness to pay for meat substitutes based on micro-algae. Appetite, 142 (October 2018), 104353, doi:10.1016/j.appet.2019.104353.
Weitz, N., C. Strambo, E. Kemp-Benedict, and M. Nilsson, 2017: Closing the governance gaps in the water-energy-food nexus: Insights from integrative governance. Glob. Environ. Change, 45, 165–173, doi.org/10.1016/j.gloenvcha.2017.06.006.
Welfle, A., P. Thornley, and M. Röder, 2020: A review of the role of bioenergy modelling in renewable energy research & policy development. Biomass and Bioenergy, 136, 105542, doi:10.1016/J.BIOMBIOE.2020.105542.
Welsch, M. et al., 2014: Adding value with CLEWS – Modelling the energy system and its interdependencies for Mauritius. Appl. Energy, 113, 1434–1445, doi.org/10.1016/j.apenergy.2013.08.083.
Weng, Y., W. Cai, and C. Wang, 2021: Evaluating the use of BECCS and afforestation under China’s carbon-neutral target for 2060. Appl. Energy, 299, 117263, doi:10.1016/j.apenergy.2021.117263.
Wenger, A., M. Stauffacher, and I. Dallo, 2021: Public perception and acceptance of negative emission technologies – framing effects in Switzerland. Clim. Change, 167(3) , 53, doi:10.1007/s10584-021-03150-9.
Wezel, A. et al., 2009: Agroecology as a science, a movement and a practice. Sustain. Agric. , 2, 27–43, doi:10.1007/978-94-007-0394-0_3.
WFP-FSIN, 2020: Global Report on Food Crises: Joint Analysis for Better Decisions. United Nations World Food Programme, Food Security Information Network,.
Whalen, R., J. Harrold, S. Child, J. Halford, and E. Boyland, 2018: The health halo trend in UK television food advertising viewed by children: The rise of implicit and explicit health messaging in the promotion of unhealthy foods. Int. J. Environ. Res. Public Health, 15(3) , doi:10.3390/ijerph15030560.
Whitfield, S., A.J. Challinor, and R.M. Rees, 2018: Frontiers in Climate Smart Food Systems: Outlining the Research Space. Front. Sustain. Food Syst. , 2, 2, doi:10.3389/fsufs.2018.00002.
WHO, 2010: Set of recommendations on the marketing of foods and non-alcoholic beverages to children. World Health Organization, Geneva, Switzerland, 16 pp.
WHO, 2019: Health taxes: a primer. World Health Organization, Geneva, Switzerland.
Wickramasinghe, K. et al., 2021: The shift to plant-based diets: are we missing the point?Glob. Food Sec. , 29 (January), 100530, doi:10.1016/j.gfs.2021.100530.
Wiedmann, T. and M. Lenzen, 2018: Environmental and social footprints of international trade. Nat. Geosci. , 11(5) , 314–321, doi:10.1038/s41561-018-0113-9.
Wijesinha-Bettoni, R. et al., 2021: A snapshot of food-based dietary guidelines implementation in selected countries. Glob. Food Sec. , 29 (January), 100533, doi:10.1016/j.gfs.2021.100533.
Wilcox, J., P.C. Psarras, and S. Liguori, 2017: Assessment of reasonable opportunities for direct air capture. Environ. Res. Lett. , 12(6) , doi:10.1088/1748-9326/aa6de5.
Willauer, H.D., F. DiMascio, D.R. Hardy, and F.W. Williams, 2017: Development of an Electrolytic Cation Exchange Module for the Simultaneous Extraction of Carbon Dioxide and Hydrogen Gas from Natural Seawater. Energy and Fuels, 31(2) , 1723–1730, doi:10.1021/ACS.ENERGYFUELS.6B02586.
Willer, D.F., and D.C. Aldridge, 2020: Sustainable bivalve farming can deliver food security in the tropics. Nat. Food, 1, 384–388, doi:10.1038/s43016-020-0116-8.
Willett, W. et al., 2019: Food in the Anthropocene: the EAT–Lancet Commission on healthy diets from sustainable food systems. The Lancet Commissions, 393(10170) , 447–492, doi: 10.1016/S0140-6736(18)31788-4.
Williamson, P. and C. Turley, 2012: Ocean acidification in a geoengineering context. Philos. Trans. R. Soc. A Math. Phys. Eng. Sci. , 370(1974) , 4317–4342, doi:10.1098/rsta.2012.0167.
Williamson, P. and R. Bodle, 2016: Update on climate geoengineering in relation to the Convention on Biological Diversity: Potential impacts and regulatory framework. Technical Series No.84. Secretariat of the Convention on Biological Diversity, Montreal, Canada, 158 pp.
Williamson, P. et al., 2012: Ocean fertilization for geoengineering: A review of effectiveness, environmental impacts and emerging governance. Process Saf. Environ. Prot. , 90(6) , 475–488, doi:10.1016/J.PSEP.2012.10.007.
Wilson, A.L., E. Buckley, J.D. Buckley, and S. Bogomolova, 2016: Nudging healthier food and beverage choices through salience and priming. Evidence from a systematic review. Food Qual. Prefer. , 51, 47–64, doi:10.1016/j.foodqual.2016.02.009.
Wilts, H., M. O’Brien, and M.O. Brien, 2019: A Policy Mix for Resource Efficiency in the EU: Key Instruments, Challenges and Research Needs. Ecol. Econ. , 155 (November 2017), 59–69, doi:10.1016/j.ecolecon.2018.05.004.
Winans, K., A. Kendall, and H. Deng, 2017: The history and current applications of the circular economy concept. Renew. Sustain. Energy Rev. , 68, 825–833, doi:10.1016/j.rser.2016.09.123.
Winchester, N. and J.M. Reilly, 2015: The feasibility, costs, and environmental implications of large-scale biomass energy. Energy Econ. , 51, 188–203, doi:10.1016/j.eneco.2015.06.016.
Winde, F., D. Brugge, A. Nidecker, and U. Ruegg, 2017: Uranium from Africa – An overview on past and current mining activities: Re-appraising associated risks and chances in a global context. J. African Earth Sci. , 129, 759–778, doi:10.1016/J.JAFREARSCI.2016.12.004.
Winiwarter, W., A. Leip, H.L. Tuomisto, and P. Haastrup, 2014: A European perspective of innovations towards mitigation of nitrogen-related greenhouse gases. Curr. Opin. Environ. Sustain. , 9–10, 37–45, doi:10.1016/j.cosust.2014.07.006.
Winther, U., E.S. Hognes, S. Jafarzadeh, and F. Ziegler, 2020: Greenhouse gas emissions of Norwegian seafood products in 2017. SINTEF, Trondheim, Norway.
Wohland, J., D. Witthaut, and C.F. Schleussner, 2018: Negative Emission Potential of Direct Air Capture Powered by Renewable Excess Electricity in Europe. Earth’s Futur. , 6(10) , 1380–1384, doi:10.1029/2018EF000954.
Wohlfahrt, G., E. Tomelleri, and A. Hammerle, 2021: The albedo–climate penalty of hydropower reservoirs. Nat. Energy 2021 64, 6(4) , 372–377, doi:10.1038/s41560-021-00784-y.
Wohner, B., E. Pauer, V. Heinrich, and M. Tacker, 2019: Packaging-related food losses and waste: An overview of drivers and issues. Sustainability, 11(1) , doi:10.3390/su11010264.
Wood, S.A., M.R. Smith, J. Fanzo, R. Remans, and R.S. Defries, 2018: Trade and the equitability of global food nutrient distribution. Nat. Sustain. , 1(1) , 34–37, doi:10.1038/s41893-017-0008-6.
Woodbury, P.B., A.R. Kemanian, M. Jacobson, and M. Langholtz, 2018: Improving water quality in the Chesapeake Bay using payments for ecosystem services for perennial biomass for bioenergy and biofuel production. Biomass and Bioenergy, 114, 132–142, doi:10.1016/j.biombioe.2017.01.024.
World Bank, 2021: World Development Indicators. World Bank, Washington, DC, USA (Accessed March 19, 2021).
World Bank Group, 2015: World Bank Group Assistance to Low-Income Fragile and Conflict-Affected States: An Independent Evaulation. World Bank Group, Washington, DC, USA, 227 pp.
Wright, S.F., and A. Upadhyaya, 1998: A survey of soils for aggregate stability and glomalin, a glycoprotein produced by hyphae of arbuscular mycorrhizal fungi. Plant Soil, 198, 97–107, doi: 10.1023/A:1004347701584.
Wright, A., K.E. Smith, and M. Hellowell, 2017: Policy lessons from health taxes: A systematic review of empirical studies. BMC Public Health, 17(1) , 1–14, doi:10.1186/s12889-017-4497-z.
Wu, G.C. et al., 2020: Low-impact land use pathways to deep decarbonization of electricity. Environ. Res. Lett. , 15(7) , 74044, doi:10.1088/1748-9326/ab87d1.
Wu, W., C. Beretta, P. Cronje, S. Hellweg, and T. Defraeye, 2019: Environmental trade-offs in fresh-fruit cold chains by combining virtual cold chains with life cycle assessment. Appl. Energy, 254, 113586, doi:10.1016/j.apenergy.2019.113586.
Wu, X. et al., 2021: Unveiling land footprint of solar power: A pilot solar tower project in China. J. Environ. Manage. , 280, doi:10.1016/J.JENVMAN.2020.111741.
Wulf, C., P. Zapp, and A. Schreiber, 2020: Review of Power-to-X Demonstration Projects in Europe. Front. Energy Res. , 8, 191, doi:10.3389/fenrg.2020.00191.
Xu, X., K. Vignarooban, B. Xu, K. Hsu, and A.M. Kannan, 2016: Prospects and problems of concentrating solar power technologies for power generation in the desert regions. Renew. Sustain. Energy Rev. , 53, 1106–1131, doi:10.1016/J.RSER.2015.09.015.
Yenneti, K., R. Day, and O. Golubchikov, 2016: Spatial justice and the land politics of renewables: Dispossessing vulnerable communities through solar energy mega-projects. Geoforum, 76, 90–99, doi.org/10.1016/j.geoforum.2016.09.004.
Yi, J. et al., 2021: Post-farmgate food value chains make up most of consumer food expenditures globally. Nat. Food, 2 (June), 13–15, doi:10.1038/s43016-021-00279-9.
Younger, P.L. and C. Wolkersdorfer, 2004: Mining Impacts on the Fresh Water Environment: Technical and Managerial Guidelines for Catchment Scale Management. Mine Water Environ. , 23(S1) , s2–s80, doi:10.1007/s10230-004-0028-0.
Yu, G. et al., 2017: Mineral Availability as a Key Regulator of Soil Carbon Storage. Environ. Sci. Technol. , 51(9) , 4960–4969, doi:10.1021/acs.est.7b00305.
Zabaniotou, A., 2018: Redesigning a bioenergy sector in EU in the transition to circular waste-based Bioeconomy-A multidisciplinary review. J. Clean. Prod. , 177, 197–206, doi:10.1016/j.jclepro.2017.12.172.
Zagmutt, F.J., J.G. Pouzou, and S. Costard, 2019: The EAT–Lancet Commission: a flawed approach?Lancet , 394(10204) , 1140–1141, doi:10.1016/S0140-6736(19)31903-8.
Zakkour, P.D. et al., 2020: Progressive supply-side policy under the Paris Agreement to enhance geological carbon storage. Clim. Policy, 21, 1–15, doi:10.1080/14693062.2020.1803039.
Zalesny, R.S. et al., 2019: Positive water linkages of producing short rotation poplars and willows for bioenergy and phytotechnologies. Wiley Interdiscip. Rev. Energy Environ. , 8(5) , doi:10.1002/wene.345.
Zech, K.M., and U.A. Schneider, 2019: Carbon leakage and limited efficiency of greenhouse gas taxes on food products. J. Clean. Prod. , 213, 99–103, doi:10.1016/j.jclepro.2018.12.139.
Zeebe, R.E., 2012: History of Seawater Carbonate Chemistry, Atmospheric CO2, and Ocean Acidification. Annu. Rev. Earth Planet. Sci. , 40(1) , 141–165, doi:10.1146/annurev-earth-042711-105521.
Zeebe, R.E. and D. Archer, 2005: Feasibility of ocean fertilization and its impact on future atmospheric CO2 levels. Geophys. Res. Lett. , 32(9) , 1–5, doi:10.1029/2005GL022449.
Zhang, M. et al., 2017: A global review on hydrological responses to forest change across multiple spatial scales: Importance of scale, climate, forest type and hydrological regime. J. Hydrol. , 546, 44–59, doi:10.1016/j.jhydrol.2016.12.040.
Zhang, W., G. Hu, Y. Dang, D.C. Weindorf, and J. Sheng, 2016: Afforestation and the impacts on soil and water conservation at decadal and regional scales in Northwest China. J. Arid Environ. , 130, 98–104, doi:10.1016/j.jaridenv.2016.03.003.
Zhang, Y., 2017: Interregional carbon emission spillover–feedback effects in China. Energy Policy, 100, 138–148, doi.org/10.1016/j.enpol.2016.10.012.
Zhang, Y., M. Pribil, M. Palmgren, and C. Gao, 2020a: A CRISPR way for accelerating improvement of food crops. Nat. Food, 1(4) , 200–205, doi:10.1038/s43016-020-0051-8.
Zhang, Z. et al., 2020b: Production Globalization Makes China’s Exports Cleaner. One Earth, 2(5) , 468–478, doi:10.1016/j.oneear.2020.04.014.
Zheng, X., J. Zhu, and Z. Xing, 2016: Assessment of the effects of shelterbelts on crop yields at the regional scale in Northeast China. Agric. Syst. , 143, 49–60, doi:10.1016/j.agsy.2015.12.008.
Zhou, L., Y. Tian, S. Baidya Roy, Y. Dai, and H. Chen, 2013: Diurnal and seasonal variations of wind farm impacts on land surface temperature over western Texas. Clim. Dyn. , 41(2) , 307–326, doi:10.1007/s00382-012-1485-y.
Zhou, Y., S. Cao, J.L.M. Hensen, and P.D. Lund, 2019: Energy integration and interaction between buildings and vehicles: A state-of-the-art review. Renew. Sustain. Energy Rev. , 114, 109337, doi:10.1016/j.rser.2019.109337.
Zumpf, C., H. Ssegane, M.C. Negri, P. Campbell, and J. Cacho, 2017: Yield and Water Quality Impacts of Field-Scale Integration of Willow into a Continuous Corn Rotation System. J. Environ. Qual. , 46(4) , doi:10.2134/jeq2017.02.0082.
Zurek, M. et al., 2018: Assessing Sustainable Food and Nutrition Security of the EU Food System — An Integrated Approach. Sustainability, 10(11) , 4271, doi:10.3390/su10114271.
1 Cumulative levels of CDR from AFOLU cannot be quantified precisely given that: (i) some pathways assess CDR deployment relative to a baseline; and (ii) different models use different reporting methodologies that in some cases combine gross emissions and removals in AFOLU. Total CDR from AFOLU equals or exceeds the net negative emissions mentioned.
2 We use representative options for labels of each variable reported in the AR6 scenarios database.
3 For lack of space, the focus is on land only, although the bioeconomy also includes sea-related bioresources.
4 Here, the term co-benefits is used to refer to the additional benefits to society and the environment that are realised in parallel with emissions reductions, while an understanding of adverse side effects highlights where policy- and decision makers are required to make trade-offs between mitigation benefits and other impacts. The choice of language differs to some degree in other chapters.


