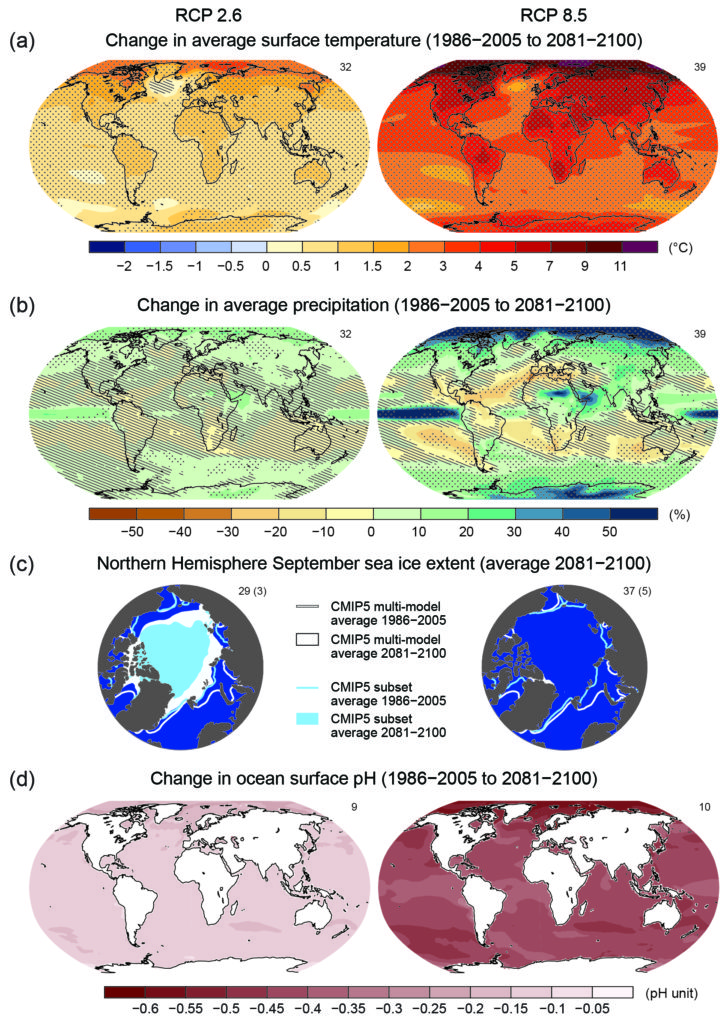
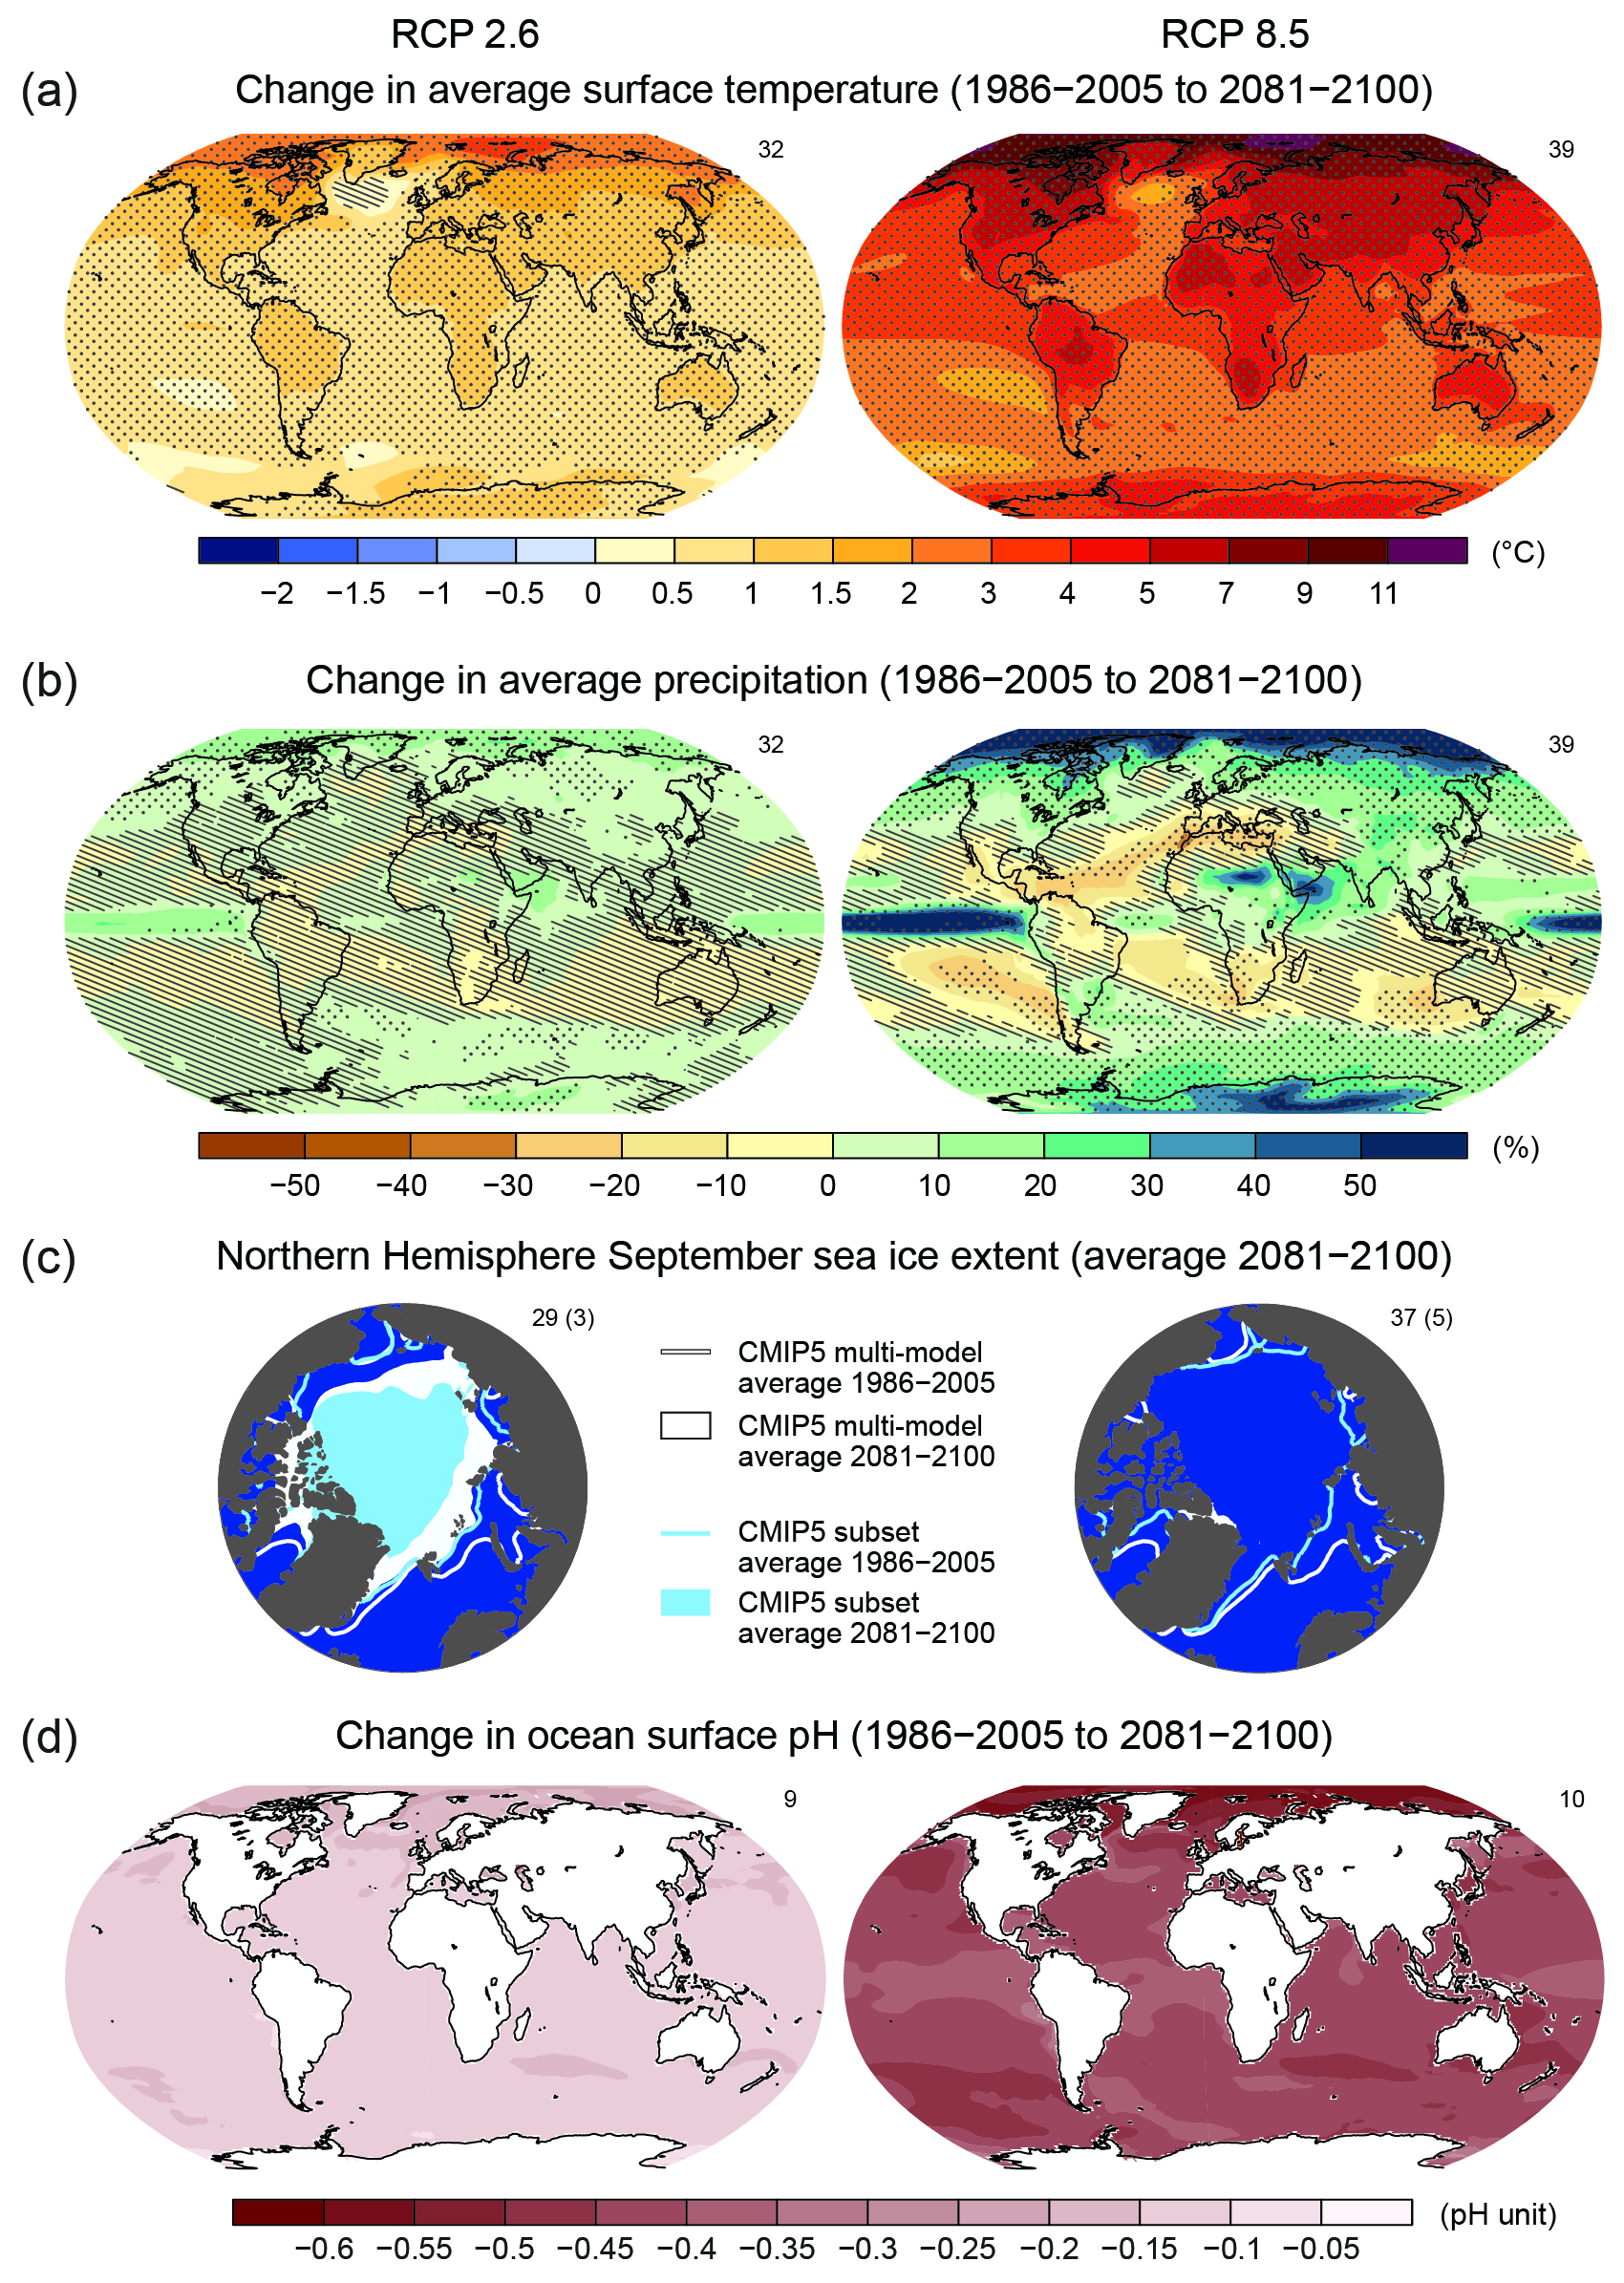
Figure SPM.8
Maps of CMIP5 multi-model mean results for the scenarios RCP2.6 and RCP8.5 in 2081–2100 of (a) annual mean surface temperature change, (b) average percent change in annual mean precipitation, (c) Northern Hemisphere September sea ice extent, and (d) change in ocean surface pH. Changes in panels (a), (b) and (d) are shown relative to 1986–2005. The number of CMIP5 models used to calculate the multi-model mean is indicated in the upper right corner of each panel. For panels (a) and (b), hatching indicates regions where the multi-model mean is small compared to natural internal variability (i.e., less than one standard deviation of natural internal variability in 20-year means). Stippling indicates regions where the multi-model mean is large compared to natural internal variability (i.e., greater than two standard deviations of natural internal variability in 20-year means) and where at least 90% of models agree on the sign of change (see Box 12.1). In panel (c), the lines are the modelled means for 1986−2005; the filled areas are for the end of the century. The CMIP5 multi-model mean is given in white colour, the projected mean sea ice extent of a subset of models (number of models given in brackets) that most closely reproduce the climatological mean state and 1979 to 2012 trend of the Arctic sea ice extent is given in light blue colour. For further technical details see the Technical Summary Supplementary Material. {Figures 6.28, 12.11, 12.22, and 12.29; Figures TS.15, TS.16, TS.17, and TS.20}
You may freely download and copy the material contained on this website for your personal, non-commercial use, without any right to resell, redistribute, compile or create derivative works therefrom, subject to more specific restrictions that may apply to specific materials.