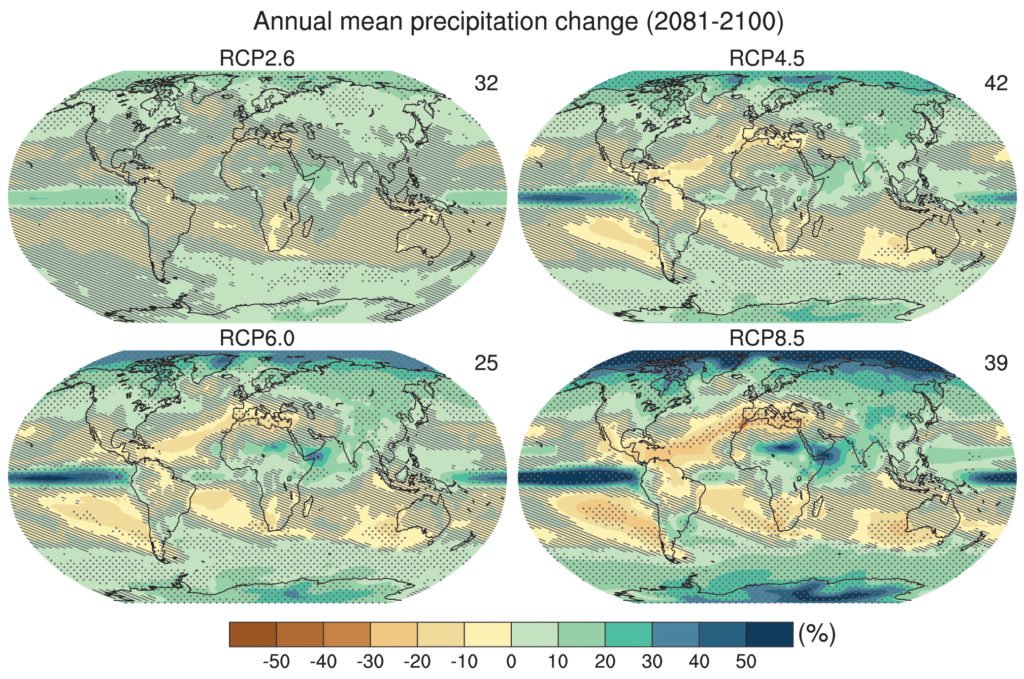
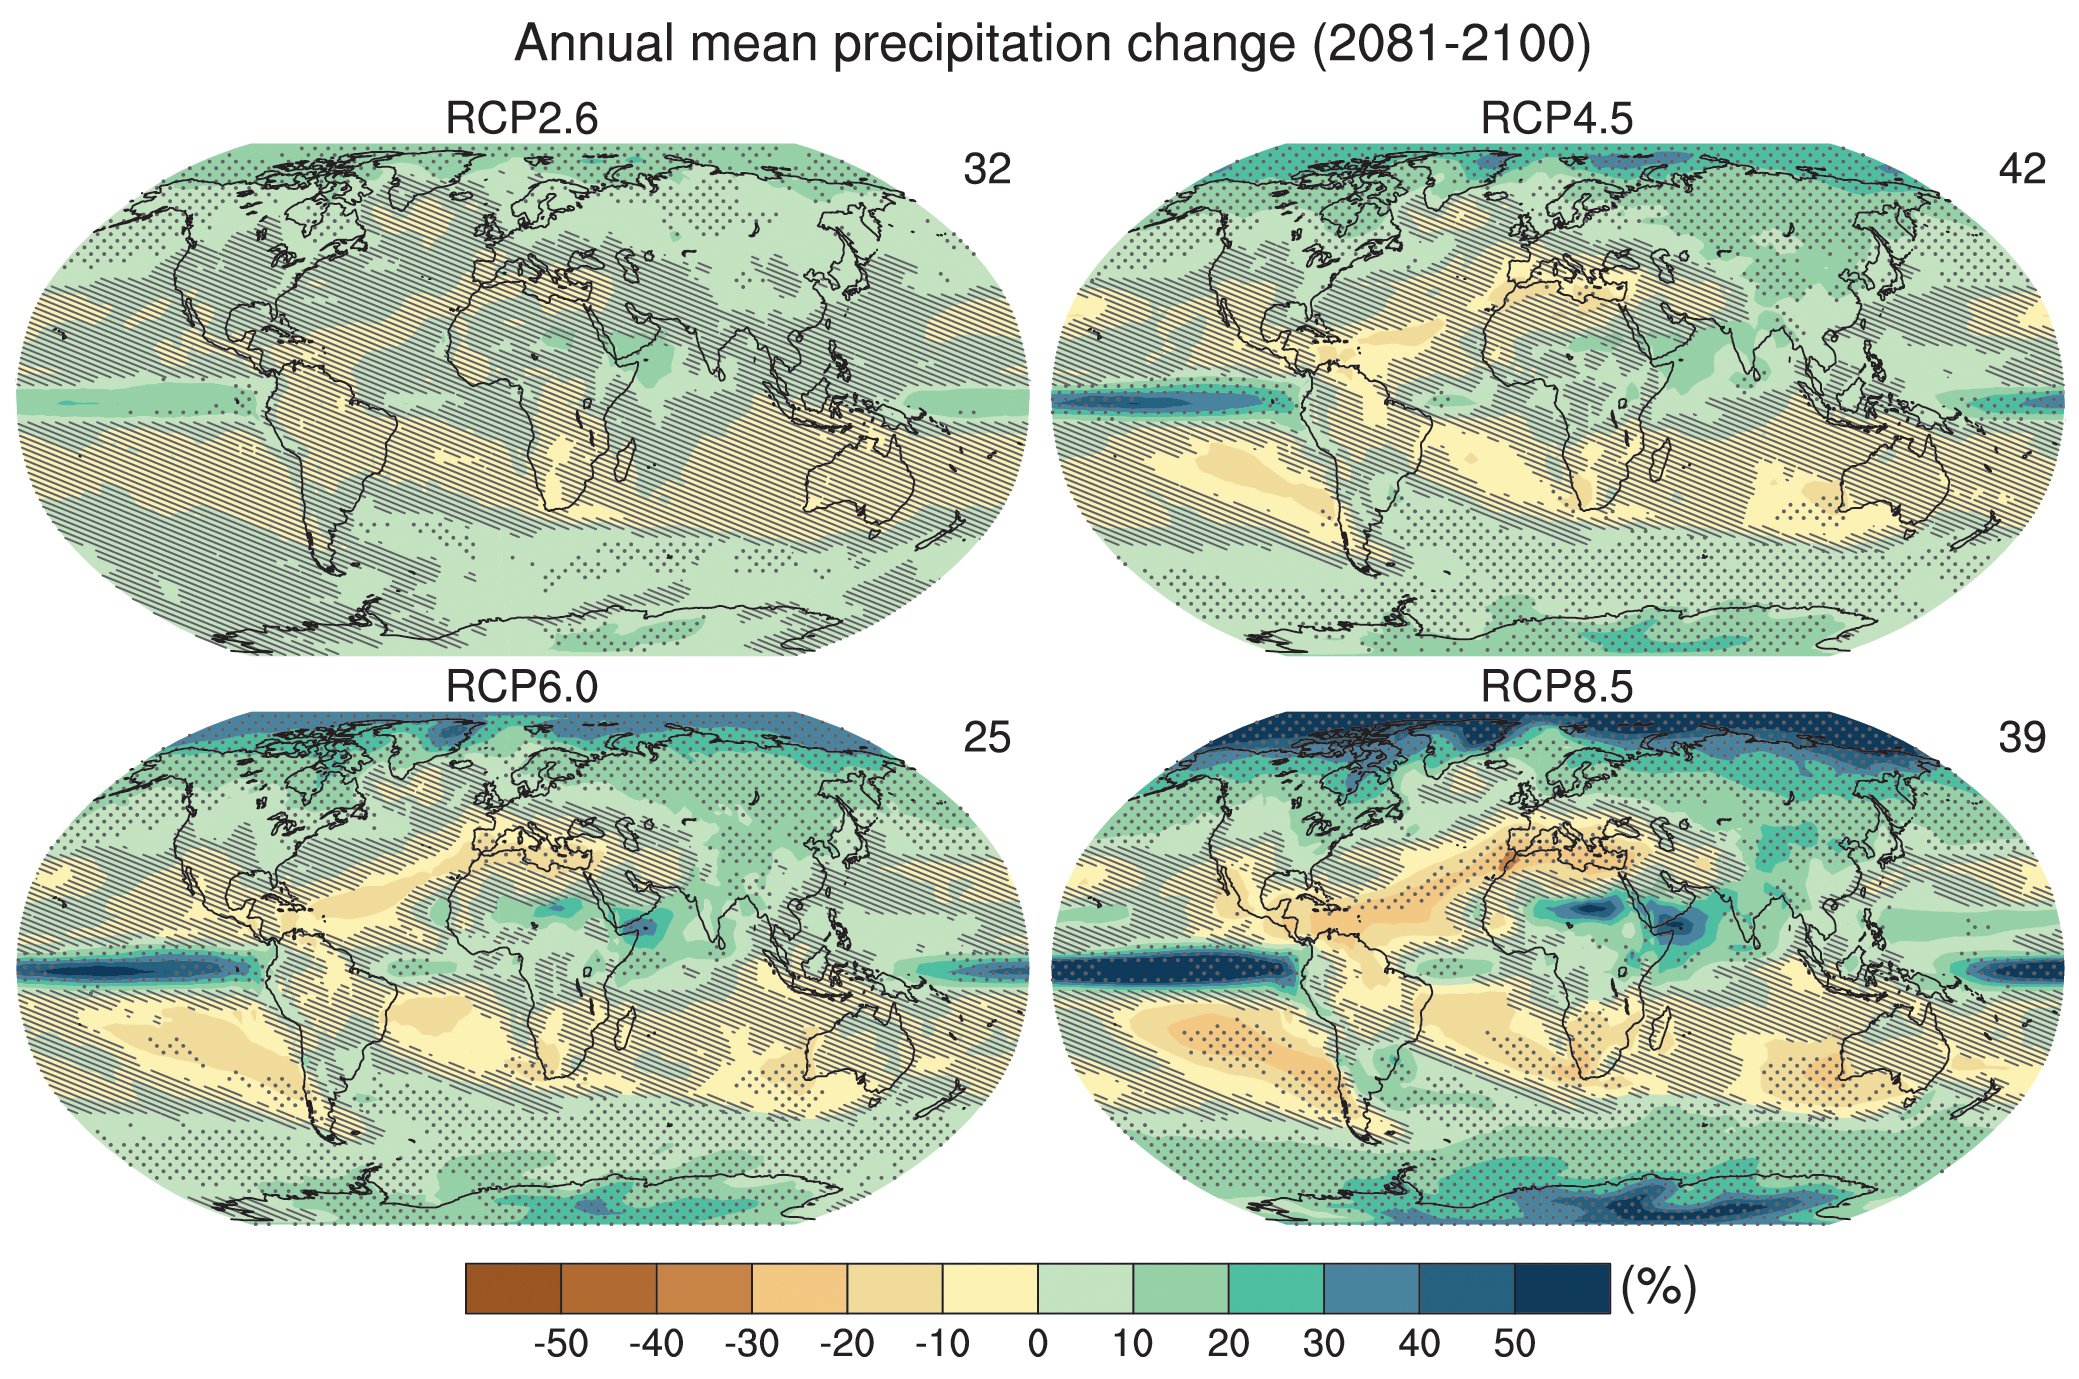
Figure TS.16
Maps of multi-model results for the scenarios RCP2.6, RCP4.5, RCP6.0 and RCP8.5 in 2081–2100 of average percent change in mean precipitation. Changes are shown relative to 1986–2005. The number of CMIP5 models to calculate the multi-model mean is indicated in the upper right corner of each panel. Hatching indicates regions where the multi- model mean signal is less than 1 standard deviation of internal variability. Stippling indicates regions where the multi-model mean signal is greater than 2 standard deviations of internal variability and where 90% of models agree on the sign of change (see Box 12.1). Further detail regarding the related Figure SPM.8b is given in the TS Supplementary Material. {Figure 12.22; Annex I}
You may freely download and copy the material contained on this website for your personal, non-commercial use, without any right to resell, redistribute, compile or create derivative works therefrom, subject to more specific restrictions that may apply to specific materials.