Chapter 5: Demand, services and social aspects of mitigation


This chapter should be cited as:
Creutzig, F., J. Roy, P. Devine-Wright, J. Díaz-José, F.W. Geels, A. Grubler, N. Maïzi, E. Masanet, Y. Mulugetta, C.D. Onyige, P.E. Perkins, A. Sanches-Pereira, E.U. Weber, 2022: Demand, services and social aspects of mitigation. In IPCC, 2022: Climate Change 2022: Mitigation of Climate Change. Contribution of Working Group III to the Sixth Assessment Report of the Intergovernmental Panel on Climate Change[P.R. Shukla, J. Skea, R. Slade, A. Al Khourdajie, R. van Diemen, D. McCollum, M. Pathak, S. Some, P. Vyas, R. Fradera, M. Belkacemi, A. Hasija, G. Lisboa, S. Luz, J. Malley, (eds.)]. Cambridge University Press, Cambridge, UK and New York, NY, USA. doi: 10.1017/9781009157926.007.
Executive Summary 
Assessment of the social science literature and regional case studies reveals how social norms, culture, and individual choices interact with infrastructure and other structural changes over time. This provides new insight into climate change mitigation strategies, and how economic and social activity might be organised across sectors to support emission reductions. To enhance well-being, people demand services and not primary energy and physical resources per se. Focusing on demand for services and the different social and political roles people play broadens the participation in climate action.
Potential of Demand-side Actions and Service Provisioning Systems
Demand-side mitigation and new ways of providing services can helpavoid, shift , andimprovefinal service demand. Rapid and deep changes in demand make it easier for every sector to reduce greenhouse gas (GHG) emissions in the short and medium term (high confidence). {5.2, 5.3}
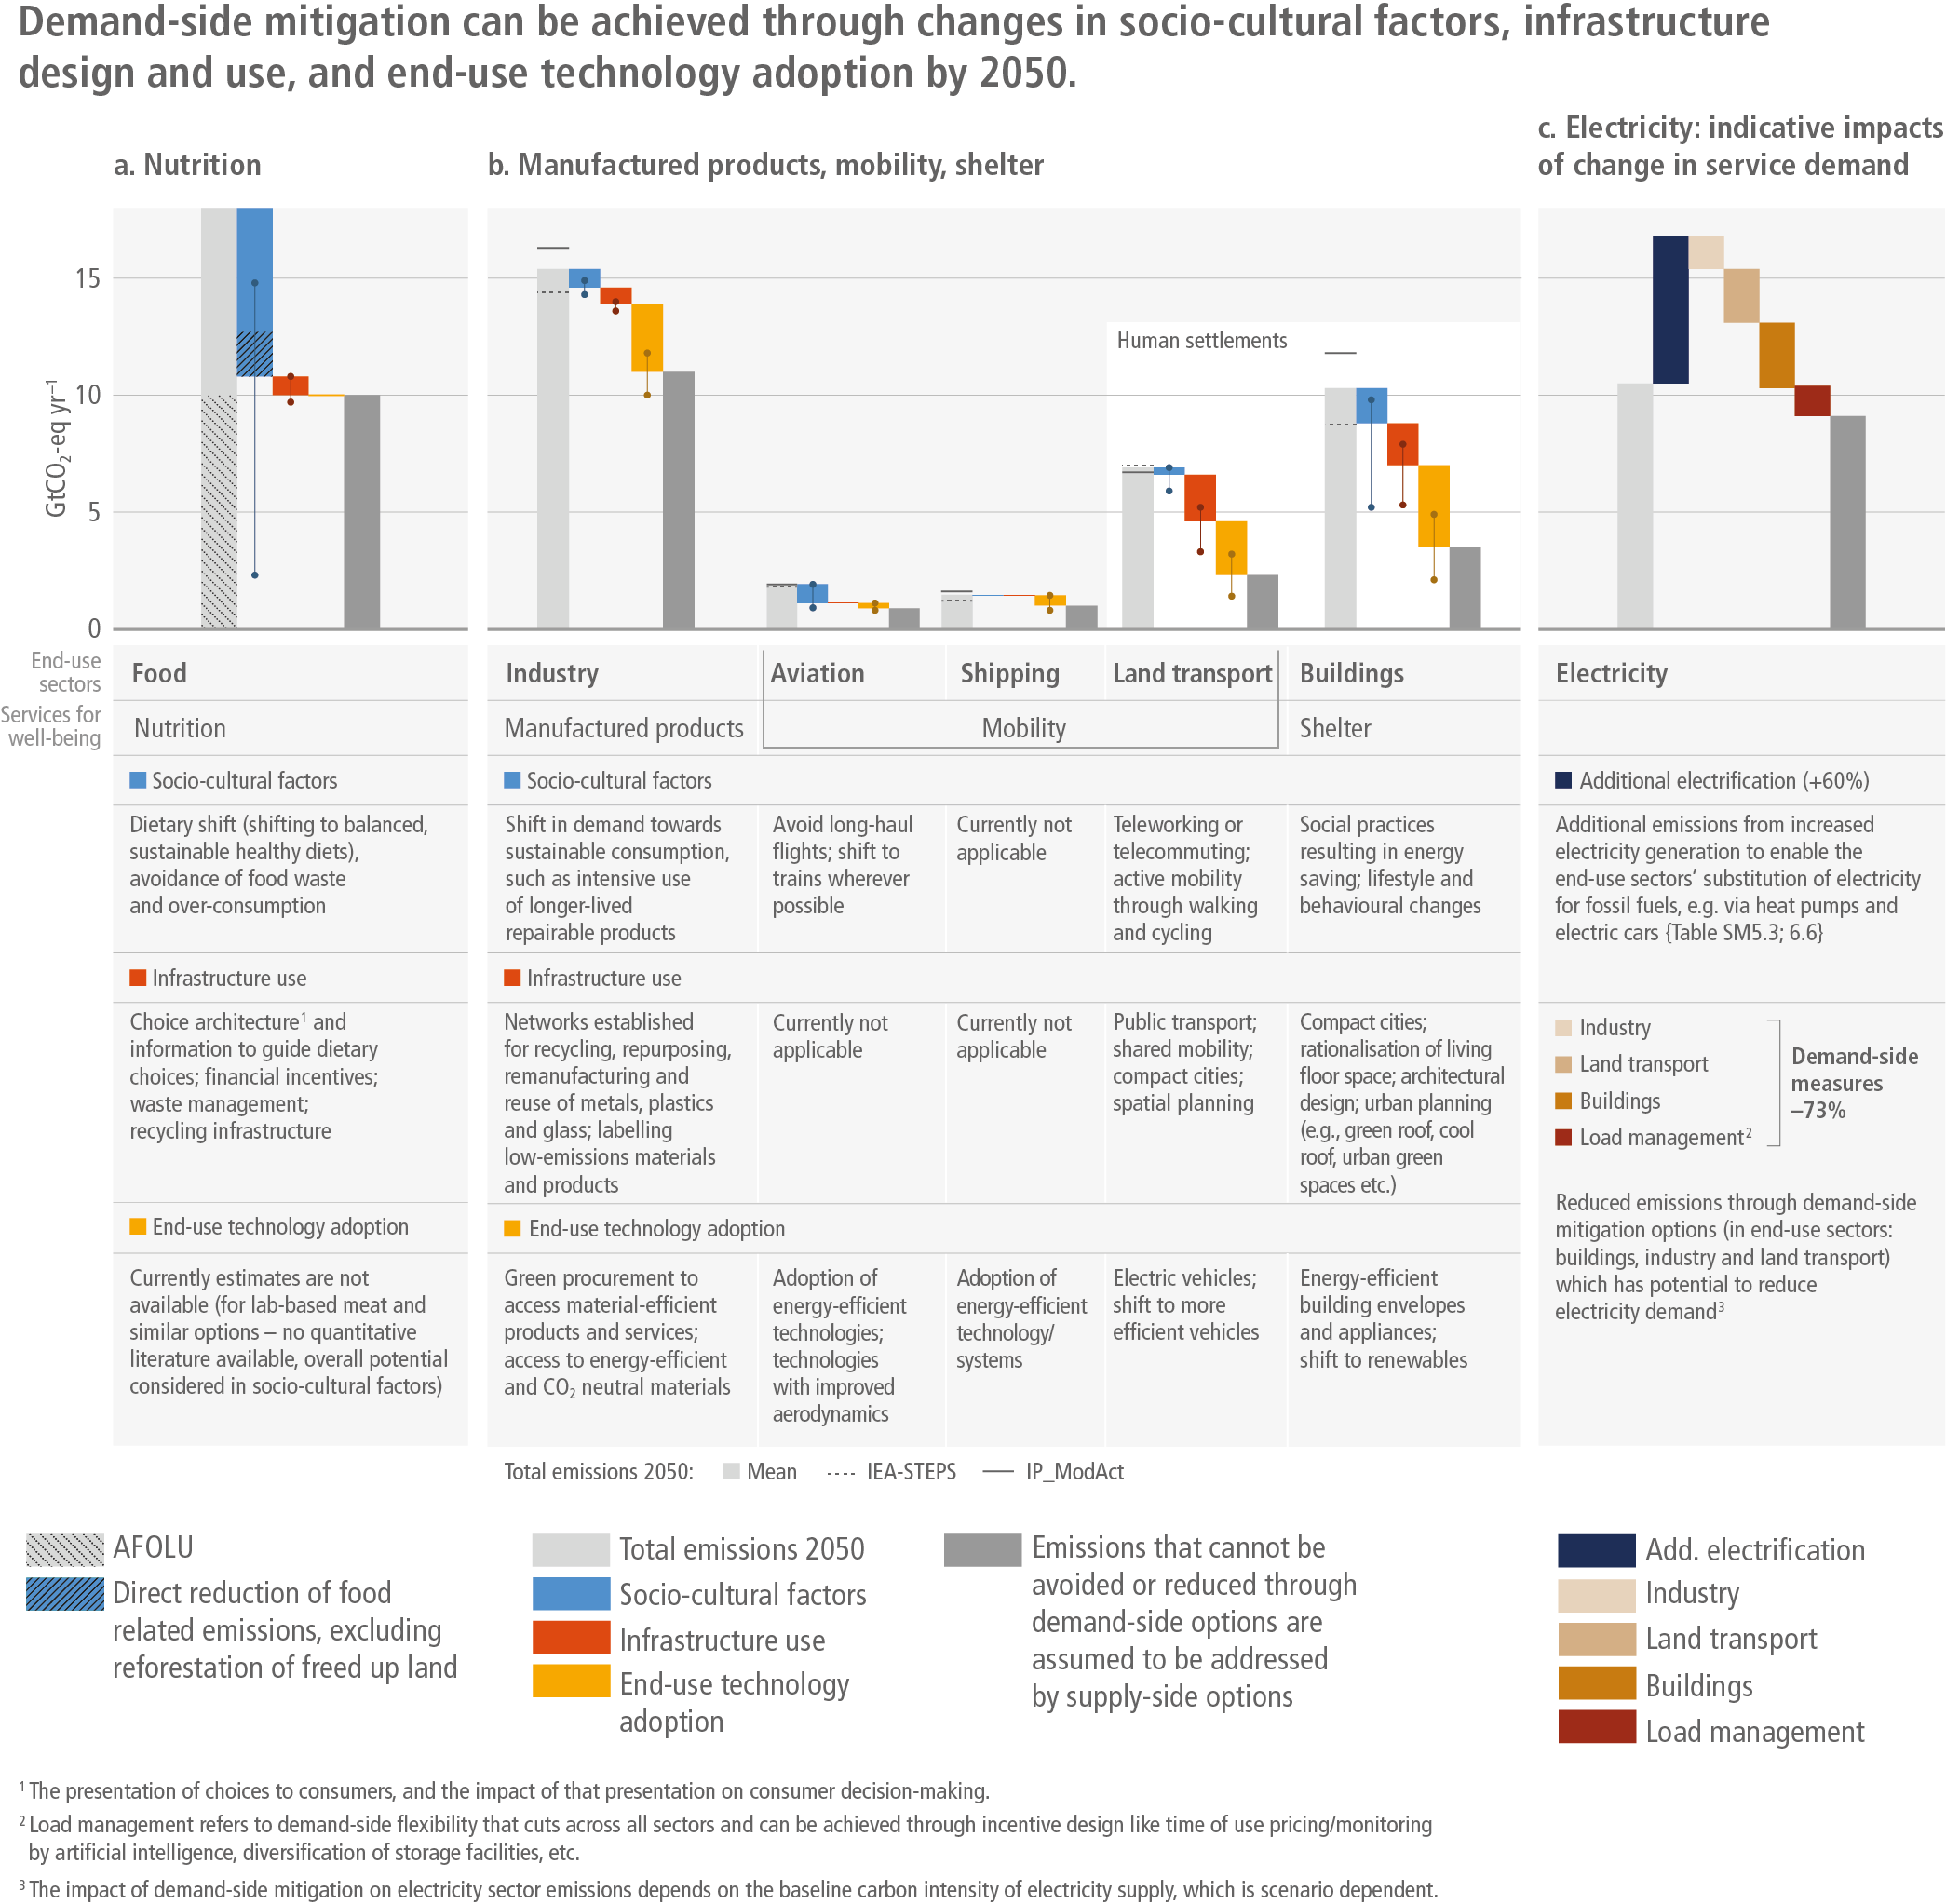
The indicative potential of demand-side strategies to reduce emissions of direct and indirect CO2 and non-CO2 GHG emissions in three end-use sectors (buildings, land transport, and food) is 40–70% globally by 2050 (high confidence). Technical mitigation potentials compared to the 2050 emissions projection of two scenarios consistent with policies announced by national governments until 2020 amount to 6.8 GtCO2 for building use and construction, 4.6 GtCO2 for land transport and 8.0 GtCO2-eq for food demand, and amount to 4.4 GtCO2 for industry. Mitigation strategies can be classified as Avoid-Shift-Improve (ASI) options, that reflect opportunities for socio-cultural, infrastructural, and technological change. The greatest ‘Avoid’ potential comes from reducing long-haul aviation and providing short-distance low-carbon urban infrastructures. The greatest ‘Shift’ potential would come from switching to plant-based diets. The greatest ‘Improve’ potential comes from within the building sector, and in particular increased use of energy-efficient end-use technologies and passive housing. {5.3.1, 5.3.2, Figure 5.7, Figure 5.8, Table 5.1, <a class='section-link' data-title='Demand, services and social aspects of mitigation' href='/chapters/chapter-5'>Chapter 5</a> Supplementary Material II, Table 5.SM.2}
Socio-cultural and lifestyle changes can accelerate climate change mitigation (medium confidence). Among 60 identified actions that could change individual consumption, individual mobility choices have the largest potential to reduce carbon footprints. Prioritising car-free mobility by walking and cycling and adoption of electric mobility could save 2 tCO2-eq cap –1 yr –1. Other options with high mitigation potential include reducing air travel, heating and cooling set-point adjustments, reduced appliance use, shifts to public transit, and shifting consumption towards plant-based diets. {5.3.1, 5.3.1.2, Figure 5.8}
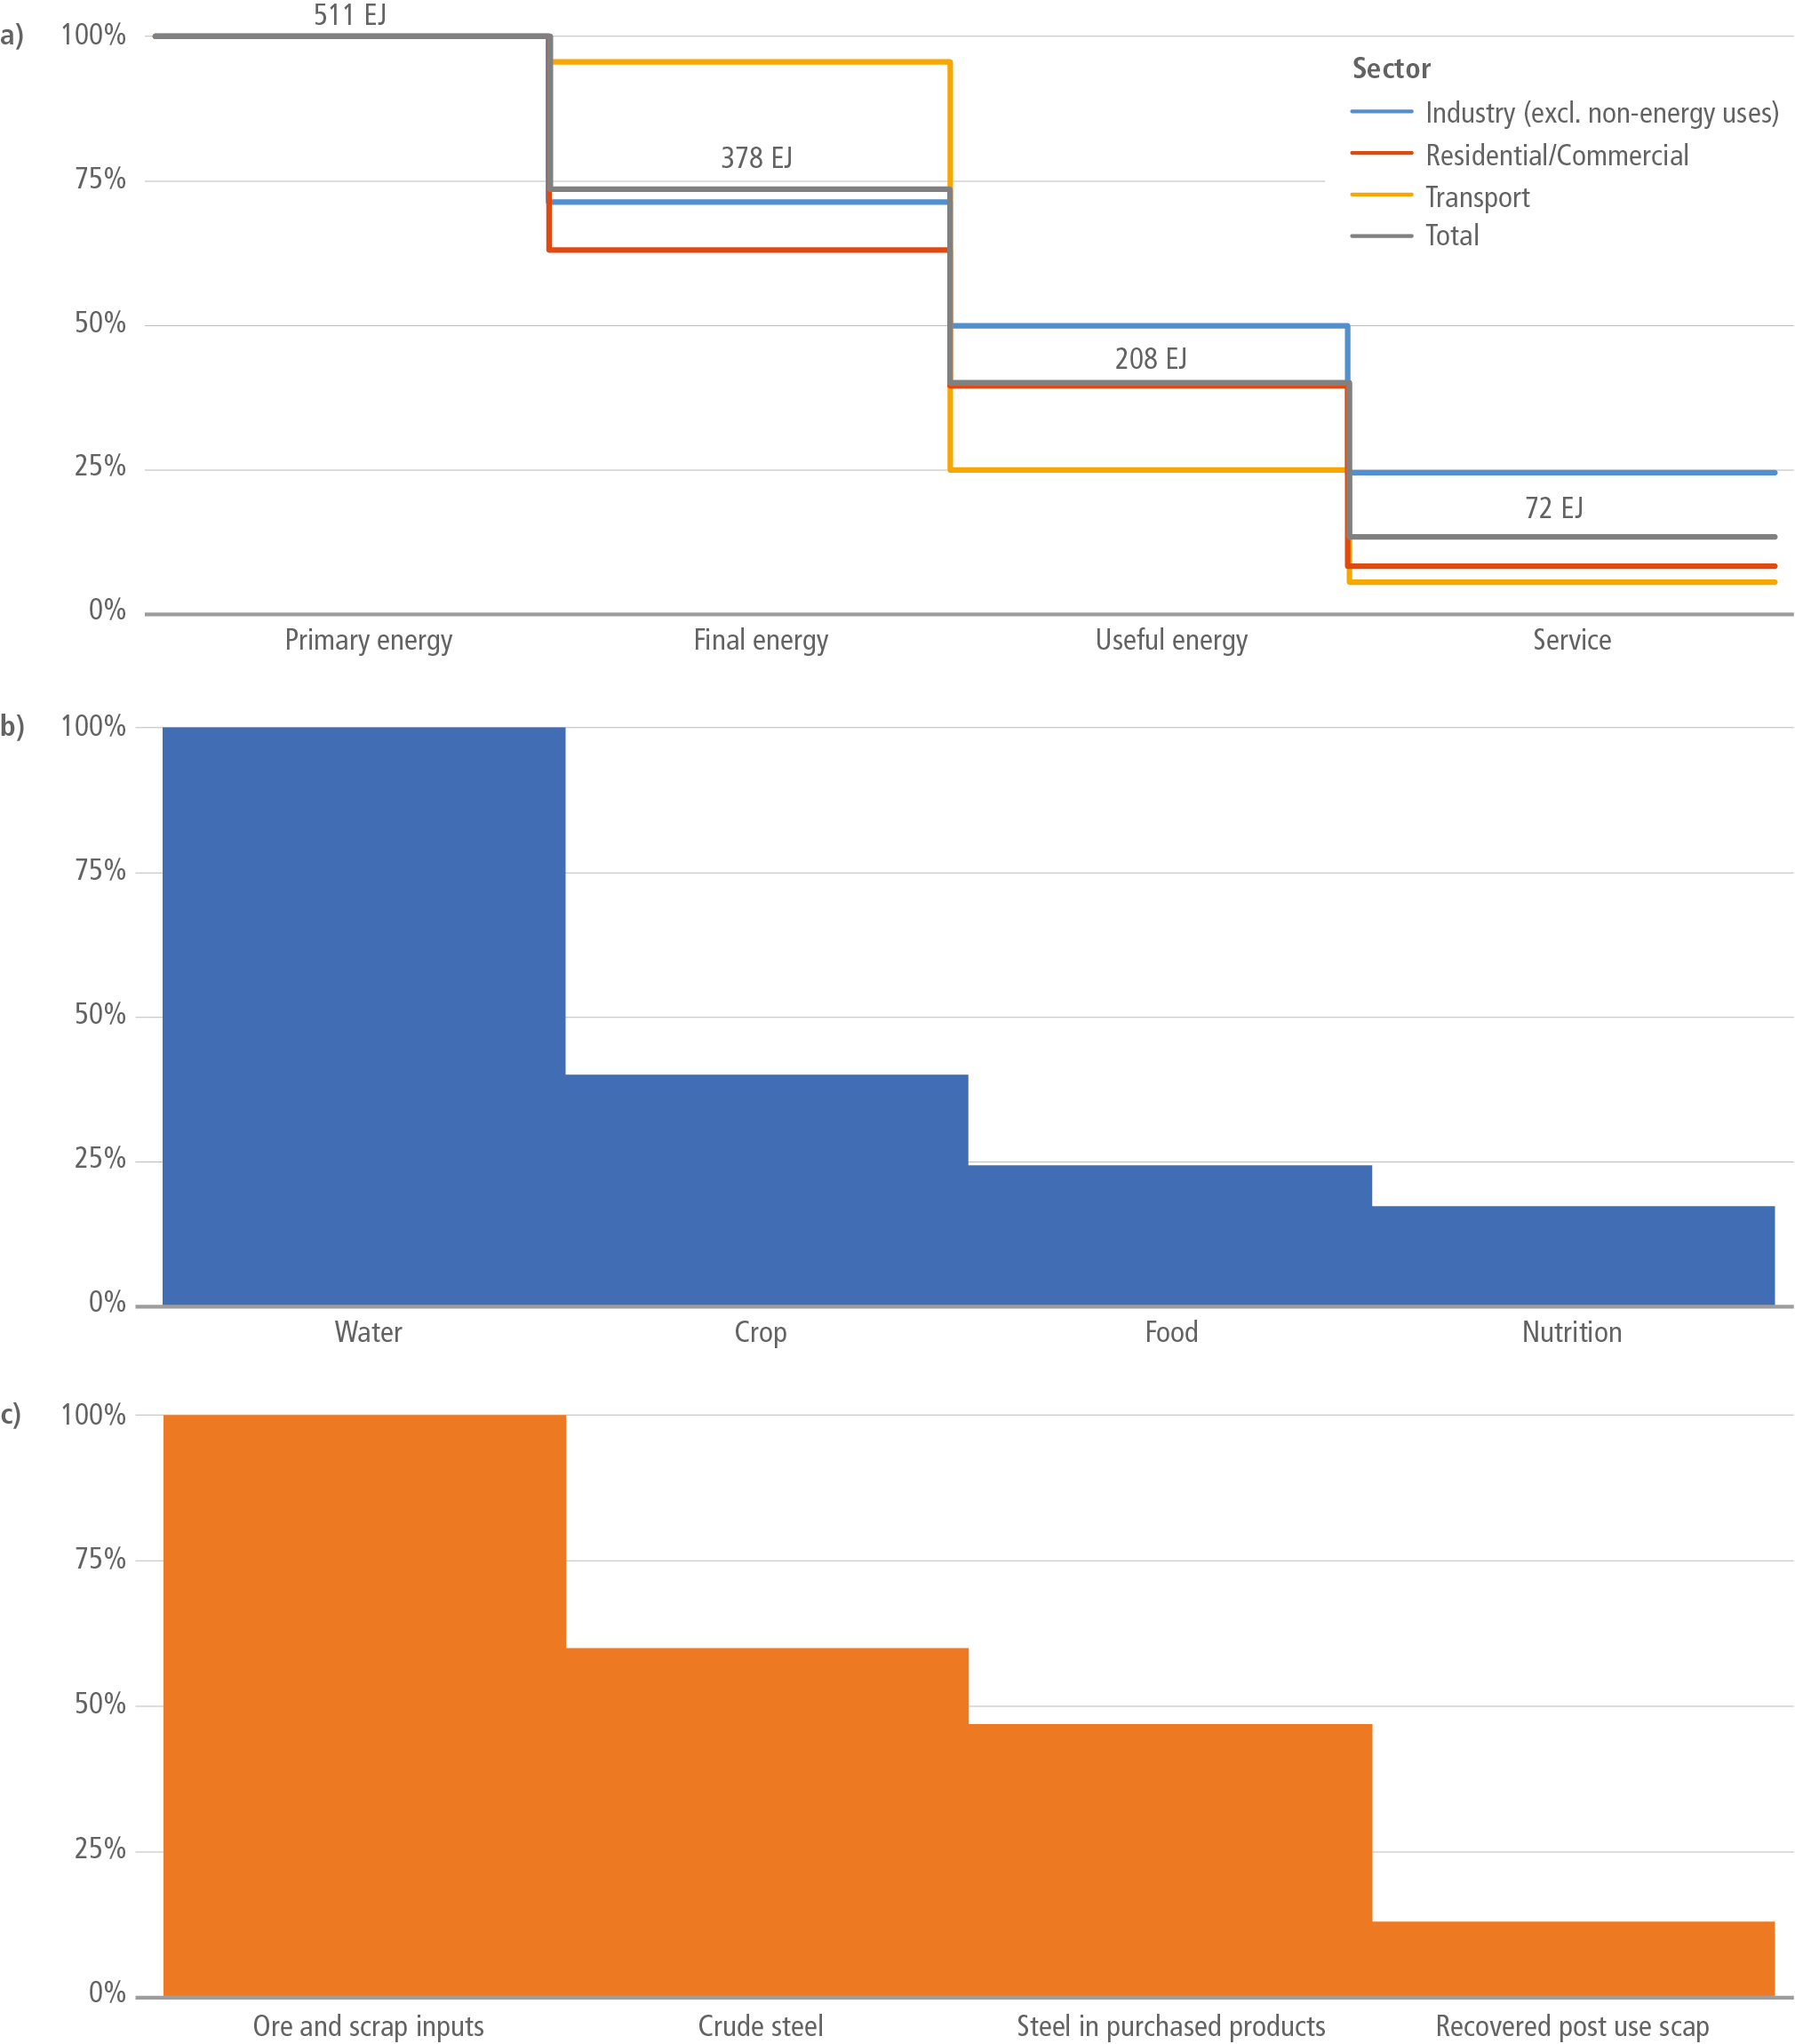
Leveraging improvements in end-use service delivery through behavioural and technological innovations, and innovations in market organisation, leads to large reductions in upstream resource use (high confidence). Analysis of indicative potentials range from a factor 10- to 20-fold improvement in the case of available energy (exergy) analysis, with the highest improvement potentials at the end-user and service-provisioning levels. Realisable service-level efficiency improvements could reduce upstream energy demand by 45% in 2050. {5.3.2, Figure 5.10}
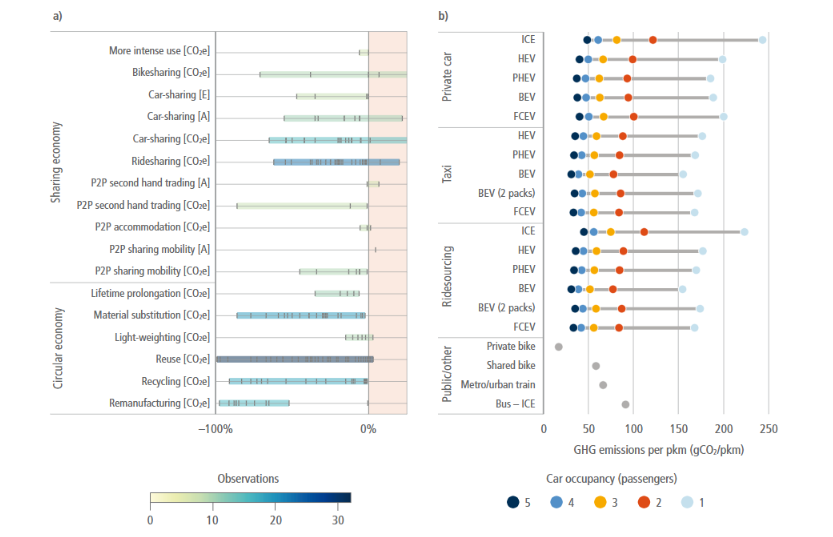
Alternative service provision systems, for example those enabled through digitalisation, sharing economy initiatives and circular economy initiatives, have to date made a limited contribution to climate change mitigation (medium confidence). While digitalisation through specific new products and applications holds potential for improvement in service-level efficiencies, without public policies and regulations, it also has the potential to increase consumption and energy use. Reducing the energy use of data centres, networks, and connected devices is possible in managing low-carbon digitalisation. Claims on the benefits of the circular economy for sustainability and climate change mitigation have limited evidence. {5.3.4, 5.3.4.1, 5.3.4.2, Figure 5.12, Figure 5.13}
Social Aspects of Demand-side Mitigation Actions
Decent living standards and well-beingfor all are achievable through the implementation of high-efficiency low demand mitigation pathways (medium confidence). Decent living standards (DLS) – a benchmark of minimum material conditions for human well-being – overlaps with many Sustainable Development Goals (SDGs). Minimum requirements of energy use consistent with enabling well-being for all is between 20 and 50 GJ per person per year (cap –1 yr –1) depending on the context. {5.2.2.1, 5.2.2.2, Box 5.3}
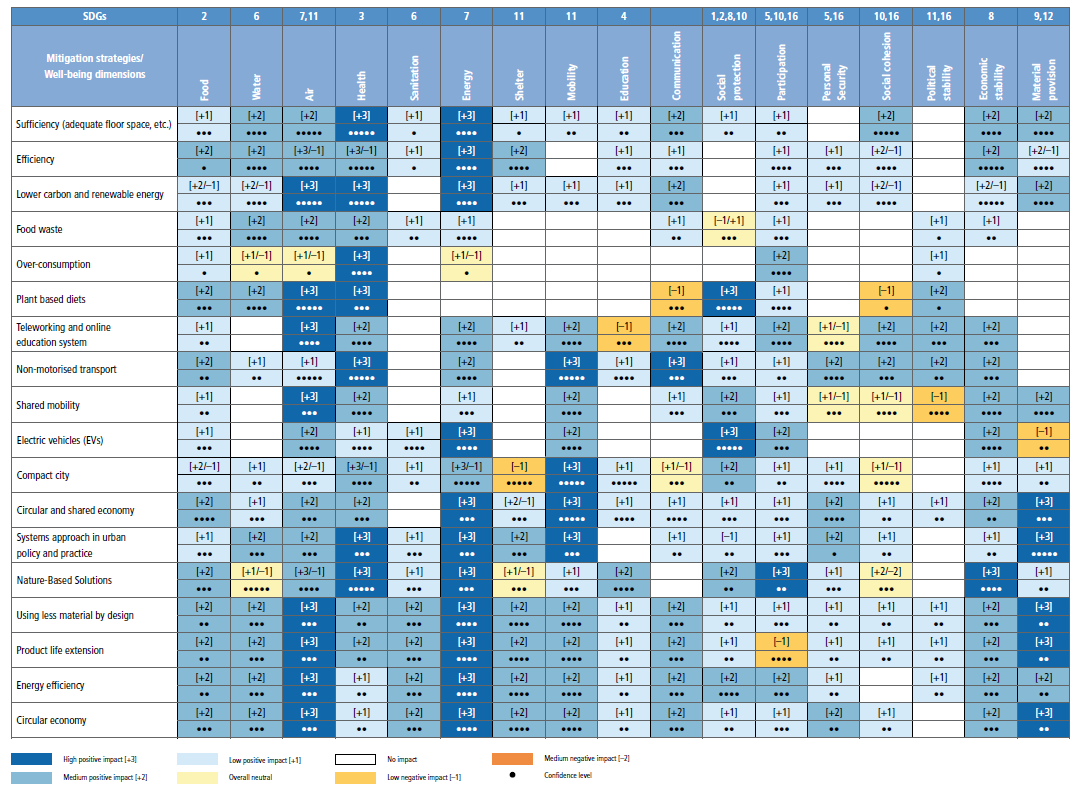
Providing better services with less energy and resource input has high technical potential and is consistent with providing well-being for all (medium confidence). Assessment of 19 demand-side mitigation options and 18 different constituents of well-being show that positive impacts on well-being outweigh negative ones by a factor of 11. {5.2, 5.2.3, Figure 5.6}
Demand-side mitigation options bring multiple interacting benefits (high confidence). Energy services to meet human needs for nutrition, shelter, health, and so on are met in many different ways, with different emissions implications that depend on local contexts, cultures, geography, available technologies, and social preferences. In the near term, many less-developed countries and poor people everywhere require better access to safe and low-emissions energy sources to ensure decent living standards and increase energy savings from service improvements by about 20–25%. {5.2, 5.4.5, Figure 5.3, Figure 5.4, Figure 5.5, Figure 5.6, Box 5.2, Box 5.3}
Granular technologies and decentralised energy end use, characterised by modularity, small unit sizes and small unit costs, diffuse faster into markets and are associated with faster technological learning benefits, greater efficiency, more opportunities to escape technological lock-in, and greater employment (high confidence) . Examples include solar photovoltaic systems, batteries, and thermal heat pumps. {5.3, 5.5, 5.5.3}
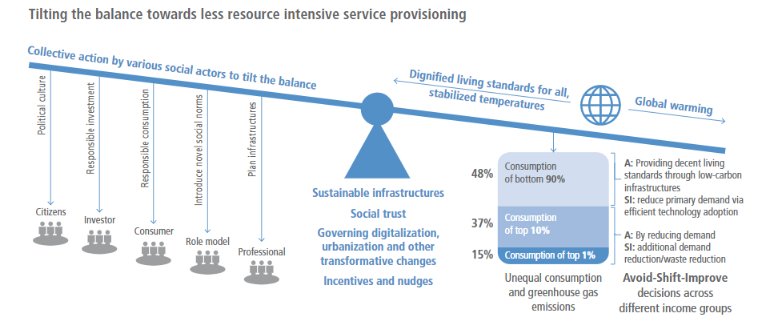
Wealthy individuals contribute disproportionately to higher emissions and have a high potential for emissions reductions while maintaining decent living standards and well-being (high confidence) . Individuals with high socio-economic status are capable of reducing their GHG emissions by becoming role models of low-carbon lifestyles, investing in low-carbon businesses, and advocating for stringent climate policies. {5.4.1, 5.4.3, 5.4.4, Figure 5.14}
Demand-side solutions require both motivation and capacity for change (high confidence). Motivation by individuals or households worldwide to change energy consumption behaviour is generally low. Individual behavioural change is insufficient for climate change mitigation unless embedded in structural and cultural change. Different factors influence individual motivation and capacity for change in different demographics and geographies. These factors go beyond traditional socio-demographic and economic predictors and include psychological variables such as awareness, perceived risk, subjective and social norms, values, and perceived behavioural control. Behavioural nudges promote easy behaviour change, for example ‘Improve ’ actions such as making investments in energy efficiency, but fail to motivate harder lifestyle changes ( high confidence). {5.4}
Meta-analyses demonstrate that behavioural interventions, including the way choices are presented to consumers, 1 work synergistically with price signals, making the combination more effective (medium confidence). Behavioural interventions through nudges, and alternative ways of redesigning and motivating decisions, alone provide small to medium contributions to reduce energy consumption and GHG emissions. Green defaults, such as automatic enrolment in ‘green energy’ provision, are highly effective. Judicious labelling, framing, and communication of social norms can also increase the effect of mandates, subsidies, or taxes. {5.4, 5.4.1, Table 5.3a, Table 5.3b}
Coordinated change in several domains leads to the emergence of new low-carbon configurations with cascading mitigation effects (high confidence) . Demand-side transitions involve interacting and sometimes antagonistic processes on the behavioural, socio-cultural, institutional, business, and technological dimensions. Individual- or sectoral-level change may be stymied by reinforcing social, infrastructural, and cultural lock-ins. Coordinating the way choices are presented to end users and planners, physical infrastructures, new technologies and related business models can rapidly realise system-level change. {5.4.2, 5.4.3, 5.4.4, 5.4.5, 5.5}
Cultural change, in combination with new or adapted infrastructure, is necessary to enable and realise many ‘Avoid’ and ‘Shift’ options (medium confidence). By drawing support from diverse actors, narratives of change can enable coalitions to form, providing the basis for social movements to campaign in favour of (or against) societal transformations. People act and contribute to climate change mitigation in their diverse capacities as consumers, citizens, professionals, role models, investors, and policymakers. {5.4, 5.5, 5.6}
Collective action as part of social or lifestyle movements underpins system change (high confidence). Collective action and social organising are crucial to shift the possibility space of public policy on climate change mitigation. For example, climate strikes have given voice to youth in more than 180 countries. In other instances, mitigation policies allow the active participation of all stakeholders, resulting in building social trust, new coalitions, legitimising change, and thus initiate a positive cycle in climate governance capacity and policies. {5.4.2, Figure 5.14}
Transition pathways and changes in social norms often start with pilot experiments led by dedicated individuals and niche groups (high confidence). Collectively, such initiatives can find entry points to prompt policy, infrastructure, and policy reconfigurations, supporting the further uptake of technological and lifestyle innovations. Individuals’ agency is central as social change agents and narrators of meaning. These bottom-up socio-cultural forces catalyse a supportive policy environment, which enables changes. {5.5.2}
The current effects of climate change, as well as some mitigation strategies, are threatening the viability of existing business practices, while some corporate efforts also delay mitigation action (medium confidence). Policy packages that include job creation programmes help to preserve social trust, livelihoods, respect, and dignity of all workers and employees involved. Business models that protect rent-extracting behaviour may sometimes delay political action. Corporate advertisement and marketing strategies may also attempt to deflect corporate responsibility to individuals or aim to appropriate climate care sentiments in their own brand building. {5.4.3, 5.6.4}
Middle actors – professionals, experts, and regulators – play a crucial, albeit underestimated and underutilised, role in establishing low-carbon standards and practices (medium confidence). Building managers, landlords, energy efficiency advisers, technology installers, and car dealers influence patterns of mobility and energy consumption by acting as middle actors or intermediaries in the provision of building or mobility services and need greater capacity and motivation to play this role. {5.4.3}
Social influencers and thought leaders can increase the adoption of low-carbon technologies, behaviours, and lifestyles (high confidence). Preferences are malleable and can align with a cultural shift. The modelling of such shifts by salient and respected community members can help bring about changes in different service provisioning systems. Between 10% and 30% of committed individuals are required to set new social norms. {5.2.1, 5.4}
Preconditions and Instruments to Enable Demand-side Transformation
Social equity reinforces capacity and motivation for mitigating climate change (medium confidence). Impartial governance such as fair treatment by law and order institutions, fair treatment by gender, and income equity, increases social trust, thus enabling demand-side climate policies. High status (often high carbon) item consumption may be reduced by taxing absolute wealth without compromising well-being. {5.2, 5.4.2, 5.6}
Policies that increase the political access and participation of women, racialised, and marginalised groups increase the democratic impetus for climate action (high confidence). Including more differently situated knowledge and diverse perspectives makes climate mitigation policies more effective. {5.2, 5.6}
Carbon pricing is most effective if revenues are redistributed or used impartially (high confidence). A carbon levy earmarked for green infrastructures or saliently returned to taxpayers corresponding to widely accepted notions of fairness increases the political acceptability of carbon pricing. {5.6, Box 5.11}
Greater contextualisation and granularity in policy approaches better addresses the challenges of rapid transitions towards zero-carbon systems (high confidence). Larger systems take more time to evolve, grow, and change compared to smaller ones . Creating and scaling up entirely new systems takes longer than replacing existing technologies and practices. Late adopters tend to adopt faster than early pioneers. Obstacles and feasibility barriers are high in the early transition phases. Barriers decrease as a result of technical and social learning processes, network building, scale economies, cultural debates, and institutional adjustments. {5.5, 5.6}
The lockdowns implemented in many countries in response to the COVID-19 pandemic demonstrated that behavioural change at a massive scale and in a short time is possible (high confidence). COVID-19 accelerated some specific trends, such as increased uptake of urban cycling. However, the acceptability of collective social change over a longer term towards less resource-intensive lifestyles depends on social mandate building through public participation, discussion and debate over information provided by experts, to produce recommendations that inform policymaking. {Box 5.2}
Mitigation policies that integrate and communicate with the values people hold are more successful (high confidence). Values differ between cultures. Measures that support autonomy, energy security and safety, equity and environmental protection, and fairness resonate well in many communities and social groups. Changing from a commercialised, individualised, entrepreneurial training model to an education cognisant of planetary health and human well-being can accelerate climate change awareness and action. {5.4.1, 5.4.2}
Changes in consumption choices that are supported by structural changes and political action enable the uptake of low-carbon choices (high confidence). Policy instruments applied in coordination can help to accelerate change in a consistent desired direction. Targeted technological change, regulation, and public policy can help in steering digitalisation, the sharing economy, and circular economy towards climate change mitigation. {5.3, 5.6}
Complementarity in policies helps in the design of an optimal demand-side policy mix (medium confidence). In the case of energy efficiency, for example, this may involve CO2 pricing, standards and norms, and information feedback. {5.3, 5.4, 5.6}
5.1Introduction
The Sixth Assessment Report of the IPCC (AR6), for the first time, features a chapter on demand, services, and social aspects of mitigation. It builds on the AR4 and AR5, which linked behaviour and lifestyle change to mitigating climate change (IPCC 2007; Roy and Pal 2009; IPCC 2014a), the Global Energy Assessment (Roy et al. 2012), and the AR5, which identified sectoral demand-side mitigation options across chapters (IPCC 2014a; IPCC 2014b; Creutzig et al. 2016b). The literature on the nature, scale, implementation and implications of demand-side solutions, and associated changes in lifestyles, social norms, and well-being, has been growing rapidly (Creutzig et al. 2021a) (Box 5.2). Demand-side solutions support near-term climate change mitigation (Méjean et al. 2019; Wachsmuth and Duscha 2019) and include consumers’ technology choices, behaviours, lifestyle changes, coupled with production-consumption infrastructures and systems, service provision strategies, and associated socio-technical transitions. This chapter’s assessment of the social sciences (also see Chapter 5 Supplementary Material I) reveals that social dynamics at different levels offer diverse entry points for acting on and mitigating climate change (Jorgenson et al. 2018).
Three entry points are relevant for this chapter. First, well-designed demand for services scenarios are consistent with adequate levels of well-being for everyone (Rao and Baer 2012; Grubler et al. 2018; Mastrucci et al. 2020; Millward-Hopkins et al. 2020), with high and/or improved quality of life (Max-Neef 1995), improved levels of happiness (Easterlin et al. 2010) and sustainable human development (Arrow et al. 2013; Dasgupta and Dasgupta 2017).
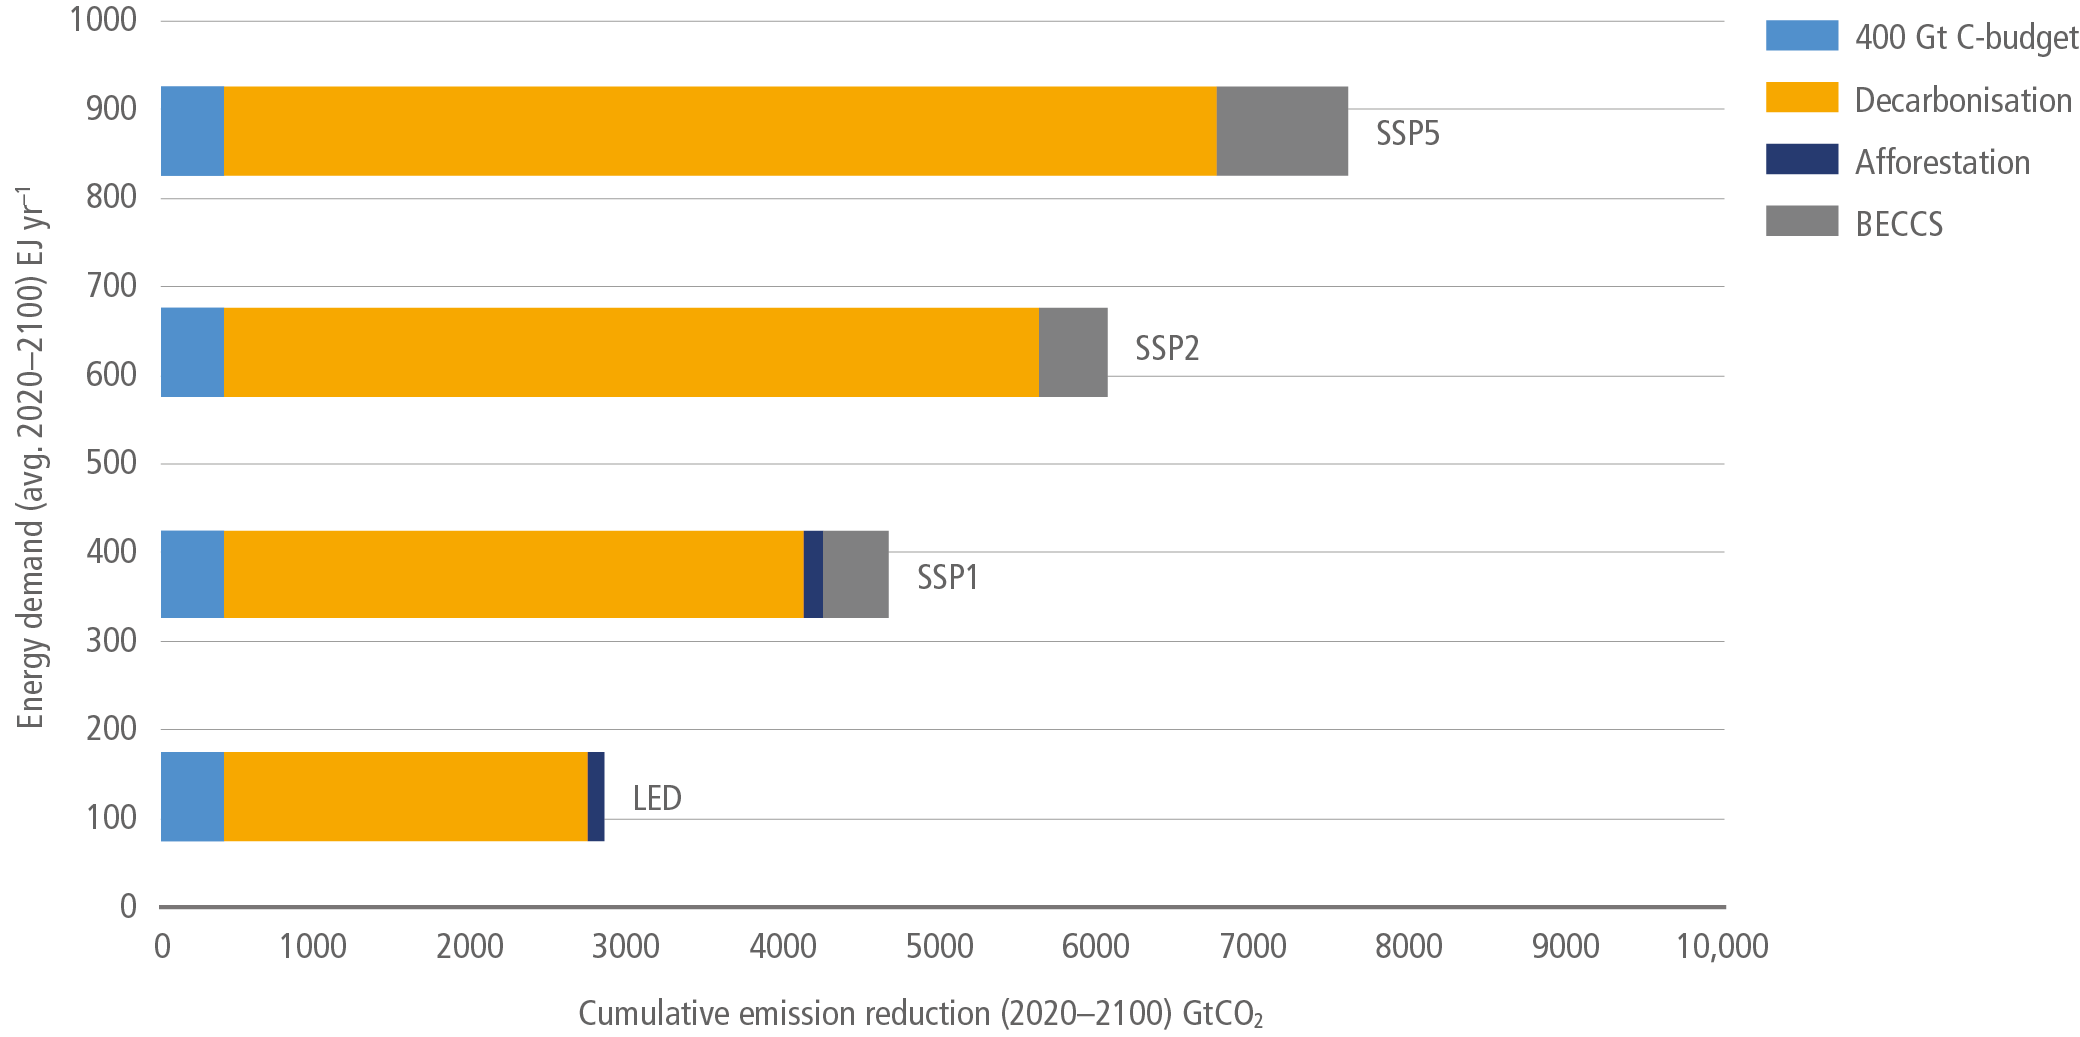
Second, demand-side solutions support staying within planetary boundaries (Haberl et al. 2014; Matson et al. 2016; Hillebrand et al. 2018; Andersen and Quinn 2020; UNDESA 2020; Hickel et al. 2021; Keyßer and Lenzen 2021). Demand side solutions entail fewer environmental risks than many supply-side technologies (Von Stechow et al. 2016). Additionally they make carbon dioxide removal technologies, such as bioenergy with carbon capture and storage (BECCS) less relevant (Van Vuuren et al. 2018) but modelling studies (Grubler et al. 2018; Hickel et al. 2021; Keyßer and Lenzen 2021) still require ecosystem-based carbon dioxide removal. In the IPCC’s Special Report on Global Warming of 1.5°C (SR1.5) (IPCC 2018), four stylised scenarios have explored possible pathways towards stabilising global warming at 1.5°C (IPCC 2014a, Figure SPM.3a) (Figure 5.1) One of these scenarios, LED-19, investigates the scope of demand-side solutions (Figure 5.1). The comparison of scenarios reveals that such low energy demand pathways eliminate the need for technologies with high uncertainty, such as BECCS. Third, interrogating demand for services from the well-being perspective also opens new avenues for assessing mitigation potentials (Brand-Correa and Steinberger 2017; Mastrucci and Rao 2017; Rao and Min 2018a; Mastrucci and Rao 2019; Baltruszewicz et al. 2021). Arguably, demand-side interventions often operate institutionally or in terms of restoring natural functioning and have so far been politically sidelined but COVID-19 revealed interesting perspectives (Box 5.2). Such demand-side solutions also support near-term goals towards climate change mitigation and reduce the need for politically challenging high global carbon prices (Méjean et al. 2019) (Box 5.11). The well-being focus emphasises equity and universal need satisfaction, compatible with progress towards meeting the Sustainable Development Goals (SDGs) (Lamb and Steinberger 2017).

Figure 5.1 | Low Energy Demand Scenario needs no BECCS and needs less decarbonisation effort. Dependence of the size of the mitigation effort to reach a 1.5°C climate target (cumulative GtCO2 emission reduction 2020–2100 by option) as a function of the level of energy demand (average global final energy demand 2020–2100 in EJ yr –1) in baseline and corresponding 1.5°C scenarios (1.9 W m –2 radiative forcing change) based on the IPCC Special Report on Global Warming of 1.5°C (data obtained from the Scenario Explorer database, LED baseline emission data obtained from authors). In this figure an example of remaining carbon budget of 400 Gt has been taken from Rogelj et al. (2019) for illustrative purposes. 400 Gt is also the number given in Table SPM.2 (IPCC 2021, p. 29) for a probability of 67% to limit global warming to 1.5°C.
The requisites for well-being include collective and social interactions as well as consumption-based material inputs. Moreover, rather than material inputs per se, people need and demand services for dignified survival, sustenance, mobility, communication, comfort and material well-being (Nakićenović et al. 1996b; Johansson et al. 2012; Creutzig et al. 2018). These services may be provided in many different context-specific ways using physical resources (biomass, energy, materials, etc.) and available technologies (e.g., cooking tools, appliances). Here we understand demand as demand for services (often requiring material input), with particular focus on services that are required for well-being (such as lighting, accessibility, shelter, etc.), and that are shaped by culturally and geographically differentiated social aspects, choice architectures and the built environment (infrastructures).
Focusing on demand for services broadens the climate solution space beyond technological switches confined to the supply side, to include solutions that maintain or improve well-being related to nutrition, shelter and mobility while (sometimes radically) reducing energy and material input levels (Creutzig et al. 2018; Cervantes Barron 2020; Baltruszewicz et al. 2021; Kikstra et al. 2021b). This also recognises that mitigation policies are politically, economically and socially more feasible, as well as more effective, when there is a two-way alignment between climate action and well-being (OECD 2019a). There is medium evidence and high agreement that well-designed demand for services scenarios are consistent with adequate levels of well-being for everyone (Rao and Baer 2012; Grubler et al. 2018; Rao et al. 2019b; Millward-Hopkins et al. 2020; Kikstra et al. 2021b), with high and/or improved quality of life (Max-Neef 1995; Vogel et al. 2021) and improved levels of happiness (Easterlin et al. 2010) and sustainable human development (Gadrey and Jany-Catrice 2006; Arrow et al. 2013; Dasgupta and Dasgupta 2017). While demand for services is high as development levels increase, and related emissions are growing in many countries (Yumashev et al. 2020; Bamisile et al. 2021), there is also evidence that provisioning systems delink services provided from emissions (Conte Grand 2016; Patra et al. 2017; Kavitha et al. 2020). Various mitigation strategies, often classified into Avoid-Shift-Improve (ASI) options, effectively reduce primary energy demand and/or material input (Haas et al. 2015; Haberl et al. 2017; Samadi et al. 2017; Hausknost et al. 2018; Haberl et al. 2019; Van den Berg et al. 2019; Ivanova et al. 2020). Users’ participation in decisions about how services are provided, not just their technological feasibility, is an important determinant of their effectiveness and sustainability (Whittle et al. 2019; Vanegas Cantarero 2020).
Sector-specific mitigation approaches (Chapters 6–11) emphasise the potential of mitigation via improvements in energy- and materials-efficient manufacturing (Gutowski et al. 2013; Gramkow and Anger-Kraavi 2019; Olatunji et al. 2019; Wang et al. 2019), new product design (Fischedick et al. 2014), energy-efficient buildings (Lucon et al. 2014), shifts in diet (Bajželj et al. 2014; Smith et al. 2014), transport infrastructure design (Sims et al. 2014), and compact urban forms (Seto et al. 2014). In this chapter, service-related mitigation strategies are categorised as ‘Avoid’, ‘Shift’, or ‘Improve’ options to show how mitigation potentials, and social groups who can deliver them, are much broader than usually considered in traditional sector-specific presentations. ASI originally arose from the need to assess the staging and combinations of inter-related mitigation options in the provision of transportation services (Hidalgo and Huizenga 2013). In the context of transportation services, ASI seeks to mitigate emissions through avoiding as much transport service demand as possible (e.g., through telework to eliminate commutes, mixed-use urban zoning to shorten commute distances), shifting remaining demand to more efficient modes (e.g., bus rapid transit replacing passenger vehicles), and improving the carbon intensity of modes utilised (e.g., electric buses powered by renewables) (Creutzig et al. 2016a). This chapter summarises ASI options and potentials across sectors and generalises the definitions. ‘Avoid’ refers to all mitigation options that reduce unnecessary (in the sense of being not required to deliver the desired service output) energy consumption by redesigning service provisioning systems; ‘Shift’ refers to the switch to already existing competitive efficient technologies and service provisioning systems; and ‘Improve’ refers to improvements in efficiency in existing technologies. The Avoid-Shift-Improve framing operates in three domains: Socio-cultural, where social norms, culture, and individual choices play an important role – a category especially, but not only, relevant for ‘Avoid’ options; Infrastructure, which provides the cost and benefit landscape for realising options and is particularly relevant for ‘Shift’ options; and Technologies, especially important for the ‘Improve’ options.
‘Avoid’, ‘Shift’, and ‘Improve’ choices will be made by individuals and households, instigated by salient and respected role models and novel social norms, but will require support by adequate infrastructures designed by urban planners and building and transport professionals, corresponding investments, and a political culture supportive of mitigation action. This is particularly true for many ‘Avoid’ and ‘Shift’ decisions that are difficult because they encounter psychological barriers of breaking routines, habits and imagining new lifestyles and the social costs of not conforming to society (Kaiser 2006). Simpler ‘Improve’ decisions like energy efficiency investments, on the other hand, can be triggered and sustained by traditional policy instruments, complemented by behavioural nudges.
A key concern about climate change mitigation policies is that they may reduce quality of life. Based on growing literature, in this chapter we adopt the concept of decent living standards (DLS, explained further in relation to other individual and collective well-being measures and concepts in the Social Science Primer, Chapter 5 Supplementary Material I) as a universal set of service requirements essential for achieving basic human well-being. DLS includes the dimensions of nutrition, shelter, living condition, clothing, health care, education, and mobility (Frye et al. 2018; Rao and Min 2018b). DLS provides a fair, direct way to understand the basic low-carbon energy needs of society and specifies the underlying minimum material and energy requirements. This chapter also comprehensively assesses related well-being metrics that result from demand-side action, observing overall positive effects (Section 5.3). Similarly, ambitious low-emissions demand-side scenarios suggest that well-being could be maintained or improved while reducing global final energy demand, and some current literature estimates that it is possible to meet decent living standards for all within the 2°C warming window (Grubler et al. 2018; Burke 2020; Keyßer and Lenzen 2021) (Section 5.4). A key concern here is how to blend new technologies with social change to integrate Improving ways of living, Shifting modalities and Avoiding certain kinds of emissions altogether (Section 5.6).
Social practice theory emphasises that material stocks and social relations are key in forming and maintaining habits (Reckwitz 2002; Haberl et al. 2021). This chapter reflects these insights by assessing the role of infrastructures and social norms in GHG emission-intensive or low-carbon lifestyles (Section 5.4).
A core operational principle for sustainable development is equitable access to services to provide well-being for all, while minimising resource inputs and environmental and social externalities/trade-offs, underpinning the Sustainable Development Goals (Princen 2003; Lamb and Steinberger 2017; Dasgupta and Dasgupta 2017). Sustainable development is not possible without changes in consumption patterns within the widely recognised constraints of planetary boundaries, resource availability, and the need to provide decent living standards for all (Langhelle 2000; Toth and Szigeti 2016; O’Neill et al. 2018). Inversely, reduced poverty and higher social equity offer opportunities for delinking demand for services from emissions, for example via more long-term decision-making after having escaped poverty traps and by reduced demand for non-well-being-enhancing status consumption (Nabi et al. 2020; Ortega-Ruiz et al. 2020; Parker and Bhatti 2020; Teame and Habte 2020) (Section 5.3).
Throughout this chapter we discuss how people can realise various opportunities to reduce GHG emission-intensive consumption (Sections 5.2 and 5.3), and act in various roles (Section 5.4), within an enabling environment created by policy instruments and infrastructure that build on social dynamics (Section 5.6).
Box 5.1 | Bibliometric Foundation of Demand-side Climate Change Mitigation
A bibliometric overview of the literature found 99,065 academic peer-reviewed papers identified with 34 distinct search queries addressing relevant content of this chapter (Creutzig et al. 2021a). The literature is growing rapidly (15% yr –1) and the literature body assessed in the AR6 period (2014–2020) is twice as large as all literature published before.
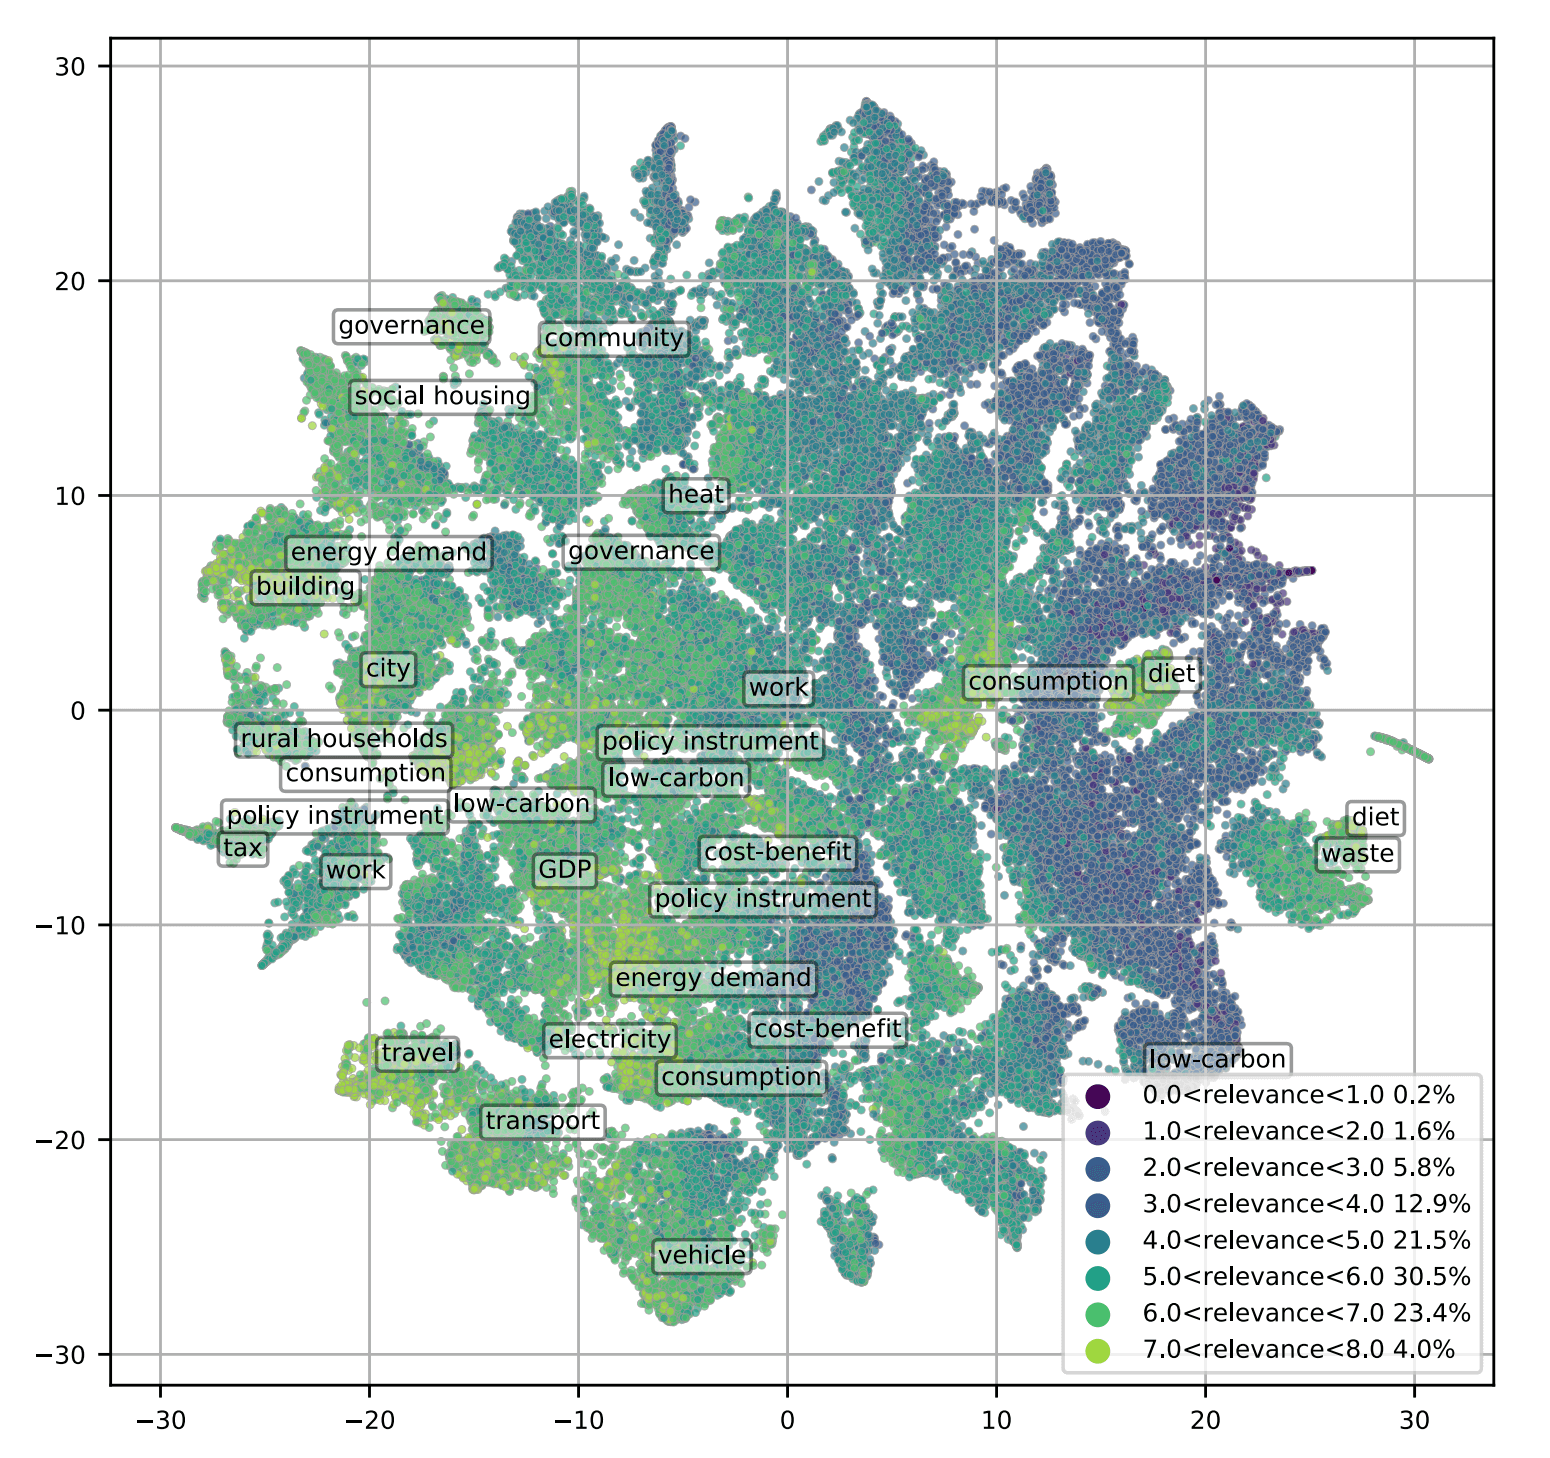
Box 5.1, Figure 1 | Map of the literature on demand, services and socialaspects of climate change mitigation. Dots show document positions obtained by reducing the 60-dimensional topic scores to two dimensions aiming to preserve similarity in overall topic score. The two axes therefore have no direct interpretation but represent a reduced version of similarities between documents across 60 topics. Documents are coloured by query category. Topic labels of the 24 most relevant topics are placed in the centre of each of the large clusters of documents associated with each topic. % value in caption indicates the proportion of studies in each ‘relevance’ bracket. Source: reused with permission from Creutzig et al. (2021a).
A large part of the literature is highly repetitive and/or includes no concepts or little quantitative or qualitative data of relevance to this chapter. For example, a systematic review on economic growth and decoupling identified more than 11,500 papers treating this topic, but only 834 of those, that is, 7%, included relevant data (Wiedenhofer et al. 2020). In another systematic review, assessing quantitative estimates of consumption-based solutions (Ivanova et al. 2020), only 0.8% of papers were considered after consistency criteria were enforced. Altogether, we relied on systematic reviews wherever possible. Other important papers were not captured by systematic reviews but are included in this chapter through expert judgement. Based on topical modelling and relevance coding of resulting topics, the full literature body can be mapped into two dimensions, where spatial relationships indicate topical distance (Box 5.1, Figure 1). The interpretation of topics demonstrates that the literature organises in four clusters of high relevance for demand-side solutions (housing, mobility, food, and policy), whereas other clusters (nature, energy supply) are relatively less relevant.
Section 5.2 provides evidence on the links among mitigation and well-being, services, equity, trust, and governance. Section 5.3 quantifies the demand-side opportunity space for mitigation, relying on the Avoid-Shift-Improve framework. Section 5.4 assesses the relevant contribution of different parts of society to climate change mitigation. Section 5.5 evaluates the overall dynamics of social transition processes while Section 5.6 summarises insights on governance and policy packages for demand-side mitigation and well-being. A Social Science Primer (Chapter 5 Supplementary Material I) defines and discusses key terms and social science concepts used in the context of climate change mitigation.
Box 5.2 | COVID-19, Service Provisioning and Climate Change Mitigation
There is now high evidence and high agreement that the COVID-19 pandemic has increased the political feasibility of large-scale government actions to support the services for provision of public goods, including climate change policies. Many behavioural changes due to COVID-19 reinforce sufficiency and emphasis on solidarity, economies built around care, livelihood protection, collective action, and basic service provision, linked to reduced emissions.
COVID-19 led to direct and indirect health, economic, and confinement-induced hardships and suffering, mostly for the poor, and reset habits and everyday behaviours of the well-off too, enabling a reflection on the basic needs for a good life. Although COVID-19 and climate change pose different kinds of threats and therefore elicit different policies, there are several lessons from COVID-19 for advancing climate change mitigation (Klenert et al. 2020; Manzanedo and Manning 2020; Stark 2020). Both crises are global in scale, requiring holistic societal response; governments can act rapidly, and delay in action is costly (Bouman et al. 2020a; Klenert et al. 2020). The pandemic highlighted the role of individuals in collective action and many people felt morally compelled and responsible to act for others (Budd and Ison, 2020). COVID-19 also taught the effectiveness of rapid collective action (physical distancing, wearing masks, etc.) as contributions to the public good. The messaging about social distancing, wearing masks and handwashing during the pandemic called attention to the importance of effective public information (e.g., also about reducing personal carbon footprints), recognising that rapid pro-social responses are driven by personal and socio-cultural norms (Bouman et al. 2020a; Sovacool et al. 2020a). In contrast, low trust in public authorities impairs the effectiveness of policies and polarises society (Bavel et al. 2020; Hornsey 2020).
During the shutdown, emissions declined relatively most in aviation, and absolutely most in car transport (Le Quéré et al. 2020, Sarkis et al. 2020), and there were disproportionally strong reductions in GHG emissions from coal (Bertram et al. 2021) (Chapter 2). At their peak, CO2 emissions in individual countries decreased by 17% on average (Le Quéré et al. 2020). Global energy demand was projected to drop by 5% in 2020, energy-related CO2 emissions by 7%, and energy investment by 18% (IEA 2020a). COVID-19 shock and recovery scenarios project final energy demand reductions of 1–36 EJ yr −1 by 2025 and cumulative CO2 emission reductions of 14–45 GtCO2 by 2030 (Kikstra et al. 2021a). Plastics use and waste generation increased during the pandemic (Klemeš et al. 2020; Prata et al. 2020). Responses to COVID-19 had important connections with energy demand and GHG emissions due to quarantine and travel restrictions (Sovacool et al. 2020a). Reductions in mobility and economic activity reduced energy use in sectors such as industry and transport, but increased energy use in the residential sector (Diffenbaugh et al. 2020). COVID-19 induced behavioural changes that may translate into new habits, some beneficial and some harmful for climate change mitigation. New digitally-enabled service accessibility patterns (videoconferencing, telecommuting) played an important role in sustaining various service needs while avoiding demand for individual mobility. However, public transit lost customers to cars, personalised two wheelers, walking and cycling, while suburban and rural living gained popularity, possibly with long-term consequences. Reduced air travel, pressures for more localised
Box 5.2
food and manufacturing supply chains (Hobbs 2020; Nandi et al. 2020; Quayson et al. 2020), and governments’ revealed willingness to make large-scale interventions in the economy also reflect sudden shifts in service provisions and GHG emissions, some likely to be lasting (Aldaco et al. 2020; Bilal et al. 2020; Boyer 2020; Hepburn et al. 2020; Norouzi et al. 2020; Prideaux et al. 2020; Sovacool et al. 2020a). If changes in some preference behaviours, for example for larger homes and work environments to enable home working and online education, lead to sprawling suburbs or gentrification with linked environmental consequences, this could translate into long-term implications for climate change (Beaunoyer et al. 2020; Diffenbaugh et al. 2020). Recovering from the pandemic by adopting low energy demand practices – embedded in new travel, work, consumption and production behaviour and patterns – could reduce carbon prices for a 1.5°C consistent pathway by 19%, reduce energy supply investments until 2030 by USD1.8 trillion, and lessen pressure on the upscaling of low-carbon energy technologies (Kikstra et al. 2021a).
COVID-19 drove hundreds of millions of people below poverty thresholds, reversing decades of poverty reduction accomplishments (Krieger 2020; Mahler et al. 2020; Patel et al. 2020; Sumner et al. 2020) and raising the spectre of intersecting health and climate crises that are devastating for the most vulnerable (Flyvbjerg 2020; Phillips et al. 2020). Like those of climate change, pandemic impacts fall heavily on disadvantaged groups, exacerbate the uneven distribution of future benefits, amplify existing inequities, and introduce new ones (Beaunoyer et al. 2020; Devine-Wright et al. 2020). Addressing such inequities is a positive step towards the social trust that leads to improved climate policies as well as individual actions. Increased support for care workers and social infrastructures within a solidarity economy is consistent with lower-emission economic transformation (Shelley 2017; Di Chiro 2019; Pichler et al. 2019; Smetschka et al. 2019).
Fiscally, the pandemic may have slowed the transition to a sustainable energy world: governments redistributed public funding to combat the disease, adopted austerity and reduced capacity. Of nearly 300 policies implemented to counteract the pandemic, the vast majority are related to rescue, including worker and business compensation, and only 4% of these focus on green policies with potential to reduce GHG emissions in the long term; some rescue policies also assist emissions-intensive business (Hepburn et al. 2020; Leach et al. 2021). However, climate investments can double as the basis of the COVID-19 recovery (Stark 2020), with policies focused on both economic multipliers and climate impacts, such as clean physical infrastructure, natural capital investment, clean research and development (R&D) and education and training (Hepburn et al. 2020). This requires attention to investment priorities, including often-underprioritised social investment, given how inequality intersects with, and is a recognised core driver of, environmental damage and climate change (Millward-Hopkins et al. 2020).
5.2 Services, Well-being and Equity in Demand-side Mitigation
As outlined in section 5.1, mitigation, equity and well-being go hand in hand to motivate actions. Global, regional, and national actions and policies that advance inclusive well-being and build social trust strengthen governance. There is high evidence and high agreement that demand-side measures cut across all sectors, and can bring multiple benefits (Mundaca et al. 2019; Wachsmuth and Duscha 2019; Geels 2020; Niamir et al. 2020b; Garvey et al. 2021; Roy et al. 2021). Since effective demand requires affordability, one of the necessary conditions for acceleration of mitigation through demand-side measures is wide and equitable participation from all sectors of society. Low-cost low-emissions technologies, supported by institutions and government policies, can help meet service demand and advance both climate and well-being goals (Steffen et al. 2018a; Khosla et al. 2019). This section introduces metrics of well-being and their relationship to GHG emissions, and clarifies the concept of service provisioning.
5.2.1Metrics of Well-being and their Relationship to Greenhouse Gas Emissions
There is high evidence and high agreement in the literature that human well-being and related metrics provide a societal perspective which is inclusive, compatible with sustainable development, and generates multiple ways to mitigate emissions. Development targeted to basic needs and well-being for all entails less carbon intensity than GDP-focused growth (Rao et al. 2014; Lamb and Rao 2015).
Current socioeconomic systems are based on high-carbon economic growth and resource use (Steffen et al. 2018b). Several systematic reviews confirm that economic growth is tightly coupled with increasing CO2 emissions (Ayres and Warr 2005; Tiba and Omri 2017; Mardani et al. 2019; Wiedenhofer et al. 2020) although the level of emissions depends on inequality (Baležentis et al. 2020; Liu et al. 2020b), and on geographic and infrastructural constraints that force consumers to use fossil fuels (Pottier et al. 2021). Different patterns emerge in the causality of the energy–growth nexus: (i) energy consumption causes economic growth; (ii) growth causes energy consumption; (iii) bidirectional causality; and (iv) no significant causality (Ozturk 2010). In a systematic review, Mardani et al. (2019) found that in most cases, energy use and economic growth have a bidirectional causal effect, indicating that as economic growth increases, further CO2 emissions are stimulated at higher levels; in turn, measures designed to lower GHG emissions may reduce economic growth. However, energy substitution and efficiency gains may offer opportunities to break the bidirectional dependency (Komiyama 2014; Brockway et al. 2017; Shuai et al. 2019). Worldwide trends reveal that at best only relative decoupling (resource use grows at a slower pace than GDP) was the norm during the twentieth century (Jackson 2009; Krausmann et al. 2009; Ward et al. 2016; Jackson 2016), while absolute decoupling (when material use declines as GDP grows) is rare, observed only during recessions or periods of low or no economic growth (Heun and Brockway 2019; Hickel and Kallis 2019; Vadén et al. 2020; Wiedenhofer et al. 2020). Recent trends in OECD countries demonstrate the potential for absolute decoupling of economic growth not only from territorial but also from consumption-based emissions (Le Quéré et al. 2019), albeit at scales insufficient for mitigation pathways (Vadén et al. 2020) (Chapter 2).
Energy demand and demand for GHG-intensive products increased from 2010 until 2020 across all sectors and categories. 2019 witnessed a reduction in energy demand growth rate to below 1% and 2020 an overall decline in energy demand, with repercussions for energy supply disproportionally affecting coal via merit order effects (Bertram et al. 2021) (Cross-Chapter Box 1 in Chapter 1). There was a slight but significant shift from high-carbon beef consumption to medium-carbon intensive poultry consumption. Final energy use in buildings grew from 118 EJ in 2010 to around 128 EJ in 2019 (increased about 8%). The highest increase was observed in non-residential buildings, with a 13% increase against 8% in residential energy demand (IEA 2019a). While electricity accounted for one-third of building energy use in 2019, fossil fuel use also increased at a marginal annual average growth rate of 0.7% since 2010 (IEA 2020a). Energy-related CO2 emissions from buildings have risen in recent years after flattening between 2013 and 2016. Direct and indirect emissions from electricity and commercial heat used in buildings rose to 10 GtCO2 in 2019, the highest level ever recorded. Several factors have contributed to this rise, including growing energy demand for heating and cooling with rising air conditioner ownership and extreme weather events. A critical issue remains how comfortable people feel with temperatures they will be exposed to in the future and this depends on physical, psychological and behavioural factors (Singh et al. 2018; Jacobs et al. 2019). Literature now shows high evidence and high agreement around the observation that policies and infrastructure interventions that lead to change in human preferences are more valuable for climate change mitigation. In economics, welfare evaluations are predominantly based on the preference approach. Preferences are typically assumed to be fixed, so that only changes in relative prices will reduce emissions. However, as decarbonisation is a societal transition, individuals’ preferences do shift and this can contribute to climate change mitigation (Gough 2015). Even if preferences are assumed to change in response to policy, it is nevertheless possible to evaluate policy, and demand-side solutions, by approaches to well-being and welfare that are based on deeper concepts of preferences across disciplines (Roy and Pal 2009; Fleurbaey and Tadenuma 2014; Komiyama 2014; Dietrich and List 2016; Mattauch and Hepburn 2016). In cases of past societal transitions, such as smoking reduction, there is evidence that societies guided the processes of shifting preferences, and values changed along with changing relative prices (Nyborg and Rege 2003; Stuber et al. 2008; Brownell and Warner 2009). Further evidence on changing preferences in consumption choices pertinent to decarbonisation includes Grinblatt et al. (2008) and Weinberger and Goetzke (2010) for mobility; Erb et al. (2016), Muller et al. (2017), and Costa and Johnson (2019) for diets; and Baranzini et al. (2017) for solar panel uptake. If individuals’ preferences and values change during a transition to the low-carbon economy, then this overturns conclusions on what count as adequate or even optimal policy responses to climate change mitigation in economics (Jacobsen et al. 2012; Schumacher 2015; Dasgupta et al. 2016; Daube and Ulph 2016; Ulph and Ulph 2021). In particular, if policy instruments, such as awareness campaigns, infrastructure development or education, can change people’s preferences, then policies or infrastructure provision – socially constrained by deliberative decision making – which change both relative prices and preferences, are more valuable for mitigation than previously thought (Creutzig et al. 2016b; Mattauch et al. 2016; Mattauch et al. 2018). The provisioning context of human needs is participatory, so transformative mitigation potential arises from social as well as technological change (Lamb and Steinberger 2017). Many dimensions of well-being and ‘basic needs’ are social, not individual, in character (Schneider 2016), so extending well-being and DLS analysis to emissions also involves understanding individual situations in social contexts. This includes building supports for collective strategies to reduce emissions (Chan et al. 2019), going beyond individual consumer choice. Climate policies that affect collective behaviour fairly are the most acceptable policies across political ideologies (Clayton 2018); thus collective preferences for mitigation are synergistic with evolving policies and norms in governance contexts that reduce risk, ensure social justice and build trust (Atkinson et al. 2017; Cramton et al. 2017; Milkoreit 2017; Tvinnereim et al. 2017; Smith and Reid 2018; Carattini et al. 2019).
Because of data limitations, which can make cross-country comparisons difficult, health-based indicators and in particular life expectancy (Lamb et al. 2014) have sometimes been proposed as quick and practical ways to compare local or national situations, climate impacts, and policy effects (Decancq et al. 2009; Sager 2017; Burstein et al. 2019). A number of different well-being metrics are valuable in emphasising the constituents of what is needed for a decent life in different dimensions (Lamb and Steinberger 2017; Porter et al. 2017; Smith and Reid 2018). The SDGs overlap in many ways with such indicators, and the data needed to assess progress in meeting the SDGs is also useful for quantifying well-being (Gough 2017). For the purposes of this chapter, indicators directly relating GHG emissions to well-being for all are particularly relevant.
Well-being can be categorised either as ‘hedonic’ or ‘eudaimonic’. Hedonic well-being is related to a subjective state of human motivation, balancing pleasure over pain, and has gained influence in psychology assessing ‘subjective well-being’, assuming that the individual is motivated to enhance personal freedom, self-preservation and enhancement (Sirgy 2012; Brand-Correa and Steinberger 2017; Lamb and Steinberger 2017; Ganglmair-Wooliscroft and Wooliscroft 2019). Eudaimonic well-being focuses on the individual in the broader context, associating happiness with virtue (Sirgy 2012), allowing for the creation of social institutions and political systems and considering their ability to enable individuals to flourish. Eudaimonic analysis supports numerous development approaches (Fanning and O’Neill 2019) such as the capabilities (Sen 1985), human needs (Doyal and Gough 1991; Max-Neef et al. 1991) and models of psychosocial well-being (Ryan and Deci 2001). Measures of well-being differ somewhat in developed and developing countries (Sulemana et al. 2016; Ng and Diener 2019); for example, food insecurity, associated everywhere with lower subjective well-being, is more strongly associated with poor subjective well-being in more-developed countries (Frongillo et al. 2019); in wealthier countries, the relationship between living in rural areas is less strongly associated with negative well-being than in less-developed countries (Requena 2016); and income inequality is negatively associated with subjective well-being in developed countries, but positively so in less-developed countries (Ngamaba et al. 2018). This chapter connects demand-side climate mitigation options to multiple dimensions of well-being, going beyond the single dimensional metric of GDP which is at the core of IAMs. Many demand side-mitigation solutions generate positive and negative impacts on wider dimensions of human well-being which are not always quantifiable (medium evidence, medium agreement ).
5.2.1.1 Services for Well-being
Well-being needs are met through services. Provision of services associated with low energy demand is a key component of current and future efforts to reduce carbon emissions. Services can be provided in various culturally-appropriate ways, with diverse climate implications. There is high evidence and high agreement in the literature that many granular service provision systems can make ‘demand’ more flexible, provide new options for mitigation, support access to basic needs, and enhance human well-being. Energy services offer an important lens to analyse the relationship between energy systems and human well-being (Jackson and Papathanasopoulou 2008; Druckman and Jackson 2010; Mattioli 2016; Walker et al. 2016; Fell 2017; Brand-Correa et al. 2018; King et al. 2019; Pagliano and Erba 2019; Whiting et al. 2020). Direct and indirect services provided by energy, rather than energy itself, deliver well-being benefits (Kalt et al. 2019). For example, illumination and transport are intermediary services in relation to education, health care, meal preparation, sanitation, and so on, which are basic human needs. Sustainable consumption and production revolve around ‘doing more and better with the same’ and thereby increasing well-being from economic activities ‘by reducing resource use, degradation and pollution along the whole lifecycle, while increasing quality of life’ (UNEP 2010). Although energy is required for delivering human development by supporting access to basic needs (Lamb and Rao 2015; Lamb and Steinberger 2017), a reduction in primary energy use and/or shift to low-carbon energy, if associated with the maintenance or improvement of services, can not only ensure better environmental quality but also directly enhance well-being (Roy et al. 2012). The correlation between human development and emissions is not necessarily coupled in the long term, which implies there is a need to prioritise human well-being and the environment over economic growth (Steinberger et al. 2020). At the interpersonal and community levels, cultural specificities, infrastructure, norms, and relational behaviours differ (Box 5.3). For example, demand for space heating and cooling depends on building materials and designs, urban planning, vegetation, clothing and social norms as well as geography, incomes, and outside temperatures (Brand-Correa et al. 2018; Campbell et al. 2018; Ivanova et al. 2018; IEA 2019b; Dreyfus et al. 2020). In personal mobility, different variable needs satisfiers (e.g., street space allocated to cars, buses or bicycles) can help satisfy human needs, such as accessibility to jobs, health care, and education. Social interactions and normative values play a crucial role in determining energy demand. Hence, demand-side and service-oriented mitigation strategies are most effective if geographically and culturally differentiated (Niamir et al. 2020a).
Decent living standards (DLS) serves as a socio-economic benchmark as it views human welfare not in relation to consumption but rather in terms of services which together help meet human needs (e.g., nutrition, shelter, health, etc.), recognising that these service needs may be met in many different ways (with different emissions implications) depending on local contexts, cultures, geography, available technologies, social preferences, and other factors. Therefore, one key way of thinking about providing well-being for all with low carbon emissions centres around prioritising ways of providing services for DLS in a low-carbon way (including choices of needs satisfiers, and how these are provided or made accessible). They may be supplied to individuals or groups or communities, both through formal markets and/or informally, for example by collaborative work, in coordinated ways that are locally appropriate, designed and implemented in accordance with overlapping local needs.
The most pressing DLS service shortfalls, as shown in Figure 5.2, lie in the areas of nutrition, mobility, and communication. Gaps in regions such as Africa and the Middle East are accompanied by current levels of service provision in the highly industrialised countries at much higher than DLS levels for the same three service categories. The lowest population quartile by income worldwide faces glaring shortfalls in housing, mobility, and nutrition. Meeting these service needs using low-emissions energy sources is a top priority. Reducing GHG emissions associated with high levels of consumption and material throughput by those far above DLS levels has potential to address both emissions and inequality in energy and emission footprints (Otto et al. 2019). This, in turn, has further potential benefits; under the conditions of ‘fair’ income reallocation to public services, this can reduce national carbon footprint by up to 30% while allowing the consumption of those at the bottom to increase (Millward-Hopkins and Oswald 2021). The challenge then is to address the upper limits of consumption. When consumption only just supports the satisfaction of basic needs, any decrease causes deficiencies in human-need satisfaction. This is quite unlinke the case of consumption that exceeds the limits of basic needs, in which deprivation causes a subjective discomfort (Brand-Correa et al. 2020). Therefore, to collectively remain within environmental limits, the establishment of minimum and maximum standards of consumption, or sustainable consumption corridors, (Wiedmann et al. 2020) has been suggested, depending on the context. In some countries, carbon-intensive ways of satisfying human needs have been locked-in, for example via car-dependent infrastructures (Jackson and Papathanasopoulou 2008; Druckman and Jackson 2010; Mattioli 2016; King et al. 2019), and both infrastructure reconfiguration and adaptation are required to organise need satisfaction in low-carbon ways (see also Section 10.2).
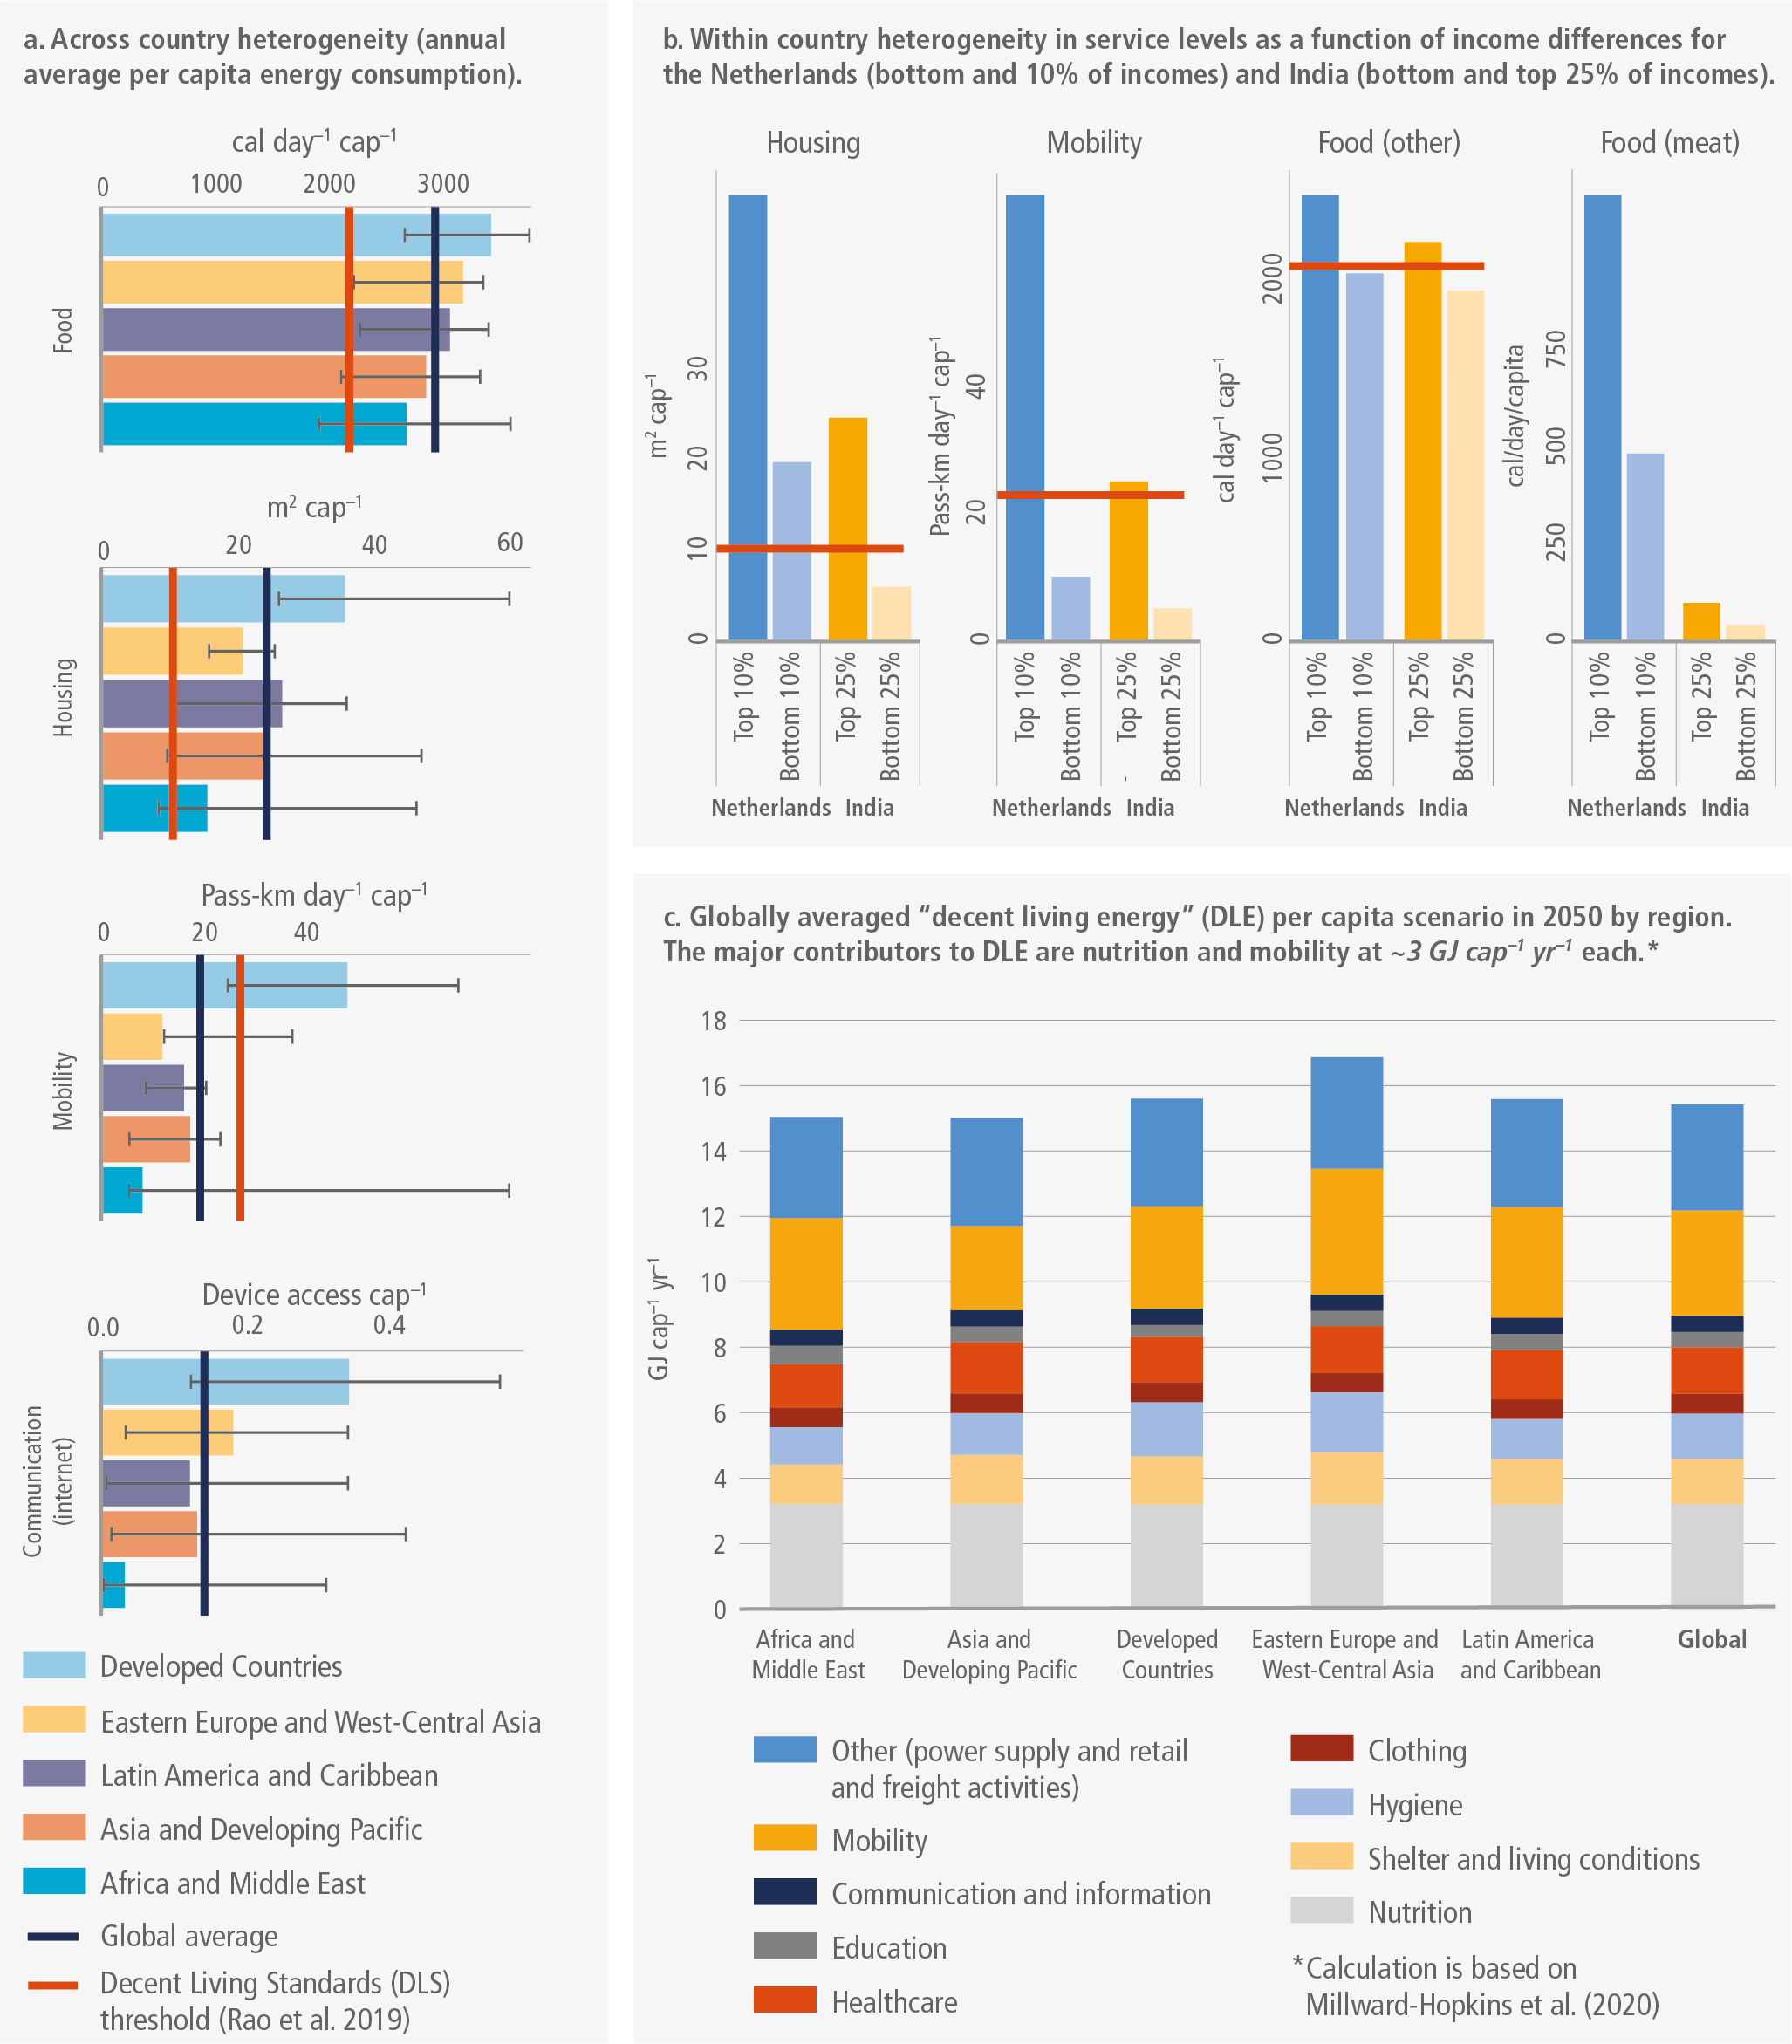
Figure 5.22 | Heterogeneity in access to and availability of services for human well-being within and across countries. Panel (a) Across-country differences in panel (a) food (meat and other), (b) housing, (c) mobility, (d) communication (mobile phones and high-speed internet access). Variation in service levels across countries within a region is shown as error bars (black). Values proposed as decent standards of living threshold (Rao et al. 2019b) are shown as red dashed lines. Global average values are shown as blue dashed lines. Panel (b) Within-country differences in service levels as a function of income differences for the Netherlands (bottom and top 10% of incomes) and India (bottom and top 25% of incomes) (Grubler et al. 2012b) (data update 2016). Panel (c) Decent living energy (DLE) scenario using global, regional and DLS dimensions for final energy consumption at 149 EJ (15.3 GJ cap –1 yr –1) in 2050 (Millward-Hopkins et al. 2020), requiring advanced technologies in all sectors and radical demand-side changes. Values are shown for five world regions based on the AR6 WGIII Regional breakdown. We use passenger kilometres per day per capita (km day–1cap–1) as a metric for mobility only as a reference, however, transport and social inclusion research suggest the aim is to maximise accessibility and not travel levels or travelled distance.
There is high evidence and high agreement in the literature that vital dimensions of human well-being correlate with consumption, but only up to a threshold. High potential for mitigation lies in using low-carbon energy for new basic needs satisfaction while cutting emissions of those whose basic needs are already met (Grubler et al. 2018; Rao and Min 2018b; Rao et al. 2019b; Millward-Hopkins et al. 2020;
Keyßer and Lenzen 2021). Decent living standards indicators serve as tools to clarify this socio-economic benchmark and identify well-being for all compatible mitigation potential. Energy services provisioning opens up avenues of efficiency and possibilities for decoupling energy services demand from primary energy supply, while needs satisfaction leads to the analysis of the factors influencing the energy demand associated with the achievement of well-being (Brand-Correa and Steinberger 2017; Tanikawa et al. 2021). Vital dimensions of well-being correlate with consumption, but only up to a threshold: decent living energy thresholds range from about 13 to 18.4 GJ cap –1 yr –1 of final energy consumption but the current consumption ranges from under 5 GJ cap –1 yr –1 to over 200 GJ cap –1 yr –1 (Millward-Hopkins et al. 2020), thus a mitigation strategy that protects minimum levels of essential-goods service delivery for DLS, but critically views consumption beyond the point of diminishing returns of needs satisfaction, is able to sustain well-being while generating emissions reductions (Goldemberg et al. 1988; Jackson and Marks 1999; Druckman and Jackson 2010; Girod and De Haan 2010; Vita et al. 2019a; Baltruszewicz et al. 2021). Such relational dynamics are relevant both within and between countries, due to variances in income levels, lifestyle choice (see also Section 5.4.4), geography, resource assets and local contexts. Provisioning for human needs is recognised as participatory and inter-relational; transformative mitigation potential can be found in social as well as technological change (Mazur and Rosa 1974; Goldemberg et al. 1985; Lamb and Steinberger 2017; O’Neill et al. 2018; Hayward and Roy 2019; Vita et al. 2019a). More equitable societies which provide DLS for all can devote attention and resources to mitigation (Richards 2003; Dubash 2013; Rafaty 2018; Oswald et al. 2021). For further exploration of these concepts, see Chapter 5 Supplementary Material I.
5.2.2Inequity in Access to Basic Energy Use and Services
5.2.2.1 Variations in Access to Needs-satisfiers for Decent Living Standards
There is very high evidence and very high agreement that globally, there are differences in the amount of energy that societies require to provide the basic needs for everyone. At present nearly one-third of the world’s population are ‘energy poor’, facing challenges in both access and affordability, that is, more than 2.6 billion people have little or no access to energy for clean cooking. About 1.2 billion lack energy for cleaning, sanitation and water supply, lighting, and basic livelihood tasks (Sovacool and Drupady 2016; Rao and Pachauri 2017).The current per capita energy requirement to provide a decent standard of living range from around 5 to 200 GJ cap –1 yr –1 (Steckel et al. 2013; Lamb and Steinberger 2017; Rao et al. 2019b; Millward-Hopkins et al. 2020), which shows the level of inequality that exists; this depends on the context, such as geography, culture, infrastructure or how services are provided (Brand-Correa et al. 2018) (Box 5.3). However, through efficient technologies and radical demand-side transformations, the final energy requirements for providing DLS by 2050 is estimated at 15.3 GJ cap –1 yr –1 (Millward-Hopkins et al. 2020). Recent DLS estimates for Brazil, South Africa, and India are in the range between 15 and 25 GJ cap –1 yr –1 (Rao et al. 2019b).The most gravely energy poor are often those living in informal settlements, particularly women, in sub-Saharan Africa and developing Asia, whose socially-determined responsibilities for food, water, and care are highly labour-intensive and made more intense by climate change (Guruswamy 2016; Wester et al. 2019). In Brazil, India and South Africa, where inequality is extreme (Alvaredo et al. 2018) mobility (51–60%), food production and preparation (21–27%) and housing (5–12%) dominate total energy needs (Rao et al. 2019b). Minimum requirements of energy use consistent with enabling well-being for all is between 20 and 50 GJ cap –1 yr –1 depending on context (Rao et al. 2019b). Inequality in access to and availability of services for human well-being varies in extreme degree across countries and income groups. In developing countries, the bottom 50% receive about 10% of the energy used in land transport and less than 5% in air transport, while the top 10% use about 45% of the energy for land transport and around 75% for air transport (Oswald et al. 2020). Within-country analysis shows that particular groups in China – women born in the rural West with disadvantaged family backgrounds – face unequal opportunities for energy consumption (Shi 2019). Figure 5.3 shows the wide variation across world regions in people’s access to some of the basic material prerequisites for meeting DLS, and variations in energy consumption, providing a starting point for comparative global analysis.
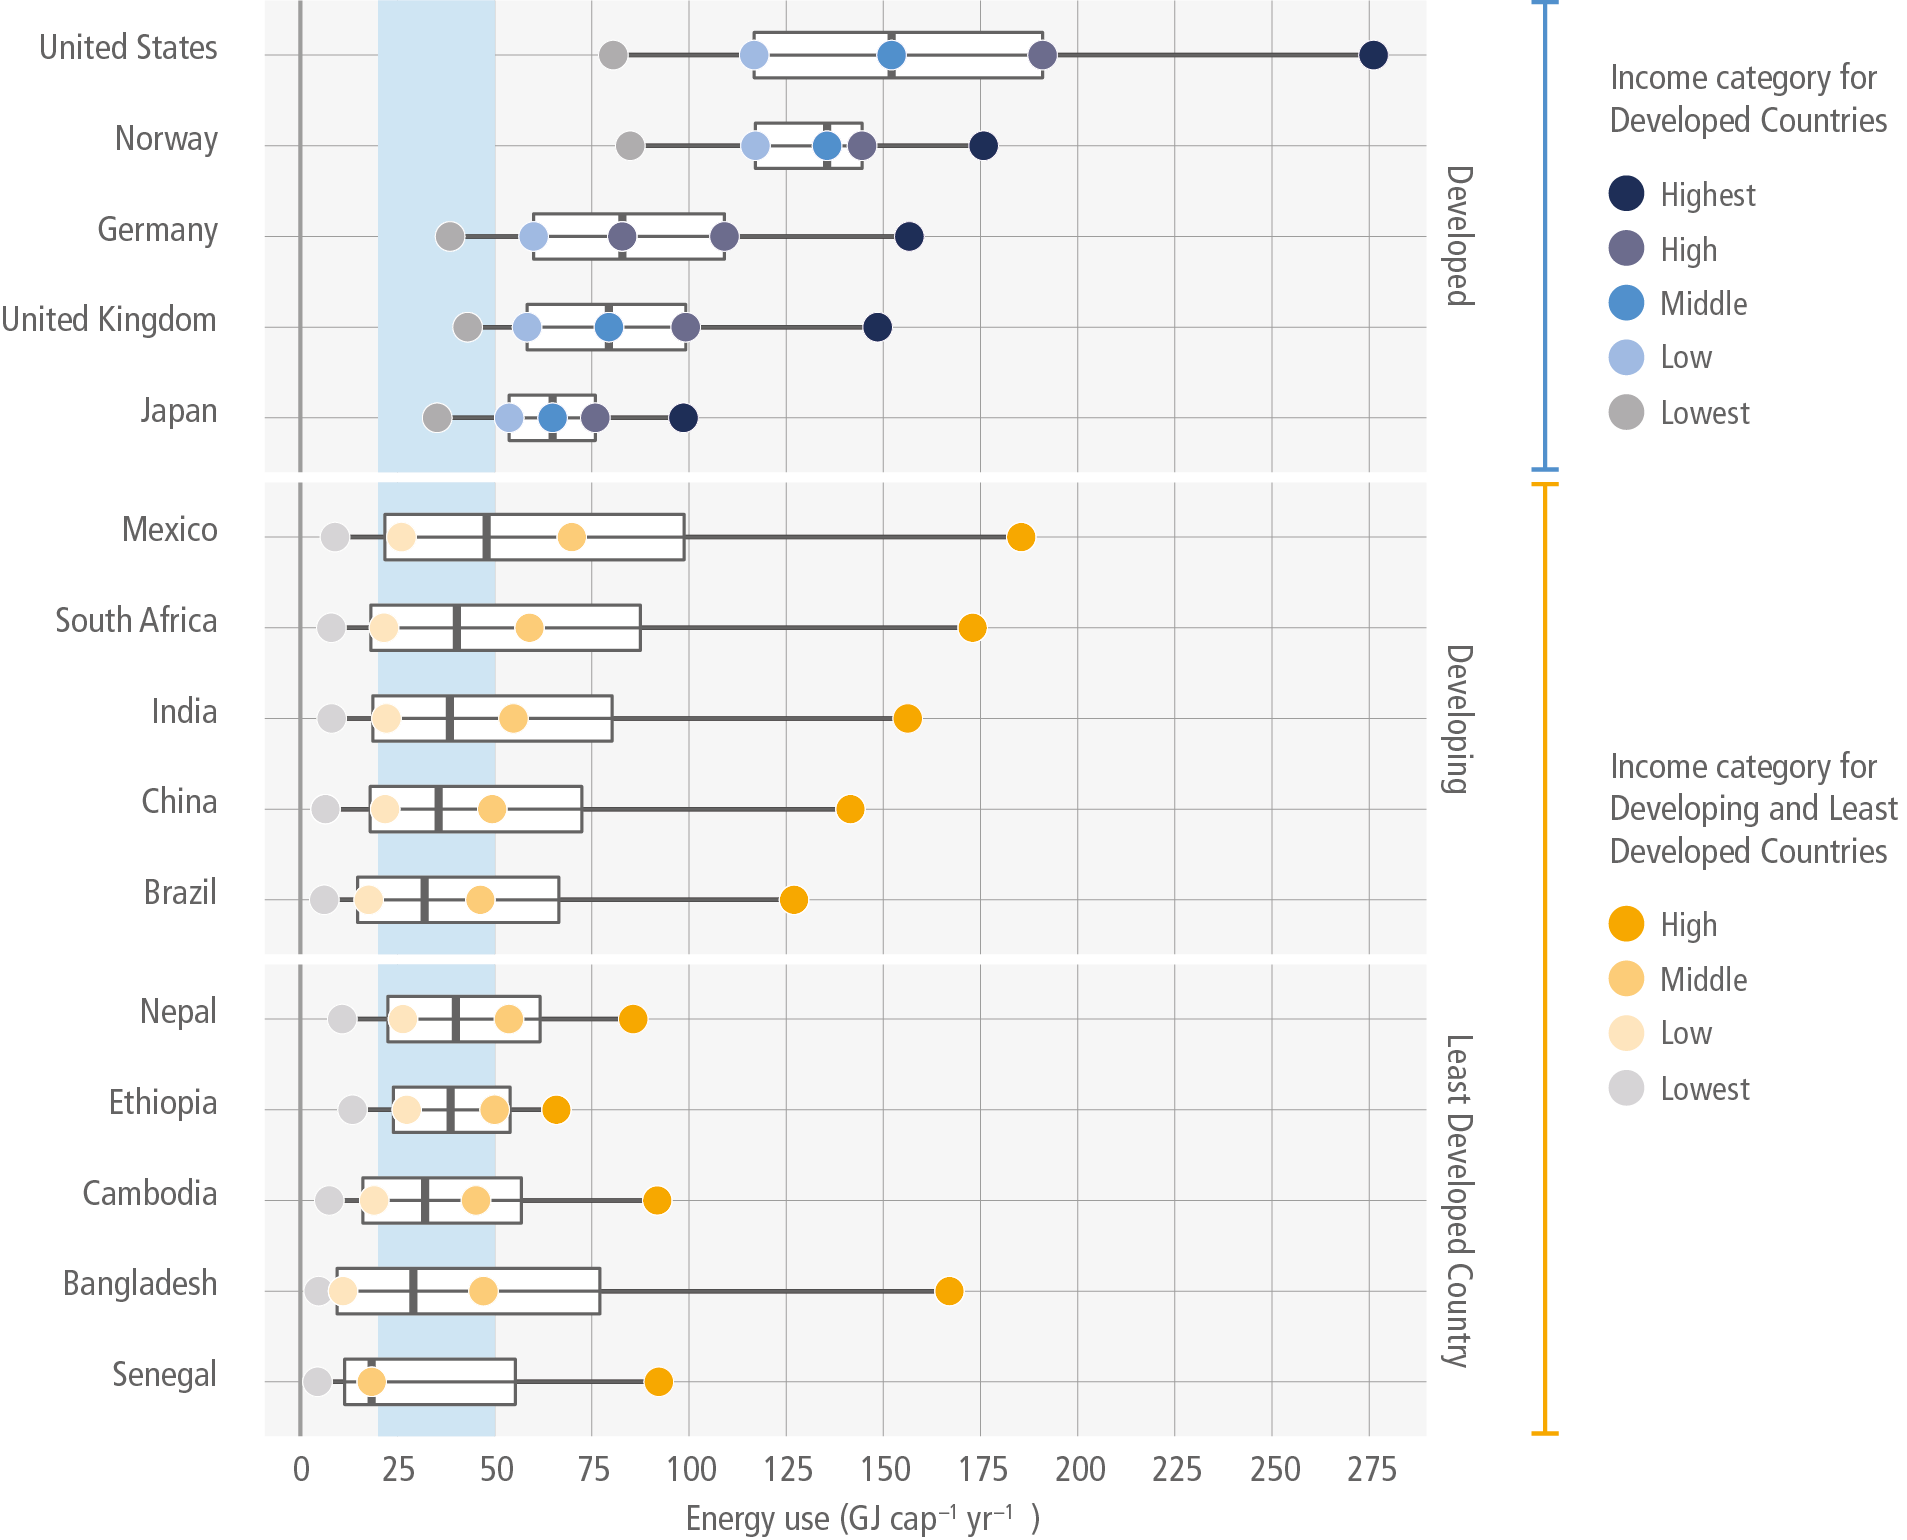
Figure 5.3 | Energy use per capita per year of three groups of countries ranked by socio-economic development and displayed for each country based on four or five different income groups (according to data availability) as well as geographical representation. The final energy use for decent living standards (20–50 GJ cap –1 yr –1) (Rao et al. 2019b) is indicated in the blue column as a reference for global range, rather than dependent on each country. Source: data based on Oswald et al. (2020).
Box 5.3 | Inequities in Access to and Levels of End-use Technologies and Infrastructure Services
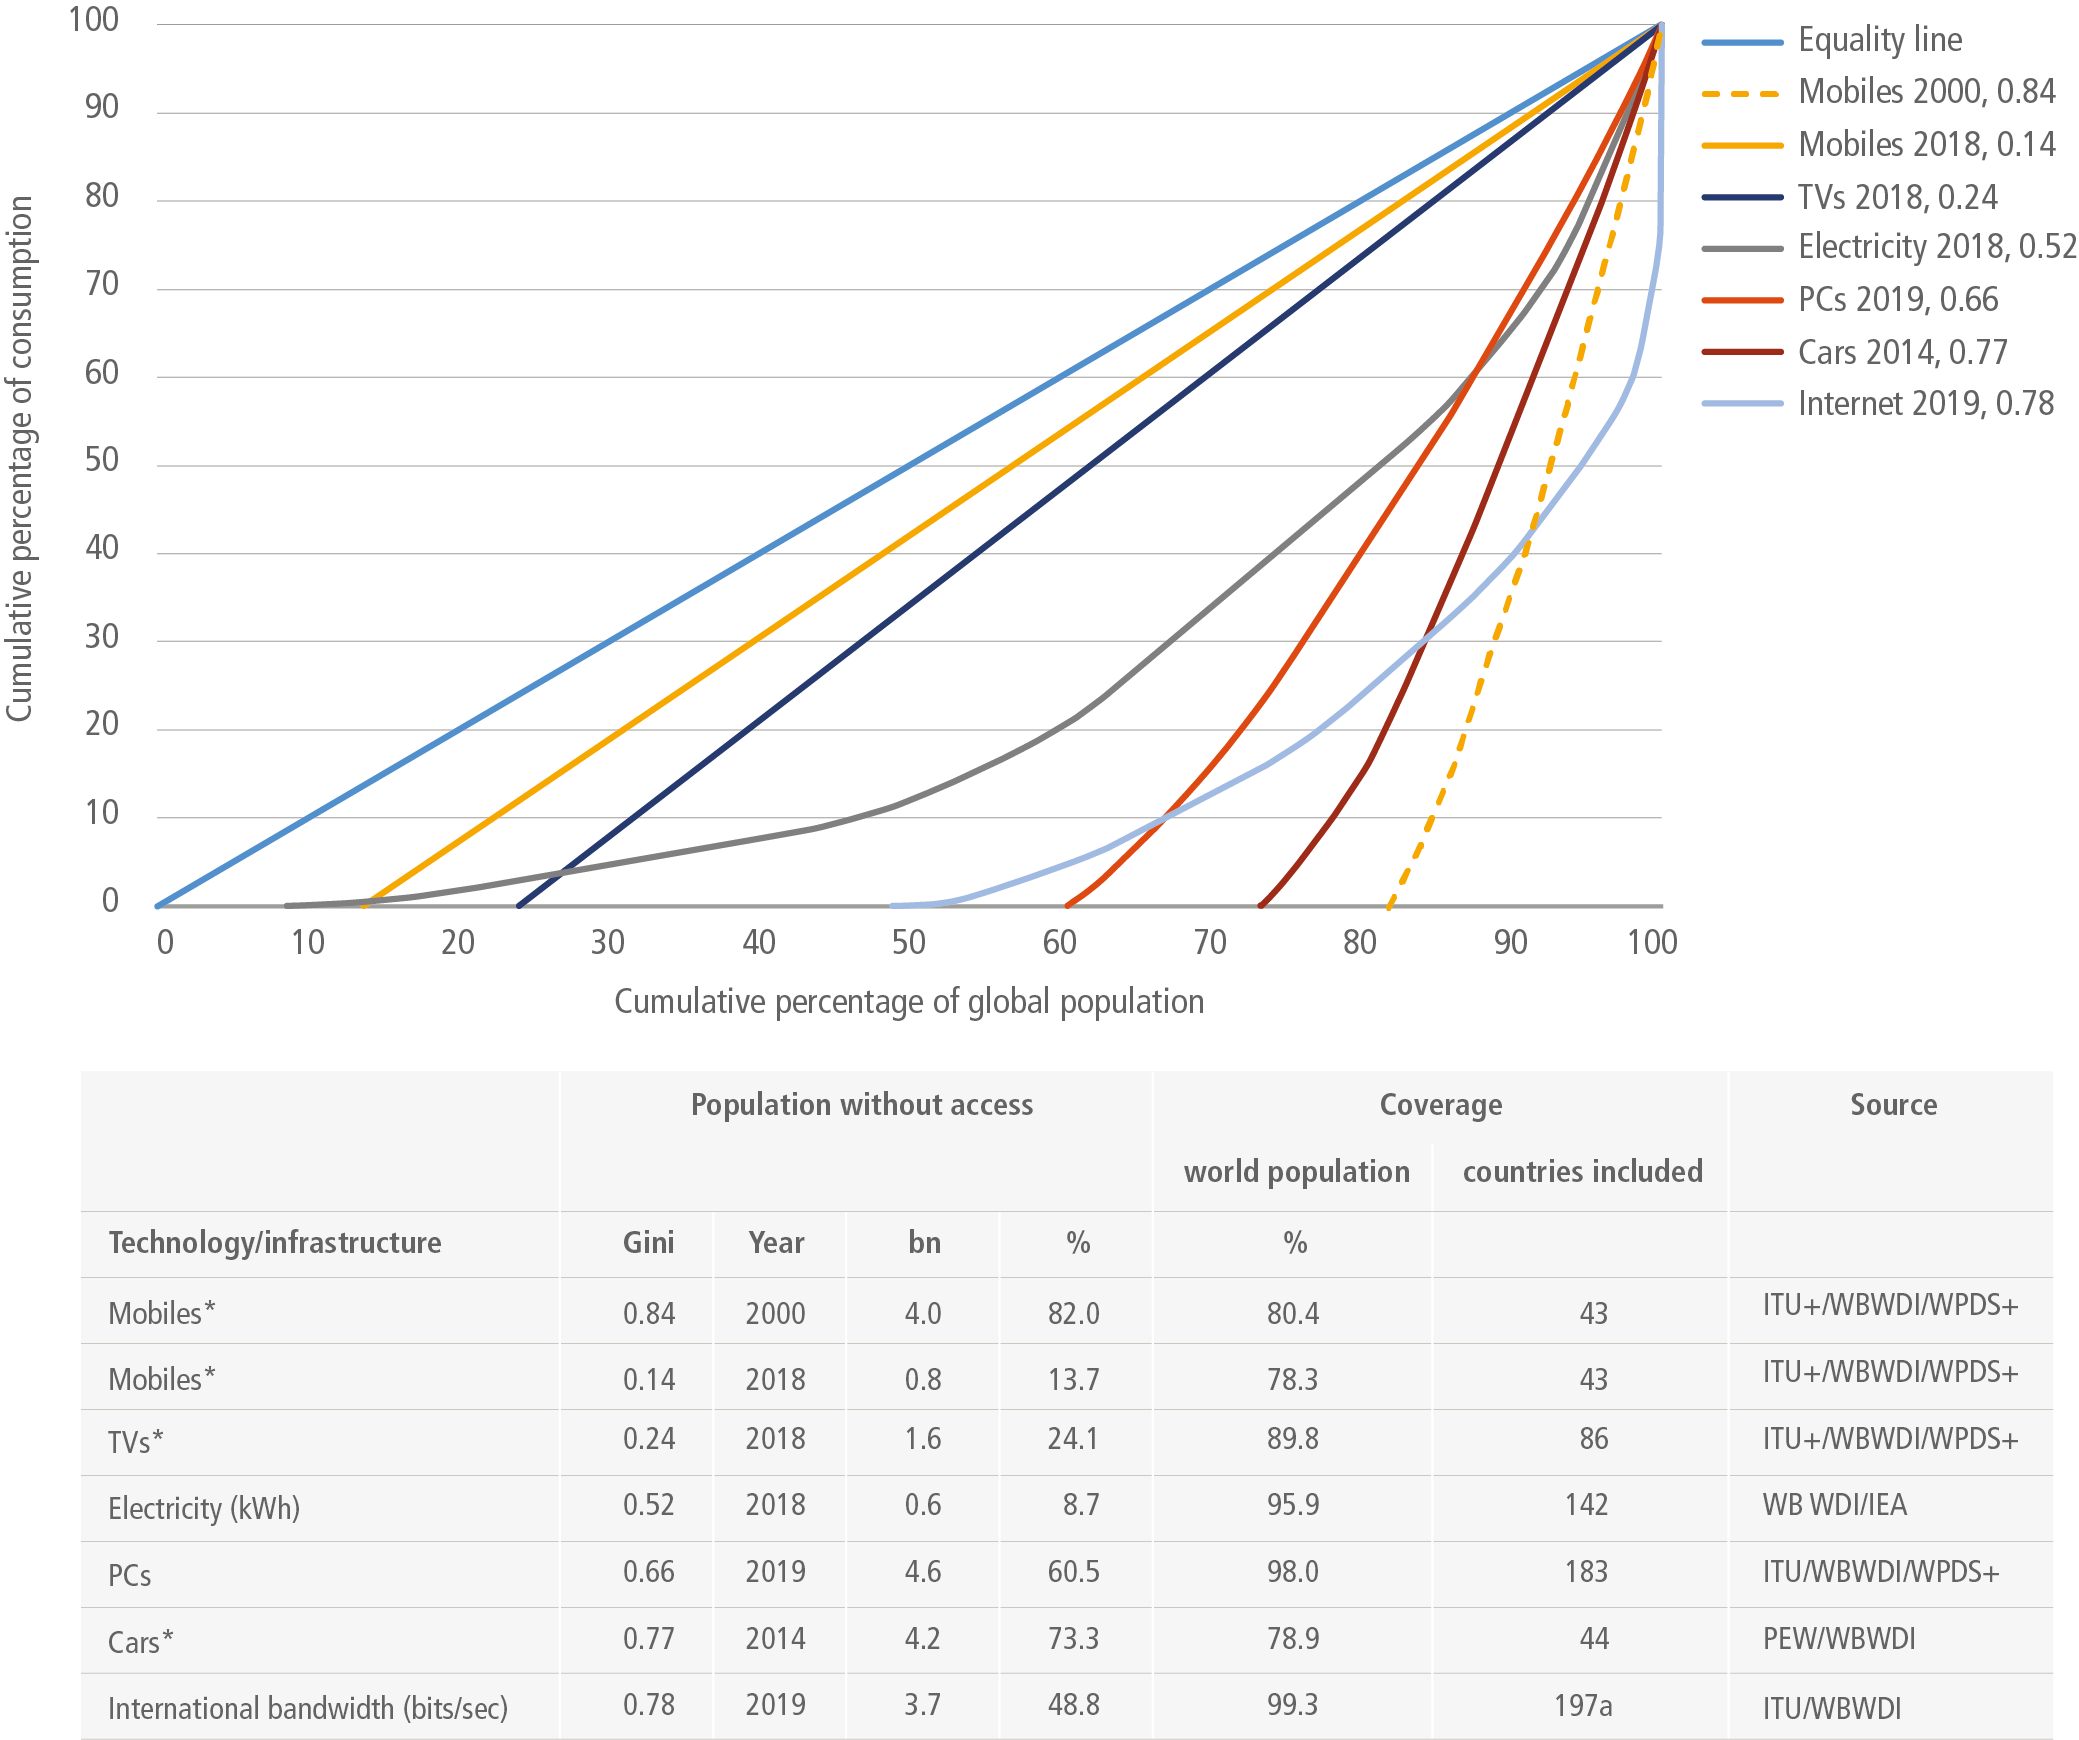
Acceleration in mitigation action needs to be understood from a societal perspective. Technologies, access and service equity factors sometimes change rapidly. Access to technologies, infrastructures and products, and the services they provide, are essential for raising global living standards and improving human well-being (Alkire and Santos 2014; Rao and Min 2018b). Yet access to and levels of service delivery are distributed extremely inequitably as of now. How fast such inequities can be reduced by granular end-use technologies is illustrated by the cellphone (households with mobiles), comparing the situation between 2000 and 2018. In this eighteen-year period, cellphones changed from a very inequitably-distributed technology to one with almost universal access, bringing accessibility benefits especially to populations with very low disposable income and to those whose physical mobility is limited (Porter 2016). Every human has the right to a dignified decent life, to live in good health and to participate in society. This is a daunting challenge, requiring that in the next decade governments build out infrastructure to provide billions of people with access to a number of services and basic amenities in comfortable homes, nutritious food, and transit options (Rao and Min 2018b). For a long time, this challenge was thought to also be an impediment to developing countries’ participation in global climate mitigation efforts. However, recent research shows that this need not be the case (Millward-Hopkins et al. 2020; Rao et al. 2019b).
Several of the Sustainable Development Goals (SDGs) (UN 2015) deal with providing access to technologies and service infrastructures to the share of population so far excluded, showing that the UN 2030 Agenda has adopted a multidimensional perspective on poverty. Multidimensional poverty indices, such as the Social Progress Indicator and the Individual Deprivation Measure, go beyond income and focus on tracking the delivery of access to basic services by the poorest population groups, both in developing countries (Fulton et al. 2009; Alkire and Santos 2014; Alkire and Robles 2017; Rao and Min 2018b), and in developed countries (Townsend 1979; Aaberge and Brandolini 2015; Eurostat 2018). At the same time, the SDGs, primarily SDG 10 on reducing inequalities within and among countries, promote a more equitable world, both in terms of inter- as well as intra-national equality.
Access to various end-use technologies and infrastructure services features directly in the SDG targets and among the indicators used to track their progress (UN 2015; UNESC 2017): Basic services in households (SDG 1.4.1), Improved water sources (SDG 6.1.1); Improved sanitation (SDG 6.1.2); Electricity (SDG 7.1.1); Internet – fixed broadband subscriptions (SDG 17.6.2); Internet – proportion of population using (SDG 17.8.1). Transport (public transit, cars, mopeds or bicycles) and media technologies (mobile phones, TVs, radios, PCs, Internet) can be seen as proxies for access to mobility and communication, crucial for participation in society and the economy (Smith et al. 2015). In addition, SDG 10 is a more conventional income-based inequality goal, referring to income inequality (SDG 10.1), social, economic and political inclusion of all (SDG 10.2.), and equal opportunities and reduced inequalities of outcome (SDG 10.3).

Box 5.3, Figure 1 | International inequality in access and use of goods and services. Upper panel: International Lorenz curves and Gini coefficients accounting for the share of population living in households without access (origin of the curves on the y-axis), multiple ownership not considered. Lower panel: Gini, number of people without access, access rates and coverage in terms of share of global population and number of countries included. *Reduced samples lead to underestimation of inequality. A sample, for example, of around 80% of world population (taking the same 43 countries as for mobiles and cars) led to a lower Gini of around 0.48 (–0.04) for electricity. The reduced sample was kept for mobiles in 2018 to allow for comparability with 2000. Source: Zimm (2019).
5.2.2.2Variations in Energy Use
There is high evidence and high agreement in the literature that through equitable distribution, well-being for all can be assured at the lowest-possible energy consumption levels (Steinberger and Roberts 2010; Oswald et al. 2020) by reducing emissions related to consumption as much as possible, while assuring DLS for everyone (Annecke 2002; de Zoysa 2011; Ehrlich and Ehrlich 2013; Spangenberg 2014; Toroitich and Kerber 2014; Kenner 2015; Toth and Szigeti 2016; Smil 2017; Otto et al. 2019; Baltruszewicz et al. 2021). For example, at similar levels of human development, per capita energy demand in the US was 63% higher than in Germany (Arto et al. 2016); those patterns are explained by context in terms of various climate, cultural and historical factors influencing consumption. Context matters even in within-country analysis, for example, electricity consumption in the US shows that efficiency innovations do exert positive influence on savings of residential energy consumption, but the relationship is mixed; on the contrary, affluence (household income and home size) and context (geographical location) drive resource utilisation significantly (Adua and Clark 2019); affluence is central to any future prospect in terms of environmental conditions (Wiedmann et al. 2020). In China, inequality of energy consumption and expenditure varies highly depending on the energy type, end-use demand and climatic region (Wu et al. 2017).
Consumption is energy- and materials-intensive and expands along with income. About half of the energy used in the world is consumed by the richest 10% of people, most of whom live in developed countries, especially when one includes the energy embodied in the goods they purchase from other countries and the structure of consumption as a function of income level (Arto et al. 2016; Wolfram et al. 2016; Santillán Vera et al. 2021). International trade plays a central role, being responsible for shifting burdens in most cases from low-income developing countries producers to high-income developed countries as consumers (Wiedmann et al. 2020). China is the largest exporter to the EU and United States, and accounts for nearly half and 40% of their imports in energy use respectively (Wu et al. 2019). Wealthy countries have exported or outsourced their climate and energy crisis to low- and middle-income countries (Baker 2018), exacerbated by intensive international trade (Steinberger et al. 2012; Scherer et al. 2018). Therefore, issues of total energy consumption are inseparably related to the energy inequity among the countries and regions of the world.
Within the energy use induced by global consumer products, household consumption is the biggest contributor, contributing to around three-quarters of the global total (Wu et al. 2019). A more granular analysis of household energy consumption reveals that the lowest two quintiles in countries with average annual income below USD15,000 cap –1 yr –1 consume less energy than the international energy requirements for DLS (20–50 GJ cap –1); 77% of people consume less than 30 GJ cap –1 yr –1 and 38% consume less than 10 GJ cap –1 yr –1 (Oswald et al. 2020). Many energy-intensive goods have high price elasticity (>1.0), implying that growing incomes lead to over-proportional growth of energy footprints in these consumption categories. Highly unequally distributed energy consumption is concentrated in the transport sector, ranging from vehicle purchase to fuels, and most unequally in package holidays and aviation (Gössling 2019; Oswald et al. 2020).
Socio-economic dynamics and outcomes affect whether provisioning of goods and services is achieved at low energy demand levels (Figure 5.4). Specifically, multivariate regression shows that public service quality, income equality, democracy, and electricity access enable higher need satisfaction at lower energy demand, whereas extractivism and economic growth beyond moderate levels of affluence reduce need satisfaction at higher energy demand (Vogel et al. 2021). Altogether, this demonstrates that at a given level of energy provided, there is large scope to improve service levels for well-being by modifying socio-economic context without increasing energy supply (Figure 5.4).
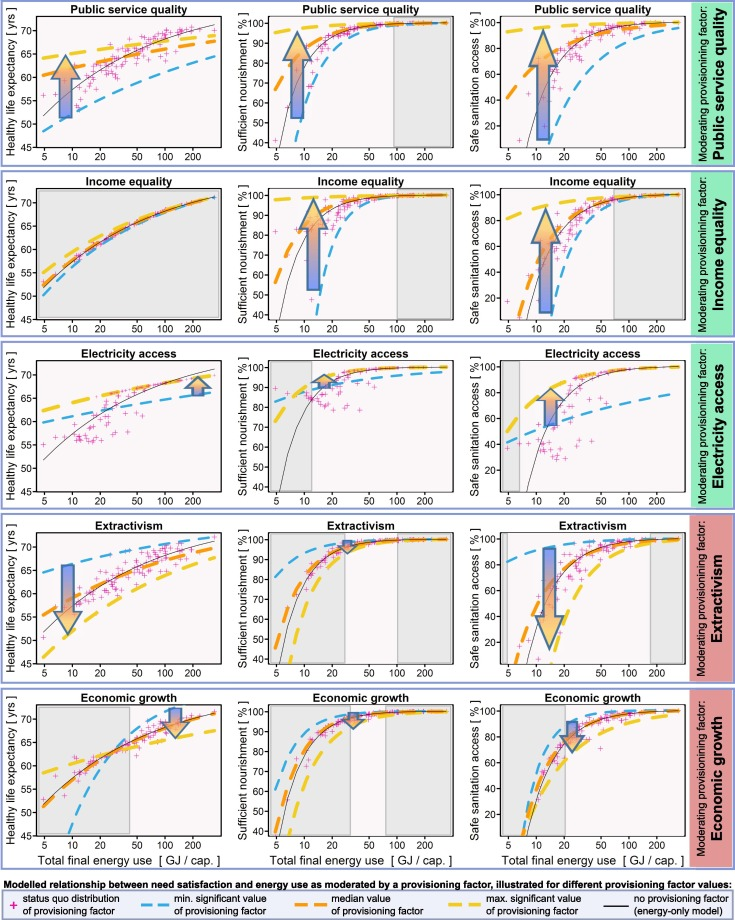
Figure 5.4 | Improving services for well-being is possible, often at huge margin, at a given (relatively low) level of energy use. Source: reused with permission from Vogel et al. (2021).
5.2.2.3Variations in Consumption-based Emissions
The carbon footprint of a nation is equal to the direct emissions occurring due to households’ transport, heating and cooking, as well as the impact embodied in the production of all consumed goods and services (Wiedmann and Minx 2008; Davis and Caldeira 2010; Hübler 2017; Vita et al. 2019a). There are large differences in carbon footprints between the poor and the rich. As a result of energy use inequality, the lowest global emitters (the poorest 10% in developing countries) in 2013 emitted about 0.1 tCO2 cap –1 yr –1, whereas the highest global emitters (the top 1% in the richest countries) emitted about 200–300 tCO2 cap –1 yr –1 (World Bank 2019). The poorest 50% of the world’s population are responsible for only about 10% of total lifetime consumption emissions, in contrast about 50% of the world’s GHG emissions can be attributed to consumption by the world’s richest 10%, with the average carbon footprint of the richest being 175 times higher than that of the poorest 10% (Chancel and Piketty 2015). This richest 10% consumed the global carbon budget by nearly 30% during the period 1990–2015 (Kartha et al. 2020; Gore 2020). While mitigation efforts often focus on the poorest, the lifestyle and consumption patterns of the affluent often influence the growing middle class (Otto et al. 2019). Across EU countries, only 5% of households are living within 1.5°C climate limits and the top 1% emit more than 22 times the target on average, with land and air transport being particular characteristics of the highest-emitting countries (Ivanova and Wood 2020).
In low-income nations – which can exhibit per-capita carbon footprints 30 times lower than wealthy nations (Hertwich and Peters 2009) – emissions are predominantly domestic and driven by provision of essential services (shelter, low-meat diets, clothing). Per capita carbon footprints average 1.6 tonnes per year for the lowest income category, then quickly increase to 4.9 and 9.8 tonnes for the two middle-income categories and finally to an average of 17.9 tonnes for the highest income category. Global CO2 emissions remain concentrated: the top 10% of emitters contribute about 35–45% of the total, while the bottom 50% contribute just 13–15% of global emissions (Chancel and Piketty 2015; Hubacek et al. 2017). In wealthy nations, services such as private road transport, frequent air travel, private jet ownership, meat-intensive diets, entertainment and leisure add significant emissions, while a considerable fraction of the carbon footprint is imported from abroad, embedded in goods and services (Hubacek et al. 2017).
High-income households consume and demand energy at an order of magnitude greater than what is necessary for DLS (Oswald et al. 2020). Energy-intensive goods, such as package holidays, have a higher income elasticity of demand than less energy-intensive goods like food, water supply and housing maintenance, which results in high-income individuals having much higher energy footprints (Oswald et al. 2020). Evidence highlights highly unequal GHG emissions in aviation: only 2–4% of the global population flew internationally in 2018, with 1% of the world population emitting 50% of CO2 from commercial aviation (Gössling and Humpe 2020). Some individuals may add more than 1600 tCO2 yr –1 individually by air travel (Gössling 2019).
The food sector dominates in all income groups, comprising 28% of households’ carbon footprint, with cattle and rice the major contributors (Scherer et al. 2018); food also accounts for 48% and 70% of household impacts on land and water resources respectively, and consumption of meat, dairy, and processed food rise fast asincomes increase (Ivanova et al. 2016). Roughly 20–40% of food produced worldwide is lost to waste before it reaches the market, or is wasted by households, the energy embodied in wasted food was estimated at around 36 EJ yr –1, and during the period 2010–2016 global food loss and waste equalled 8–10% of total GHG emissions (Godfray and Garnett 2014; Springmann et al. 2018; Mbow et al. 2019). Global agri-food supply chains are crucial in the variation of per capita food consumption-related-GHG footprints, mainly in the case of red meat and dairy (Kim et al. 2020) since the highest per capita food-consumption-related GHG emissions do not correlate perfectly with the income status of countries. Thus, it is also crucial to focus on high-emitting individuals and groups within countries, rather than only those who live in high-emitting countries, since the top 10% of emitters live on all continents and one-third of them are from the developing world (Chakravarty et al. 2009; Pan et al. 2019).
The environmental impact of increasing equity across income groups can be either positive or negative (Hubacek et al. 2017; Rao and Min 2018a; Scherer et al. 2018; Millward-Hopkins et al. 2020). Projections for achieving equitable levels of service provision globally predict large increases in global GHG emissions and demand for key resources (Blomsma and Brennan 2017), especially in passenger transport, which is predicted to increase nearly three-fold between 2015 and 2050, from 44 trillion to 122 trillion passenger-kilometres (OECD 2019a), and associated infrastructure needs, increasing freight (Murray et al. 2017), increasing demand for cooling (IEA 2018), and shifts to carbon-intensive high-meat diets (OECD/FAO 2018).
Increasing incomes for all to attain DLS raises emissions and energy footprints, but only slightly (Chakravarty et al. 2009; Jorgenson et al. 2016; Scherer et al. 2018; Millward-Hopkins et al. 2020; Oswald et al. 2020; Oswald et al. 2021). The amount of energy needed for a high global level of human development is dropping (Steinberger and Roberts 2010) and could by 2050 be reduced to 1950 levels (Millward-Hopkins et al. 2020) requiring a massive deployment of technologies across the different sectors as well as demand-side reduction consumption. The consumption share of the bottom half of the world’s population represents less than 20% of all energy footprints, which is less than what the top 5% of people consume (Oswald et al. 2020).
Income inequality itself also raises carbon emissions (Hao et al. 2016; Sinha 2016; Uzar and Eyuboglu 2019; Baloch et al. 2020; Oswald et al. 2020; Wiedmann et al. 2020; Vogel et al. 2021). Wide inequality can increase status-based consumption patterns, where individuals spend more to emulate the standards of the high-income group (the Veblen effect); inequality also diminishes environmental efforts by reducing social cohesion and cooperation (Jorgenson et al. 2017) and finally, inequality also operates by inducing an increase in working hours that leads to higher economic growth and, consequently, higher emissions and ecological footprint, so working time reduction is key for policy to both reduce emissions and protect employment (Fitzgerald et al. 2015; Fitzgerald et al. 2018).
5.2.3Equity, Trust, and Participation in Demand-side Mitigation
There is high evidence and high agreement in literature that socio-economic equity builds not only well-beingfor all, but also trust and effective participatory governance,which in turn strengthen demand-side climate mitigation. Equity, participation, social trust, well-being, governance and mitigation are parts of a continuous interactive and self-reinforcing process (Figure 5.5). Chapter 5 Supplementary Material I (Section 5.SM.1) contains more detail on these links, drawing from social science literature.
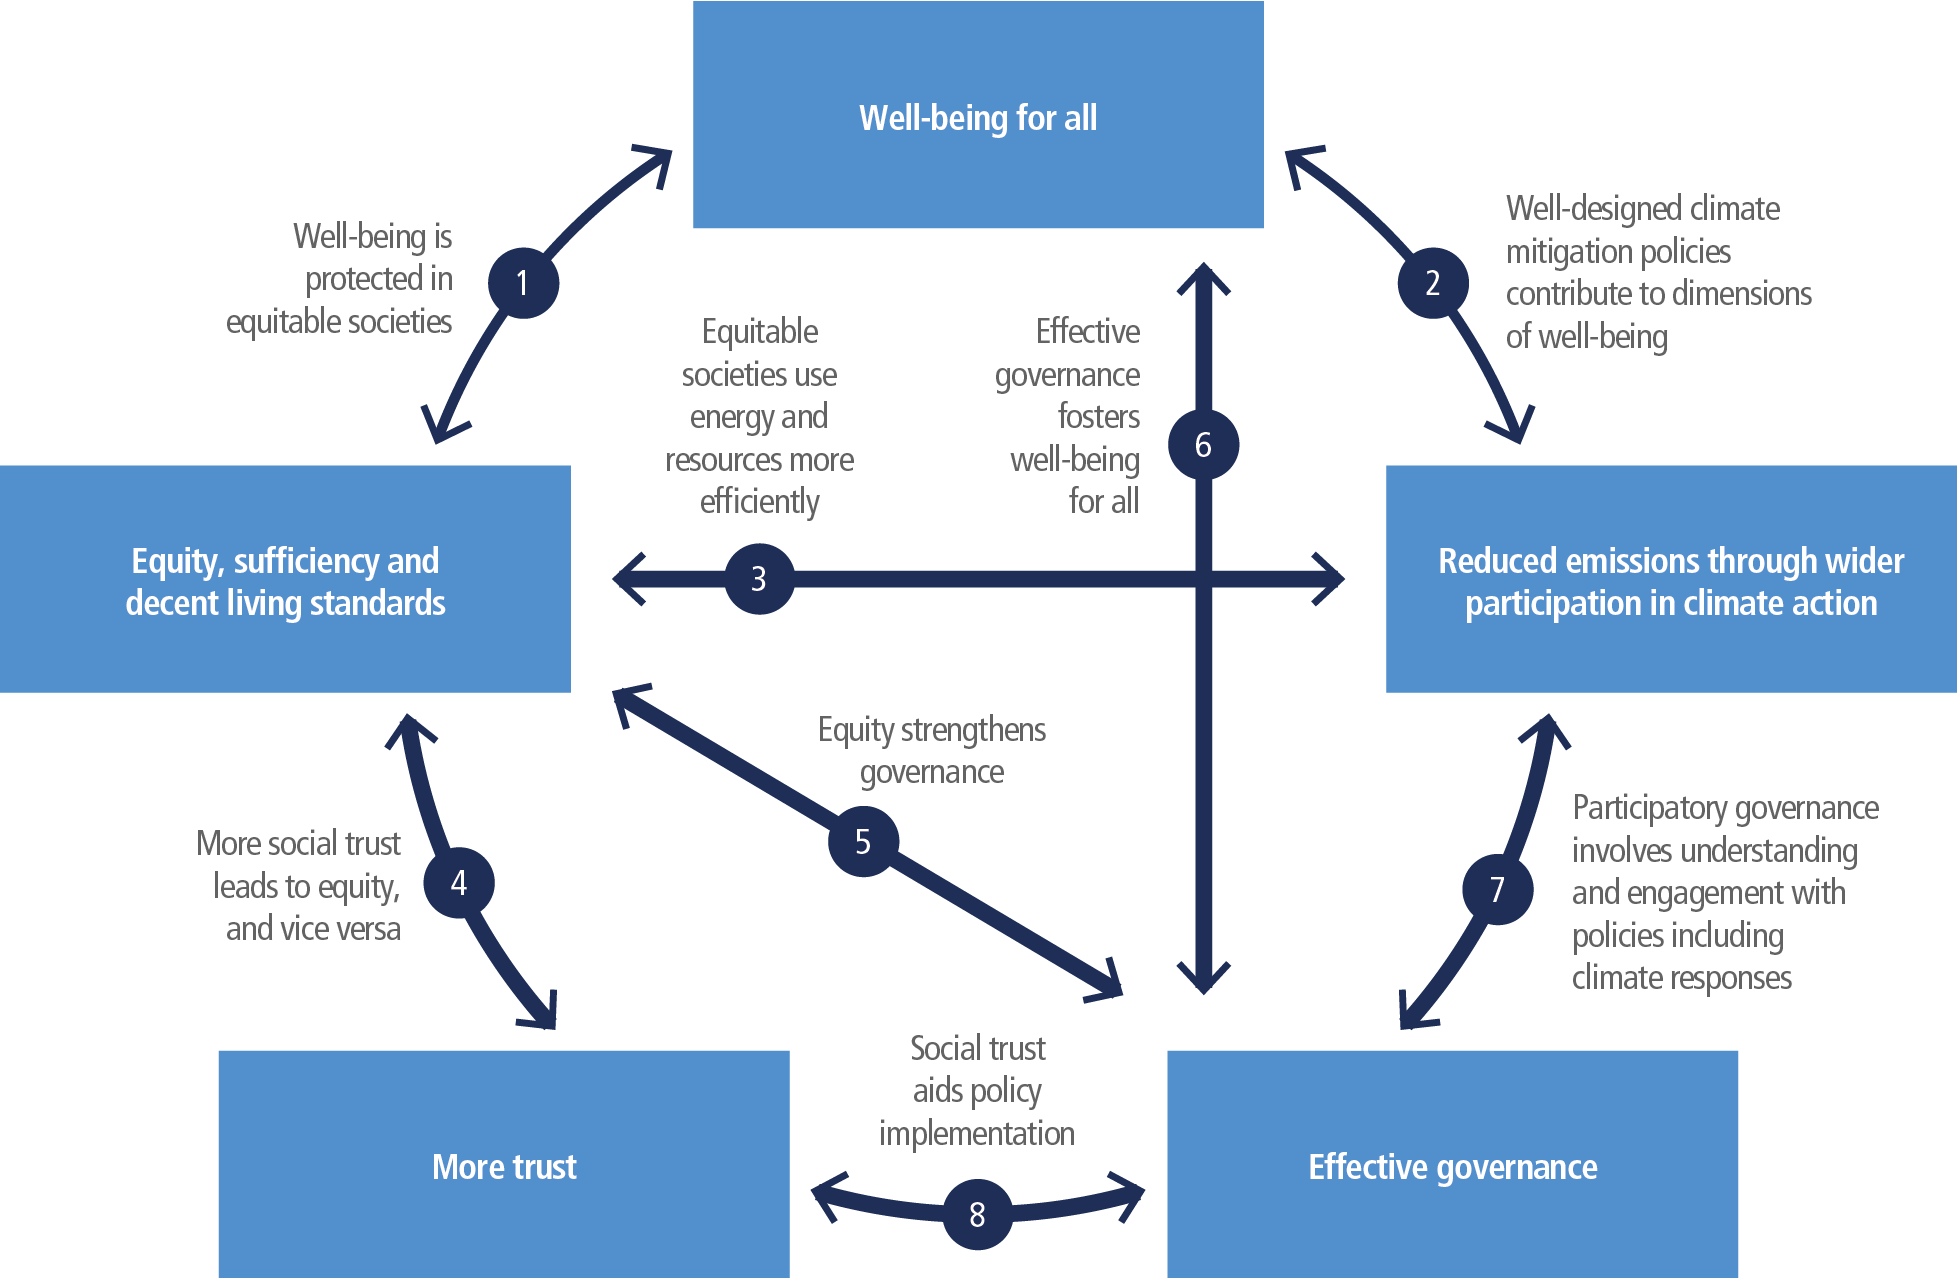
Figure 5.5 | Well-being, equity, trust, governance and climate mitigation: positive feedbacks. Well-being for all, increasingly seen as the main goal of sustainable economies, reinforces emissions reductions through a network of positive feedbacks linking effective governance, social trust, equity, participation and sufficiency. This diagram depicts relationships noted in this chapter text and explained further in the Social Science Primer (Chapter 5 Supplementary Material I). The width of the arrows corresponds to the level of confidence and degree of evidence from recent social sciences literature.
Economic growth in equitable societies is associated with lower emissions than in inequitable societies (McGee and Greiner 2018), and income inequality is associated with higher global emissions (Ravallion et al. 1997; McGee and Greiner 2018; Rao and Min 2018c; Diffenbaugh and Burke 2019; Fremstad and Paul 2019; Liu and Hao 2020). Relatively slight increases in energy consumption and carbon emissions produce great increases in human development and well-being in less-developed countries, and the amount of energy needed for a high global level of human development is dropping (Steinberger and Roberts 2010). Equitable and democratic societies which provide high quality public services to their population have high well-being outcomes at lower energy use than those which do not, whereas those which prioritise economic growth beyond moderate incomes and extractive sectors display a reversed effect (Vogel et al. 2021).
Well-designed climate mitigation policies ameliorate constituents of well-being (Creutzig et al. 2021b). The study shows that of all demand-side option effects on well-being, 79% are positive, 18% are neutral (or not relevant or specified), and only 3% are negative ( high confidence) (Creutzig et al. 2021b) (Figure 5.6). Figure 5.6 illustrates that active mobility (cycling and walking), efficient buildings and prosumer choices of renewable technologies have the most encompassing beneficial effects on well-being, with no negative outcomes detected. Urban and industry strategies are highly positive overall for well-being, but they will also reshape supply-side businesses with transient intermediate negative effects. Shared mobility, like all the others, has overall highly beneficial effects on well-being, but also displays a few negative consequences, depending on implementation, such as a minor decrease in personal security for patrons of ride-sourcing.

Figure 5.6 | Two-way link between demand-side climate mitigation strategies and multiple dimensions of human well-being and SDGs. All demand-side mitigation strategies improve well-being in sum, though not necessarily in each individual dimension. Incumbent business (in contrast to overall economic performance) may be challenged. Source: Creutzig et al. (2021b).
Well-being improvements are most notable in health, air, and energy ( high confidence). These categories are also most substantiated in the literature, often under the framing of co-benefits. In many cases, co-benefits outweigh the mitigation benefits of specific GHG emission reduction strategies. Food (medium confidence), mobility ( high confidence), and water (medium confidence) are further categories where well-being is improved. Mobility has entries with highest well-being rankings for teleworking, compact cities, and urban system approaches. Effects on well-being in water and sanitation mostly come from buildings and urban solutions. Social dimensions, such as personal security, social cohesion, and especially political stability, are less predominantly represented. An exception is economic stability, suggesting that demand-side options generate stable opportunities to participate in economic activities ( high confidence). Although the relation between demand-side mitigation strategies and the social aspects of human well-being is important, this has been less reflected in the literature so far, and hence the assessment finds more neutral/unknown interactions (Figure 5.6).
Policies designed to foster higher well-being for all via climate mitigation include reducing emissions through wider participation in climate action, building more effective governance for improved mitigation, and including social trust, greater equity, and informal-sector support as integral parts of climate policies. Public participation facilitates social learning and people’s support of and engagement with climate change priorities; improved governance is closely tied to effective climate policies (Phuong et al. 2017). Better education, health care, valuing of social diversity, and reduced poverty – characteristics of more equal societies – all lead to resilience, innovation, and readiness to adopt progressive and locally-appropriate mitigation policies, whether high-tech or low-tech, centralised or decentralised (Tanner et al. 2009; Lorenz 2013; Chu 2015; Cloutier et al. 2015; Mitchell 2015; Martin and Shaheen 2016; Vandeweerdt et al. 2016; Turnheim et al. 2018). Moreover, these factors are the ones identified as enablers of high need satisfaction at lower energy use (Vogel et al. 2021).
There is less policy lock-in in more equitable societies (Seto et al. 2016). International communication, networking, and global connections among citizens are more prevalent in more equitable societies, and these help spread promising mitigation approaches (Scheffran et al. 2012). Climate-related injustices are addressed where equity is prioritised (Klinsky and Winkler 2014). Thus, there is high confidence in the literature that addressing inequities in income, wealth, and DLS not only raises overall well-being and furthers the SDGs but also improves the effectiveness of climate change mitigation policies. For example, job creation, retraining for new jobs, local production of livelihood necessities, social provisioning, and other positive steps toward climate mitigation and adaptation are all associated with more equitable and resilient societies (Okvat and Zautra 2011; Bentley 2014; Klinsky et al. 2016; Roy et al. 2018a). At all scales of governance, the popularity and sustainability of climate policies requires attention to the fairness of their health and economic implications for all, and participatory engagement across social groups – a responsible development framing (Cazorla and Toman 2001; Dulal et al. 2009; Chuku 2010; Shonkoff et al. 2011; Navroz 2019; Hofstad and Vedeld 2020; Muttitt and Kartha 2020; Roy and Schaffartzik 2020; Temper et al. 2020; Waller et al. 2020). Far from being secondary or even a distraction from climate mitigation priorities, an equity focus is intertwined with mitigation goals (Klinsky et al. 2016). Demand-side climate mitigation options have pervasive ancillary, equity-enhancing benefits, for example for health, local livelihoods, and community forest resources (Chhatre and Agrawal 2009; Garg 2011; Shaw et al. 2014; Serrao-Neumann et al. 2015; Klausbruckner et al. 2016; Salas and Jha 2019) (Figure 5.6). Limiting climate change risks is fundamental to collective well-being (Max-Neef et al. 1989; Yamin et al. 2005; Nelson et al. 2013; Gough 2015; Gough 2017; Pecl et al. 2017; Tschakert et al. 2017). Section 5.6 discusses well-designed climate policies more fully, with examples. Rapid changes in social norms which are underway and which underlie socially-acceptable climate policy initiatives are discussed in section 5.4.
The distinction between necessities and luxuries helps to frame a growing stream of social sciences literature with climate policy relevance (Arrow et al. 2004; Ramakrishnan and Creutzig 2021). Given growing public support worldwide for strong sustainability, sufficiency, and sustainable consumption, changing demand patterns and reduced demand are accompanying environmental and social benefits (Jackson 2008; Fedrigo et al. 2010; Schroeder 2013; Figge et al. 2014; Spangenberg and Germany 2016; Spengler 2016; Burke 2020; Mont et al. 2020). Beyond a threshold, increased material consumption is not closely correlated with improvements in human progress (Frank 1999; Kahneman and Deaton 2010; Steinberger and Roberts 2010; Roy et al. 2012; Oishi et al. 2018; Xie et al. 2018; Vita et al. 2019b; Wang et al. 2019; Vita et al. 2020). Policies focusing on the ‘super-rich’, also called the ‘polluter elite’, are gaining attention for moral or norms-based as well as emissions-control reasons (Kenner 2019; Otto et al. 2019; Pascale et al. 2020; Stratford 2020) (Section 5.2.2.3). Conspicuous consumption by the wealthy is the cause of a large proportion of emissions in all countries, related to expenditures on such things as air travel, tourism, large private vehicles and large homes (Brand and Boardman 2008; Roy and Pal 2009; Roy et al. 2012; Brand and Preston 2010; Gore 2015; Hubacek et al. 2017; Jorgenson et al. 2017; Sahakian 2018; Gössling 2019; Kenner 2019; Lynch et al. 2019; Osuoka and Haruna 2019).
Since no country now meets its citizens’ basic needs at a level of resource use that is globally sustainable, while high levels of life satisfaction for those just escaping extreme poverty require even more resources, the need for transformative shifts in governance and policies is large (O’Neill et al. 2018; Vogel et al. 2021).
Inequitable societies use energy and resources less efficiently. Higher income inequality is associated with higher carbon emissions, at least in developed countries (Grunewald et al. 2011; Golley and Meng 2012; Chancel et al. 2015; Grunewald et al. 2017; Jorgenson et al. 2017; Sager 2017; Klasen 2018; Liu et al. 2019); reducing inequality in high-income countries helps to reduce emissions (Klasen 2018). There is high agreement in the literature that alienation or distrust weakens collective governance and fragments political approaches towards climate action (Smit and Pilifosova 2001; Adger et al. 2003; Hammar and Jagers 2007; Van Vossole 2012; Bulkeley and Newell 2015; Smith and Howe 2015; ISSC et al. 2016; Alvaredo et al. 2018; Smith and Mayer 2018; Fairbrother et al. 2019; Hayward and Roy 2019; Kulin and Johansson Sevä 2019; Liao et al. 2019).
Populism and politics of fear are less prevalent under conditions of more income equality (Chevigny 2003; Bryson and Rauwolf 2016; O’Connor 2017; Fraune and Knodt 2018; Myrick and Evans Comfort 2019). Ideology and other social factors also play a role in populist climate scepticism, but many of these also relate to resentment of elites and desire for engagement (Swyngedouw 2011; Lockwood 2018; Huber et al. 2020). ‘Climate populism’ movements are driven by an impetus for justice (Beeson 2019; Hilson 2019). When people feel powerless and/or that climate change is too big a problem to solve because others are not acting, they may take less action themselves (Williams and Jaftha 2020). However, systems for benefit-sharing can build trust and address large-scale ‘commons dilemmas’, in the context of strong civil society (Barnett 2003; Mearns and Norton 2009; Inderberg et al. 2015; Sovacool et al. 2015; Hunsberger et al. 2017; Soliev and Theesfeld 2020). Leadership is also important in fostering environmentally-responsible group behaviours (Liu and Hao 2020).
In some less-developed countries, higher income inequality may in fact be associated with lower per capita emissions, but this is because people who are excluded by poverty from access to fossil fuels must rely on biomass (Klasen 2018). Such energy poverty – the fact that millions of people do not have access to energy sources to help meet human needs – implies the opposite of development (Guruswamy 2010; Guruswamy 2020). In developing countries, livelihood improvements do not necessarily cause increases in emissions (Peters et al. 2012; Reusser et al. 2013; Creutzig et al. 2015a; Chhatre and Agrawal 2009; Baltruszewicz et al. 2021) and poverty alleviation causes negligible emissions (Chakravarty et al. 2009). Greater equity is an important step towards sustainable service provisioning (Godfray et al. 2018; Dorling 2019; Timko 2019).
As discussed in Section 5.6, policies to assist the low-carbon energy transition can be designed to include additional benefits for income equality, besides contributing to greater energy access for the poor (Burke and Stephens 2017; Frank 2017; Healy and Barry 2017; Sen 2017; Chapman et al. 2018; La Viña et al. 2018; Chapman and Fraser 2019; Piggot et al. 2019; Sunderland et al. 2020). Global and intergenerational climate inequities impact people’s well-being, which affects their consumption patterns and political actions (Albrecht et al. 2007; Fritze et al. 2008; Gori-Maia 2013; Clayton et al. 2015; Pizzigati 2018) (Box 5.4).
Consumption reductions, both voluntary and policy-induced, can have positive and double-dividend effects on efficiency as well as reductions in energy and materials use (Mulder et al. 2006; Harriss and Shui 2010; Figge et al. 2014; Grinde et al. 2018; Spangenberg and Lorek 2019; Vita et al. 2020). Less waste, better emissions control and more effective carbon policies lead to better governance and stronger democracies. Systems-dynamics models linking strong emissions-reducing policies and strong social equity policies show that a low-carbon transition in conjunction with social sustainability is possible, even without economic growth (Kallis et al. 2012; Jackson and Victor 2016; Stuart et al. 2017; Chapman and Fraser 2019; D’Alessandro et al. 2019; Gabriel and Bond 2019; Huang et al. 2019; Victor 2019). Such degrowth pathways may be crucial in combining technical feasibility of mitigation with social development goals (Hickel et al. 2021; Keyßer and Lenzen 2021).
Multi-level or polycentric governance can enhance well-being and improve climate governance and social resilience, due to varying adaptive, flexible policy interventions at different times and scales (Kern and Bulkeley 2009; Lidskog and Elander 2009; Amundsen et al. 2010; Keskitalo 2010; Lee and Koski 2015; Jokinen et al. 2016; Lepeley 2017; Marquardt 2017; Di Gregorio et al. 2019). Institutional transformation may also result from socio-ecological stresses that accompany climate change, leading to more effective governance structures (David Tàbara et al. 2018; Patterson and Huitema 2019; Barnes et al. 2020). An appropriate, context-specific mix of options facilitated by policies can deliver both higher well-being and reduced disparity in access to basic needs for services concurrently with climate mitigation (Thomas and Twyman 2005; Mearns and Norton 2009; Klinsky and Winkler 2014; Lamb et al. 2014; Lamb and Steinberger 2017). Hence, nurturing equitable human well-being through provision of decent living standards for all goes hand in hand with climate change mitigation (ISSC et al. 2016; OECD 2019a). There is high confidence in the literature that addressing inequities in income, wealth, and DLS not only raises overall well-being and furthers the SDGs but also improves the effectiveness of climate change mitigation policies.
Participatory governance involves understanding and engagement with policies, including climate policies. Greater public participation in climate policy processes and governance, by increasing the diversity of ideas and stakeholders, builds resilience and allows broader societal transformation towards systemic change, even in complex, dynamic and contested contexts (Dombrowski 2010; Wise et al. 2014; Haque et al. 2015; Jodoin et al. 2015; Mitchell 2015; Kaiser 2020; Alegria 2021). This sometimes involves complex policy discussions that can lead to governance innovations, also influencing social norms (Martinez 2020). A specific example are citizen assemblies, deliberating public policy challenges, such as climate change (Devaney et al. 2020). Activist climate movements are changing policies as well as normative values (Section 5.4 and the Social Science Primer, Chapter 5 Supplementary Material I). Environmental justice and climate justice activists worldwide have called attention to the links between economic and environmental inequities, collected and publicised data about them, and demanded stronger mitigation (Goodman 2009; Schlosberg and Collins 2014; Jafry 2019; Cheon 2020). Youth climate activists, and Indigenous leaders, are also exerting growing political influence towards mitigation (Helferty and Clarke 2009; White 2011; Powless 2012; Petheram et al. 2015; UN 2015; Curnow and Gross 2016; Grady-Benson and Sarathy 2016; Claeys and Delgado Pugley 2017; O’Brien et al. 2018; Rowlands and Gomez Peña 2019; Bergmann and Ossewaarde 2020; Han and Ahn 2020; Nkrumah 2021). Indigenous resurgence (activism fuelled by ongoing colonial social and environmental injustices, land claims, and deep spiritual and cultural commitment to environmental protection) not only strengthens climate leadership in many countries, but also changes broad social norms by raising knowledge of Indigenous governance systems which supported sustainable lifeways over thousands of years (Wildcat 2014; Chanza and De Wit 2016; Whyte 2017; Whyte 2018, Temper et al. 2020). Related trends include recognition of the value of traditional ecological knowledge, Indigenous governance principles, decentralisation, and appropriate technologies (Lange et al. 2007; Goldthau 2014; Whyte 2017).
Social trust aids policy implementation. More equal societies display higher trust, which is a key requirement for successful implementation of climate policies (Rothstein and Teorell 2008; Carattini et al. 2015; Klenert et al. 2018; Patterson et al. 2018). Inter-personal trust among citizens often promotes pro-environment behaviour by influencing perceptions (Harring and Jagers 2013), enhancing cooperation, and reducing free-riding and opportunistic behaviour (Gür 2020). Individual support for carbon taxes and energy innovations falls when collective community support is lacking (Bolsen et al. 2014; Smith and Mayer 2018; Simon 2020). Social trust has a positive influence on civic engagement among local communities, NGOs, and self-help groups for local clean cooking fuel installation (Nayak et al. 2015).
Section 5.6 includes examples of climate mitigation policies and policy packages which address the interrelationships shown in Figure 5.5. Improving well-being for all through climate mitigation includes emissions-reduction goals in policy packages that ensure equitable outcomes, prioritise social trust-building, support wide public participation in climate action including within the informal sector, and facilitate institutional change for effective multi-level governance, as integral components of climate strategies. This strategic approach, and its feasibility of success, rely on complex contextual factors that may differ widely, especially between the Global North and Global South (Atteridge et al. 2012; Patterson et al. 2018; Jewell and Cherp 2020; Singh et al. 2020; Singh et al. 2021).
Box 5.4 | Gender, Race, Intersectionality and Climate Mitigation
There is high evidence and high agreement that empowering women benefits both mitigation and adaptation, because women prioritise climate change in their voting, purchasing, community leadership, and work, both professionally and at home ( high evidence, high agreement ). Increasing voice and agency for those marginalised in intersectional ways by indigeneity, race, ethnicity, dis/ability, and other factors has positive effects for climate policy ( high evidence, high agreement ).
Climate change affects people differently along all measures of difference and identity, which have intersectional impacts linked to economic vulnerability and marginalisation (Morello Frosch et al. 2009; Dankelman 2010; Habtezion 2013; Godfrey and Torres 2016; Walsh 2016; Flatø et al. 2017; Goodrich et al. 2019; Perkins 2019; Gür 2020). Worldwide, racialised and Indigenous people bear the brunt of environmental and climate injustices through geographic location in extraction and energy ‘sacrifice zones’, areas most impacted by extreme weather events, and/or through inequitable energy access (Aubrey 2019; Jafry 2019; Gonzalez 2020; Lacey-Barnacle et al. 2020; Porter et al. 2020; Temper et al. 2020) Disparities in climate change vulnerability not only reflect pre-existing inequalities, they also reinforce them. For example, inequities in income and in the ownership and control of household assets, familial responsibilities due to male out-migration, declining food and water access, and increased disaster exposure can undermine women’s ability to achieve economic independence, enhance human capital, and maintain physical and mental health and well-being (Chandra et al. 2017; Eastin 2018; Das et al. 2019). Studies during the COVID-19 crisis have found that, in general, women’s economic and productive lives have been affected disproportionately to men’s (Alon et al. 2020; ILO 2020). Women have less access to social protections and their capacity to absorb economic shocks is very low, so they face a ‘triple burden’ during crises – including those
Box 5.4
resulting from climate change – and this is heightened for women in the less-developed countries and for those who are intersectionally vulnerable (Coates et al. 2020; McLaren et al. 2020; Wenham et al. 2020; Azong and Kelso 2021; Erwin et al. 2021; Maobe and Atela 2021; Nicoson 2021; Sultana 2021; Versey 2021). Because men currently hold the majority of energy-sector jobs, energy transition will impact them economically and psychologically; benefits, burdens and opportunities on both the demand and supply sides of the mitigation transition have a range of equity implications (Pearl-Martinez and Stephens 2017; Standal et al. 2020; Mang-Benza 2021). Mitigating gendered climate impacts requires addressing inequitable power relations throughout society (Wester and Lama 2019).
Women’s well-being and gender-responsive climate policy have been emphasised in international agreements including the Paris Agreement (UNFCCC 2015), Convention on the Elimination of all Forms of Discrimination Against Women General Recommendation 37 (Vijeyarasa 2021), and the 2016 Decision 21/CP.22 on Gender and Climate Change (UNFCCC 2016 ; Larson et al. 2018). Increasing the participation of women and marginalised social groups, and addressing their special needs, helps to meet a range of SDGs, improve disaster and crisis response, increase social trust, and improve climate mitigation policy development and implementation (Alber 2009; Whyte 2014; Elnakat and Gomez 2015; Salehi et al. 2015; Buckingham and Kulcur 2017; Cohen 2017; Kronsell 2017; Lee and Zusman 2019).
Women have a key role in the changing energy economy due to their demand for and end use of energy resources in socially-gendered productive roles in food production and processing, health, care, education, clothing purchases and maintenance, commerce, and other work, both within and beyond the home (Räty and Carlsson-Kanyama 2009; Oparaocha and Dutta 2011; Bob and Babugura 2014; Macgregor 2014; Perez et al. 2015; Bradshaw 2018; Clancy and Feenstra 2019; Clancy et al. 2019; Fortnam et al. 2019; Rao et al. 2019a; Quandt 2019; Horen Greenford et al. 2020; Johnson 2020). Women’s work and decision-making are central in the food chain and agricultural output in most developing countries, and in household management everywhere. Emissions from cooking fuels can cause serious health damage, and unsustainable extraction of biofuels can also hurt mitigation (Bailis et al. 2015), so considering health, biodiversity and climate tradeoffs and co-benefits is important (Rosenthal et al. 2018; Aberilla et al. 2020; Mazorra et al. 2020). Policies on energy use and consumption are often focused on technical issues related to energy supply, thereby overlooking demand-side factors such as household decision-making, unpaid work, livelihoods and care (Himmelweit 2002; Perch 2011; Fumo 2014; Hans et al. 2019; Huyer and Partey 2020). Such gender-blindness represents the manifestation of wider issues related to political ideology, culture and tradition (Carr and Thompson 2014; Thoyre 2020; Perez et al. 2015; Fortnam et al. 2019).
Women, and all those who are economically and/or politically marginalised, often have less access to energy and use less, not just because they may be poorer but case studies show because their consumption choices are more ecologically inclined and their energy use is more efficient (Lee et al. 2013; Permana et al. 2015; Li et al. 2019). Women’s carbon footprints are about 6–28% lower than men’s (with high variation across countries), mostly based on their lower meat consumption and lower vehicle use (Isenhour and Ardenfors 2009; Räty and Carlsson-Kanyama 2009; Räty and Carlsson-Kanyama 2010; Barnett et al. 2012; Medina and Toledo-Bruno 2016; Ahmad et al. 2017; Fernström Nåtby and Rönnerfalk 2018; Li et al. 2019). Gender-based income redistribution in the form of pay equity for women could reduce emissions if the redistribution is revenue neutral (Terry 2009; Dengler and Strunk 2018). Also, advances in female education and reproductive health, especially voluntary family planning, can contribute greatly to reducing world population growth (Abel et al. 2016; Dodson et al. 2020).
Carbon emissions are lower per capita in countries where women have more political ‘voice’, controlling for GDP per capita and a range of other factors (Ergas and York 2012). While most people recognise that climate change is happening (Lewis et al. 2018; Ballew et al. 2019), climate denialism is more prevalent among men (McCright and Dunlap 2011; Anshelm and Hultman 2014; Nagel 2015; Jylhä et al. 2016), while women are more likely to be environmental activists, and to support stronger environmental and climate policies (Stein 2004; McCright and Xiao 2014, Whyte 2014). Racialised groups are more likely to be concerned about climate change and to take political action to support climate mitigation policies (Leiserowitz and Akerlof 2010; Godfrey and Torres 2016; Schuldt and Pearson 2016; Pearson et al. 2017; Ballew et al. 2020; Johnson 2020). This underscores the important synergies between equity and mitigation. The contributions of women, racialised people, and indigenous people, who are socially positioned as those first and most affected by climate change – and therefore experts on appropriate climate responses – are substantial (Dankelman and Jansen 2010; Wickramasinghe 2015; Black 2016; Vinyeta et al. 2016; Pearse 2017). Equitable power, participation, and agency in climate policymaking is hence an effective contribution for improving governance and decision-making on climate change mitigation (Reckien et al. 2017; Collins 2019). Indigenous knowledge is an important source of guidance for biodiversity conservation, impact assessment, governance, disaster preparedness and resilience (Salick and Ross 2009; Green and Raygorodetsky 2010; Speranza et al. 2010; Mekuriaw Bizuneh 2013; Mekuriaw 2017), and women are often the local educators, passing on and utilising traditional and indigenous knowledge (Ketlhoilwe 2013; Onyige 2017; Azong et al. 2018).
Higher female political participation, controlled for other factors, leads to higher stringency in climate policies, and results in lower GHG emissions (Cook et al. 2019). Gender equity is also correlated with lower per capita CO2-eq emissions (Ergas and York 2012).
Box 5.4
In societies where women have more economic equity, their votes push political decision-making in the direction of environmental and sustainable development policies, less high-emission militarisation, and more emphasis on equity and social policies such as via wealth and capital gains taxes (Ergas and York 2012; Resurrección 2013; UNEP 2013; Glemarec et al. 2016; Bryan et al. 2018; Crawford 2019). Changing social norms on race and climate are linked and policy-relevant (Benegal 2018; Elias et al. 2018; Slocum 2018; Gach 2019; Wallace-Wells 2019; Temple 2020; Drolet 2021). For all these reasons, climate policies are strengthened by including more differently-situated knowledge and diverse perspectives, such as feminist expertise in the study of power (Bell et al. 2020; Lieu et al. 2020); clarifying equity goals (e.g., distinguishing among ‘reach, ‘benefit’, and ‘empowerment’; obtaining disaggregated data and using clear empirical equity measures; and confronting deeply-ingrained inequities in society (Lau et al. 2021). Inclusivity in climate governance spans mitigation–adaptation, supply–demand and formal–informal sector boundaries in its positive effects (Morello Frosch et al. 2009; Dankelman 2010; Bryan and Behrman 2013; Habtezion 2013; Godfrey and Torres 2016; Walsh 2016; Flatø et al. 2017; Wilson et al. 2018; Goodrich et al. 2019; Perkins 2019; Bell et al. 2020; Gür 2020).
5.3Mapping the Opportunity Space
Reducing global energy demand and resource inputs while improving well-being for all requires an identification of options, services and pathways that do not compromise essentials of a decent living. To identify such a solution space, this section summarises socio-cultural, technological and infrastructural interventions through the Avoid-Shift-Improve concept. ASI (Section 5.1) provides a categorisation of options aimed at continuously eliminating waste in the current systems of service provision (Section 5.3.1.1). It also concisely presents demand-side options to reduce GHG emissions by individual choices which can be leveraged by supporting policies, technologies and infrastructure. Two key concepts for evaluating the efficiency of service provision systems are: resource cascades and exergy. These concepts provide powerful analytical lenses through which to identify and substantially reduce energy and resource waste in service provision systems, both for decent living standards (Section 5.3.2) and higher well-being levels. They typically focus on end-use conversion and service delivery improvements as the most influential opportunities for system-wide waste reductions. Review of the state of modelling low energy and resource demand pathways in long-term climate mitigation scenarios (recognising the importance of such scenarios for illuminating technology and policy pathways for more efficient service provision) and summary of the mitigation potentials estimated from relevant scenarios to date are in Section 5.3.3. Finally, it reviews the role of three megatrends that are transforming delivery of services in innovative ways – digitalisation, the sharing economy, and the circular economy (Section 5.3.4). The review of megatrends makes an assessment highlighting the potential risks of rebound effects, and even accelerated consumption; it also scopes for proactive and vigilant policies to harness their potential for future energy and resource demand reductions, and, conversely, avoiding undesirable outcomes.
5.3.1Efficient Service Provision
Thissection organises demand reductions under the ASI framework. It presents service-oriented demand-side solutions consistent with decent living standards (Creutzig et al. 2018) (Table 5.1). The sharing economy, digitalisation, and the circular economy can all contribute to ASI strategies, with the circular economy tentatively more on the supply side, and the sharing economy and digitalisation tentatively more on the demand side (Section 5.3.4). These new service delivery models go beyond sectoral boundaries (IPCC sector chapter boundaries are explained in Chapter 12) and take advantage of technological innovations, design concepts, and innovative forms of cooperation, cutting across sectors to contribute to systemic changes worldwide. Some of these changes can be realised in the short term, such as energy access, while others may take a longer period, such as radical and systemic eco-innovations like shared electric autonomous vehicles. It is important to understand benefits and distributional impacts of these systemic changes.
Table 5.1 | Avoid-Shift-Improve options in selected sectors and services. Many options, such as urban form and infrastructures, are systemic, and influence several sectors simultaneously. Linkages to concepts presented in sectoral chapters are indicated in parentheses in the first column. Source: adapted from Creutzig at al. (2018).
Service | Emission decomposition factors | Avoid | Shift | Improve |
Mobility [passenger-km] (Chapters 8, 10, 11, 16) | kgCO2= (passenger km)*(MJ pkm –1)*(kgCO2MJ–1) | Innovative mobility to reduce passenger-km: Integrate transport and land-use planning Smart logistics Teleworking Compact cities Fewer long-haul flights Local holidays | Increased options for mobility MJ pkm–1: Modal shifts, from car to cycling, walking, or public transit Modal shift from air travel to high-speed rail | Innovation in equipment design MJ pkm–1and CO2-eq MJ–1: Lightweight vehicles Hydrogen vehicles Electric vehicles Eco-driving |
Shelter [square metres] (Chapters 8, 9, 11) | kgCO2= (square metres)*(tonnes material m –2)*(kg CO2 tonne material –1) | Innovative dwellings to reduce square metres: Smaller decent dwellings Shared common spaces Multigenerational housing | Materials-efficient housing tonnes material m–2: Less material-intensive dwelling designs Shift from single-family to multi-family dwellings | Low emission dwelling design kgCO2tonne–1material: Use wood as material Use low-carbon production processes for building materials (e.g., cement and steel) |
Thermal comfort [indoor temperature] (Chapters 9, 16) | kgCO2= (Δ°C m 3 to warm or cool) (MJ m –3)*(kgCO2MJ–1) | Choice of healthy indoor temperature Δ°C m3: Reduce m 2 as above Change temperature set-points Change dress code Change working times | Design options to reduce MJ Δ°C–1m–3: Architectural design (shading, natural ventilation, etc.) | New technologies to reduce MJ Δ°C–1m–3and kgCO2MJ–1: Solar thermal devices Improved insulation Heat pumps District heating |
Goods [units] (Chapters 11, 12) | kgCO2= (product units)*(kg material product –1)*(kgCO2 kg material –1) | More service per product: Reduce consumption quantities Long lasting fabric, appliances Sharing economy | Innovative product design kg material product –1: Materials-efficient product designs | Choice of new materials kgCO2kg material–1: Use of low-carbon materials New manufacturing processes and equipment use |
Nutrition [calories consumed] (Chapters 6, 12) | kgCO2-eq = (calories consumed)*(calories produced calories consumed –1)*(kgCO2-eq calorie produced –1) | Reduce calories produced/calories consumed and optimise calories consumed: Keep calories in line with daily needs and health guidelines Reduce waste in supply chain and after purchase | Add more variety in food plate to reduce kgCO2-eqcal–1produced: Dietary shifts from ruminant meat and dairy to other protein sources while maintaining nutritional quality | Reduce kgCO2-eqcal–1produced: Improved agricultural practices Energy efficient food processing |
Lighting [lumens] (Chapters 9, 16) | kgCO2= lumens*(kWh lumen –1)*(kgCO2 kWh –1) | Minimise artificial lumen demand: Occupancy sensors Lighting controls | Design options to increase natural lumen supply: Architectural designs with maximal daylighting | Demand innovation lighting technologies kWh lumens–1and power supply kgCO2kWh–1: LED lamps |
5.3.1.1Integration of Service Provision Solutions with Avoid-Shift-Improve Framework
Assessment of service-related mitigation options within the ASI framework is aided by decomposition of emissions intensities into explanatory contributing factors, which depend on the type of service delivered. Table 5.1 shows ASI options in selected sectors and services. It summarises resource, energy, and emissions intensities commonly used by type of service (Cuenot et al. 2010; Lucon et al. 2014; Fischedick et al. 2014). Also relevant are the concepts of service provision adequacy (Arrow et al. 2004; Samadi et al. 2017), establishing the extents to which consumption levels exceed (e.g., high-calorie diets contributing to health issues (Roy et al. 2012); excessive food waste) or fall short (e.g., malnourishment) of service level sufficiency (e.g., recommended calories) (Millward-Hopkins et al. 2020); and service level efficiency (e.g., effect of occupancy on the energy intensity of public transit passenger-km travelled (Schäfer and Yeh 2020). Service-oriented solutions are discussed in Table 5.1. Implementation of these solutions requires combinations of institutional, infrastructural, behavioural, socio-cultural, and business changes which are mentioned in Section 5.2 and discussed in Section 5.4.
Opportunities for avoiding waste associated with the provision of services, or avoiding overprovision of or excess demand for services, exist across multiple service categories. ‘Avoid’ options are relevant in all end-use sectors, namely, teleworking and avoiding long-haul flights, adjusting dwelling size to household size, and avoiding short-lifespan products and food waste. Cities and built environments can play an additional role. For example, more compact designs and higher accessibility reduce travel demand and translate into lower average floor space and corresponding heating/cooling and lighting demand, and thus reductions of between 5% to 20% of GHG emissions of end-use sectors (Creutzig et al. 2021b). Avoidance of food loss and wastage – which equalled 8–10% of total anthropogenic GHG emissions from 2010–2016 (Mbow et al. 2019), while millions suffer from hunger and malnutrition – is a prime example (Chapter 12). A key challenge in meeting global nutrition services is therefore to avoid food loss and waste while simultaneously raising nutrition levels to equitable standards globally. Literature results indicate that in developed economies, consumers are the largest source of food waste, and that behavioural changes such as meal planning, use of leftovers, and avoidance of over-preparation can be important service-oriented solutions (Gunders et al. 2017; Schanes et al. 2018), while improvements to expiration labels by regulators would reduce unnecessary disposal of unexpired items (Wilson et al. 2017) and improved preservation in supply chains would reduce spoilage (Duncan and Gulbahar 2019). Around 931 million tonnes of food waste was generated in 2019 globally, 61% of which came from households, 26% from food service and 13% from retail.
Demand-side mitigations are achieved through changing Socio-cultural factors, Infrastructure use and Technology adoption by various social actors in urban and other settlements, food choice and waste management ( high confidence) (Figure 5.7). In all sectors, end-use strategies can help reduce the majority of emissions, ranging from 28.7% (4.4 GtCO2) emission reductions in the industry sector, to 44.2% (8.0 GtCO2-eq) in the food sector, to 66.75% (4.6 GtCO2) emission reductions in the land transport sector, and 66% (6.8 GtCO2) in the buildings sector. These numbers are median estimates and represent benchmark accounting. Estimates are approximations, as they are simple products of individual assessments for each of the three options listed above. If interactions were taken into account, the full mitigation potentials may be higher or lower, independent of relevant barriers to realising the median potential estimates. See more in Chapter 5 Supplementary Material II, Table 5.SM.2.

Figure 5.7 | Demand-side mitigation options and indicative potentials. Demand-side mitigation response options related to demand for services have been categorised into three broad domains: ‘socio-cultural factors’, associated with individual choices, behaviour and lifestyle change, social norms and culture; ‘infrastructure use’, related to the design and use of supporting hard and soft infrastructure that enables changes in individual choices and behaviour; and ‘end-use technology adoption’, which refers to the uptake of technologies by end users. Demand-side mitigation is a central element of the IMP-LD and IMP-SP scenarios (Section 3.3). Food (nutrition) demand-side potentials in 2050 assessment is based on bottom-up studies and estimated following the 2050 baseline for the food sector presented in peer-reviewed literature (more information in Chapter 5 Supplementary Material II and Chapter 7, Section 7.4.5). Industry (manufactured products), land transport, aviation and shipping (mobility), and buildings (shelter) assessment of potentials for total emissions in 2050 are estimated based on approximately 500 bottom-up studies representing all global regions (detailed list is in Table 5.SM.2). Baseline is provided by the sectoral mean GHG emissions in 2050 of the two scenarios consistent with policies announced by national governments until 2020. The heights of the coloured columns represent the potentials represented by the median value. These are based on a range of values available in the case studies from literature shown in Chapter 5 Supplementary Material II. The range is shown by the dots connected by dotted lines representing the highest and the lowest potentials reported in the literature. The demand-side potential of socio-cultural factors in food has two parts.The median value of direct emissions (mostly non-CO2) reduction through socio-cultural factors is 1.9 GtCO2-eq without considering land-use change through reforestation of freed up land. If changes in land-use patterns enabled by this change in food demand are considered, the indicative potential could reach 7 GtCO2-eq. The ‘electricity’ panel presents how sectoral demand-side mitigation options (industry, transport and buildings) can change demand on the electricity distribution system. Electricity accounts for an increasing proportion of final energy demand in 2050 (‘additional electrification’ bar) in line with multiple bottom-up studies (detailed list is in Table 5.SM.3) and Chapter 6 (Section 6.6). These studies are used to compute the impact of end-use electrification which increases overall electricity demand. Some of the projected increase in electricity demand can be avoided through demand-side mitigation options in the domains of socio-cultural factors and infrastructure use strategies in end-use electricity use in buildings, industry and land transport found in literature based on bottom-up assessments (Section 5.3 and Chapter 5 Supplementary Material II).
The technical mitigation potential of food loss and waste reductions globally has been estimated at 0.1–5.8 GtCO2-eq ( high confidence) (Poore and Nemecek 2018; Smith, et al. 2019) (Section 7.4.5, Figure 5.7 and Table 12.3). Coupling food waste reductions with dietary shifts can further reduce energy, land, and resource demand in upstream food provision systems, leading to substantial GHG emissions benefits. The estimated technical potential for GHG emissions reductions associated with shifts to sustainable healthy diets is 0.5–8 GtCO2-eq ( high confidence) (Smith et al. 2013; Jarmul et al. 2020; Creutzig et al. 2021b) (Figure 5.7, Table 12.2). Current literature on health, diets, and emissions indicates that sustainable food systems providing healthy diets for all are within reach but require significant cross-sectoral action, including improved agricultural practices, dietary shifts among consumers, and food waste reductions in production, distribution, retail, and consumption (Erb et al. 2016; Muller et al. 2017; Graça et al. 2019; Willett and al. 2019) (Table 12.9).
Reduced food waste and dietary shifts have highly relevant repercussions in the land-use sector that underpin the high GHG emission reduction potential. Demand-side measures lead to changes in consumption of land-based resources and can save GHG emissions by reducing or improving management of residues or making land areas available for other uses such as afforestation or bioenergy production (Smith et al. 2013; Hoegh-Guldberg et al. 2019). Deforestation is the second-largest source of anthropogenic greenhouse gas emissions, caused mainly by expanding forestry and agriculture, and in many cases this agricultural expansion is driven by trade demand for food. For example, across the tropics, cattle and oilseed products account for half the deforestation carbon emissions, embodied in international trade to China and Europe (Creutzig et al. 2019a; Pendrill et al. 2019). Benefits from shifts in diets and resulting lowered land pressure are also reflected in reductions of land degradation and emissions.
Increased demand for biomass can increase the pressure on forest and conservation areas (Cowie et al. 2013) and poses a heightened risk for biodiversity, livelihoods, and intertemporal carbon balances (Lamb et al. 2016; Creutzig et al. 2021c), requiring policy and regulations to ensure sustainable forest management, which depends on forest type, region, climate, and ownership. This suggests that demand-side actions hold sustainability advantages over the intensive use of bioenergy and BECCS, but also enable land use for bioenergy by saving agricultural land for food.
In the transport sector, ASI opportunities exist at multiple levels, comprehensively summarised in Bongardt et al. (2013), Sims et al. (2014), and Roy et al. (2021) (Chapter 10). Modelling based on a plethora of bottom-up insights and options reveals that a balanced portfolio of ASI policies brings global transport sector emissions in line with global warming of not more than 1.5°C (Gota et al. 2019). For example, telework may be a significant lever for avoiding road transport associated with daily commutes, achievable through digitalisation, but its savings depend heavily on the modes, distances, and types of office use avoided (Hook et al. 2020) and whether additional travel is induced due to greater available time (Mokhtarian 2002) or vehicle use by other household members (Kim et al. 2015; de Abreu e Silva and Melo 2018). More robustly, avoiding kilometres travelled through improved urban planning and smart logistical systems can lead to fuel, and, hence, emissions savings (Creutzig et al. 2015a; IEA 2016; IEA 2017a; Wiedenhofer et al. 2018), or through avoiding long-haul flights (IEA 2021). For example, reallocating road and parking space to exclusive public transit lanes, protected bike lanes and pedestrian priority streets can reduce vehicle kilometres travelled in urban areas (ITF 2021). At the vehicle level, lightweighting strategies (Fischedick et al. 2014) and avoiding inputs of carbon-intensive materials into vehicle manufacturing can also lead to significant emissions savings through improved fuel economy (Das et al. 2016; Hertwich et al. 2019; IEA 2019b).
Figure 5.7 shows socio-cultural factors can contribute up to 15% to land transport GHG emissions reduction by 2050, with 5% as our central estimate. Active mobility, such as walking and cycling, has 2–10% potential in GHG emissions reduction. Well designed teleworking policies can reduce transport-related GHG emissions by at least 1%. A systematic review demonstrates that 26 of 39 studies identified suggest that teleworking reduces energy use, induced mainly by distance travelled, and only eight studies suggest that teleworking increases or has a neutral impact on energy use (Hook et al. 2020). Infrastructure use (specifically urban planning and shared pooled mobility) has about 20–50% (on average) potential in land transport GHG emissions reduction, especially via redirecting the ongoing design of existing infrastructures in developing countries, and with 30% as our central estimate (Section 5.3.4.2). Technology adoption, particularly banning combustion and diesel engines and 100% EV targets (and other zero-carbon fuels, especially in freight) and efficient lightweight cars, can contribute to between 30% and 70% of GHG emissions reduction from land transport in 2050, with 50% as our central estimate (see Chapter 5 Supplementary Material II, Table 5.SM.2 and Chapter 10, Sections 10.4 and 10.7), consistent with scenario modelling (Figure 10.27) and based on rapid reduction in the GHG emission footprint of vehicle production. These numbers are consistent with the end of fossil fuel-based new cars in 2035 in major economies and of 100% of vehicles being zero-emission vehicles in 2050. Other economies that display vehicles obtained on second hand markets may phase out fossil fuel cars only after 2050, hence limiting the overall mitigation potential of electric vehicles to well below 100% in 2050. Higher energy use and CO2-footprint in BEV production compared to ICE production are to be met with more rapid decarbonisation of the industry sector and by the reduced need for overall vehicle stock, due to socio-cultural and infrastructure measures. Ehrenberger et al. (2021) shows that the development of technologies, fleets, and their use are decisive factors in reducing the use of fossil energies, resulting in 26–65% CO2 emissions reduction potential until 2040 for the case of Germany. Electric vehicles can be used to provide new shared services. In this case, reductions of CO2 emissions of close to 20% can be obtained in a scenario where 20% of car trips and all bus feeder trips are replaced, but considerably higher reductions are possible when shared pooled mobility replaces private vehicle trips in urban areas (ITF 2017b, ITF 2017d). A study shows that ICE vehicles reduce CO2 emissions to 60% or 80% of current emissions levels by 2050 (Hill et al. 2019). Similarly, the power grid decarbonisation is assumed to improve to either 50% or 80% over current rates, with 80% being the expected decarbonisation and 50% a more conservative estimate. Each possibility for EV adoption rate, ICE efficiency improvement, and power decarbonisation is combined (Hill et al. 2019). Beyond consuming less energy, EVs enable greater use of low-carbon and renewable energy sources than is possible for conventional petroleum-based fuels. These technical advantages lead to the potential for greatly reducing petroleum use, air pollution and carbon emissions. International collaboration could better leverage existing efforts to promote zero-emission vehicles. The establishment of a zero-emission vehicle deployment target and an electric mobility target for 2035 would help in establishing a common long-term global electric-drive vision (Lutsey 2015).
Socio-cultural factors such as avoiding long-haul flights and shifting to train wherever possible can contribute between 10% and 40% to aviation GHG emissions reduction by 2050 (Figure 5.7). Maritime transport (shipping) emits around 940 MtCO2 annually and is responsible for about 2.5% of global GHG emissions (IMO 2020). Technology measures and management measures, such as slow steaming, weather routing, contra-rotating propellers, and propulsion efficiency devices can deliver more fuel savings between 1% and 40% than the investment required (Bouman et al. 2017) (Chapter 5, Supplementary Material II, Table 5.SM.2).
In the buildings sector, avoidance strategies can occur at the end use or individual building operation level. End-use technologies and strategies such as the use of daylighting (Bodart and De Herde 2002) and lighting sensors can avoid demand for lumens from artificial light, while passive houses, thermal mass, and smart controllers can avoid demand for space conditioning services. Eliminating standby power losses can avoid energy wasted for no useful service in many appliances and devices, which may reduce household electricity use by up to 10% (Roy et al. 2012). At the building level, smaller dwellings can reduce overall demand for lighting and space conditioning services, while smaller dwellings, shared housing, and building lifespan extension can all reduce the overall demand for carbon-intensive building materials such as concrete and steel (Material Economics 2018; Hertwich et al. 2019; IEA 2019b; Pauliuk et al. 2021). Emerging strategies for materials efficiency, such as 3D printing to optimise the geometries and minimise the materials content of structural elements, may also play a key role if thermal performance and circularity can be improved (Mahadevan et al. 2020; Adaloudis and Bonnin Roca 2021). Several scenarios estimate an ‘Avoid’ potential in the building sector, which includes reducing waste in superfluous floor space, heating and IT equipment, and energy use, of between 10% and 30%, in one case even by 50% (Nadel and Ungar 2019) (Chapter 9).
Socio-cultural factors and behavioural and social practices in energy saving, like adaptive heating and cooling by changing temperature, can contribute about 15% to GHG emissions reduction in the buildings sector by 2050 (Figure 5.7). Infrastructure use such as compact city and urban planning interventions, living floor space rationalisation, and access to low-carbon architectural design has about 20% potential in building sector GHG emissions reduction. Technology adoption, particularly access to energy efficient technologies, and installation of renewable energy technologies can contribute between 30% and 70% to GHG emissions reduction in the buildings sector (Chapters 8 and 9 and Chapter 5 Supplementary Material II, Table 5.SM.2).
Service efficiency strategies are emerging to avoid materials demand at the product level, including dematerialisation strategies for various forms of packaging (Worrell and Van Sluisveld 2013) and the concept of ‘products as services’, in which product systems are designed and maintained for long lifespans to provide a marketable service (Oliva and Kallenberg 2003), thereby reducing the number of products sold and tonnes of materials needed to provide the same service to consumers, consistent with circular economy and materials efficiency principles (Chapter 11). Successful examples of this approach have been documented for carpets (Stubbs and Cocklin 2008), copiers (Roy 2000), kitchens (Liedtke et al. 1998), vehicles (Williams 2006; Ceschin and Vezzoli 2010) and more (Roy 2000).
‘Shift’ strategies unique to the service-oriented perspective generally involve meeting service demands at much lower lifecycle energy, emissions, and resource intensities (Roy and Pal 2009), through such strategies as shifting from single-family to multi-family dwellings (reducing the materials intensity per unit floor area (Ochsendorf et al. 2011)), shifting from passenger cars to rail or bus (reducing fuel, vehicle manufacturing, and infrastructure requirements (Chester and Horvath 2009)), shifting materials to reduce resource and emissions intensities (e.g., low-carbon concrete blends (Scrivener and Gartner 2018)) and shifting from conventional to additive manufacturing processes to reduce materials requirements and improve end-use product performance (Huang et al. 2016, 2017).
An important consideration in all ASI strategies is the potential for unintended rebound effects (Sorrell et al. 2009; Brockway et al. 2021) as indicated in Figures 5.8, 5.12, and 5.13a, which must be carefully avoided through various regulatory and behavioural measures (Santarius et al. 2016). In many developing country contexts, rebound effects can help in accelerated provision of affordable access to modern energy and a minimum level of per capita energy consumption (Saunders et al. 2021; Chakravarty and Roy 2021). Extending the lifespan of energy inefficient products may lead to net increases in emissions (Gutowski et al. 2011), whereas automated car sharing may reduce the number of cars manufactured at the expense of increased demand for passenger kilometres due to lower travel opportunity cost (Wadud et al. 2016) (Section 5.3.2).
Avoiding short lifespan products in favour of products with longer lifespan as a socio-cultural factor; and infrastructure use measures such as increasing the re-usability and recyclability of products’ components and materials, and adopting materials-efficient services and CO2-neutral materials, have about 29% indicative potential by 2050. (Chapter 11 and Chapter 5 Supplementary Material II, Table 5.SM.2).
In summary, sector-specific demand-side mitigation options reflect the important role of socio-cultural, technological and infrastructural factors and the interdependence among them (Figure 5.7). The assessment in Figure 5.7 shows that by 2050 high emission reduction potential can be realised with demand-side actions alone, which can be complementary to supply-side interventions, with considerable impact by reducing the need for capacity addition on the electricity supply system. Integrated cross-sectoral actions shown through sector coupling is also important for investment decision-making and policy framing going beyond sector boundaries ( high evidence and high agreement ).
5.3.1.2Options to Reduce GHG Emissions
A systematic review of options to reduce the GHG emissions associated with household consumption activities identified 6,990 peer-reviewed journal papers, with 771 options that were aggregated into 61 consumption option categories (Ivanova et al. 2020) (Figure 5.8). Consistently with previous research (Herendeen and Tanaka 1976; Pachauri and Spreng 2002; Pachauri 2007; Ivanova et al. 2016), a hierarchical list of mitigation options emerges. Choosing low-carbon options, such as car-free living, plant-based diets with no or very little animal products, low-carbon sources of electricity and heating at home, as well as local holiday plans, can reduce an individual’s carbon footprint by up to 9 tCO2-eq. Realising these options requires substantial policy support to overcome infrastructural, institutional and socio-cultural lock-in (Sections 5.4 and 5.6).
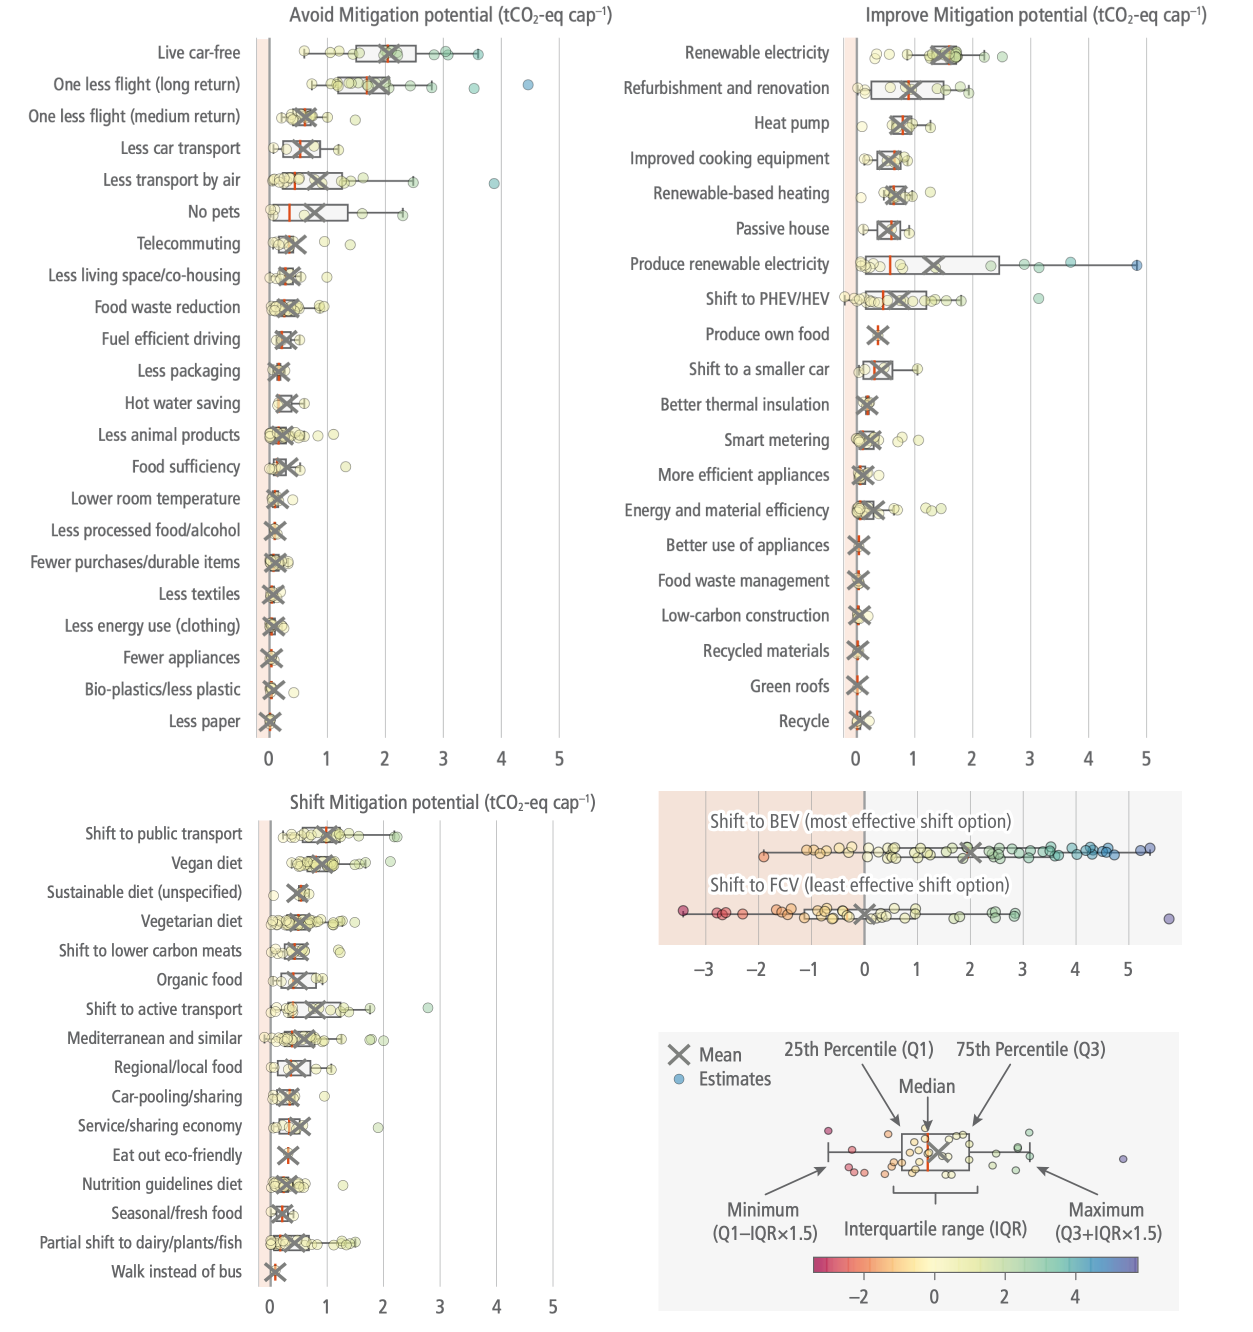
Figure 5.8 | Synthesis of 60 demand-side options ordered by the median GHG mitigation potential found across all estimates from the literature. The grey crosses are averages. The boxes represent the 25th percentile, median and 75th percentiles of study results. The whiskers or dots show the minimum and maximum mitigation potentials of each option. Negative values (in the red area) represent the potentials for backfire due to rebound, i.e., a net increase of GHG emissions due to adopting the option. Source: with permission from Ivanova et al. (2020).
5.3.2Technical Tools to Identify Avoid-Shift-Improve Options
Service delivery systems to satisfy a variety of service needs (e.g., mobility, nutrition, thermal comfort, etc.) comprise a series of interlinked processes to convert primary resources (e.g., coal, minerals) into useable products (e.g., electricity, copper wires, lamps, light bulbs). It is useful to differentiate between conversion and processing steps ‘upstream’ of end users (mines, power plants, manufacturing facilities) and ‘downstream’, that is, those associated with end-users, including service levels, and direct well-being benefits for people (Kalt et al. 2019). Illustrative examples of such resource processing systems and associated conversion losses drawn from the literature are shown in Figure 5.9, in the form of resource processing cascades for energy (direct energy conversion efficiencies (Nakićenović et al. 1993; De Stercke 2014)), water use in food production systems (water use efficiency and embodied water losses in food delivery and consumption (Lundqvist et al. 2008; Sadras et al. 2011)), and materials (Ayres and Simonis 1994; Fischer-Kowalski et al. 2011), using the example of steel manufacturing, use and recycling at the global level (Allwood and Cullen 2012). Invariably, conversion losses along the entire service delivery systems are substantial, ranging from 83% (water) to 86% (energy) and 87% (steel) of primary resource inputs (TWI2050 2018). In other words, only between 14 to 17% of the harnessed primary resources remain at the level of ultimate service delivery.

Figure 5.9 | Resource processing steps and efficiency cascades (in percentage of primary resource inputs [vertical axis] remaining at respective steps until ultimate service delivery) for illustrative global service delivery systems for energy (panel (a), disaggregated into three sectoral service types and the aggregate total), food (panel (b), water use in agriculture and food processing, delivery and use), and materials (panel (c), example steel). The aggregate efficiencies of service delivery chains is with 13–17% low. Source: TWI2050 (2018).
Examples of conversion losses on the supply side of resource processing systems include, for instance: for energy, electricity generation (global output/input conversion efficiency of electric plants of 45% as shown in energy balance statistics (IEA 2020b)); for water embodied in food, irrigation water use efficiency (some 40% (Sadras et al. 2011)) and calorific conversion efficiency (food calories in to food calories out) in meat production of 60% (Lundqvist et al. 2008), or for materials, globally only 47% of primary iron ore extracted and recovered steel scrap end up as steel in purchased products, (i.e., a loss of 57%) (Allwood and Cullen 2012).
A substantial part of losses happens at the end-use point and in final service delivery (where losses account for 47% to 60% of aggregate systems losses for steel and energy respectively, and 23% in the case of water embodied in food). The efficiency of service delivery (Brand-Correa and Steinberger 2017) has usually both a technological component (efficiency of end-use devices such as cars, light bulbs) and a behavioural component (i.e., how efficiently end-use devices are used, e.g., load factors) (Dietz et al. 2009; Laitner et al. 2009; Norton 2012; Kane and Srinivas 2014; Ehrhardt-Martinez 2015; Thaler 2015; Lopes et al. 2017). Using the example of mobility, where service levels are usually expressed by passenger-km, service delivery efficiency is thus a function of the fuel efficiency of the vehicle and its drivetrain (typically only about 20%–25% for internal combustion engines, but close to 100% for electric motors) plus how many passengers the vehicle actually transports (load factor, typically as low as 20–25%, i.e. one passenger per vehicle that could seat four to five), that is, an aggregate end-use efficiency of between 4–6% only. Aggregated energy end-use efficiencies at the global level are estimated as low as 20% (De Stercke 2014), 13% for steel (recovered post-use scrap) (Allwood and Cullen 2012), and some 70% for food (including distribution losses and food waste of some 30%) (Lundqvist et al. 2008).
To harness additional gains in efficiency by shifting the focus in service delivery systems to the end user can translate into large upstream resource reductions. For each unit of improvement at the end-use point of the service delivery system (examples shown in Figure 5.9), primary resource inputs are reduced between a factor of 6 to 7 units (water, steel, energy) (TWI2050 2018). For example, reducing energy needs for final service delivery equivalent to 1 EJ, reduces primary energy needs by some 7 EJ. There is thus high evidence and high agreement in the literature that the leverage effect for improvements in end-use service delivery efficiency through behavioural, technological, and market organisational innovations is very large, ranging from a factor 6 to 7 (resource cascades) to up to a factor 10 to 20 (exergy analysis), with the highest improvement potentials at the end-user and service provisioning levels (for systemic reviews see Nakićenović et al. (1996a), Grubler et al. (2012b), and Sousa et al. (2017)). Also, the literature shows high agreement that current conversion efficiencies are invariably low, particularly for those components at the end-use and service-delivery back end of service provisioning systems. It also suggests that efficiencies might actually be even lower than those revealed by direct input-output resource accounting, as discussed above (Figure 5.9). Illustrative exergy efficiencies of entire national or global service delivery systems range from 2.5% (USA (Ayres 1989)) to 5% (OECD average (Grubler et al. 2012b)) and 10% (global (Nakićenović et al., 1996)). Studies that adopt more restricted systems boundaries, either leaving out upstream resource processing/conversion or conversely end-use and service provision, show typical exergetic efficiencies between 15% (city of Geneva (Grubler et al. 2012a)) to below 25% (Japan, Italy, and Brazil, albeit with incomplete systems coverage that miss important conversion losses (Nakićenović et al. 1996b)). These findings are confirmed by more recent exergy efficiency studies that also include longitudinal time trend analysis (Cullen and Allwood 2010; Brockway et al. 2014; Serrenho et al. 2014; Brockway et al. 2015; Guevara et al. 2016). Figure 5.10 illustrates how energy demand reductions can be realised by improving the resource efficiency cascades shown in Figure 5.9.
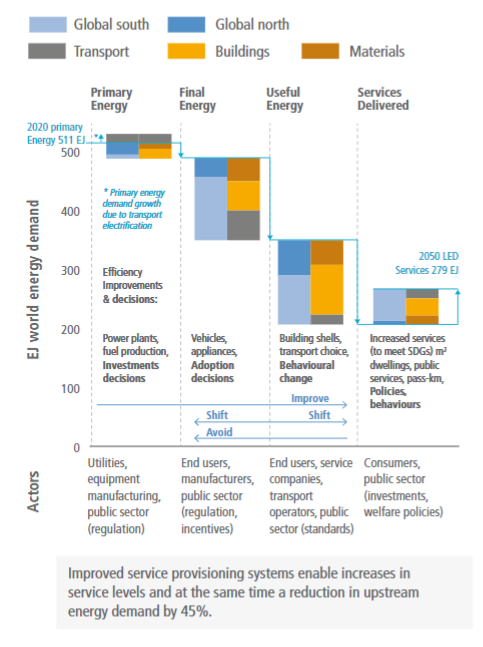
Figure 5.10 | Realisable energy efficiency improvements by region and by end-use type between 2020 and 2050 in an illustrative Low Energy Demand scenario (in EJ). Efficiency improvements are decomposed by respective steps in the conversion chain from primary energy to final, and useful, energy, and to service delivery, and disaggregated by region (developed and developing countries) and end-use type (buildings, transport, materials). Improvements are dominated by improved efficiency in service delivery (153 EJ) and by more efficient end-use energy conversion (134 EJ). Improvements in service efficiency in transport shown here are conservative in this scenario but could be substantially higher with the full adoption of integrated urban shared mobility schemes. Increases in energy use due to increases in service levels and system effects of transport electrification (grey bars on top of first pair in the bar charts) that counterbalance some of the efficiency improvements are also shown. Examples of options for efficiency improvements and decision involved (grey text in the chart), the relative weight of generic demand-side strategies (Avoid-Shift-Improve blue arrows), as well as prototype actors involved, are also illustrated. Data source: Figure 5.9 and Grubler et al. (2018).
5.3.3Low Demand Scenarios
Long-term mitigation scenarios play a crucial role in climate policy design in the near term, by illuminating transition pathways, interactions between supply-side and demand-side interventions, their timing, and the scales of required investments needed to achieve mitigation goals (Chapter 3). Historically, most long-term mitigation scenarios have taken technology-centric approaches with heavy reliance on supply-side solutions and the use of carbon dioxide removal, particularly in 1.5°C scenarios (Rogelj et al. 2018). Comparatively less attention has been paid to deep demand-side reductions incorporating socio-cultural change and the cascade effects (Section 5.3.2) associated with ASI strategies, primarily due to limited past representation of such service-oriented interventions in long-term integrated assessment models (IAMs) and energy systems models (ESMs) (Grubler et al. 2018; van de Ven et al. 2018; Napp et al. 2019). There is ample evidence of savings from sector- or issue-specific bottom-up studies (Section 5.3.1.2). However, these savings typically get lost in the dominant narrative provided by IAMs and ESMs and in their aggregate-level evaluations of combinations of ASI and efficiency strategies. As a result, their interaction effects do not typically get equal focus alongside supply-side and carbon dioxide removal options (Samadi et al. 2017; Van Vuuren et al. 2018; Van den Berg et al. 2019).
In response to 1.5°C ambitions, and a growing desire to identify participatory pathways with less reliance on carbon dioxide removal which has high uncertainty, some recent IAM and ESM mitigation scenarios have explored the role of deep demand-side energy and resource use reduction potentials at global and regional levels. Table 5.2 summarises long-term scenarios that aimed to: minimise service-level energy and resource demand as a central mitigation tenet; specifically evaluate the role of behavioural change and ASI strategies; and/or achieve a carbon budget with limited or no carbon dioxide removal. From assessment of this emerging body of literature, several general observations arise and are presented below.
First, socio-cultural changes within transition pathways can offer gigatonne-scale CO2 savings potential at the global level, and therefore represent a substantial overlooked strategy in traditional mitigation scenarios. Two lifestyle change scenarios conducted with the IMAGE IAM suggested that behaviour and cultural changes such as heating and cooling set-point adjustments, shorter showers, reduced appliance use, shifts to public transit, less meat-intensive diets, and improved recycling can deliver an additional 1.7 Gt and 3 GtCO2 savings in 2050, beyond the savings achieved in traditional technology-centric mitigation scenarios for the 2°C and 1.5°C ambitions, respectively (van Sluisveld et al. 2016; Van Vuuren et al. 2018). In its Sustainable Development Scenario, the IEA’s behavioural change and resource efficiency wedges deliver around 3 GtCO2-eq reduction in 2050, combined savings, roughly equivalent to those of solar PV that same year (IEA 2019a). In Europe, a Global Change Assessment Model (GCAM) scenario evaluating combined lifestyle changes such as teleworking, travel avoidance, dietary shifts, food waste reductions, and recycling reduced cumulative EU 27 CO2 emissions 2011–2050 by up to 16% compared to an SSP2 baseline (van de Ven et al. 2018). Also in Europe, a multi-regional input-output analysis suggested that adoption of low-carbon consumption practices could reduce carbon footprints by 25%, or 1.4 Gt (Moran et al. 2020). A global transport scenario suggests that transport sector emissions can decline from business-as-usual 18 GtCO2-eq to 2 GtCO2-eq if ASI strategies are deployed (Gota et al. 2019), a value considerably below the estimates provided in IAM scenarios that have limited or no resolution in ASI strategies (Chapter 10).
The IEA’s Net-Zero Emissions by 2050 (NZE) scenario, in which behavioural changes lead to 1.7 GtCO2 savings in 2030, expresses the substantial mitigation opportunity in terms of low-carbon technology equivalencies: to achieve the same emissions reductions, the global share of EVs in the NZE would have to increase from 20% to 45% by 2030 or the number of installed heat pumps in homes would have to increase from 440 to 660 million by 2030 (IEA 2021).
In light of the limited number of mitigation scenarios that represent socio-behavioural changes explicitly, there is medium evidence in the literature that such changes can reduce emissions at regional and global levels, but high agreement within that literature that such changes hold up to gigatonne-scale CO2 emissions reduction potentials.
Second, pursuant to the ASI principle, deep demand reductions require parallel pursuit of behavioural change and advanced energy-efficient technology deployment; neither is sufficient on its own. The LED scenario (Figure 5.10) combines behavioural and technological change consistent with numerous ASI strategies that leverage digitalisation, sharing, and circular economy megatrends to deliver decent living standards while reducing global final energy demand in 2050 to 245 EJ (Grubler et al. 2018). This value is 40% lower than final energy demand in 2018 (IEA 2019a), and a lower 2050 outcome than other IAM/ESM scenarios with primarily technology-centric mitigation approaches (Teske et al. 2015; IEA 2017b). In the IEA’s B2DS scenario, Avoid/Shift in the transport sector accounts for around 2 GtCO2-eq yr –1 in 2060, whereas parallel vehicle efficiency improvements increase the overall mitigation wedge to 5.5 GtCO2-eq yr –1 in 2060 (IEA 2017b). Through a combination of behavioural change and energy-efficient technology adoption, the IEA’s NZE requires only 340 EJ of global final energy demand with universal energy access in 2050, which is among the lowest of IPCC net zero SR1.5 scenarios (IEA 2021).
Third, low demand scenarios can reduce both supply-side capacity additions and the need for carbon capture and removal technologies to reach emissions targets. Of the scenarios listed in Table 5.2, one (LED-MESSAGE) reaches 2050 emissions targets with no carbon capture or removal technologies (Grubler et al. 2018), whereas others report significant reductions in reliance on bioenergy with carbon capture and storage (BECCS) compared to traditional technology-centric mitigation pathways (Liu et al. 2018; Van Vuuren et al. 2018; Napp et al. 2019), with the IEA’s NZE notably requiring the least carbon dioxide removal (1.8 Gt in 2050) and primary bioenergy (100 EJ in 2050) compared to IPCC net zero SR1.5 scenarios (IEA 2021).
Fourth, the costs of reaching mitigation targets may be lower when incorporating ASI strategies for deep energy and resource demand reductions. The TIAM-Grantham low demand scenarios displayed reduction in mitigation costs (0.87–2.4% of GDP), while achieving even lower cumulative emissions to 2100 (228 to ~475 GtCO2) than its central demand scenario (741 to 1066 GtCO2), which had a cost range of (2.4–4.1% of GDP) (Napp et al. 2019). The GCAM behavioural change scenario concluded that domestic emission savings would contribute to reducing the costs of achieving the internationally agreed climate goal of the EU by 13.5% to 30% (van de Ven et al. 2018). The AIMS lifestyle case indicated that mitigation costs, expressed as global GDP loss, would be 14% lower than the SSP2 reference scenario in 2100, for both 2°C and 1.5°C mitigation targets (Liu et al. 2018). These findings mirror earlier AIM results, which indicated lower overall mitigation costs for scenarios focused on energy service demand reductions (Fujimori et al. 2014). In the IEA’s NZE, behavioural changes that avoid energy and resource demand save USD4 trillion (cumulatively 2021–2050) compared to if those emissions reductions were achieved through low‐carbon electricity and hydrogen deployment (IEA 2021).
Based on the limited number of long-term mitigation scenarios that explicitly represent demand reductions enabled by ASI strategies, there is medium evidence but with high agreement within the literature that such scenarios can reduce dependence on supply-side capacity additions and carbon capture and removal technologies, with opportunites for lower overall mitigation costs.
If the limitations within most IAMs and ESMs regarding non-inclusion of granular ASI strategy analysis can be addressed, it will expand and improve long-term mitigation scenarios (Van den Berg et al. 2019). These include broader inclusion of mitigation costs for behavioural interventions (van Sluisveld et al. 2016), much greater incorporation of rebound effects (Krey et al. 2019), including from improved efficiencies (Brockway et al. 2021) and avoided spending (van de Ven et al. 2018), improved representation of materials cycles to assess resource cascades (Pauliuk et al. 2017), broader coverage of behavioural change (Samadi et al. 2017; Saujot et al. 2020), improved consideration of how economic development affects service demand (Semieniuk et al. 2021), explicit representation of intersectoral linkages related to digitalisation, sharing economy, and circular economy strategies (Section 5.3.4), and institutional, political, social, entrepreneurial, and cultural factors (van Sluisveld et al. 2018). Addressing the current significant modelling limitations will require increased investments in data generation and collection, model development, and inter-model comparisons, with a particular focus on socio-behavioural research, which has been underrepresented in mitigation research funding to date (Overland and Sovacool 2020).
COVID-19 interacts with demand-side scenarios (Box 5.2). Energy demand will mostly likely be reduced between 2020 and 2030 compared to the default pathway, and if recovery is steered towards low energy demand, carbon prices for a 1.5°C-consistent pathway will be reduced by 19%, energy supply investments until 2030 will be reduced by USD1.8 trillion, and the pressure to rapidly upscale renewable energy technologies will be softened (Kikstra et al. 2021a).
Table 5.2 | Summary of long-term scenarios with elements that aimed to minimise service-level energy and resource demand.
Global scenarios | ||||||||||
# | Scenario [Temp] | IAM/ ESM | Final energy | Focused demand reduction element(s) | Baseline scenario | Mitigation potentialc | ||||
Scope | Sectorsa | Key demand reduction measures considered (A, S, I) b | CO2 (Gt) | Final energy | Primary energy | |||||
1 | Lifestyle change scenario [2°C] | IMAGE | – | Whole scenario | R, T, I | A: set-points, smaller houses, reduced shower times, wash temperatures, standby loss, reduced car travel, reduced plastics S: from cars to bikes, rail I: improved plastic recycling | 2°C technology-centric scenario in 2050 | 1.9 | – | – |
2 | Sustainable Development scenario [1.8°C] | World Energy Model (WEM) | 398 EJ in 2040 | Behavioural change wedge and resource efficiency wedge | T, I | S: shifts from cars to mass transit, building lifespan extension, materials-efficient construction, product reuse I: improved recycling | Stated policies in 2050 | 3 | – | – |
3 | Beyond 2 Degrees scenario [1.75°C] | ETP-TIMES | 377 EJ in 2050 | Transport Avoid/Shift wedge and material efficiency wedge | T, I | A: shorter car trips, optimised truck routing and utilisation S: shifts from cars to mass transit I: plastics and metal recycling, production yield improvements | Stated policies in 2060 | 2.8 | – | – |
4 | Lifestyle change scenario [1.5°C] | IMAGE | 322 EJ in 2050 | Whole scenario | R, C, T, I | A: set-points, reduced appliance use S: from cars to mass transit, less meat-intensive diets, cultured meat I: best available technologies across sectors | 1.5°C technology-centric scenario in 2050 | 3.1 | – | – |
5 | Low Energy Demand scenario [1.5°C] | MESSAGE | 245 EJ in 2050 | Whole scenario | R, C, T, I, F | A: device integration, telework, shared mobility, material efficiency, dematerialisation, reduced paper S: multi-purpose dwellings, healthier diets I: best available technologies across sectors | Final energy in 2020 | – | 179 EJ | – |
6 | Advanced Energy [R]evolution | – | 279 EJ in 2050 | Whole scenario | R, C, T, I | S: shifts from cars to mass transit I: best available technologies across sectors | Continuation of current trends and policies in 2050 | – | 260 EJ | – |
7 | Limited BECCS – lifestyle change [1.5°C] | IMAGE | – | Whole scenario | R, C, T, F | A: set-points, reduced appliance use S: from cars to mass transit, less meat-intensive diets, cultured meat I: best available technologies across sectors | 1.5°C technology-centric scenario in 2050 | 2.2 Gt | – | 82 EJ |
8 | Lifestyle scenario [1.5°C] | AIM | 374 EJ in 2050 | Whole scenario | T, I, F | A: reduced transport services demand, reduced demand for industrial goods S: less meat-intensive diets | 1.5°C supply technology-centric scenario in 2050 | – | 42 EJ | – |
9 | Transport scenario [1.5°C] | Bottom-up construction | – | Whole scenario | T | A: multiple options S: multiple options I: multiple options | 89% vs BAU: 16GtCO2 | – | – | |
10 | Net Zero Emissions 2050 scenario | World Energy Model (WEM) | – | Behaviour change wedge | R, T | A: set-points, line drying, reduced wash temperatures, telework, reduced air travel S: shifts to walking, cycling I: eco-driving | Stated policies in 2030 | 2 | – | – |
11 | Decent living with minimum energy | Bottom-up construction | 149 EJ in 2050 | Whole scenario | R, T, I, F | A: activity levels for mobility, shelter, nutrition, etc., consistent with decent living standards S: shifts away from animal-based foods, shifts to public transit, etc. I: energy efficiency consistent with best available technologies | IEA Stated Policies Scenario in 2050 | – | 75% | – |
12 | Net‐Zero Emissions by 2050 Scenario (NZE) | Hybrid model based on WEM and ETP-TIMES | 340 EJ in 2050 | Behavioural change reductions | R, C, T, I | A: heating, air conditioning, and hot water set-points, reduce international flights, line drying, vehicle light-weighting, materials-efficient construction, building lifespan extension S: shifts from regional flights to high-speed rail, cars to walking, cycling or public transport, I: eco-driving, plastics recycling | Stated policies in 2050 | 2.6 | 37 EJ | |
Regional scenarios | ||||||||||
13 | Urban mitigation wedge | – | 540 EJ in global cities in 2050 | Whole scenario | R, C, T | A: reduced transport demand S: mixed-use developments I: vehicle efficiency, building codes and retrofits | Current trends to 2050 | – | 180 EJ | – |
14 | France 2072 collective society | TIMES-Fr | 4.2 EJ in France in 2072 | Whole scenario | R, T | A: less travel by car and plane, longer building and device lifespans, less spending S: shared housing, shifts from cars to walking, biking, mass transit | Final energy in 2014 | – | 1.7 EJ | – |
15 | EU 27 lifestyle change – enthusiastic profile | GCAM | – | Whole scenario | R, T, F | A: telework, avoid short flights, closer holidays, food waste reduction, car sharing, set-points S: vegan diet, shifts to cycling and public transit I: eco-driving, composting, paper, metal, plastic, and glass recycling | SSP2, cumulative emissions 2011–2050 | 16% | – | – |
16 | Europe broader regime change scenario | IMAGE | 35 EJ in EU in 2050 | Whole scenario | R, T | A: reduced passenger and air travel, smaller dwellings, fewer appliances, reduced shower times, set points, avoid standby losses S: car sharing, shifts to public transit I: best available technologies | SSP2 in 2050 | – | 10 EJ | – |
17 | EU Carbon-CAP | EXIOBASE 3 MRIO | – | Whole scenario | R, T, F | 90 demand-side behaviour change opportunities spanning A-S-I including changes to consumption patterns, reducing consumption, and switching to using goods with lower-carbon production and low-carbon use phases. | Present day consumption footprint | 1.4 | – | – |
18 | France ‘négawatt’ scenario | Bottom-up construction | Sufficiency wedge | R, C, T, I, F | A: increase building capacity utilisation, reduced appliance use, car sharing, telework, reduced goods consumption, less packaging S: shifts to attached buildings; shifts from cars and air to public transit and active mobility, car sharing, freight shifts to rail and water, shifts away from animal proteins I: reduced speed limits, vehicle efficiency, increased recycling | Business as usual in 2050 (~2,300 TWh primary energy) | – | – | ~500 TWh | |
19 | The Netherlands household energy behavioural changes | BENCH-NLD agent-based model | – | Individual energy behavioural changes and social dynamics; considering carbon pricing | R | A: reduce energy consumption through changing lifestyle, habits and consumption patterns S: to green energy provider; investment in solar PVs (prosumers) I: investment in insulation and energy-efficient appliances | SSP2 in 2030 | 50% | – | – |
20 | The Netherlands household energy behavioural changes | BENCH-NLD agent-based model | – | Individual energy behavioural changes and social dynamics | R | A: reduce energy consumption S: investment in solar PVs (prosumers) I: investment in insulation and energy-efficient appliances | SSP2 in 2050 | 56% | 51–71% | |
21 | Spain household energy behavioural changes | BENCH-ESP agent-based model | – | Individual energy behavioural changes and social dynamics | R | A: reduce energy consumption S: investment in solar PVs (prosumers) I: investment in insulation and energy-efficient appliances | SSP2 in 2050 | 44% | 16–64% | |
22 | A Societal Transformation Scenario for Staying Below 1.5°C | Global calculator | 187 EJ in 2050 | Whole scenario | R,C,I,F | A: reduce energy, material and land use consumption | n/a | Down to 9.1 GtCO2 in 2050 | ||
Sources: a van Sluisveld et al. (2016); b IEA (2019a); c IEA (2017b); d Van Vuuren et al. (2018); e Grubler et al. (2018); f Teske et al. (2015); g Esmeijer et al. (2018): h Liu et al. (2018); i Gota et al. (2019); j IEA (2020a); k Millward-Hopkins et al. (2020); l IEA (2021); m Creutzig et al. (2015b); n Millot et al. (2018); o van de Ven et al. (2018); p van Sluisveld et al. (2018); q Moran et al. (2020); r négawatt Association (2018); s Niamir et al. (2020c); t, u Niamir et al. (2020a); v Kuhnhenn et al. (2020).
aR = residential (Chapters 8, 9); C = commercial (Chapters 8, 9), T = transport (Chapters 8, 10), I = industry (Chapter 11), F = food (Chapters 6, 12).
bA= Avoid; S = Shift, I = Improve, BAU = business as usual.
cRelative to indicated baseline scenario value in stated year.
5.3.4Transformative Megatrends
The sharing economy, the circular economy, and digitalisation have all received much attention from the research, advocacy, business models and policy communities as potentially transformative trends for climate change mitigation (IEA 2017a; Material Economics 2018; TWI2050 2019). All are essentially emerging and contested concepts (Gallie 1955) that have the common goal of increasing convenience for users and rendering economic systems more resource efficient, but which exhibit variability in the literature on their definitions and system boundaries. Historically, both sharing and circular economies have been commonplace in developing countries, where reuse, repair, and waste scavenging and recycling comprise the core of informal economies facilitated by human interventions (Wilson et al. 2006; Asim et al. 2012; Pacheco et al. 2012). Digitalisation is now propelling sharing and circular economy concepts in developed and developing countries alike (Roy et al. 2021), and the three megatrends are highly interrelated, as seen in Figure 5.11. For example, many sharing economy concepts rely on corporate or, to lesser degree, non-profit digital platforms that enable efficient information and opportunity sharing, thus making it part of the digitalisation trend. Parts of the sharing economy are also included in some circular economy approaches, as shared resource use renders utilisation of material more efficient. Digital approaches to material management also support the circular economy, such as through waste exchanges and industrial symbiosis. Digitalisation aims more broadly to deliver services in more efficient, timely, intelligent, and less resource-intensive ways (i.e., by moving bits and not atoms), through the use of increasingly interconnected physical and digital systems in many facets of economies. With rising digitalisation also comes the risk of increased electricity use to power billions of devices and the internet infrastructure that connects them, as well as growing quantities of e-waste, presenting an important policy agenda for monitoring and balancing the carbon and resource costs and benefits of digitalisation (Malmodin and Lundén 2018; TWI2050 2019). Rebound effects and instigated consumption of digitalisation are risking to lead to a net increase in GHG emissions (Belkhir and Elmeligi 2018). The determinants and possible scales of mitigation potentials associated with each megatrend are discussed below.
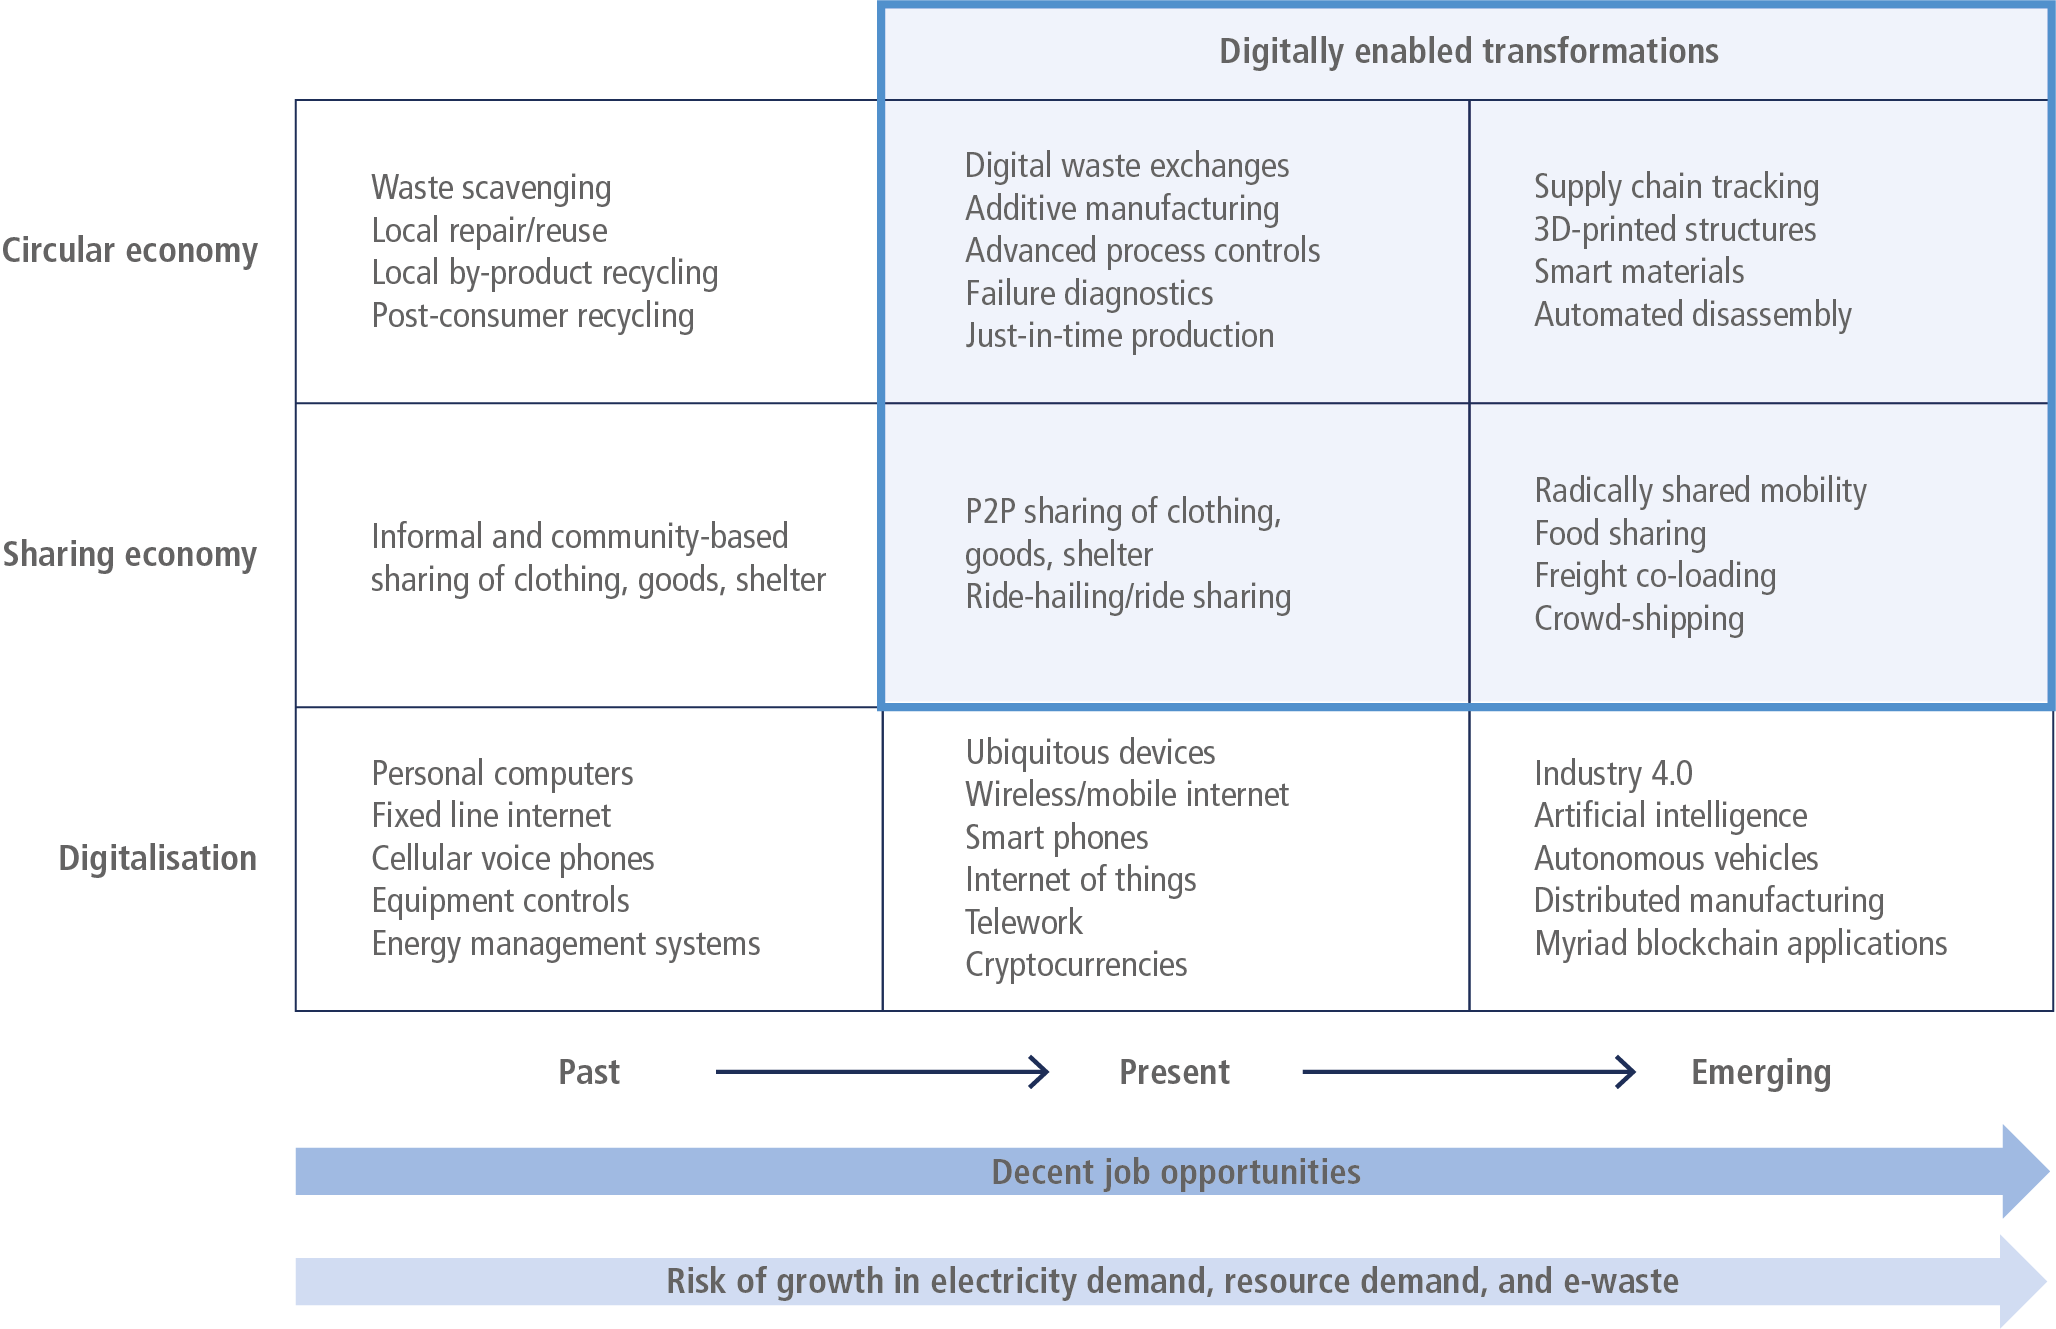
Figure 5.11 | The growing nexus between digitalisation, the sharing economy, and the circular economy in service delivery systems. While these trends started mostly independently, rapid digitalisation is creating new synergistic opportunities with systemic potential to improve the quality of jobs, particularly in developing economies. Widespread digitalisation may lead to net increases in electricity use, demand for electronics manufacturing resources, and e-waste, all of which must be monitored and managed via targeted policies.
5.3.4.1Digitalisation
In the context of service provision, there are numerous opportunities for consumers to buy, subscribe to, adopt, access, install or use digital goods and services (Wilson et al. 2020b). Digitalisation has opened up new possibilities across all domains of consumer activity, from travel and retail to domestic living and energy use. Digital platforms allow surplus resources to be identified, offered, shared, transacted and exchanged (Frenken 2017). Real-time information flows on consumers’ preferences and needs mean service provision can be personalised, differentiated, automated, and optimised (TWI2050 2019). Rapid innovation cycles and software upgrades drive continual improvements in performance and responsiveness to consumer behaviour. These characteristics of digitalisation enable new business models and services that affect both service demand, from shared ride-hailing (ITF 2017a) to smart heating (IEA 2017a), and how services are provisioned, from online farmers’ markets (Richards and Hamilton 2018) to peer-to-peer electricity trading to enable distributed power systems (Morstyn et al. 2018).
In many cases, digitalisation provides a ‘radical functionality’ that enables users to do or accomplish something that they could not do before (Nagy et al. 2016). Indeed the consumer appeal of digital innovations varies widely, from choice, convenience, flexibility and control to relational and social benefits (Pettifor and Wilson 2020). Reviewing over 30 digital goods and services for mobility, food buying and domestic living, Wilson et al. (2020b) also found shared elements of appeal across multiple innovations including (i) making use of surplus, (ii) using not owning, (iii) being part of wider networks, and (iv) exerting greater control over service provisioning systems. Digitalisation thus creates a strong value proposition for certain consumer niches. Concurrent diffusion of many digital innovations amplifies their disruptive potential (Schuelke-Leech 2018; Wilson et al. 2019b). Besides basic mobile telephone service for communication, digital innovations have been primarily geared to population groups with high purchasing power, and too little to the needs of poor and vulnerable people.
The long-term sustainability implications of digitalised services hinge on four factors: (i) the direct energy demands of connected devices and the digital infrastructures (i.e., data centres and communication networks) that provide necessary computing, storage, and communication services (Section 9.4.6); (ii) the systems-level energy and resource efficiencies that may be gained through the provision of digital services (Wilson et al. 2020b); (iii) the resource, material, and waste management requirements of the billions of ICT devices that comprise the world’s digital systems (Belkhir and Elmeligi 2018; Malmodin and Lundén 2018) and (iv) the magnitude of potential rebound effects or induced energy demands that might unleash unintended and unsustainable demand growth, such as autonomous vehicles inducing more frequent and longer journeys due to reduced travel costs (Wadud et al. 2016). Estimating digitalisation’s direct energy demand has historically been hampered by lack of consistent global data on IT device stocks, their power consumption characteristics, and usage patterns, for both consumer devices and the data centres and communication networks behind them. As a result, quantitative estimates vary widely, with literature values suggesting that consumer devices, data centres, and data networks account for anywhere from 6% to 12% of global electricity use (Gelenbe and Caseau 2015; Cook et al. 2017; Malmodin and Lundén 2018). For example, within the literature on data centres, top-down models that project energy use on the basis of increasing demand for internet services tend to predict rapid global energy use growth, (Andrae and Edler 2015; Belkhir and Elmeligi 2018; Liu et al. 2020a), whereas bottom-up models that consider data centre technology stocks and their energy efficiency trends tend to predict slower but still positive growth (Shehabi et al. 2018; Hintemann and Hinterholzer 2019; Malmodin 2020; Masanet et al. 2020). Yet there is growing concern that remaining energy efficiency improvements might be outpaced by rising demand for digital services, particularly as data-intensive technologies such as artificial intelligence, smart and connected energy systems, distributed manufacturing systems, and autonomous vehicles promise to increase demand for data services even further in the future (TWI2050 2019; Masanet et al. 2020; Strubell et al. 2020). Rapid digitalisation is also contributing to an expanding e-waste problem, estimated to be the fastest growing domestic waste stream globally (Forti et al. 2020).
As digitalisation proliferates, an important policy objective is therefore to invest in data collection and monitoring systems and energy demand models of digitalised systems to guide technology and policy investment decisions for addressing potential direct energy demand growth (IEA 2017a) and potentially concomitant growth in e-waste.
However, the net systems-level energy and resource efficiencies gained through the provision of digital services could play an important role in dealing with climate change and other environmental challenges (Masanet and Matthews 2010; Melville 2010; Elliot 2011; Watson et al. 2012; Gholami et al. 2013; Añón Higón et al. 2017). As shown in Figure 5.12, assessments of numerous digital service opportunities for mobility, nutrition, shelter, and education and entertainment suggest that net emissions benefits can be delivered at the systems level, although these effects are highly context dependent. Importantly, evidence of potential negative outcomes due to rebound effects, induced demand, or life-cycle trade-offs can also be observed. For example, telework has been shown to reduce emissions where long and/or energy-intensive commutes are avoided, but can lead to net emissions increases in cases where greater non-work vehicle use occurs or only short, low-emissions commutes (e.g., via public transit) are avoided (Hook et al. 2020; IEA 2020a; Viana Cerqueira et al. 2020). Similarly, substitution of physical media by digital alternatives may lead to emissions increases where greater consumption is fuelled, whereas a shift to 3D printed structures may require more emissions-intensive concrete formulations or result in reduced thermal energy efficiency, leading to life-cycle emissions increases (Mahadevan et al. 2020; Yao et al. 2020).
Furthermore, digitalisation, automation and artificial intelligence, as general-purpose technologies, may lead to a plethora of new products and applications that are likely to be efficient on their own but that may also lead to undesirable changes or absolute increases in demand for products (Figure 5.12). For example, last-mile delivery in logistics is both expensive and cumbersome. Battery-powered drones enable a delivery of goods at similar lifecycle emissions to delivery vans (Stolaroff et al. 2018). At the same time, drone delivery is cheaper in terms of time (immediate delivery) and monetary costs (automation saves the highest-cost component: personnel) (Sudbury and Hutchinson 2016). As a result, demand for package delivery may increase rapidly. Similarly, automated vehicles reduce the costs of time, parking, and personnel, and therefore may dramatically increase vehicle mileage (Wadud et al. 2016; Cohen and Cavoli 2019). On-demand electric scooters offer mobility access preferable to passenger cars, but can replace trips otherwise taken on public transit (de Bortoli and Christoforou 2020) and can come with significant additional energy requirements for night-time system rebalancing (Hollingsworth et al. 2019; ITF 2020). The energy requirements of cryptocurrencies is also a growing concern, although considerable uncertainty exists surrounding the energy use of their underlying blockchain infrastructure (Vranken 2017; de Vries 2018; Stoll et al. 2019). For example, while it is clear that the energy requirements of global Bitcoin mining have grown significantly since 2017, recent literature indicates a wide range of estimates for 2020 (47 TWh to 125 TWh) due to data gaps and differences in modelling approaches (Lei et al. 2021). Initial estimates of the computational intensity of artificial intelligence algorithms suggest that energy requirements may be enormous without concerted effort to improve efficiencies, especially on the computational side (Strubell et al. 2020). Efficiency gains enabled by digitalisation, in terms of reduced GHG emissions or energy use per service unit, may be overcompensated by activity/scale effects.
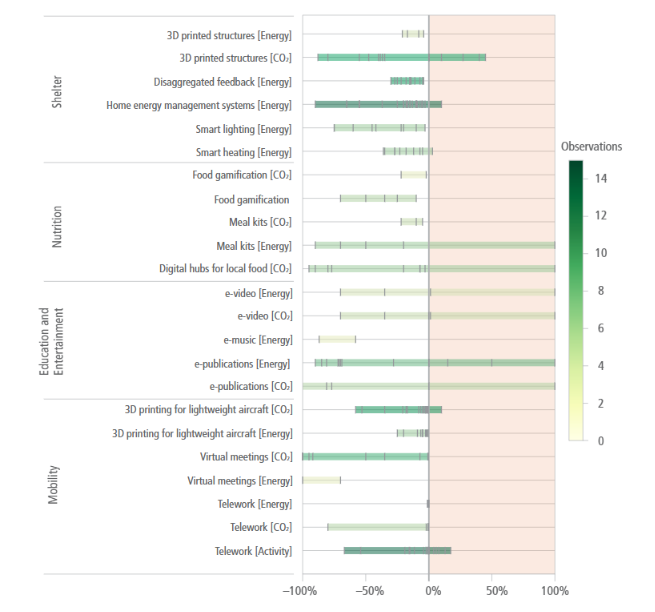
Figure 5.12 | Studies assessing net changes in CO2 emissions, energy use, and activity levels indicate mitigation potentials for numerous end-user-oriented digitalisation solutions, but also risk of increased emissions due to inefficient substitutions, induced demand, and rebound effects. 90 studies were assessed with 207 observations (indicated by vertical bars) including those based on empirical research, attributional and consequential lifecycle assessments, and techno-economic analyses and scenarios at different scales, which are not directly comparable but are useful for indicating the directionality and determinants of net emissions, energy, and activity effects. Sources: Erdmann and Hilty (2010); Gebler et al. (2014); Huang et al. (2016); Verhoef et al. (2018); Alhumayani et al. (2020); Court and Sorrell (2020); Hook et al. (2020); IEA (2020a); Saade et al. (2020); Torres-Carrillo et al. (2020); Wilson et al. (2020c); Yao et al. (2020); Muñoz et al. (2021).
Maximising the mitigation potential of digitalisation trends involves diligent monitoring and proactive management of both direct and indirect demand effects, to ensure that a proper balance is maintained. Direct energy demand can be managed through continued investments in, and incentives for, energy-efficient data centres, networks, and end-use devices (Masanet et al. 2011; Avgerinou et al. 2017; IEA 2017a; Koronen et al. 2020). Shifts to low-carbon power are a particularly important strategy being undertaken by data centre and network operators (Cook et al. 2014; Huang et al. 2020), which might be adopted across the digital device spectrum as a proactive mitigation strategy where data demands outpace hardware efficiency gains, which may be approaching limits in the near future (Koomey et al. 2011). Most recently, data centres are being investigated as a potential resource for demand response and load balancing in renewable power grids (Koronen et al. 2020; Zheng et al. 2020), while a large bandwidth for improving software efficiency has been suggested for overcoming slowing hardware efficiency gains (Leiserson et al. 2020). Ensuring efficiency benefits of digital services while avoiding potential rebound effects and demand surges will require early and proactive public policies to avoid excess energy use (TWI2050 2019; WBGU 2019), which will also necessitate investments in data collection and monitoring systems to ensure that net mitigation benefits are realised and that unintended consequences can be identified early and properly managed (IEA 2017a).
Within a small but growing body of literature on the net effects of digitalisation, there is medium evidence that digitalised consumer services can reduce overall emissions, energy use, and activity levels, with medium agreement on the scale of potential savings, with the important caveat that induced demand and rebound effects must be managed carefully to avoid negative outcomes.
5.3.4.2The Sharing Economy
Opportunities to increase service per product include peer-to-peer based sharing of goods and services such as housing, mobility, and tools. Hence, consumable products become durable goods delivering a ‘product service’, which potentially could provide the same level of service with fewer products (Fischedick et al. 2014).The sharing economy is an old practice of sharing assets between many without transferring ownership, which has been made new through focuses on sharing underutilised products and assets in ways that promote flexibility and convenience, often in a highly developed context via gig economy or online platforms. However, the sharing economy offers the potential to shift from ‘asset-heavy’ ownership to ‘asset-light’ access, especially in developing countries (Retamal 2019). General conclusions on the sharing economy as a framework for climate change mitigation are challenging and are better broken down to specific subsystems (Mi and Coffman 2019) (Chapter 5 Supplementary Material I, 5.SM.4.3).
Shared mobility
Shared mobility is characterised by the sharing of an asset (e.g., a bicycle, e-scooter, vehicle), and the use of technology (i.e., apps and the Internet) to connect users and providers. It succeeded by identifying market inefficiencies and transferring control over transactions to consumers. Even though most shared mobility providers operate privately, their services can be considered as part of a public transport system in so far as it is accessible to most transport users and does not require private asset ownership. Shared mobility reduces GHG emissions if it substitutes for more GHG-intensive travel (usually private car travel) (Martin and Shaheen 2011; Shaheen and Chan 2016; Santos 2018; Axsen and Sovacool 2019; Shaheen and Cohen 2019), and especially if it changes consumer behaviour in the long run ‘by shifting personal transportation choices from ownership to demand-fulfilment’ (Mi and Coffman 2019).
Demand is an important driver for energy use and emissions because decreased cost of travel time by sharing an asset (e.g., a vehicle) could lead to an increase in emissions, but a high level of vehicle sharing could reduce negative impacts associated with this (Brown and Dodder 2019). One example is the megacity Kolkata, India, which has as many as twelve different modes of public transportation that co-exist and offer means of mobility to its 14 million citizens (Box 5.8). Most public transport modes are shared mobility options ranging from sharing between two people in a rickshaw or between a few hundred in metro or suburban trains. Sharing also happens informally as daily commuters avail shared taxis and neighbours borrow each other’s car or bicycle for urgent or day trips.
Shared mobility using private vehicle assets is categorised into four models (Santos 2018): peer-to-peer platforms where individuals can rent the vehicle when not in use (Ballús-Armet et al. 2014); short-term rental managed and owned by a provider (Enoch and Taylor 2006; Schaefers et al. 2016; Bardhi and Eckhardt 2012); Uber-like ridehailing services (Wallsten 2015; Angrist et al. 2017); and ride pooling using private vehicles shared by passengers to a common destination (Liyanage et al. 2019; Shaheen and Cohen 2019). The latest model – ride pooling – is promising in terms of congestion and per capita CO2 emissions reductions and is a common practice in developing countries, however it is challenging in terms of waiting and travel time, comfort, and convenience, relative to private cars (Santos 2018; Shaheen and Cohen 2019). The other three models often yield profits to private parties, but remain mostly unrelated to reduction in CO2 emissions (Santos 2018). Shared travel models, especially Uber-like models, are criticised because of the flexibilisation of labour, especially in developing countries, in which unemployment rates and unregulated labour markets lay a foundation of precarity that lead many workers to seek out wide-ranging means towards patching together a living (Ettlinger 2017; Wells et al. 2020). Despite the advantages of shared mobility, such as convenience and affordability, consumers may also perceive risk formed by possible physical injury from strangers or unexpected poor service quality (Hong et al. 2019).
From a mitigation perspective, the current state of shared mobility looks at best questionable (Fishman et al. 2014; Ricci 2015; Martin 2016; Zhang and Mi 2018; Creutzig et al. 2019b; Mi and Coffman 2019; Zhang et al. 2019). Transport entrepreneurs and government officials often conflate ‘smart’ and ‘shared’ vehicles with ‘sustainable’ mobility, a conflation not withstanding scrutiny (Noy and Givoni 2018). Surveys demonstrate that many users take free-floating car sharing instead of public transit, rather than to replace their private car (Herrmann et al. 2014); while in the United States, ride-hailing and sharing data indicate that these services have increased road congestion and lowered transit ridership, with an insignificant change in vehicle ownership, and may further lead to net increases in energy use and CO2 emissions due to deadheading (Diao et al. 2021; Ward et al. 2021). If substitution effects and deadheading, which is the practice of allowing employees of a common carrier to use a vehicle as a non-revenue passenger, are accounted for, flexible motor-cycle sharing in Djakarta, Indonesia, is at best neutral to overall GHG emissions (Suatmadi et al. 2019). Passenger surveys conducted in Denver, Colorado, US, indicated that around 22% of all trips travelled with Uber and Lyft would have been travelled by transit, 12% would have walked or biked, and another 12% of passengers would not have travelled at all (Henao and Marshall 2019).
Positive effects can be realised directly in bike sharing due to its very low marginal transport emissions. For example, in 2016, bike sharing in Shanghai, China, reduced CO2 emissions by 25 ktCO2, with additional benefits to air quality (Zhang and Mi 2018). However, bike-sharing can also increase emissions from motor vehicle usage when inventory management is not optimised during maintenance, collection, and redistribution of dock-less bikes (Fishman et al. 2014; Zhang et al. 2019; Mi and Coffman 2019).
Shared mobility scenarios demonstrate that GHG emission reduction can be substantial when mobility systems and digitalisation are regulated. One study modelled that ride pooling with electric cars (6 to 16 seats), which shifts the service to a more efficient transport mode, improves its carbon intensity by cutting GHG emissions by one-third (International Transport Forum 2016). Another study found that shared autonomous taxis had the potential to reduce per-mile GHG emissions to 63–82% below those of projected hybrid vehicles in 2030, 87% to 94% lower than a privately owned, gasoline-powered vehicle in 2014 (Greenblatt and Saxena 2015). This also realises 95% reduction in space required for public parking; and total vehicle kilometres travelled would be 37% lower than the present day, although each vehicle would travel ten times the total distance of current vehicles (International Transport Forum 2016). Studies of Berlin, Germany, and Lisbon, Portugal, demonstrate that sharing strategies could reduce the number of cars by more than 90%, also saving valuable street space for human-scale activity (Bischoff and Maciejewski 2016; Martinez and Viegas 2017; Creutzig et al. 2019b). The impacts will depend on sharing levels – concurrent or sequential – and the future modal split among public transit, automated electric vehicles fleets, and shared or pooled rides. Evidence from attributional lifecycle assessments (LCAs) of ride-hailing, whether Uber-like or by taxi, suggests that the key determinants of net emissions effects are average vehicle occupancy and vehicle powertrain, with high-occupancy and electric drivetrain cars delivering the greatest emissions benefits, even rivalling traditional metro/urban rail and bus options (Figure 5.13b). It is possible that shared automated electric vehicle fleets could become widely used without many shared rides, and single- or even zero-occupant vehicles will continue to be the majority of vehicle trips. It is also feasible that shared rides could become more common, if automation makes route deviation more efficient, more cost effective, and more convenient, increasing total travel substantially (Wadud et al. 2016). Car sharing with automated vehicles could even worsen congestion and emissions by generating additional travel demand (Rubin et al. 2016). Travel time in autonomous vehicles can be used for other activities but driving and travel costs are expected to decrease, which most likely will induce additional demand for auto travel (Moeckel and Lewis 2017) and could even create incentives for further urban sprawl. More generally, increased efficiency generated by big data and smart algorithms may generate rebound effects in demand and potentially compromise the public benefits of their efficiency promise (Gossart 2015).

Figure 5.13 | (a) Published estimates from 72 studies with 185 observations (indicated by vertical bars) of the relative mitigation potential of different shared and circular economy strategies, demonstrating limited observations for many emerging strategies, a wide variance in estimated benefits for most strategies, and within the sharing economy, risk of increased emissions due to inefficient substitutions, induced demand, and rebound effects. Mitigation potentials are conditional on corresponding public policy and/or regulation. (b) Attributional LCA comparisons of ridesharing mobility options, which highlight the large effects of vehicle occupancy and vehicle technology on total CO2 emissions per passenger-km and the preferability of high-occupancy and non-ICE configurations for emissions reductions compared to private cars. Also indicated are possible emissions increases associated with shared car mobility when it substitutes for non-motorised and public transit options. BEV = battery electric vehicle; FCEV = fuel cell electric vehicle; HEV = hybrid electric vehicle; ICE = internal combustion engine; PHEV = plug-in hybrid electric vehicle. Sources: data from Jacobson and King (2009); Firnkorn and Müller (2011); Baptista et al. (2014); Liu et al. (2014); Namazu and Dowlatabadi (2015); Nijland et al. (2015); IEA (2016); Koh (2016); Martin and Shaheen (2016); Rabbitt and Ghosh (2016); Bruck et al. (2017); Bullock et al. (2017); Clewlow and Mishra (2017); Fremstad (2017); ITF (2017a,b,c); Nasir et al. (2017); Nijland and van Meerkerk (2017); Rademaekers et al. (2017); Skjelvik et al. (2017); Yin et al. (2017); Campbell (2018); Favier et al. (2018); Ghisellini et al. (2018); Hopkinson et al. (2018); IEA (2018); ITF (2018); Lokhandwala and Cai (2018); Makov and Font Vivanco (2018); Malmqvist et al. (2018); Material Economics (2018); Nasr et al. (2018); Yu et al. (2018); Zhang and Mi (2018); Brambilla et al. (2019); Brütting et al. (2019); Buyle et al. (2019); Castro and Pasanen (2019); Coulombel et al. (2019); Eberhardt et al. (2019); IEA (2019b); ITF (2019); Jones and Leibowicz (2019); Ludmann (2019); Merlin (2019); Nußholz et al. (2019); Bonilla-Alicea et al. (2020); Cantzler et al. (2020); Churkina et al. (2020); Gallego-Schmid et al. (2020); Hertwich et al. (2020); ITF (2020a,b); Liang et al. (2020); Miller (2020); Wilson et al. (2020c); Yan et al. (2020); Cordella et al. (2021); Diao et al. (2021); Pauliuk et al. (2021); Ward et al. (2021); Wolfram et al. (2021).
In many countries, shared mobility and ride pooling are often the norm. Here the challenge is to improve service quality to keep users in shared mobility and public transport (Box 5.8). A key barrier in cities like Nairobi, Kenya, is the lack of public involvement of users and sustainability experts in designing transport systems, leaving planning to transport engineers, and thus preventing inclusive shared mobility system design (Klopp 2012).
Altogether, travel behaviour, business models, and especially public policy will be key components in determining how impacts of pooling and shared automated electric vehicles unfold (Shaheen and Cohen 2019). Urban-scale governance of smart mobility holds potential for prioritising public transit and the use of public spaces for human activities, managing the data as a digital sustainable commons (e.g., via the installation of a Central Information Officer, as in Tel Aviv, Israel), and managing the social and environmental risks of smart mobility to realise its benefits (Creutzig et al. 2019b). Pricing of energy use and GHG emissions will be helpful to achieve these goals. The governance of shared mobility is complicated, as it involves many actors, and is key to realising wider benefits of shared mobility (Akyelken et al. 2018). New actors, networks and technologies enabling shared mobility are already fundamentally challenging how transport is governed worldwide. This is not a debate about state versus non-state actors but instead about the role the state takes within these new networks to steer, facilitate, and also reject different elements of the mobility system (Docherty et al. 2018).
Shared accommodation
In developing countries and in many student accommodations globally, shared accommodation allows affordable housing for a large part of the population. For example, living arrangements are built expressly around the practice of sharing toilets, bathrooms and kitchens. While the sharing of such facilities does connote a lower level of service provision and quality of life, it provides access for a consumer base with very low and unreliable incomes. Thus, sharing key facilities can help guarantee the provision of affordable housing (Gulyani et al. 2018). In developed countries, large-scale developments are targeting students and ‘young professionals’ by offering shared accommodation and services. Historically shared accommodation has been part of the student life due to its flexible and affordable characteristics. However, the expansion of housing supply through densification can use shared facilities as an instrument to ‘commercialize small housing production, while housing affordability and accessibility are threatened’ (Uyttebrouck et al. 2020).
With respect to travel accommodation, several models are emerging in which accommodation is offered to, or shared with, travellers by private individuals organised by business-driven or non-profit online platforms. Accommodation sharing includes peer-to-peer, ICT-enabled, short-term renting, swapping, borrowing or lending of existing privately-owned lodging facilities (Möhlmann 2015; Voytenko Palgan et al. 2017).
With shared accommodation services via the platform economy, there may be risks of negative sustainability effects, such as rebound effects caused by increased travel frequency (Tussyadiah and Pesonen 2016). This is particularly a problem if apartments are removed from long-term rental markets, thus indirectly inducing construction activities, with substantial GHG emissions of their own. However, if a host shares their accommodation with a guest, the use of some resources, such as heating and lighting, is shared, thereby leading to more efficient resource use per capita (Chenoweth 2009; Voytenko Palgan et al. 2017). Given the nascence of shared accommodation via the platform economy, quantifications of its systems-level energy and emissions impacts are lacking in the literature, representing an important area for future study.
Mitigation potentials of sharing economy strategies
Sharing economy initiatives play a central role in enabling individuals to share underutilised products. While the literature on the net effects of sharing economy strategies is still limited, available studies have presented different mitigation potentials to date, as shown in Figure 5.13. For many sharing economy strategies, there is a risk of negative rebound and induced demand effects, which may occur by changing consuming patterns, for example if savings from sharing housing are used to finance air travel. Thus, the mitigation potentials of sharing economy strategies will depend on stringent public policy and consumer awareness that reins in runaway consumption effects. Shared economy solutions generally relate to the ‘Avoid’ and ‘Shift’ strategies (Sections 5.1 and 5.3.2). On the one hand, they hold potential for providing similar or improved services for well-being (mobility, shelter) at reduced energy and resource input, with the proper policy signals and consumer responses. On the other hand, shared economy strategies may increase emissions, for example shared mobility may shift activity away from public transit and lead to lower vehicle occupancy, deadheading, and use of inefficient shared vehicles (Jones and Leibowicz 2019; Merlin 2019; Bonilla-Alicea et al. 2020; Ward et al. 2021). Similarly to digitalisation, there is medium evidence that the sharing economy can reduce overall emissions, energy use, and activity levels, with medium agreement on the scale of potential savings if induced demand and rebound effects can be carefully managed to avoid negative outcomes.
The circular economy
While the demand for energy and materials will increase until 2060 following the traditional linear model of production and consumption, resulting in serious environmental consequences (OECD 2019b), the circular economy (CE) provides strategies for reducing societal needs for energy and primary materials to deliver the same level of service with lower environmental impacts. The CE framework embodies multiple schools of thought with roots in a number of related concepts (Blomsma and Brennan 2017; Murray et al. 2017), including cradle to cradle (McDonough and Braungart 2002), performance economy (Stahel 2016), biomimicry (Benyus 1997), green economy (Loiseau et al. 2016) and industrial ecology (Saavedra et al. 2018). As a result, there are also many definitions of CE: a systematic literature review identified 114 different definitions (Kirchherr et al. 2017). One of the most comprehensive models is suggested by the Netherlands Environmental Assessment Agency (Potting et al. 2018), which defines ten strategies for circularity: Refuse (R0), Rethink (R1), Reduce (R2), Reuse (R3), Repair (R4), Refurbish (R5), Remanufacture (R6), Repurpose (R7), Recycle (R8), and Recover energy (R9). Overall, the definition of CE is contested, with varying boundary conditions chosen. As illustrated in Figure 5.11, the CE overlaps with both the sharing economy and digitalisation megatrends.
In line with the principles of SDG 12 (responsible consumption and production), the essence of building a CE is to retain as much value as possible from products and components when they reach the end of their useful life in a given application (Lewandowski 2016; Lieder and Rashid 2016; Stahel 2016; Linder and Williander 2017). This requires an integrated approach during the design phase that, for example, extends product usage and ensures recyclability after use (de Coninck et al. 2018). While traditional ‘Improve’ strategies tend to focus on direct energy and carbon efficiency, service-oriented strategies focus on reducing lifecycle emissions through harnessing the leverage effect (Creutzig et al. 2018). The development of closed-loop models in service-oriented businesses can increase resource and energy efficiency, reducing emissions and contributing to climate change mitigation goals at national, regional, and global levels (Johannsdottir 2014; Korhonen et al. 2018). Key examples include remanufacturing of consumer products to extend lifespans while maintaining adequate service levels (Klausner et al. 1998), reuse of building components to reduce demand for primary materials and construction processes (Shanks et al. 2019), and improved recycling to reduce upstream resource pressures (IEA 2019b; IEA 2017b).
Among the many schools of thought on the CE and climate change mitigation, two different trends can be distinguished from the literature to date. First, there are publications, many of them not peer-reviewed, that eulogise the perceived benefits of the CE, but in many cases stop short of providing a quantitative assessment. Promotion of CE from this perspective has been criticised as a greenwashing attempt by industry to avoid serious regulation (Isenhour 2019). Second, there are more methodologically rigorous publications, mostly originating in the industrial ecology field, but sometimes investigating only limited aspects of the CE (Bocken et al. 2017; Cullen 2017; Goldberg 2017). Conclusions on CE’s mitigation potential also differ, with diverging definitions of the CE. A systematic review identified 3,244 peer-reviewed articles addressing CE and climate change, but only 10% of those provide insights on how the CE can support mitigation, and most of them found only small potentials to reduce GHG emissions (Cantzler et al. 2020). Recycling is the CE category most investigated, while reuse and reduce strategies have seen comparatively less attention (Cantzler et al. 2020). However, mitigation potentials were also context- and material-specific, as illustrated by the ranges shown in Figure 5.13a.
There are three key concerns relating to the effectiveness of the CE concept. First, many proposals on the CE insufficiently reflect on thermodynamic constraints that limit the potential of recycling from both mass conservation and material quality perspectives or ignore the considerable amount of energy needed to reuse materials (Cullen 2017). Second, demand for materials and resources will likely outpace efficiency gains in supply chains, becoming a key driver of GHG emissions and other environmental problems, rendering the CE alone an insufficient strategy to reduce emissions (Bengtsson et al. 2018). In fact, the empirical literature points out that only 6.5% of all processed materials (4 Gt yr –1) globally originate from recycled sources (Haas et al. 2015). The low degree of circularity is explained by the high proportion of processed materials (44%) used to provide energy, thus not available for recycling; and the high rate of net additions to stocks of 17 Gt yr –1. As long as long-lived material stocks (e.g., in buildings and infrastructure) continue to grow, strategies targeting end-of-pipe materials cannot keep pace with primary materials demand (Krausmann et al. 2017; Haas et al. 2020). Instead, a significant reduction of societal stock growth, and decisive eco-design, are suggested to advance the CE (Haas et al. 2015). Third, cost-effectiveness underlying CE activities may concurrently also increase energy intensity and reduce labour intensity, causing systematically undesirable effects. To a large extent, the distribution of costs and benefits of material and energy use depend on institutions in order to include demand-side solutions. Thus, institutional conditions have an essential role to play in setting rules differentiating profitable from nonprofitable activities in CE (Moreau et al. 2017). Moreover, the prevalence of CE practices such as reuse, refurbishment, and recycling can differ substantially between developed and developing economies, leading to highly context-specific mitigation potentials and policy approaches (McDowall et al. 2017).
One report estimates that the CE can contribute to more than 6 GtCO2 emission reductions in 2030, including strategies such as material substitution in buildings (Blok et al. 2016). Reform of the tax system towards GHG emissions and the extraction of raw materials substituting taxes on labour is a key precondition to achieve such a potential. Otherwise, rebound effects tend to take back a high share of marginal CE efforts. A 50% reduction of GHG emissions in industrial processes, including the production of goods in steel, cement, plastic, paper, and aluminium, from 2010 until 2050, is impossible to attain only with reuse and radical product innovation strategies, but will need to also rely on the reduction of primary input (Allwood et al. 2010).
CE strategies generally correspond to the ‘Avoid’ strategy for primary materials (Sections 5.1 and 5.3.2). CE strategies in industrial settings improve well-being mostly indirectly, via the reduction of environmental harm and climate impact. They can also save monetary resources of consumers by reducing the need for consumption. It may seem counterintuitive, but reducing consumers’ need to consume a particular product or service (e.g., reducing energy consumption) may increase consumption of another product or service (e.g., travel) associated with some type of energy use, or lead to greater consumption if additional secondary markets are created. Hence, carbon emissions could rise if the rebound effect is not considered (Chitnis et al. 2013; Zink and Geyer 2017).
Looking at ‘Shift’ strategies (Sections 5.1 and 5.3.2), the role of individuals as consumers and users has received less attention than other aspects of the CE (e.g., technological interventions as ‘Improve’ strategies and waste minimisation as ‘Avoid’ strategies) within mainstream debates to date. One explanation is that CE has roots in the field of industrial ecology, which has historically emphasised materials systems more than the end user. By shifting this perspective from the supply side to the demand side in the CE, users are, for the most part, discussed as social entities that now must form new relations with businesses to meet their needs. That is, the demand-side approach largely replaces the concept of a consumer with that of a user, who must either accept or reject new business models for service provision, stimulated by the pushes and pulls of prices and performance (Hobson 2019).
Relevant contributions to climate change mitigation at gigatonne scale by the CE will remain out of scope if decision-makers and industry fail to reduce primary inputs ( high confidence). Systemic (consequential) analysis is required to avoid the risk that scaling effects negate efficiency gains; such analysis is however rarely applied to date. For example, material substitution or refurbishment of buildings brings risk of increasing emissions despite improving or avoiding current materials (Castro and Pasanen 2019; Eberhardt et al. 2019). Besides, CE concepts that extend the lifetime of products and increase the fraction of recycling are useful but are both thermodynamically limited and will remain relatively small in scale as long as demand for primary materials continues to grow, and scale effects dominate. In spite of presenting a large body of literature on CE in general, only a small but growing body of literature exists on the net effects of its strategies from a quantitative perspective, with key knowledge gaps remaining on specific CE strategies. There is medium evidence that the CE can reduce overall emissions, energy use, and activity levels, with medium evidence that the sharing economy can reduce overall emissions, energy use, and activity levels, with medium agreement on the scale of potential savings.
5.4Transition Toward High Well-being and Low-carbon-demand Societies
Demand-side mitigation involves individuals (e.g., consumption choices), culture (e.g., social norms, values), corporate (e.g., investments), institutions (e.g., political agency), and infrastructure change ( high evidence, high agreement ). These five drivers of human behaviour either contribute to the status quo of a global high-carbon, consumption- and GDP growth-oriented economy or help generate the desired change to a low-carbon energy-services, well-being, and equity-oriented economy (Jackson 2016; Cassiers et al. 2018; Yuana et al. 2020; Nielsen et al. 2021) (Figure 5.14). Each driver has novel implications for the design and implementation of demand-side mitigation policies. They show important synergies, making energy demand mitigation a dynamic problem where the packaging and/or sequencing of different policies play a role in their effectiveness, demonstrated in Sections 5.5 and 5.6. The Social Science Primer (Chapter 5 Supplementary Material I) describes theory and empirical insights about the interplay between individual agency, the social and physical context of demand-side decisions in the form of social roles and norms, infrastructure and technological constraints and affordances, and other formal and informal institutions. Incremental interventions on all five fronts change social practices, affecting simultaneously energy and well-being (Schot and Kanger 2018). Transformative change will require coordinated use of all five drivers, as described in Figure 5.14 and, using novel insights about behaviour change for policy design and implementation ( high evidence, high agreement ). In particular, socio-economic factors, such as equity, public service quality, electricity access and democracy are found to be highly significant in enabling need satisfaction at low energy use, whereas economic growth beyond moderate incomes and extractive economic activities are observed to be prohibiting factors (Vogel et al. 2021).

Figure 5.14 | Role of people, demand-side action and consumption in reversing a planetary trajectory to a warming Earth towards effective climate change mitigation and dignified living standards for all.
5.4.1Behavioural Drivers
Behaviour change by individuals and households requires both motivation to change and capacity for change (option availability/knowledge; material/cognitive resources to initiate and maintain change) (Moser and Ekstrom 2010; Michie et al. 2011) and is best seen as part of more encompassing collective action. Motivation for change for collective good comes from economic, legal, and social incentives, and regard for deeper intrinsic value of concern for others over extrinsic values. Capacity for change varies; people in informal settlements or rural areas are incapacitated by socio-political realities and have limited access to new energy-service options.
Motivation and effort required for behaviour change increase from ‘Improve’ to ‘Shift’ to ‘Avoid’ decisions. ‘Improve’ requires changes in personal purchase decisions, ‘Shift’ involves changes in behavioural routines, ‘Avoid’ also involves changes in deeper values or mindsets. People set easy goals for themselves and more difficult ones for others (Attari et al. 2016) and underestimate the energy savings of behaviour changes that make a large difference (Attari et al. 2010). Most personal actions taken so far have small mitigation potential (recycling, ecodriving), and people refrain from options advocated more recently with high impact (less flying, living car free) (Dubois et al. 2019).
As individuals pursue a broad set of goals and use calculation-, emotion-, and rule-based processes when they make energy decisions, demand-side policies can use a broad range of behavioural tools that complement subsidies, taxes, and regulations (Chakravarty and Roy 2016; Mattauch et al. 2016; Niamir 2019) ( high evidence, high agreement ). The provision of targeted information, social advertisements, and influence of trusted in-group members and/role models or admired role models like celebrities can be used to create better climate change knowledge and awareness (Niamir 2019; Niamir et al. 2020b; Niamir et al. 2020c). Behavioural interventions like communicating changes in social norms can accelerate behaviour change by creating tipping points (Nyborg et al. 2016). When changes in energy-demand decisions (such as switching to a plant-based diet, (Box 5.5)) are motivated by the creation and activation of a social identity consistent with this and other behaviours, positive spillover can accelerate behaviour change (Truelove et al. 2014), both within a domain or across settings, for example from work to home (Maki and Rothman 2017).
Box 5.5 | Dietary Shifts in UK Society Towards Lower-emission Foods
Meat eating is declining in the UK, alongside a shift from carbon-intensive red meat towards poultry. This is due to the interaction of behavioural, socio-cultural and organisational drivers (Vinnari and Vinnari 2014). Reduced meat consumption is primarily driven by issues of personal health and animal welfare, instead of climate or environment concerns (Latvala et al. 2012; Dibb and Fitzpatrick 2014; Hartmann and Siegrist 2017; Graça et al. 2019). Social movements have promoted shifts to a vegan diet (Morris et al. 2014; Laestadius et al. 2016) yet their impact on actual behaviour is the subject of debate (Taufik et al. 2019; Harguess et al. 2020; Sahakian et al. 2020). Companies have expanded new markets in non-meat products (MINTEL 2019). Both corporate food actors and new entrants offering more innovative ‘meat alternatives’ view consumer preferences as an economic opportunity, and are responding by increasing the availability of meat replacement products. No significant policy change has taken place in the UK to enable dietary shift (Wellesley and Froggatt 2015); however the Climate Change Committee has recommended dietary shift in the Sixth Carbon Budget (Climate Change Committee 2020), involving reduced consumption of high-carbon meat and dairy products by 20% by 2030, with further reductions in later years in order to reach net zero GHG emissions by 2050. Agricultural policies serve to support meat production with large subsidies that lower production cost and effectively increase the meat intensity of diets at a population level (Simon 2003; Godfray et al. 2018). Deeper, population-wide reductions in meat consumption are hampered by these lock-in mechanisms which continue to stabilise the existing meat production-consumption system. The extent to which policymakers are willing to actively stimulate reduced meat consumption thus remains an open question (Godfray et al. 2018). See more in Chapter 5 Supplementary Material I, Section 5.SM.6.4.
People’s general perceptions of climate risks, first covered in AR5, motivate behaviour change; more proximate and personal feelings of being at risk triggered by extreme weather and climate-linked natural disasters will increase concern and willingness to act (Bergquist et al. 2019), though the window of increased support is short (Sisco et al. 2017). 67% of individuals in 26 countries see climate change as a major threat to their country, an increase from 53% in 2013, though 29% also consider it a minor or no threat (Fagan and Huang 2019). Concern that the COVID-19 crisis may derail this momentum due to a finite pool of worry (Weber 2006) appears to be unwarranted: Americans’ positions on climate change in 2020 matched high levels of concern measured in 2019 (Leiserowitz et al. 2020). Younger, female, and more educated individuals perceive climate risks to be larger (Weber 2016; Fagan and Huang 2019). Moral values and political ideology influence climate risk perception and beliefs about the outcomes and effectiveness of climate action (Maibach et al. 2011). Motivation for demand-side solutions can be increased by focusing on personal health or financial risks and benefits that clearly matter to people (Petrovic et al. 2014). Consistent with climate change as a normally distant, non-threatening, statistical issue (Gifford 2011; Fox-Glassman and Weber 2016 ), personal experience with climate-linked flooding or other extreme weather events increases perceptions of risk and willingness to act (Weber 2013; Atreya and Ferreira 2015; Sisco et al. 2017) when plausible mediators and moderators are considered Brügger et al. (2021), confirmed in all 24 countries studied by Broomell et al. (2015). Discounting the future matters (Hershfield et al. 2014): across multiple countries, individuals more focused on future outcomes are more likely to engage in environmental actions (Milfont et al. 2012).
There is medium evidence and high agreement that demographics, values, goals, personal and social norms differentially determine ASI behaviours, in the Netherlands and Spain (Abrahamse and Steg 2009; Niamir 2019; Niamir et al. 2020b), the OECD (Ameli and Brandt 2015), and 11 European countries (Mills and Schleich 2012; Roy et al. 2012). Education and income increase ‘Shift’ and ‘Improve’ behaviour, whereas personal norms help to increase the more difficult ‘Avoid’ behaviours (Mills and Schleich 2012). Socio-demographic variables (household size and income) predict energy use, but psychological variables (perceived behavioural control, perceived responsibility) predict changes in energy use; younger households are more likely to adopt ‘Improve’ decisions, whereas education increases ‘Avoid’ decisions (Ahmad et al. 2015). In India and developing countries, ‘Avoid’ decisions are made by individuals championing a cause, while ‘Improve’ and ‘Shift’ behaviour are increased by awareness programmes and promotional materials highlighting environmental and financial benefits (Chakravarty and Roy 2016; Roy et al. 2018a). Cleaner cookstove adoption Box 5.6), a widely studied ‘Improve’ solution in developing countries (Nepal et al. 2010; Pant et al. 2014), goes up with income, education, and urban location. Female education and investments in reproductive health are evident measures to reduce world population growth (Abel et al. 2016).
Box 5.6 | Socio-behavioural Aspects of Deploying Cookstoves
Universal access to clean and modern cooking energy could cut premature deaths from household air pollution by two-thirds, while reducing forest degradation and deforestation and contributinh to the reduction of up to 50% of CO2 emissions from cooking (relative to baseline by 2030) (IEA 2017c; Dagnachew et al. 2019). However, in the absence of policy reform and substantial energy investments, 2.3 billion people will have no access to clean cooking fuels such as biogas, LPG, natural gas or electricity in 2030 (IEA 2017c). Studies reveal that a combination of drivers influence adoption of new cookstove appliances, including affordability, behavioural and cultural aspects (lifestyles, social norms around cooking and dietary practices), information provision, availability, aesthetic qualities of the technology, perceived health benefits, and infrastructure (spatial design of households and cooking areas). The increasing efficiency improvements in electric cooking technologies could enable households to shift to electrical cooking at mass scale. The use of pressure cookers and rice cookers is now widespread in South Asia and beginning to penetrate the African market as consumer attitudes are changing towards household appliances with higher energy efficiencies (Batchelor et al. 2019). There are shifts towards electric and LPG stoves in Bhutan (Dendup and Arimura 2019), India (Pattanayak et al. 2019), Ecuador (Martínez et al. 2017; Gould et al. 2018) and Ethiopia (Tesfamichael et al. 2021); and improved biomass stoves in China (Smith et al. 1993). Significant subsidy, information (Dendup and Arimura 2019), social marketing and availability of technology in the local markets are some of the key policy instruments helping to adopt improved cookstoves (Pattanayak et al. 2019). There is no one-size-fits-all solution to household air pollution – different levels of shift and improvement occur in different cultural contexts, indicating the importance of socio-cultural and behavioural aspects in shifts in cooking practices. See more in Chapter 5 Supplementary Material I, Section 5.SM.6.2.
There is high agreement in the literature that the updating of educational systems from a commercialised, individualised, entrepreneurial training model to an education cognisant of planetary health and human well-being can accelerate climate change awareness and action (Mendoza and Roa 2014; Dombrowski et al. 2016) (Supplementary Material I Chapter 5).
There is high evidence and high agreement that people’s core values affect climate-related decisions and climate policy support by shaping beliefs and identities (Dietz 2014; Steg 2016; Hayward and Roy 2019). People with altruistic and biospheric values are more likely to act on climate change and support climate policies than those with hedonic or egoistic values (Taylor et al. 2014), because these values are associated with higher awareness and concern about climate change, stronger belief that personal actions can help mitigate climate change, and stronger feelings of responsibility for taking climate action (Dietz 2014; Steg 2016). Research also suggest that egalitarian, individualistic, and hierarchical worldviews (Wildavsky and Dake 1990) have their role, and that successful solutions require policy-makers of all three worldviews to come together and communicate with each other (Chuang et al. 2020).
Core values also influence which costs and benefits are considered (Hahnel et al. 2015; Gölz and Hahnel 2016; Steg 2016). Information provision and appeals are thus more effective when tailored to those values (Bolderdijk et al. 2013; Boomsma and Steg 2014), as implemented by the energy cultures framework (Stephenson et al. 2015; Klaniecki et al. 2020). Awareness, personal norms, and perceived behavioural control predict willingness to change energy-related behaviour above and beyond traditional socio-demographic and economic predictors (Schwartz 1977; Ajzen 1985; Stern 2000), as do perceptions of self-efficacy (Bostrom et al. 2019). However, such motivation for change is often not enough, as actors also need capacity for change and help to overcome individual, institutional and market barriers (Young et al. 2010; Bray et al. 2011; Carrington et al. 2014).
Table 5.4 describes common obstacles to demand-side energy behaviour change, from loss aversion to present bias (for more detail see Chapter 5 Supplementary Material I). Choice architecture refers to interventions (‘nudges’) that shape the choice context and how choices are presented, with seemingly-irrelevant details (e.g., option order or labels) often more important than option price (Thaler and Sunstein 2009). There is high evidence and high agreement that choice architecture nudges shape energy decisions by capturing deciders’ attention; engaging their desire to contribute to the social good; facilitating accurate assessment of risks, costs, and benefits; and making complex information more accessible (Yoeli et al. 2017; Zangheri et al. 2019). Climate-friendly choice architecture includes the setting of proper defaults, the salient positioning of green options (in stores and online), forms of framing, and communication of social norms (Johnson et al. 2012). Simplifying access to greener options (and hence lowering effort) can promote ASI changes (Mani et al. 2013). Setting effective ‘green’ defaults may be the most effective policy to mainstream low-carbon energy choices (Sunstein and Reisch 2014), adopted in many contexts (Jachimowicz et al. 2019) and deemed acceptable in many countries (Sunstein et al. 2019). Table 5.3a lists how often different choice-architecture tools were used in many countries over the past 10 years to change ASI behaviours, and how often each tool was used to enhance an economic incentive. These tools have been tested mostly in developed countries. Reduction in energy use (typically electricity consumption) is the most widely studied behaviour (because metering is easily observable). All but one tool was applied to increase this ‘Avoid’ behaviour, with demand-side reductions from 0% to up to 20%, with most values below 3% (see also meta-analyses by Hummel and Maedche (2019); Nisa et al. (2019); van der Linden and Goldberg (2020); Stankuniene et al. (2020); and Khanna et al. (2021). Behavioural, economic, and legal instruments are most effective when applied as an internally consistent ensemble where they can reinforce each other, a concept referred to as ‘policy packaging’ in transport policy research (Givoni 2014). A meta-analysis, combining evidence of psychological and economic studies, demonstrates that feedback, monetary incentives and social comparison operate synergistically and are together more effective than the sum of individual interventions (Khanna et al. 2021). The same meta-analysis also shows that combined with monetary incentives, nudges and choice architecture can reduce global GHG emissions from household energy use by 5–6% (Khanna et al. 2021).
Choice architecture has been depicted as an anti-democratic attempt at manipulating the behaviour of actors without their awareness or approval (Gumbert 2019). Such critiques ignore the fact that there is no neutral way to present energy-use-related decisions, as every presentation format and choice environment influences choice, whether intentionally or not. Educating households and policy makers about the effectiveness of choice architecture and adding these behavioural tools to existing market- and regulation-based tools in a transparent and consultative way can provide desired outcomes with increased effectiveness, while avoiding charges of manipulation or deception. People consent to choice-architecture tools if their use is welfare-enhancing, policymakers are transparent about their goals and processes, public deliberation and participation are encouraged, and the choice architect is trusted (Sunstein et al. 2019).
Table 5.3a | Inventory of behavioural interventions experimentally tested to change energy behaviours.
Note: Papers in this review of behavioural interventions to reduce household energy demand were collected through a systemic literature search up to August 2021. Studies are included in the reported counts if they are (i) experimental, (ii) peer-reviewed or highly cited reports, (iii) the intervention is behavioural, and (iv) the targeted behaviour is household energy demand. 559 papers are included in the review. Each paper was coded for: type of behavioural intervention, country of study, energy demand behaviour targeted, whether the target is an ‘Avoid’, ‘Shift’, or ‘Improve’ behaviour, and whether the intervention includes an economic incentive. Some papers do not report all elements. The energy demand behaviour column provides the count of papers that focus on each behaviour type (in parentheses after the behaviour). The citations that follow are not exhaustive but exemplify papers in the category, selected for impact, range, and recency. The asterisk (*) indicates references that are meta-analyses or systematic reviews. Papers within meta-analyses and systematic reviews that meet the inclusion criteria are counted individually in the total counts. The full reference list is available athttps://osf.io/9463u/.
Table 5.3b | Summary of effects of behavioural interventions in Table 5. 3a.
Behavioural tool | Results (expressed in household energy savings, unless otherwise stated) | Results summary |
Set proper default | Meta-analyses find a medium to strong effect of defaults on environmental behaviour. Jachimowicz et al. (2019) report a strong average effect of defaults on environmental behaviour (Cohen’s d = 0.75, confidence interval 0.39–1.12), though not as high as for consumer decisions. They find that defaults, across domains, are more effective when they reflect an endorsement (recommendation by a trusted source) or endowment (reflecting the status quo). Nisa et al. (2019) * report a medium average effect size (Cohen’s d = 0.35; range 0.04–0.55). |
|
Reach out during transitions | The few interventions that focus on transitions and measure behaviour change (rather than energy savings) report mixed, moderate effect sizes. People were unwilling to change their behaviour if they were satisfied with current options (Mahapatra and Gustavsson 2008). Iweka et al. (2019) find that effective messages can prompt habit disruption. |
|
Timely feedback and reminders | The average effects of meta-analyses of feedback interventions on household energy use reductions range from 1.8% to 7.7%, with large variations (Delmas et al. 2013; Buckley 2019; Nisa et al. 2019; Buckley 2020; Ahir and Chakraborty 2021; Khanna et al. 2021). The same is true for two literature reviews (Abrahamse et al. 2005; Bergquist et al. 2019). Most studies find a 4–10% average reduction during the intervention; some studies find a non-significant result (Dünnhoff and Duscha 2008) or a negative reduction (Winett et al. 1978). Real-time feedback is most effective, followed by personalised feedback (Buckley 2019; Buckley 2020). A review by Darby et al. (2006) finds direct feedback (from the meter or display monitor) is more effective than indirect feedback (via billing) (5–15% savings vs 0–10% savings). Feedback effects (Cohen’s d = 0.241) are increased when combined with a monetary incentive (Cohen’s d = 0.96) and with a social comparison and a monetary incentive (Cohen’s d = 0.714) (Khanna et al. 2021). Sanguinetti et al. (2020) find that onboard feedback results in a 6.6% improvement in the fuel economy of cars (Cohen’s d: 0.07, [range 0.05–0.08]). |
|
Timely feedback and reminders | The effectiveness of feedback from in home displays is highly studied. Two reviews find them to have result in a 2–14% energy saving (Ehrhardt-Martinez and Donnelly 2010; Faruqui et al. 2010). A meta-analysis by McKerracher and Torriti (2013) finds a smaller range of results, with 3–5% energy savings. |
|
Make information intuitive and easy to access | Meta-analyses of information interventions on household energy use find average energy savings between 1.8–7.4% and Cohen’s d effect sizes between 0.05 and 0.30 (Delmas et al. 2013; Buckley 2019; Nisa et al. 2019);* Buckley 2020; Nemati and Penn 2020; Ahir and Chakraborty 2021; Khanna et al. 2021). Study quality affects the measured effect – small sample sizes, shorter measurement windows, and self-selection are correlated with larger effects (Nisa et al. 2019; Nemati and Penn 2020). RCTs have a smaller effect size, 5.2% savings (95% confidence interval [range 0.5% –9.5%]) (Nemati and Penn 2020). Information combined with comparative feedback is more effective than information alone (d = .34 vs. 30 (Khanna et al. 2021); 8.5% vs 7.4% (Delmas et al. 2013). Monetary incentives make information interventions more effective (Khanna et al. 2021). Energy efficiency labeling has a heterogenous effect on investment in energy efficiency (Abrahamse et al. 2005; Andor and Fels 2018). Efficiency labels on houses lead to higher price mark ups (Jensen et al. 2016) and house prices (Brounen and Kok 2011). Energy star labels lead to significantly higher willingness to pay for refrigerators (Houde et al. 2013), but energy and water conservation varies by appliance from 0–23% (Kurz et al. 2005). A meta-analysis of interventions to increase alternative fuel vehicle adoption find a small effect (d = .20–.28) (Pettifor et al. 2017). |
|
Make behaviour observable and provide recognition | Making behaviour observable and providing recognition lead to 6–7% energy savings (Winett et al. 1978; Handgraaf et al. 2013; Nemati and Penn 2020) and a large effects size (Cohen’s d = 0.79-1.06); (Nisa et al. 2019 *). Community-wide interventions result in 1–27% energy savings (Iweka et al. 2019). Neighbourhood social influence has a small (d = .28) effect on alternative fuel vehicle adoption (Pettifor et al. 2017). |
|
Communicate a norm | The effect of social norm information on household energy savings ranges from 1.7–11.5% (Delmas et al. 2013; Buckley 2020) and Cohen’s d from 0.08–0.32, (Abrahamse and Steg 2013; Bergquist et al. 2019; Khanna et al. 2021); (Nisa et al. 2019)* with similar effects on choice of mode of transportation. Pettifor et al. (2017) report a small effect (d = .20–.28) on selecting a more energy efficient car. The OPOWER study (Allcott 2011), prototypical for the impact of social norms on household energy consumption, finds 2% reduction in long-term energy use and 11–20% energy reduction in the short run (Allcott 2011; Ayres et al. 2013; Costa and Kahn 2013; Allcott and Rogers 2014). Impact decays over time (Allcott and Rogers 2012). Norm interventions are less effective for low energy users (Schultz et al. 2007; Andor et al. 2020). Moral licensing and negative spillover can reduce the overall positive feedback of normative feedback (Tiefenbeck et al. 2013). Interventions are more effective when the norm is implicitly inducted, in individual countries, and when people care about the norm (Nolan et al. 2008; Bergquist et al. 2019; Khanna et al. 2021). Descriptive norm interventions (social comparisons) are more effective when communicated online,by email or through in-home displays compared to billing letters (Andor and Fels 2018), when the reference group is more specific (Shen et al. 2015). Dolan and Metcalfe (2013) find conservation increased from 4% to 11% when energy savings tips are added. |
|
Reframe consequences in terms people care about | A meta-analysis by Khanna et al. ( 2021) finds a small and variable effect of motivational interventions that reframe consequences (Cohen’s d = [0–0.423]). Effects are larger when reframing is combined with monetary incentives and feedback (d = .96). Darby et al. (2006) report 10–20% savings for US pay-as-you-go systems. Providing lifecycle cost information increases likelihood of purchasing eco-innovative products (Kaenzig and Wüstenhagen 2010). Long term (10-year) operating cost information leads to higher willingness to pay for energy efficiency compared to short-term (1-year) cost information (Heinzle and Wüstenhagen 2012). Monetary information increases the success of energy reduction interventions (Newell and Siikamäki 2014; Andor and Fels 2018). Reframing interventions are more effective when combined with feedback (d = .24–.96) and with social comparisons and feedback (d = .42) (Khanna et al. 2021). |
|
Obtain a commitment | Commitment and goal interventions result in significant energy reduction in half of studies (Abrahamse et al. 2005; Andor and Fels 2018; Nisa et al. 2019 *). Nisa et al. (2019) report a moderate average effect (Cohen’s d = 0.34, [0.11–0.66]). When results are significant, the energy savings are around 10% (Andor and Fels 2018). Self-set goals perform better than assigned goals (van Houwelingen and van Raaij 1989; McCalley and Midden 2002; Andor and Fels 2018) and reasonable goals perform better than unreasonably high or low goals (van Houwelingen and van Raaij 1989; Abrahamse et al. 2007; Harding and Hsiaw 2014). Interventions are more effective when the commitment is public (Pallak and Cummings 1976) and when combined with information and rewards (Slavin et al. 1981; Völlink and Meertens 1999). |
|


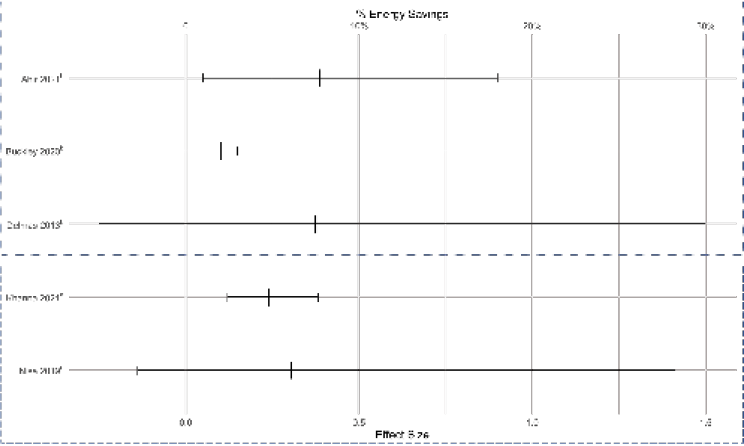
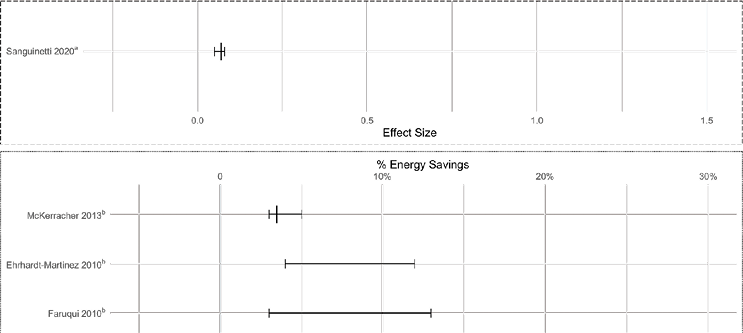
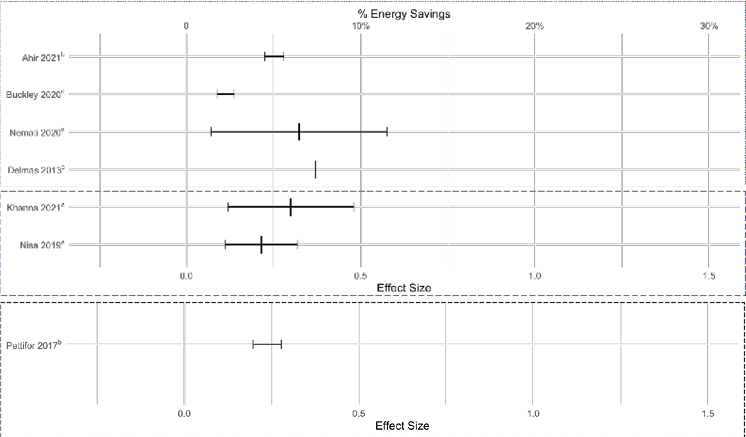
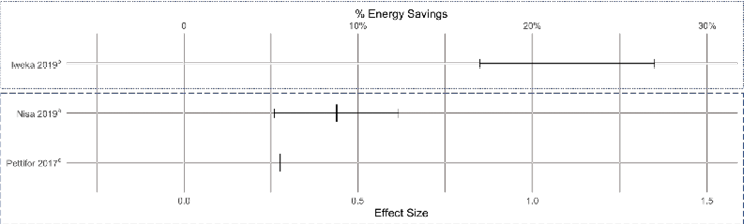
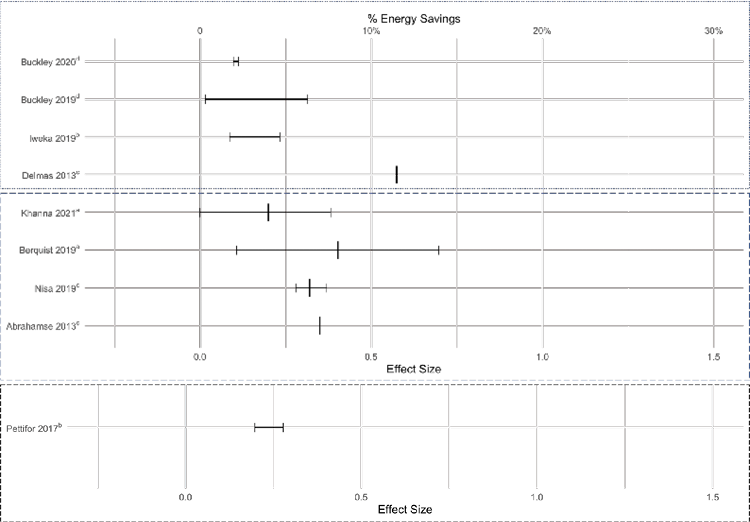

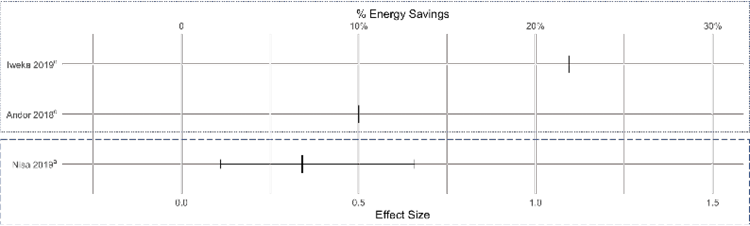
Note: The second column describes the effects of each of the eight behavioural tools. The third column plots the results of meta-analyses and reviews that focus on each tool. Effects are reported as described in the referenced paper, either as percentage of energy saved (dotted box) or by the effect size, measured as Cohen’s d (dashed box).
*Two responses to Nisa et al. (2019) challenge their conclusion that behavioural interventions have a small impact on household energy use (Stern 2020; van der Linden and Goldberg, 2020). We report the raw data collected and used in Nisa et al. (2019). Our data summary supports the arguments by Stern (2020) and van der Linden and Goldberg (2020) that interventions should be evaluated in combination, as well as individually, and that the results are highly sensitive to the chosen estimator.
aRange reported as 95% confidence interval of results used in the meta-analysis or review.
bRange reported as all results included in the meta-analysis or review.
cNo range reported.
dRange indicates the reported results within a meta-analysis; this applies when multiple intervention types in a meta-analysis are classified as a single behavioural tool.
5.4.2 Socio-cultural Drivers of Climate Mitigation
Collective behaviours and social organisation are part of everyday life, and feeling part of active collective action renders mitigation measures efficient and pervasive (Climact 2018). Social and cultural processes play an important role in shaping what actions people take on climate mitigation, interacting with individual, structural, institutional and economic drivers (Barr and Prillwitz 2014). Just like infrastructure, social and cultural processes can ‘lock in’ societies to carbon-intensive patterns of service delivery. They also offer potential levers to change normative ideas and social practices in order to achieve extensive emissions cuts ( high confidence) (Table 5.4).
In terms of cultural processes, we can distinguish two levels of analysis: specific meanings associated with particular technologies or practices, and general narratives about climate change mitigation. Specific meanings (e.g., comfort, status, identity and agency) are associated with many technologies and everyday social practices that deliver energy services, from driving a car to using a cookstove ( high evidence, high agreement ) (Section 5.5). Meanings are symbolic and influence the willingness of individuals to use existing technologies or shift to new ones (Wilhite and Ling 1995; Wilhite 2009; Sorrell 2015). Symbolic motives are more important predictors of technology adoption than instrumental motives (Steg 2005; Noppers et al. 2014; Noppers et al. 2015; Noppers et al. 2016) (see case study on app cabs in Kolkata, India (Box 5.8)). If an individual’s pro-environmental behaviour is associated with personal meaning than it also increases subjective well-being (Zawadzki et al. 2020). Status consciousness is highly relevant in GHG emission-intensive consumption choices (cars, houses). However, inversely framing energy-saving behaviour as high status is a promising strategy for emission reduction (Ramakrishnan and Creutzig 2021).
At a broader level, narratives about climate mitigation circulate within and across societies, as recognised in SR1.5, and are broader than the meanings associated with specific technologies ( high evidence, high agreement ). Narratives enable people to imagine and make sense of the future through processes of interpretation, understanding, communication and social interaction (Smith et al. 2017). Stories about climate change are relevant for mitigation in numerous ways. They can be utopian or dystopian (e.g., The great derangement by Amitav Ghosh) (Ghosh 2016), for example presenting apocalyptic stories and imagery to capture people’s attention and evoke emotional and behavioural response (O’Neill and Smith 2014). Reading climate stories has been shown to cause short-term influences on attitudes towards climate change, increasing the belief that climate change is human caused and increasing its issue priority (Schneider-Mayerson et al. 2020). Climate narratives can also be used to justify scepticism of science, drawing together coalitions of diverse actors into social movements that aim to prevent climate action (Lejano and Nero 2020). Narratives are also used in integrated assessment and energy system models that construct climate stabilisation scenarios, for example in the choice of parameters, their interpretation and model structure (Ellenbeck and Lilliestam 2019). One important narrative choice of many models involves framing climate change as market failure (which leads to the result that carbon pricing is required). While such a choice can be justified, other model framings can be equally justified (Ellenbeck and Lilliestam 2019).
Power and agency shape which climate narratives are told and how prevalent they are (O’Neill and Smith 2014; Schneider-Mayerson et al. 2020). For example, narratives have been used by indigenous communities to imagine climate futures divergent from top-down, government-led narratives (Streeby 2018). The uptake of new climate narratives is influenced by political beliefs and trust. Policymakers can enable emissions reduction by employing narratives that have broad societal appeal, encourage behavioural change and complement regulatory and fiscal measures (Terzi 2020). Justice narratives may not have universal appeal: in a UK study, justice narratives polarised individuals along ideological lines, with lower support amongst individuals with right-wing beliefs; by contrast, narratives centred on saving energy, avoiding waste and patriotic values were more widely supported across society (Whitmarsh and Corner 2017). More research is needed to assess if these findings are prevalent in diverse socio-cultural contexts, as well as the role played by social media platforms to influence emerging narratives of climate change (Pearce et al. 2019).
Trust in organisations is a key predictor of the take-up of novel energy services (Lutzenhiser 1993), particularly when financial incentives are high (Stern et al. 1985; Joskow 1995). Research has shown that if there is low public trust in utility companies, service delivery by community-based non-profit organisations in the US (Stern et al. 1985) or public/private partnerships in Mexico (Friedmann and Sheinbaum 1998), offer more effective solutions, yet only if public trust is higher in these types of organisations. UK research shows that acceptance of shifts to less resource-intensive service provision (e.g., more resource-efficient products, extending product lifetimes, community schemes for sharing products) varies depending on factors including trust in suppliers and manufacturers, affordability, quality and hygiene of shared products, and fair allocation of responsibilities (Cherry et al. 2018). Trust in other people plays an important role in the sharing economy (Li and Wang 2020), for example predicting shifts in transport mode, specifically car sharing involving rides with strangers (Acheampong and Siiba 2019) (Section 5.3.4.2).
Action on climate mitigation is influenced by our perception of what other people commonly do, think or expect, known as social norms ( high evidence, high agreement ) (Cialdini 2006) (Table 5.3), even though people often do not acknowledge this (Nolan et al. 2008; Noppers et al. 2014). Changing social norms can encourage societal transformation and social tipping points to address climate mitigation (Nyborg et al. 2016; Otto et al. 2020). Providing feedback to people about how their own actions compare to others’ can encourage mitigation (Delmas et al. 2013), although the overall effect size is not strong (Abrahamse and Steg 2013). Trending norms are behaviours that are becoming more popular, even if currently practised by a minority. Communicating messages that the number of people engaging in a mitigation behaviour (e.g., giving a financial donation to an environmental conservation organisation) is increasing – a simple low-cost policy intervention – can encourage shifts to the targeted behaviour, even if the effect size is relatively small (Mortensen et al. 2019).
Socially comparative feedback seems to be more effective when people strongly identify with the reference group (De Dominicis et al. 2019). Descriptive norms (perceptions of behaviours common in others) are more strongly related to mitigation actions when injunctive norms (perceptions of whether certain behaviours are commonly approved or disapproved) are also strong, when people are not strongly personally involved with mitigation topics (Göckeritz et al. 2010), when people are currently acting inconsistently with their preferences, when norm-based interventions are supported by other interventions and when the context supports norm-congruent actions (Miller and Prentice 2016). A descriptive norm prime (‘most other people try to reduce energy consumption’) together with injunctive norm feedback (‘you are very good at saving energy’) is a very effective combination to motivate further energy savings (Bonan et al. 2020). Second-order beliefs (perceptions of what others in the community believe) are particularly important for leveraging descriptive norms (Jachimowicz et al. 2018).
Behavioural contagion, which describes how ideas and behaviours often spread like infectious diseases, is a major contributor to the climate crisis (Sunstein 2019). But harnessing contagion can also mitigate warming. Carbon-heavy consumption patterns have become the norm only in part because we’re not charged for environmental damage we cause (Pigou 1920). The deeper source of these patterns has been peer influence (Frank 1999), because what we do influences others. A rooftop solar installation early in the adoption cycle, for example, spawns a copycat installation in the same neighbourhood within four months, on average. With such installations thus doubling every four months, a single new order results in 32 additional installations in just two years. And contagion doesn’t stop there, since each family also influences friends and relatives in distant locations.
Harnessing contagion can also underwrite the investment necessary for climate stability. If taxed more heavily, top earners would spend less, shifting the frames of reference that shape spending of those just below, and so on – each step simultaneously reducing emissions and liberating resources for additional green investment (Frank 2020). Many resist, believing that higher taxes would make it harder to buy life’s special extras. But that belief is a cognitive illusion (Frank 2020). Acquiring special things, which are inherently in short supply, requires outbidding others who also want them. When top tax rates rise in tandem, relative bidding power is completely unchanged, so the same penthouse apartments would end up in the same hands as before. More generally, behavioural contagion is important to leverage all relevant social tipping points for stabilising Earth’s climate (Otto et al. 2020).
For new climate policies and mitigation technologies to be rapidly and extensively implemented, they must be socially acceptable to those who are directly impacted by those policies and technologies (medium evidence, high agreement ). Policies that run counter to social norms or cultural meanings are less likely to be effective in reducing emissions (Demski et al. 2015; Perlaviciute et al. 2018; Roy et al. 2018b). More just and acceptable implementation of renewable energy technologies requires taking account of the cultural meanings, emotional attachments and identities linked to particular landscapes and places where those technologies are proposed (Devine-Wright 2009) and enabling fairness in how decisions are taken and costs and benefits distributed (Wolsink 2007). This is important for achieving the goal of SDG 7 (increased use of renewable energy resources) in developing countries while achieving energy justice (Calzadilla and Mauger 2017). ‘Top-down’ imposition of climate policies by governments can translate into local opposition when perceived to be unjust and lacking transparency ( high evidence, high agreement ). Policymakers can build trust and increase the legitimacy of new policies by implementing early and extensive public and stakeholder participation, avoiding ‘Nimby’ (Not In My Back Yard) assumptions about objectors and adopting ‘Just Transition’ principles (Owens 2000; Wolsink 2007; Wüstenhagen et al. 2007; Dietz and Stern 2008; Devine-Wright 2011; Heffron and McCauley 2018). Participatory mechanisms that enable deliberation by a representative sample of the public (Climate Assembly UK 2020) can inform policymaking and increase the legitimacy of new and difficult policy actions (Dryzek et al. 2019).
Collective action by civil society groups and social movements can work to enable or constrain climate mitigation. Civil society groups can advocate policy change, provide policy research and open up opportunities for new political reforms ( high evidence, high agreement ) as recognised in previous IPCC reports (IPCC 2007). Grassroots environmental initiatives, including community energy groups, are collective responses to, and critiques of, normative ways that everyday material needs (e.g., food, energy, making) are produced, supplied and circulated (Schlosberg and Coles 2016). Such initiatives can reconcile lower carbon footprints with higher life satisfaction and higher incomes (Vita et al. 2020). Local initiatives such as Transition Towns and community energy projects can lead to improvements in energy efficiency, ensure a decent standard of living and increase renewable energy uptake, while building on existing social trust, and, in turn, building social trust and initiating engagement, capacity building, and social capital formation (Hicks and Ison 2018). Another example are grassroot initiatives that aim to reduce food loss and waste, even as overall evidence on their effectiveness remains limited (Mariam et al. 2020). However, community energy initiatives are not always inclusive and require policy support for widespread implementation across all socio-economic groups (Aiken et al. 2017). In addition, more evidence is required of the impacts of community energy initiatives (Creamer et al. 2018; Bardsley et al. 2019).
Civil society social movements are a primary driver of social and institutional change ( high evidence, high agreement ) and can be differently positioned as, on the one hand, ‘insider’ social movements (e.g., World Wildlife Fund) that seek to influence existing state institutions through lobbying, advice and research and, on the other hand, ‘outsider’ social movements (e.g., Rising Tide, Extinction Rebellion) that advocate radical reform through protests and demonstrations (Newell 2005; Caniglia et al. 2015). Civil society social movements frame grievances that resonate with society, mobilise resources to coordinate and sustain mass collective action, and operate within – and seek to influence – external conditions that enable or constrain political change (Caniglia et al. 2015). When successful, social movements open up windows of opportunity (so called ‘Overton Windows’) to unlock structural change ( high evidence, high agreement ) (Szałek 2013; Piggot 2018).
Climate social movements advocate new narratives or framings for climate mitigation (e.g., ‘climate emergency’) (della Porta and Parks 2014); criticise positive meanings associated with high emission technologies or practices (see case studies on diet and solar PV, (Boxes 5.5 and 5.7)); show disapproval for high-emission behaviours (e.g., through ‘flight shaming’); model behaviour change (e.g., shifting to veganism or public transport – see case study on mobility in Kolkata, India (Box 5.8)); demonstrate against extraction and use of fossil fuels (Cheon and Urpelainen 2018); and aim to increase a sense of agency amongst certain social groups (e.g., young people or indigenous communities) that structural change is possible. Climate strikes have become internationally prevalent, for example the September 2019 strikes involved participants in more than 180 countries (Rosane 2019; Fisher and Nasrin 2020; Martiskainen et al. 2020). Enabled by digitalisation, these have given voice to youth on climate (Lee et al. 2020) and created a new cohort of active citizens engaged in climate demonstrations (Fisher 2019). Research on bystanders shows that marches increase positive beliefs about marchers and collective efficacy (Swim et al. 2019).
Countermovement coalitions work to oppose climate mitigation ( high confidence). Examples include efforts in the US to oppose mandatory limits on carbon emissions supported by organisations from the coal and electrical utility sectors (Brulle 2019). There is evidence that US opposition to climate action by carbon-connected industries is broad-based, highly organised, and matched with extensive lobbying (Cory et al., 2021). Social movements can also work to prevent policy changes, for example in France the Gilet Jaunes objected to increases in fuel costs on the grounds that they unfairly distributed the costs and benefits of price rises across social groups, for example between urban, peri-urban and rural areas (Copland 2019).
Religion could play an important role in enabling collective action on climate mitigation by providing cultural interpretations of change and institutional responses that provide resources and infrastructure to sustain collective actions (Roy et al. 2012; Haluza-DeLay 2014; Caniglia et al. 2015; Hulme 2015). Religion can be an important cultural resource towards sustainability at individual, community and institutional levels (Ives and Kidwell 2019), providing leverage points for inner transformation towards sustainability (Woiwode et al. 2021). Normative interpretations of climate change for and from religious communities are found in nearly every geography, and often observe popular movements for climate action drawing on religious symbols or metaphors (Jenkins et al. 2018). This suggests the value for policymakers of involving religious constituencies as significant civil society organisations in devising and delivering climate responses.
Box 5.7 | Solar PV and the Agency of Consumers
As an innovative technology, solar PV was strongly taken up by consumers (Nemet 2019). Several key factors explain its success. First, modular design made it applicable to different scales of deployment in different geographical contexts (e.g., large-scale grid-connected projects and smaller-scale off-grid projects) and allowed its application by companies taking advantage of emerging markets (Shum and Watanabe 2009). Second, culturally, solar PV symbolised an environmentally progressive technology that was valued by users (Morris and Jungjohann 2016). Large-scale adoption led to policy change (i.e., the introduction of feed-in tariffs that guaranteed a financial return) that in turn enabled improvements to the technology by companies. Over time, this has driven large-scale reductions in cost and increase in deployment worldwide. The relative importance of drivers varied across contexts. In Japan, state subsidies were lower yet did not hinder take-up because consumer behaviour was motivated by non-cost symbolic aspects. In Germany, policy change arose from social movements that campaigned for environmental conservation and opposed nuclear power, making solar PV policies politically acceptable. In summary, the seven-decade evolution of solar PV shows an evolution in which the agency of consumers has consistently played a key role in multiple countries, such that deriving 30–50% of global electricity supply from solar is now a realistic possibility (Creutzig et al. 2017). See more in Chapter 5 Supplementary Material I, 5.SM.6.1.
5.4.3Business and Corporate Drivers
Businesses and corporate organisations play a key role in the mitigation of global warming, through their own commitments to zero-carbon footprints (Mendiluce 2021), decisions to invest in researching and implementing new energy technologies and energy-efficient measures, and the supply-side interaction with changing consumer preferences and behaviours, such as via marketing. Business models and strategies work both as a barrier to and an accelerator of decarbonisation. Still existing locked-in infrastructures and business models advantages fossil fuel industry over renewable and energy efficient end use industry (Klitkou et al. 2015). The fossil fuel energy generation and delivery system therefore epitomises a barrier to the acceptance and implementation of new and cleaner renewable energy technologies (Kariuki 2018). A good number of corporate agents have attempted to derail climate change mitigation by targeted lobbying and doubt-inducing media strategies (Oreskes and Conway 2011). A number of corporations that are involved in both upstream and downstream supply chains of fossil fuel companies make up the majority of organisations opposed to climate action (Dunlap and McCright 2015; Brulle 2019; Cory et al. 2021). Corporate advertisement and brand-building strategies also attempt to deflect corporate responsibility to individuals, and/or to appropriate climate care sentiments in their own brand building; climate change mitigation is uniquely framed through choice of products and consumption, avoiding the notion of the political collective action sphere (Doyle 2011; Doyle et al. 2019).
Business and corporations are also agents of change towards decarbonisation, as demonstrated in the case of PV and battery electric cars (Teece 2018). Beyond new low-carbon technologies, strong sustainability business models are characterised by identifying nature as the primary stakeholder, strong local anchorage, the creation of diversified income sources, and deliberate limitations on economic growth (Brozovic 2019). However, such business models are difficult to maintain if generally traditional business models, which require short-term accounting, prevail.
Liability of fossil fuel business models and insurance against climate damages are key concerns of corporations and business. Limitations and regulation on GHG emissions will compel reductions in demand for fossil fuel companies’ products (Porter and Kramer 2006). According to a report by the Advisory Scientific Committee of the European Systemic Risk Board, insurance industries are very likely to incur losses due to liability risks (ESRB 2016). The divestment movement adds additional pressure on fossil fuel related investments (Braungardt et al. 2019), even though fossil fuel financing remains resilient (Curran 2020). Companies, businesses and organisations, especially those in the carbon-intensive energy sector, might face liability claims for their contribution to climate change. A late transition to a low-carbon economy would exacerbate the physical costs of climate change on governments, businesses and corporations (ESRB 2016).
Despite the seemingly positive roles that businesses and corporate organisations tend to play towards sustainable transitions, there is a need to highlight the dynamic relationship between sustainable and unsustainable trends (Antal et al. 2020), or example, the production of sport utility vehicles (SUVs) in the automobile market at the same time that car manufacturers are producing electric vehicles. An analysis of the role of consumers as drivers of unsustainability for businesses and corporate organisations is very important here as this trend will offset the sustainability progress being made by these businesses and organisations (Antal et al. 2020).
Professional actors, such as building managers, landlords, energy efficiency advisers, technology installers and car dealers, influence patterns of mobility and energy consumption (Shove 2003) by acting as ‘middle actors’ (Janda and Parag 2013; Parag and Janda 2014) or intermediaries in the provision of building or mobility services (Grandclément et al. 2015; De Rubens et al. 2018). Middle actors can bring about change in several different directions, be it, upstream, downstream or sideways. They can redefine professional ethics around sustainability issues, and, as influencers on the process of diffusion of innovations (Rogers 2003), professionals can enable or obstruct improvements in efficient service provision or shifts towards low-carbon technologies (e.g., air and ground source heat pumps, solar hot water, underfloor heating, programmable thermostats, and mechanical ventilation with heat recovery) and mobility technologies (e.g., electric vehicles).
5.4.4Institutional Drivers
The allocationof political power to incumbent actors and coalitions has contributed to lock-in of particular institutions, stabilising the interests of incumbents through networks that include policymakers, bureaucracies, advocacy groups and knowledge institutions ( high agreement, high evidence). There is high evidence and high agreement that institutions are central in addressing climate change mitigation. Indeed, social provisioning contexts, including equity, democracy, public services and high quality infrastructure, are found to facilitate high levels of need satisfaction at lower energy use, whereas economic growth beyond moderate incomes and dependence on extractive industries inhibit it (Vogel et al. 2021). They shape and interact with technological systems (Unruh 2000; Foxon et al. 2004; Seto et al. 2014) and represent rules, norms and conventions that organise and structure actions (Vatn 2015) and help create new path dependency or strengthen existing path dependency (Mattioli et al. 2020) (see case studies in Boxes 5.5 to 5.8 and Chapter 5 Supplementary Material I). These drive behaviour of actors through formal (e.g., laws, regulations, and standards) or informal (e.g., norms, habits, and customs) processes, and can create constraints on policy options (Breukers and Wolsink 2007 ). For example, the car-dependent transport system is maintained by interlocking elements and institutions, consisting of (i) the automotive industry; (ii) the provision of car infrastructure; (iii) the political economy of urban sprawl; (iv) the provision of public transport; (v) cultures of car consumption (Mattioli et al. 2020). The behaviour of actors, their processes and implications on policy options and decisions are discussed further in Section 5.6.
Box 5.8 | Shifts from Private to Public Transport in an Indian Megacity
In densely populated, fast-growing megacities, policymakers face the difficult challenge of preventing widespread adoption of petrol or diesel fuelled private cars as a mode of transport. The megacity of Kolkata in India provides a useful case study. As many as twelve different modes of public transportation, each with its own system structure, actors and meanings, co-exist and offer means of mobility to its 14 million citizens. Most of the public transport modes are shared mobility options, ranging from sharing between two people in a rickshaw or a few hundred in metro or sub-urban trains. Sharing also happens informally as daily commuters avail shared taxis and neighbours borrow each other’s car or bicycle for urgent or day trips.
Box 5.8
A key role is played by the state government, in collaboration with other stakeholders, to improve the system as whole and formalise certain semi-formal modes of transport. An important policy consideration has been to make Kolkata’s mobility system more efficient (in terms of speed, reliability and avoidance of congestion) and sustainable through strengthening coordination between different mode-based regimes (Ghosh 2019) and more comfortable with air conditioned space in a hot and humid climate (Roy et al. 2018b). Policymakers have introduced multiple technological, behavioural and socio-cultural measures to tackle this challenge. New buses have been purchased by public authorities (Ghosh and Schot 2019). These have been promoted to middle class workers in terms of modernity, efficiency and comfort, and implemented using premium fares. Digitalisation and the sharing economy have encouraged take-up of shared taxi rides (‘app cabs’), being low cost and fast, but also influenced by levels of social trust involved in rides with strangers (Acheampong and Siiba 2019; Ghosh and Schot 2019). Rickshaws have been improved through use of LNG and cycling has been banned from busy roads. These measures contributed positively to halving greenhouse gas emissions per unit of GDP tin one decade within the Kolkata metropolitan area, with potential for further reduction (Colenbrander et al. 2016). However, social movements have opposed some changes due to concerns about social equity, since many of the new policies cater to middle class aspirations and preferences, at the cost of low-income and less privileged communities.
To conclude, urban mobility transitions in Kolkata show interconnected policy, institutional and socio-cultural drivers for socio-technical change. Change has unfolded in complex interactions between multiple actors, sustainability values and megatrends, where direct causalities are hard to identify. However, the prominence of policy actors as change agents is clear as they are changing multiple regimes from within. The state government initiated infrastructural change in public bus systems, coordinated with private and non-governmental actors such as auto-rickshaw operators and app cab owners, who hold crucial agency in offering public transport services in the city. The latter can directly be attributed to the global momentum of mobility-as-a-service platforms, at the intersection of digitalisation and sharing economy trends. More thoughtful action at a policy level is required to sustain and coordinate the diversity of public transport modes through infrastructure design and reflect on the overall direction of change (Roy et al. 2018b; Schot and Steinmueller 2018). See more in Chapter 5 Supplementary Material I, Section 5.SM.6.3.
5.4.5Technological and Infrastructural Drivers
Technologies and infrastructures shape social practices and their design matters for effective mitigation measures ( high evidence, high agreement ). There are systemic interconnections between infrastructures and practices (Cass et al. 2018; Haberl et al. 2021), and their intersection explains their relevance (Thacker et al. 2019). The design of a new electricity system to meet new emerging demand based on intermittent renewable sources can lead to a change in consumption habits and the adaption of lifestyles compliant with more power supply interruption (Maïzi et al. 2017; Maïzi and Mazauric 2019). The quality of the service delivery impacts directly the potential user uptake of low-carbon technologies among rural households. In the state of Himachal Pradesh in India, a shift from LPG to electricity among rural households, with induction stoves, has been successful due to the availability of stable and continuous electricity, which has been difficult to achieve in any other Indian state (Banerjee et al. 2016). In contrast, in South Africa, people who were using electricity earlier are now adopting LPG to diversify the energy source for cooking due to high electricity tariffs and frequent blackouts (Kimemia and Annegarn 2016) (Box 5.5 and Chapter 5 Supplementary Material I).
From a welfare point of view, infrastructure investments are not constrained by revealed or stated preferences ( high evidence, high agreement ). Preferences change with social and physical environment, and infrastructure interventions can be justified by objective measures, such as public health and climate change mitigation, not only given preferences ( high agreement , high evidence). Specifically, there is a case for more investment in low-carbon transport infrastructure than assumed in environmental economics as it induces low-carbon preferences (Creutzig et al. 2016a; Mattauch et al. 2016; Mattauch et al. 2018). Changes in infrastructure provision for active travel may contribute to uptake of more walking and cycling (Frank et al. 2019). These effects contribute to higher uptake of low-carbon travel options, albeit the magnitude of effects depends on design choices and context (Goodman et al. 2013; Goodman et al. 2014; Song et al. 2017; Javaid et al. 2020; Abraham et al. 2021). Infrastructure is thus not only required to make low-carbon travel possible but can also be a pre-condition for the formation of low-carbon mobility preferences (see case study in Box 5.8).
The dynamic interaction of habits and infrastructures also predict CO2-intensive choices. When people move from a city with good public transport to a car-dependent city, they are more likely to own fewer vehicles due to learned preferences for lower levels of car ownership (Weinberger and Goetzke 2010). When individuals moving to a new city with extensive public transport were given targeted material about public transport options, the modal share of public transport increased significantly (Bamberg et al. 2003). Similarly, an exogenous change to route choice in public transport makes commuters change their habitual routes (Larcom et al. 2017).
Table 5.4 | Main features, insights, and policyimplications of five drivers of decision and action. Entries in each column are independent lists, not intended to line up with each other.
Driver | How does driver contribute to status quo bias? | What needs to change? | Driver’s policy implications | Examples |
Behavioural | –Habits and routines formed under different circumstances do not get updated –Present bias penalises upfront costs and discourages energy efficiency investments –Loss aversion magnifies the costs of change –When climate change is seen as distant, it is not feared –Nuclear power and accident potential score high on psychological dread | –New goals (sustainable lifestyle) –New capabilities (online real-time communication) –New resources (increased education) –Use of full range of incentives and mechanisms to change demand-side behaviour | –Policies need to be context specific and coordinate economic, legal, social, and infrastructural tools and nudges –Relate climate action to salient local risks and issues | –India’s new LPG scale up policy uses insights about multiple behavioural drivers of adoption and use –Rooftop solar adoption expanded in Germany, when feed-in tariffs removed risk from upfront-cost recovery –Nuclear power policies in Germany post Fukushima affected by emotional factors |
Socio-cultural | –Cultural norms (e.g., status, comfort, convenience) support existing behaviour –Lack of social trust reduces willingness to shift behaviour (e.g., adopt car sharing) –Fear of social disapproval decreases willingness to adopt new behaviours –Lack of opportunities to participate in policy create reactance against ‘top-down’ imposition –Unclear or dystopian narratives of climate response reduce willingness to change and to accept new policies and technologies | –Create positive meanings and norms around low-emission service delivery (e.g., mass transit) –Community initiatives to build social trust and engagement, capacity building, and social capital formation –Climate movements that call out the insufficient, highly problematic state of delayed climate action –Public participation in policymaking and technology implementation that increases trust, builds capacity and increases social acceptance –Positive narratives about possible futures that avoid emissions (e.g., emphasis upon health and slow/active travel) | –Embed policies in supportive social norms – Support collective action on climate mitigation to create social trust and inclusion –Involve arts and humanities to create narratives for policy process | –Communicate descriptive norms to electricity end users –Community energy initiative –REScoop –Fridays For Future |
Business and corporate | –Lock-in mechanisms that make incumbent firms reluctant to change: core capabilities, sunk investments in staff and factories, stranded assets | –New companies (like car-sharing companies, renewable energy start-ups) that pioneer new business models or energy service provisions | –Influence consumer behaviour via product innovation –Provide capital for clean energy innovation | –Electrification of transport opens up new markets for more than a hundred million new vehicles |
Institutional | –Lock-in mechanisms related to power struggles, lobbying, political economy | –New policy instruments, policy discussions, policy platforms, implementation agencies, including capacity | –Feed-in tariffs and other regulations that turn energy consumers into prosumers | –Mobility case study, India’s LPG policy sequence |
Infrastructural | –Various lock-in mechanisms such as sunk investments, capabilities, embedding in routines/lifestyles | –Many emerging technologies, which are initially often more expensive, but may benefit from learning curves and scale economies that drive costs down | – Systemic governance to avoid rebound effects | –Urban walking and bike paths – Stable and continuous electricity supply fostering induction stoves |
5.5An Integrative View on Transitioning
5.5.1Demand-side Transitions as Multi-dimensional Processes
Several integrative frameworks including social practice theory (Røpke 2009; Shove and Walker 2014), the energy cultures framework (Stephenson et al. 2015; Jürisoo et al. 2019) and socio-technical transitions theory (McMeekin and Southerton 2012; Geels et al. 2017) conceptualise demand-side transitions as multi-dimensional and interacting processes ( high evidence, high agreement ). Social practice theory emphasises interactions between artefacts, competences, and cultural meanings (Røpke 2009; Shove and Walker 2014). The energy cultures framework highlights feedbacks between materials, norms, and behavioural practices (Stephenson et al. 2015; Jürisoo et al. 2019). Socio-technical transitions theory addresses interactions between technologies, user practices, cultural meanings, business, infrastructures, and public policies (McMeekin and Southerton 2012; Geels et al. 2017) and can thus accommodate the five drivers of change and stability discussed in Section 5.4.
Section 5.4 shows with high evidence and high agreement that the relative influence of different drivers varies between demand-side solutions. The deployment of ‘Improve’ options like LEDs and clean cookstoves mostly involves technological change, adoption by consumers who integrate new technologies in their daily life practices (Smith et al. 1993; Sanderson and Simons 2014; Franceschini and Alkemade 2016), and some policy change. Changes in meanings are less pertinent for those ‘Improve’ options that are primarily about technological substitution. Other ‘Improve’ options, like clean cookstoves, involve both technological substitution and changes in cultural meanings and traditions.
Deployment of ‘Shift’ options like enhanced public transport involves substantial behavioural change and transitions to new or expanded provisioning systems, which may include new technologies (buses, trams), infrastructures (light rail, dedicated bus lanes), institutions (operational licences, performance contracts), financial arrangements, and new organisations (with particular responsibilities and oversight) ( high evidence, high agreement ) (Deng and Nelson 2011; Turnheim and Geels 2019). Changes in cultural meanings can facilitate ‘Shift’ options. Shifts towards low-meat diets, for instance, are motivated by costs and by beliefs about the undesirability of meat that relate more to issues like health, nutrition and animal welfare than climate change (De Boer et al. 2014; Mylan 2018).
‘Avoid’ options that reduce service levels (e.g., sufficiency or downshifting) imply very substantial behavioural and cultural changes that may not resonate with mainstream consumers (Dubois et al. 2019). Other ‘Avoid’ options like teleworking also require changes in cultural meanings and beliefs (about the importance of supervision, coaching, social contacts, or office politics), as well as changes in behaviour, institutions, business, and technology (including good internet connections and office space at home). Because these interconnected changes were not widespread, teleworking remained stuck in small niches and did not diffuse widely before the COVID-19 crisis (Hynes 2014; Hynes 2016; Belzunegui-Eraso and Erro-Garcés 2020; Stiles 2020). As preferences change, new infrastructures and social settings can also elicit new desires associated with emerging low-energy demand service provisioning systems (Section 5.4.5).
Demand-side transitions involve interactions between radical social or technical innovations (such as the Avoid-Shift-Improve options discussed in Section 5.3) and existing socio-technical systems, energy cultures, and social practices ( high evidence, high agreement ) (Stephenson et al. 2015; Geels et al. 2017). Radical innovations such as teleworking, plant-based burgers, car sharing, vegetarianism, or electric vehicles initially emerge in small, peripheral niches (Kemp et al. 1998; Schot and Geels 2008), constituted by R&D projects, technological demonstration projects (Borghei and Magnusson 2016; Rosenbloom et al. 2018b), local community initiatives or grassroots projects by environmental activists (Hargreaves et al. 2013a; Hossain 2016). Such niches offer protection from mainstream selection pressures and nurture the development of radical innovations (Smith and Raven 2012). Many low-carbon niche innovations, such as those described in Section 5.3, face uphill struggles against existing socio-technical systems, energy cultures, and social practices that are stabilised by multiple lock-in mechanisms ( high evidence, high agreement ) (Klitkou et al. 2015; Seto et al. 2016; Clausen et al. 2017; Ivanova et al. 2018). Demand-side transitions therefore do not happen easily and involve interacting processes and struggles on the behavioural, socio-cultural, institutional, business and technological dimensions (Nikas et al. 2020) (Section 5.4).
5.5.2 Phases in Transitions
Transitions often take several decades, unfolding through several phases. Although there is variability across innovations, sectors, and countries, the transitions literature distinguishes four phases, characterised by generic core processes and challenges: (i) emergence, (ii) early adaptation, (i) diffusion, (iv) stabilisation ( high confidence) (Rotmans et al. 2001; Markard et al. 2012; Geels et al. 2017) (Cross-Chapter Box 12 in Chapter 16). These four phases do not imply that transitions are linear, teleological processes, because set-backs or reversals may occur as a result of learning processes, conflicts, or changing coalitions (very high confidence) (Geels and Raven 2006; Messner 2015; Davidescu et al. 2018). There is also no guarantee that technological, social, or business model innovations progress beyond the first phase.
In the first phase, radical innovations emerge in peripheral niches, where researchers, inventors, social movement organisations or community activists dedicate time and effort to their development ( high confidence) (Kemp et al. 1998; Schot and Geels 2008). Radical social, technical and business model innovations are initially characterised by many uncertainties about technical performance, consumer interest, institutions and cultural meanings. Learning processes are therefore essential and can be stimulated through R&D, demonstration projects, local community initiatives or grassroots projects (Borghei and Magnusson 2016; Hossain 2016; Rosenbloom et al. 2018b; van Mierlo and Beers 2020). Typical challenges are fragmentation and high rates of project failure (den Hartog et al. 2018; Dana et al. 2021), limited funding (Auerswald and Branscomb 2003), limited consumer interest, and socio-cultural acceptance problems due to being perceived as strange or unfamiliar (Lounsbury and Glynn 2001).
In the second phase, social or technical innovations are appropriated or purchased by early adopters, which increases visibility and may provide a small but steady flow of financial resources ( high evidence, high agreement ) (Zimmerman and Zeitz 2002; Dewald and Truffer 2011). Learning processes, knowledge sharing and codification activities help stabilise the innovation, leading to best practice guidelines, standards, and formalised knowledge ( high evidence, high agreement ) (Raven et al. 2008; Borghei and Magnusson 2018). User innovation may lead to the articulation of new routines and social practices, often in tandem with the integration of new technologies into people’s daily lives (Nielsen et al. 2016; Schot et al. 2016). Radical innovations remain confined to niches in the second phase because adoption is limited to small, dedicated groups (Schot et al. 2016), innovations are expensive or do not appeal to wider groups, or because complementary infrastructure are missing (Markard and Hoffmann 2016).
In the third phase, radical innovations diffuse into wider communities and mainstream markets. Typical drivers are performance improvements, cost reductions, widespread consumer interest, investments in infrastructure and complementary technologies, institutional support and strong cultural appeal ( high evidence, high agreement ) (Wilson 2012; Markard and Hoffmann 2016; Malone et al. 2017; Raven et al. 2017; Kanger et al. 2019). The latter may be related to wider cultural shifts such as increased public attention to climate change and new framings like ‘climate emergency’ which gained traction before the Covid-19 pandemic (Bouman et al. 2020b). These concerns may not last, however, since public attention typically follows cycles (Downs 1972; Djerf-Pierre 2012).
This phase often involves multiple struggles: economic competition between low-carbon innovations and existing technologies and practices, business struggles between incumbents and new entrants (Hockerts and Wüstenhagen 2010), cultural and framing struggles in public opinion arenas (Kammermann and Dermont 2018; Rosenbloom 2018; Hess 2019a), and political struggles over adjustments in policies and institutions, which shape markets and innovations (Meadowcroft 2011; Roberts and Geels 2019). The lock-in mechanisms of existing practices and systems tend to weaken in the third phase, either because competing innovations erode their economic viability, cultural legitimacy or institutional support (Turnheim and Geels 2012; Roberts 2017; Kuokkanen et al. 2018; Leipprand and Flachsland 2018) or because exogenous shocks and pressures disrupt the status quo (Kungl and Geels 2018; Simpson 2019).
In the fourth phase, the diffusing innovations replace or substantially reconfigure existing practices and systems, which may lead to the downfall or reorientation of incumbent firms (Bergek et al. 2013; McMeekin et al. 2019). The new system becomes institutionalised and anchored in professional standards, technical capabilities, infrastructures, educational programmes, regulations and institutional logics, user habits, and views of normality, which create new lock-ins (Galaskiewicz 1985; Shove and Southerton 2000; Barnes et al. 2018).
‘Avoid’, ‘Shift’ and ‘Improve’ options vary with regard to the four transition phases. Incremental ‘Improve’ options, such as energy-efficient appliances or stand-alone insulation measures, are not transitions but upgrades of existing technologies. They have progressed furthest since they build on existing knowledge and do not require wider changes (Geels et al. 2018). Some radical ‘Improve’ options, which have a different technological knowledge base, are beginning to diffuse, moving from phase two to three in multiple countries. Examples are electric vehicles, light-emitting diodes (LED), or passive house designs (Franceschini and Alkemade 2016; Berkeley et al. 2017). Many ‘Shift’ and ‘Avoid/Reduce’ options like heat pumps, district heating, passive house designs, compact cities, less meat initiatives, flight and car use reduction have low momentum in most countries, and are mostly in the first phase of isolated initiatives and projects (Bergman 2013; Morris et al. 2014; Bows-Larkin 2015; Bush et al. 2016; Kivimaa and Martiskainen 2018; Hoolohan et al. 2018). Structural transitions in Dutch cities, Copenhagen, and more recently Paris, however, demonstrate that transitions towards low-carbon lifestyles, developed around cycling, are possible (Colville-Andersen 2018). Low-carbon demand-side transitions are often still in early phases ( high evidence, high agreement ).
5.5.3Feasible Rate of Change
Transitional change is usually slow in the first and second transition phases, because experimentation, social and technological learning, and stabilisation processes take a long time, often decades, and remain restricted to small niches ( high confidence) (Wilson 2012; Bento 2013; Bento et al. 2018b). Transitional change accelerates in the third phase, as radical innovations diffuse from initial niches into mainstream markets, propelled by the self-reinforcing mechanisms discussed above. The rate of adoption (diffusion) of new practices, processes, artefacts, and behaviours is determined by a wide range of factors at the macro- and micro-scales, which have been identified by several decades of diffusion research in multiple disciplines (Mansfield 1968; Martino et al.1978; Davis 1979; Mahajan et al. 1990; Ausubel 1991; Grubler 1991; Feder and Umali 1993; Bayus 1994; Comin and Hobijn 2003; Rogers 2003; Van den Bulte and Stremersch 2004; Meade and Islam 2006; Peres et al. 2010).
Diffusion rates are determined by two broad categories of variables: those intrinsic to the technology, product or practice under consideration (typically performance, costs, benefits), and those intrinsic to the adoption environment (e.g., socio-economic and market characteristics).
Despite differences, the literature offers three robust conclusions on acceleration ( high evidence, high agreement ): First, size matters. Acceleration of transitions is more difficult for social, economic, or technological systems of larger size (in terms of number of users, financial investments, infrastructure, powerful industries) (Wilson 2009; Wilson 2012). Size also matters at the level of the systems component involved in a transition. Components with smaller unit-scale (‘granular’ and thus relatively cheap), such as light bulbs or household appliances, turn over much faster (often within a decade) than large-scale, capital-intensive lumpy technologies and infrastructures (such as transport systems) where rates of change typically involve several decades, even up to a century (Grubler 1991; Leibowicz 2018). Also, the creation of entirely new systems (diffusion) takes longer time than replacements of existing technologies or practices (substitution) (Grübler et al. 1999); and late adopters tend to adopt faster than early pioneers (Wilson 2012; Grubler 1996).
Arguments about scale in the energy system date back at least to the 1970s when Schumacher, Lovins and others argued the case for smaller-scale, distributed technologies (Schumacher 1974; Lovins 1976; Lovins 1979). In Small is ProfitableLovins and colleagues evidenced over 200 reasons why decentralised energy resources, from distributed generation to end-use efficiency, made good business sense in addition to their social, human-centred benefits (Lovins et al. 2003). More recent advances in digital, solar and energy storage technologies have renewed technical and economic arguments in favour of adopting decentralised approaches to decarbonisation (Cook et al. 2016; Jain et al. 2017; Lovins et al. 2018). Smaller-scale technologies from microprocessors to solar panels show dramatically faster cost and performance improvement trajectories than large-scale energy supply facilities (Trancik 2014; Sweerts et al. 2020, Creutzig et al. 2021) (Figure 5.15). Analysing the performance of over 80 energy technologies historically, Wilson et al. (2020a) found that smaller scale, more ‘granular’ technologies are empirically associated with faster diffusion, lower investment risk, faster learning, more opportunities to escape lock-in, more equitable access, more job creation, and higher social returns on innovation investment. These advantages of more granular technologies are consistent with accelerated low-carbon transformation (Wilson et al. 2020a).
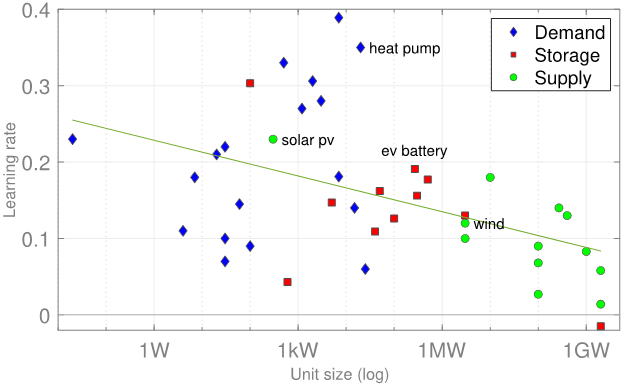
Figure 5.15 | Demand technologies show high learning rates. Learning from small-scale granular technologies outperforms learning from larger supply-side technologies. Line is linear fit of log unit size to learning rate for all 41 technologies plotted. Source: Creutzig et al. (2021); based on Sweerts et al. (2020).
Second, complexity matters, which is often related to unit scale (Ma et al. 2008). Acceleration is more difficult for options with higher degrees of complexity (e.g., carbon capture, transport and storage, or a hydrogen economy) representing higher technological and investment risks that can slow down change. Options with lower complexity are easier to accelerate because they involve less experimentation and debugging and require less adoption efforts and risk.
Third, agency, structure and meaning can accelerate transitions. The creation and mobilisation of actor coalitions is widely seen as important for acceleration, especially if these involve actors with technical skills, financial resources and political capital (Kern and Rogge 2016; Hess 2019b; Roberts and Geels 2019). Changes in policies and institutions can also accelerate transitions, especially if these create stable and attractive financial incentives or introduce technology-forcing standards or regulations (Brand et al. 2013; Kester et al. 2018; Roberts et al. 2018). Changes in meanings and cultural norms can also accelerate transitions, especially when they affect consumer practices, enhance social acceptance, and create legitimacy for stronger policy support (Lounsbury and Glynn 2001; Rogers 2003; Buschmann and Oels 2019). Adoption of most advanced practices can support leapfrogging of polluting technologies (Box 5.9).
Box 5.9 | Is Leapfrogging Possible?
The concept of leapfrogging emerged in development economics (Soete 1985), energy policy (Goldemberg 1991) and environmental regulation (Perkins 2003, which provides a first critical review of the concept), and refers to a development strategy that skips traditional and polluting development in favour of the most advanced concepts. For instance, in rural areas without telephone landlines or electricity access (cables), a direct shift to mobile telephony or distributed, locally-sourced energy systems is promoted, or economic development policies for pre-industrial economies forego the traditional initial emphasis on heavy industry industrialisation, instead focusing on services like finance or tourism. Often leapfrogging is enabled by learning and innovation externalities where improved knowledge and technologies become available for late adopters at low costs. The literature highlights many cases of successful leapfrogging but also highlights limitations (Watson and Sauter 2011); with example case studies for China (Gallagher 2006; Chen and Li-Hua 2011); Mexico (Gallagher and Zarsky 2007); and Japan and Korea (Cho et al. 1998). Increasingly the concept is being integrated into the literature of low-carbon development, including innovation and technology transfer policies (Pigato et al. 2020), highlighting in particular the importance of contextual factors of successful technology transfer and leapfrogging including: domestic absorptive capacity and technological capabilities (Cirera and Maloney 2017); human capital, skills, and relevant technical know-how (Nelson and Phelps 1966); the size of the market (Keller 2004); greater openness to trade (Sachs and Warner 1995; Keller 2004); geographical proximity to investors and financing (Comin et al. 2012); environmental regulatory proximity (Dechezleprêtre et al. 2015); and stronger protection of intellectual property rights (Dechezleprêtre et al. 2013; Dussaux et al. 2017). The existence of a technological potential for leapfrogging therefore needs to be considered within a wider context of social, institutional, and economic factors that influence whether leapfrogging potentials can be realised ( high evidence, high agreement ).
There are also some contentious topics in the debate on accelerated low-carbon transitions. First, while acceleration is desirable to mitigate climate change, there is a risk that accelerating change too much may short-cut crucial experimentation and social and technological learning in ‘formative phases’ (Bento 2013; Bento et al. 2018b) and potentially lead to a pre-mature lock-in of solutions that later turn out to have negative impacts (Cowan 1990; Cowan 1991) ( high evidence, medium agreement ).
Second, there is an ongoing debate about the most powerful leverage points and policies for speeding up change in social and technological systems. Farmer et al. (2019) suggested ‘sensitive intervention points’ for low-carbon transitions, but do not quantify the impacts on transformations. Grubler et al. (2018) proposed an end-user and efficiency-focused strategy to achieve rapid emission reductions and quantified their scenario with a leading IAM. However, discussion of the policy implications of such a strategy have only just started (Wilson et al. 2019a), suggesting an important area for future research.
The last contentious issue is if policies can or should substitute for lack of economic or social appeal of change or for technological risks. Many large-scale supply-side climate mitigation options, such as CCS or nuclear power, involve high technological risks, critically depend on a stable carbon price, and are controversial in terms of social and environmental impacts (Sovacool et al. 2014; Smith et al. 2016; Wilson et al. 2020a) ( high evidence, medium agreement ). There is continuing debate if and how policies could counterbalance these impacts in order to accelerate transitions (Nordhaus 2019; Lovins 2015). Some demand-side options like large-scale public transport infrastructures such as ‘Hyperloop’ (Decker et al. 2017) or concepts such as the Asian Super Grid (maglev fast train coupled with superconducting electricity transmission networks) (AIGC 2017) may face similar challenges, which adds weight and robustness to those demand-side options that are more decentralised, granular in scale, and provide potential tangible consumer benefits besides being low-carbon (like more efficient buildings and appliances, ‘soft’ urban mobility options (walking and cycling), digitalisation, among others (Grubler et al. 2018)).
A robust conclusion from this review is that there are no generic acceleration policies that are independent from the nature of what changes, by whom and how. Greater contextualisation and granularity in policy approaches is therefore important to address the challenges of rapid transitions towards zero-carbon systems ( high evidence, high agreement ).
5.6Governance and Policy
5.6.1Governing Mitigation: Participation and Social Trust
In demand-side mitigation, governance is key to drive the multidimensional changes needed to meet service needs within a society that provide people with a decent living while increasingly reducing resource and energy input levels (Rojas-Rueda et al. 2012; Batchelor et al. 2018; OECD 2019a). Impartial governance, understood as equal treatment of everyone by the rule of law, creates social trust and is thus a key enabler of inclusive and participatory demand-side climate policies (Rothstein 2011). Inclusive and broad-based participation itself also leads to greater social trust and thus is also a key enabler of demand-side climate mitigation (Section 5.2). Higher social trust and inclusive participatory processes also reduce inequality, restrain opportunistic behaviour and enhance cooperation (Drews and van den Bergh 2016; Gür 2020) (Section 5.2). Altogether, broad-based participatory processes are central to the successful implementation of climate policies (Rothstein and Teorell 2008; Klenert et al. 2018) ( high evidence, medium agreement ). A culture of cooperation feeds back to increase social trust and enables action that reduce GHG emissions (Carattini et al. 2015; Jo and Carattini 2021), and requires including explicit consideration of the informal sector (Box 5.10). More equitable societies also have the institutional flexibility to allow for mitigation to advance faster, given their readiness to adopt locally-appropriate mitigation policies; they also suffer less from policy lock-in (Tanner et al. 2009; Lorenz 2013; Chu 2015; Cloutier et al. 2015; Martin 2016; Seto et al. 2016; Vandeweerdt et al. 2016; Turnheim et al. 2018).
Box 5.10 | The Informal Sector and Climate Mitigation
The informal economy represents a large and growing portion of socio-economic activities (Charmes 2016; Muchie et al. 2016; Mbaye and Gueye 2018), including much of the work done by women worldwide. It accounts for an estimated 61% of global employment in the world; 90% in developing countries, 67% in emerging countries, and 18% in developed countries (Berik 2018), representing roughly 30% of GDP across a range of countries (Durán Heras 2012; Narayan 2017). Due to its importance, policies which support informal-sector climate mitigation activities may be extremely efficient (Garland 2015). For example, environmental and energy taxes may have negative gross costs when the informal sector dominates economic activity since these taxes indirectly tax the informal sector; informal production may substitute for energy-intensive goods, with strong welfare-enhancing effects (Bento et al. 2018a). The informal sector can assemble social and financial capital, create jobs, and build low-carbon local economies (Ruzek 2015). Constraints on small and informal-sector firms’ ability to build climate resilience include financial and data barriers, limited access to information technology, and policy exclusion (Kraemer-Mbula and Wunsch-Vincent 2016; Crick et al. 2018a; Crick et al. 2018b).
Informal-sector innovation is often underrated. It gives marginalised people access to welfare-enhancing innovations, building on alternative knowledge and socially-embedded reciprocal exchange (Jaffe and Koster 2019; Sheikh 2019; Sheikh and Bhaduri 2020). Large improvements in low-emission, locally-appropriate service provision are possible by facilitating informal-sector service providers’
Box 5.10
access to low-energy technologies (while taking care not to additionally burden the unpaid and marginalised), through such means as education, participatory governance, government policies to assist the informal sector, social services, health care, credit provision, and removing harmful policies and regulatory silos. The importance of the informal economy, especially in low-income countries, opens many possibilities for new approaches to decent living standards service provision along with climate resilience (Rynikiewicz and Chetaille 2006; Backstränd et al. 2010; Porio 2011; Kriegler et al. 2014; Taylor and Peter 2014; Brown and McGranahan 2016; Chu 2016; Satterthwaite et al. 2018; Boran 2019; Hugo and du Plessis 2019; Schröder et al. 2019; Javaid et al. 2020).
Public information and understanding of the CO2-eq emissions implied by consumption patterns can unleash great creativity for meeting service needs fairly and with lower emissions (Darier and Schüle 1999; Sterman and Sweeney 2002; Lorenzoni et al. 2007; Billett 2010; Marres 2011; Zapico Lamela et al. 2011; Polonsky et al. 2012; Williams et al. 2019). Community-based mapping, social learning, green infrastructure development, and participatory governance facilitate such information-sharing (Tauhid and Zawani 2018; Mazeka et al. 2019; Sharifi 2020), strengthening mitigation policies (Loiter and Norberg-Bohm 1999; Stokes and Warshaw 2017; Zhou et al. 2019).
Since informal settlements are usually dense, upgrading them supports low-carbon development pathways which leapfrog less-efficient housing, transport and other service provision, using locally-appropriate innovations (Satterthwaite et al. 2018). Examples of informal-sector mitigation include digital banking in Africa; mobility in India using collective transport; food production, meal provision, and reduction of food waste in Latin America (e.g., soup kitchens in Brazil, community kitchens in Lima, Peru); informal materials recycling, space heating and cooling, and illumination (Hordijk 2000; Baldez 2003; Maumbe 2006; Gutberlet 2008; Chaturvedi and Gidwani 2011; Nandy et al. 2015; Rouse and Verhoef 2016; Ackah 2017).
5.6.2Policies to Strengthen Avoid-Shift-Improve
There is high untapped potential of demand-side mitigation options if considered holistically within the domains of Avoid-Shift-Improve (Sections 5.3 and 5.4, Tables 5.1, 5.2, and 5.3a,b). Within the demand-side mitigation options opportunity space, policies currently focus more on efficiency and ‘Improve’ options and relatively less on ‘Shift’ and ‘Avoid’ options (Dubois et al. 2019; Moberg et al. 2019). Current demand-side policies are fragmented, piecemeal and too weak to drive demand-side transitions commensurate with 1.5°C or 2°C climate goals (Wilson et al. 2012; Fawcett et al. 2019; Mundaca et al. 2019; Moberg et al. 2019) ( high evidence, highagreement ). However, increasingly policy mix in a number of countries has seen a rise in prohibitions on fossil fuel use as a way to weaken lock-ins, for example, on fossil fuel heating in favour of low-carbon alternatives (Rosenbloom et al. 2020). Policies that are aimed at behaviour and lifestyle changes carry a perception of political risks for policymakers, which may explain why policy instruments focus more on information provision and adoption of incentives than on regulation and investment (Rosenow et al. 2017; Moberg et al. 2019). Acceleration of demand-side transitions would thus require both a broadening of demand-side options and the creation of comprehensive and targeted policy mixes (Kern et al. 2017; Rosenow et al. 2017; IPCC 2018) that strengthen the five drivers of decision and action identified in Section 5.4, Table 5.4 and in Tables 5.5–5.7 ( high evidence, high agreement ). Demand-side transitions in developing and emerging economies would also require stronger administrative capacity as well as technical and financial support (UN-Habitat 2013; Creutzig et al. 2016b).
Systematic categorisation of demand-side policy options in different sectors and services through the Avoid-Shift-Improve framework enables identification of major entry points and possible associated social struggles to overcome for the policy instruments/interventions as discussed below.
5.6.2.1‘Avoid’ Policies
There is high evidence and highagreement that ‘Avoid’ policies that affect lifestyle changes offer opportunities for cost-effective reductions in energy use and emissions, but would need to overcome political sensitivities around government efforts to shape and modify individual-level behaviour (Rosenow et al. 2017; Grubb et al. 2020) (Table 5.5). These policies include ways to help avoid travel growth through integrated city planning or building retrofits to help avoid demand for transport, heating or cooling (Bakker et al. 2014; Lucon et al. 2014; de Feijter et al. 2019), which interact with existing infrastructure. Dense pedestrianised cities and towns and medium-density transit corridors are better placed to implement policies for car reductions than ‘sprawled’ cities characterised by low-density, auto-dependent and separated land uses (Seto et al. 2014; Newman and Kenworthy 2015; Newman et al. 2017; Bakker et al. 2014).
Cities face pressing priorities like poverty reduction, meeting basic services and building human and institutional capacity. These are met with highly accessible walkable and cyclable cities, connected with public transit corridors, enabling equal accessibility for all citizens, and enabling a high level of service provisioning (UN-Habitat 2013; Creutziget al. 2016b). Infrastructure development costs less than for car dependent cities. However, it requires a mindset shift for urban and transport planners (medium evidence, high agreement ).
Policies that support the avoidance of higher-emission lifestyles and improve well-being are facilitated by the introduction of smart technologies, infrastructures and practices (Amini et al. 2019). They include regulations and measures for investment in high-quality ICT infrastructure and regulations to restrict number plates, as well as company policy around flexible working conditions (Lachapelle et al. 2018; Shabanpour et al. 2018). Working-from-home arrangements may advantage certain segments of society such as male, older, higher-educated and highly-paid employees, potentially exacerbating existing inequalities in the labour market (Lambert et al. 2020; Bonacini et al. 2021). In the absence of distributive or other equity-based measures, the potential gains in terms of emissions reduction may therefore be counteracted by the cost of increasing inequality. This potential growth in inequality is likely to be more severe in poorer countries that will additionally suffer from a lack of international funding for achieving the SDGs ( high evidence, medium agreement ) (Barbier and Burgess 2020; UN 2020).
Table 5.5 | Examples of policies to enable ‘Avoid’ options.
Mitigation option | Perceived struggles to overcome | Policy to overcome struggles (Incentives) |
Reduce passenger km | –Existing paradigms and planning practices and car dependency (Rosenow et al. 2017; Grubb et al. 2020) –Financial and capacity barrier in many developing countries – Status dimension of private cars | –Integrated city planning to avoid travel growth, car reduction, building retrofits to avoid heating or cooling demand (Bakker et al. 2014; Lucon et al. 2014; de Feijter et al. 2019) –Public-private partnership to overcome financial barrier (Roy et al. 2018b) (Box 5.8) –Taxation of status consumption; reframing of low-carbon transport as high status (Hoor 2020; Ramakrishnan and Creutzig 2021) |
Reduce/Avoid food waste | Little visible political and social momentum to prevent food waste in the Global North | Strengthen national nutrition guidelines for health safety; improve education/awareness on food waste; policies to eliminate ambiguous food labelling include well-defined and clear date labelling systems for food (Wilson et al. 2017); policies to support R&D to improve packaging to extend shelf life (Thyberg and Tonjes 2016); charging according to how much food households throw away |
Reduce size of dwellings | Size of dwellings getting larger in many countries | Compact city design, taxing residential properties with high per capita area, progressive taxation of high status consumption (Ramakrishnan and Creutzig 2021) |
Reduce/Avoid heating, cooling and lighting in dwellings | Change in individual behaviour in dress codes and working times | Temperature set point as norm; building energy codes that set building standards; bioclimatic and/or zero emissions buildings; cities and buildings that incorporate features like daylighting and increased building depth, height, and compactness (Steemers 2003; Creutzig et al. 2016a) |
Sharing economy for more service per product | Lack of inclusivity and involvement of users in design. Digital divide, unequal access and unequal digital literacy (Pouri and Hilty 2018). Political or power relations among actors involved in the sharing economy (Curtis and Lehner 2019) | Lower prices for public parking, and subsidies towards the purchase of electric vehicles for providers of electric vehicle sharing services (Jung and Koo 2018) |
5.6.2.2‘Shift’ Policies
As indicated in Table 5.6, ‘Shift’ policies have various forms such as the demand for low-carbon materials for buildings and infrastructure in manufacturing and services and shift from meat-based protein, mainly beef, to plant-based diets of other protein sources ( high evidence, high agreement ) (Springmann et al. 2016 a; Ritchie et al. 2018; Willett et al. 2019). Governments also play a direct role beyond nudging citizens with information about health and well-being.While the effectiveness of these policies on behaviour change overall may be limited (Pearson-Stuttard et al. 2017; Shangguan et al. 2019), there is some room for policy to influence actors upstream, such as industry and supermarkets, which may give rise to longer-term, structural change.
Table 5.6 | Examples of policies to enable ‘Shift’ options.
Mitigation option | Perceived struggles to overcome | Policy to overcome struggles (Incentives) |
More walking, less car use, train rather air travel | Adequate infrastructure may be absent, speed a part of modern life | –Congestion charges (Pearson-Stuttard et al. 2017; Shangguan et al. 2019); deliberate urban design including cycling lanes, shared micromobility, and extensive cycling infrastructure; synchronised/integrated transport system and timetable –Fair street space allocation (Creutzig et al. 2020) |
Multifamily housing | Zonings that favour single family homes have been dominant in planning (Hagen 2016) | Taxation, relaxation of single-family zoning policies and land use regulation (Geffner 2017) |
Shifting from meat to other protein | Minimal meat required for protein intake, especially in developing countries for population suffering from malnutrition and when plant-based protein is lacking (Garnett 2011; Sunguya et al. 2014; Behrens et al. 2017; Godfray et al. 2018); dominance of market-based instruments limits governments’ role to nudging citizens with information about health and well-being, and point-of-purchase labelling (Pearson-Stuttard et al. 2017; Shangguan et al. 2019) | –Tax on meat/beef in wealthier countries and/or households (Edjabou and Smed 2013; Säll and Gren 2015) –Nationally recommended diets (Garnett 2011; Sunguya et al. 2014; Behrens et al. 2017; Godfray et al. 2018) |
Material-efficient product design, packaging | Resistance by architects and builders who might perceive risks with lean designs. Cultural and social norms. Policy measures not keeping up with changes on the ground such as increased consumption of packaging | Embodied carbon standards for buildings (IEA 2019c) |
Architectural design with shading and ventilation | Lack of education, awareness and capacity for new thinking, local air pollution | Incentives for increased urban density and incentives to encourage architectural forms with lower surface-to-volume ratios and increased shading support (Creutzig et al. 2016a) |
Mobility services is one of the key areas where a combination of market-based and command-and-control measures have been implemented to persuade large numbers of people to get out of their automobiles and take up public transport and cycling alternatives (Gehl et al. 2011). Congestion charges are often complemented by other measures, such as company subsidies for bicycles, to incentivise the shift to public mobility services. Attracting people to public transport requires sufficient spatial coverage of transport with adequate level of provision, and good quality service at affordable fares (Sims et al. 2014; Moberg et al. 2019) ( high evidence, high agreement ). Cities such as Bogota, Colombia, Buenos Aires, Argentina, and Santiago, Chile, have seen rapid growth of cycling, resulting in a six-fold increase in cyclists (Pucher and Buehler 2017). Broadly, the history and type of city determines how quickly the transition to public modes of transport can be achieved. For example, cities in developed countries enjoy an advantage in that there is a network of high-quality public transport predating the advent of automobiles, whereas cities in less developed countries are latecomers to large-scale network infrastructure (UN-Habitat 2013; Gota et al. 2019).
5.6.2.3‘Improve’ Policies
‘Improve’ policies focus on the efficiency and enhancement of technological performance of services (Table 5.7). In mobility services, ‘Improve’ policies aim at improving vehicles, comfort, fuels, transport operations and management technologies; and in buildings, they include policies for improving efficiency of heating systems and retrofitting existing buildings. Efficiency improvements in electric cooking appliances, together with the ongoing decrease in prices of renewable energy technologies, are opening policy opportunities to support households to adopt electrical cooking at mass scale (medium evidence, medium agreement ) (IEA 2017c; Puzzolo et al. 2019). These actions towards cleaner energy for cooking often come with cooking-related reduction of GHG emissions, even though the extent of the reductions is highly dependent on context and technology and fuel pathways ( high evidence, high agreement ) (Martínez et al. 2017; Mondal et al. 2018; Rosenthal et al. 2018; Serrano-Medrano et al. 2018; Dagnachew et al. 2019) (Box 5.6).
Table 5.7 highlights the significant progress made in the uptake of the electrical vehicle (EV) in Europe, driven by a suite of incentives and policies. Increased activity in widening electric vehicle use is also occurring in developing countries. The Indian Government’s proposal to reach the target of a 100% electric vehicle fleet by 2030 has stimulated investment in charging infrastructure that can facilitate diffusion of larger EVs (Dhar et al. 2017). Although the proposal was not converted into a policy, India’s large and growing two-wheeler market has benefitted from the policy attention on EVs, showing a significant potential for increasing the share of electric two- and three-wheelers in the short term (Ahmad and Creutzig 2019 ). Similar opportunities exist for China, where e-bikes have replaced car trips and are reported to act as intermediate links in multimodal mobility (Cherry et al. 2016).
In recent years, policy interest has arisen to address the energy access challenge in Africa using low-carbon energy technologies to meet energy for poverty reduction and climate action simultaneously (Rolffs et al. 2015; Fuso Nerini et al. 2018; Mulugetta et al. 2019). This aspiration has been bolstered on the technical front by significant advances in appliance efficiency such as light-emitting diode (LED) technology, complemented by the sharp reduction in the cost of renewable energy technologies, and largely driven by market-stimulating policies and public R&D to mitigate risks ( high evidence, high agreement ) (Alstone et al. 2015; Zubi et al. 2019).
5.6.3Policies in Transition Phases
Demand-side policies tend to vary for different transition phases ( high evidence, high agreement ) (Roberts and Geels 2019; Sandin et al. 2019). In the first phase, which is characterised by the emergence or introduction of radical innovations in small niches, policies focus on: (i) supporting R&D and demonstration projects to enable learning and capability developments, (ii) nurturing the building of networks and multi-stakeholder interactions, and (iii) providing future orientation through visions or targets (Brown et al. 2003; López-García et al. 2019; Roesler and Hassler 2019). In the second phase, the policy emphasis shifts towards upscaling of experiments, standardisation, cost reduction, and the creation of early market niches (Borghei and Magnusson 2018; Ruggiero et al. 2018). In the third and later phases, comprehensive policy mixes are used to stimulate mass adoption, infrastructure creation, social acceptance and business investment (Fichter and Clausen 2016; Geels et al. 2018; Strauch 2020). In the fourth phase, transitions can also be stimulated through policies that weaken or phase out existing regimes, such as removing inefficient subsidies (for cheap petrol or fuel oil) that encourage wasteful consumption, increasing taxes on carbon-intensive products and practices (Box 5.11), or substantially tightening regulations and standards (Kivimaa and Kern 2016; David 2017; Rogge and Johnstone 2017).
Box 5.11 | Carbon Pricing and Fairness
Whether the public supports specific policy instruments for reducing greenhouse gas emissions is determined by cultural and political world views (Cherry et al. 2017; Kotchen et al. 2017; Alberini et al. 2018) and national positions in international climate negotiations, with major implications for policy design. For example, policy proposals need to circumvent ‘solution aversion’: that is, individuals are more doubtful about the urgency of climate change mitigation if the proposed policy contradicts their political worldviews (Campbell and Kay 2014). While there are reasons to believe that carbon pricing is the most efficient way to reduce emissions, a recent literature – focusing on populations in Western Europe and North America and carbon taxes – documents that efficiency features alone is not what makes citizens like or dislike carbon pricing schemes (Kallbekken et al. 2011; Carattini et al. 2017; Klenert et al. 2018).
Citizens tend to ignore or doubt the idea that pricing carbon emissions reduces GHG emissions (Kallbekken et al. 2011; Douenne and Fabre 2019; Maestre-Andrés et al. 2019). Further, citizens have fairness concerns about carbon pricing (Büchs and Schnepf 2013; Douenne and Fabre 2019; Maestre-Andrés et al. 2019), even if higher carbon prices can be made progressive by suitable use of revenues (Rausch et al. 2011; Williams et al. 2015; Klenert and Mattauch 2016). There are also non-economic properties of policy instruments that matter for public support: Calling a carbon price a ‘CO2 levy’ alleviates solution aversion (Kallbekken et al. 2011; Carattini et al. 2017). It may be that the word ‘tax’ evokes a feeling of distrust in government and fears of high costs, low benefits and distributional effects (Strand 2020). Trust in politicians is negatively correlated with higher carbon prices (Hammar and Jagers 2006; Rafaty 2018) and political campaigns for a carbon tax can lower public support for them (Anderson et al. 2019). Few developing countries have adopted carbon taxes, probably due to high costs, relatively low benefits, and distributional effects (Strand 2020).
To address these realities regarding support for carbon pricing, some studies have examined whether specific uses of the revenue can increase public support for higher carbon prices (Carattini et al. 2017; Beiser-McGrath and Bernauer 2019). Doubt about the environmental effectiveness of carbon pricing may be alleviated if revenue from carbon pricing is earmarked for specific uses (Kallbekken et al. 2011; Carattini et al. 2017) and higher carbon prices may then be supported (Beiser-McGrath and Bernauer 2019). This is especially the case for using the proceeds on ‘green investment’ in infrastructure or energy efficiency programmes (Kotchen et al. 2017). Further, returning the revenues to individuals in a salient manner may increase public support and alleviate fairness proposals, given sufficient information (Carattini et al. 2017; Klenert et al. 2018). Perceived fairness is one of the strongest predictors of policy support (Jagers et al. 2010; Whittle et al. 2019).
5.6.4Policy Sequencing and Packaging to Strengthen Enabling Conditions
Policy coordination is critical to manage infrastructure interdependence across sectors, and to avoid trade-off effects (Raven and Verbong 2007; Hiteva and Watson 2019), specifically requiring the consideration of interactions among supply-side and demand-side measures ( high evidence, high agreement ) (Kivimaa and Virkamäki 2014; Rogge and Reichardt 2016; de Coninck et al. 2018; Edmondson et al. 2019). For example, the amount of electricity required for cooking can overwhelm the grid which can lead to failure, causing end-users to shift back to traditional biomass or fossil fuels (Ateba et al. 2018; Israel-Akinbo et al. 2018); thus grid stability policies need to be undertaken in conjunction.
Policymakers operate in a politically dynamic national and international environment, and their policies often reflect their contextual situations and constraints with regards to climate-related reforms (Levin et al. 2012; Copland 2019), including differentiation between developed and developing countries ( high evidence, high agreement ) (Beer and Beer 2014; Roy et al. 2018c). Variables such as internal political stability, equity, informality (Box 5.10), macro-economic conditions, public debt, governance of policies, global oil prices, quality of public services, and the maturity of green technologies play important roles in determining policy directions.
Sequencing policies appropriately is a success factor for climate policy regimes ( high evidence, high agreement ). In most situations policy measures require a preparatory phase that prepares the ground by lowering the costs of policies, communicating the costs and benefits to citizens, and building coalitions for policies, thus reducing political resistance (Meckling et al. 2017). This policy sequencing aims to incrementally relax or remove barriers over time to enable significant cumulative increases in policy stringency and create coalitions that support future policy development (Pahle et al. 2018). German policies on renewables began with funding for research, design and development (RD&D), then subsidies for demonstration projects during the 1970s and 1980s, and continued to larger-scale projects such as ‘Solar Roofs’ programmes in the 1990s, including scaled-up feed-in tariffs for solar power (Jacobsson and Lauber 2006). These policies led to industrial expansion in wind and solar energy systems, giving rise to powerful renewables interest coalitions that defend existing measures and lend political support for further action. Policy sequencing has also been deployed to introduce technology bans and strict performance standards with a view to eliminating emissions as the end goal, and may involve simultaneous support for low-carbon options while deliberately phasing out established technological regimes (Rogge and Johnstone 2017).
As a key contending policy instrument, carbon pricing also requires embedding into policy packages ( high evidence, medium agreement ). Pricing may be regressive and perceived as additional costs by households and industry, making investments in green infrastructure politically unfeasible, as examples from France and Australia show (Copland 2019; Douenne and Fabre 2020). Reforms that would push up household energy expenses are often left aside for fear of how citizens, especially the poor, would react or cope with higher bills ( high evidence, medium agreement ) (Martinez and Viegas 2017; Tesfamichael et al. 2021). This makes it important to precede carbon pricing with investments in renewable energy and low-carbon transport modes (Biber et al. 2017; Tvinnereim and Mehling 2018), and especially support for developing countries by building up low-carbon energy and mobility infrastructures and technologies, thus reducing resistance to carbon pricing (Creutzig 2019). Additionally, carbon pricing receives higher acceptance if fairness and distributive considerations are made explicit in revenue distribution (Box 5.11).
The effectiveness of a policy package is determined by design decisions as well as the wider governance context that include the political environment, institutions for coordination across scales, bureaucratic traditions, and judicial functioning ( high evidence, high agreement ) (Howlett and Rayner 2013; Rogge and Reichardt 2013; Rosenow et al. 2016). Policy packages often emerge through interactions between different policy instruments as they operate in either complementary or contradictory ways, resulting from conflicting policy goals (Cunningham et al. 2013; Givoni et al. 2013). An example includes the acceleration in shift from traditional biomass to the adoption of modern cooking fuel for 80 million households in rural India over a very short period of four years (2016–2020), which employed a comprehensive policy package including financial incentives, infrastructural support and strengthening of the supply chain to induce households to shift towards a clean cooking fuel from the use of biomass (Kumar 2019). This was operationalised by creating a LPG supply chain by linking oil and gas companies with distributors to assure availability, and create infrastructure for local storage along with an improvement of the rural road network, especially in the rural context (Sankhyayan and Dasgupta 2019). State governments initiated separate policies to increase the distributorship of LPG in their states (Kumar et al. 2016). Similarly, policy actions for scaling up electric vehicles need to be well designed and coordinated where EV policy, transport policy and climate policy are used together, working on different decision points and different aspects of human behaviour (Barton and Schütte 2017). The coordination of the multiple policy actions enables co-evolution of multiple outcomes that involve shifting towards renewable energy production, improving access to charging infrastructure, carbon pricing and other GHG measures (Wolbertus et al. 2018).
Design of policy packages should consider not only policies that support low-carbon transitions but also those that challenge existing carbon-intensive regimes, generating not just policy ‘winners’ but also ‘losers’ ( high evidence, high agreement ) (Carley and Konisky 2020). The winners include low-carbon innovators and entrepreneurs, while the potential losers include incumbents with vested interests in sustaining the status quo (Mundaca et al. 2018; Monasterolo and Raberto 2019). Low-carbon policy packages would benefit from looking beyond climate benefits to include non-climate benefits such as health benefits, fuel poverty reductions and environmental co-benefits (Ürge-Vorsatz et al. 2014; Sovacool et al. 2020b). The uptake of decentralised energy services using solar PV in rural areas in developing countries is one such example where successful initiatives are linked to the convergence of multiple policies that include import tariffs, research incentives for R&D, job creation programmes, policies to widen health and education services, and strategies for increased safety for women and children (Kattumuri and Kruse 2019; Gebreslassie 2020).
The energy-efficient lighting transition in Europe represents a good case of the formation of policy coalitions that led to the development of policy packages. As attention to energy efficiency in Europe increased in the 1990s, policymakers attempted to stimulate energy-saving lamp diffusion through voluntary measures. But policies stimulated only limited adoption. Consumers perceived compact fluorescent lamps (CFLs) as giving ‘cold’ light, being unattractively shaped, taking too long to achieve full brightness, unsuitable for many fixtures, and unreliable (Wall and Crosbie 2009). Still, innovations by major CFL and LED multinationals continued. Increasing political attention to climate change and criticisms from environmental NGOs (e.g. WWF, Greenpeace) strengthened awareness about the inefficiency of incandescent light bulbs (ILBs), which led to negative socio-cultural framings that associated ILBs with energy waste (Franceschini and Alkemade 2016). The combined pressures from the lighting industry, NGOs and member states led the European Commission to introduce the 2009 ban of ILBs of more than 80W, progressing to lower-wattage bans in successive years. While the ILB ban initially mainly boosted CFL diffusion, it also stimulated LED uptake. LED prices decreased quickly by more than 85% between 2008 and 2012 (Sanderson and Simons 2014), because of scale economies, standardisation and commoditisation of LED chip technology, and improved manufacturing techniques. Because of further rapid developments to meet consumer tastes, LEDs came to be seen as the future of domestic lighting (Franceschini et al. 2018). Acknowledging these changing views, the 2016 and 2018 European bans on directional and non-directional halogen bulbs explicitly intended to further accelerate the LED transition and reduce energy consumption for residential lighting.
In summary, more equitable societies are associated with high levels of social trust and enable actions that reduce GHG emissions. To this end, people play an important role in the delivery of demand-side mitigation options within which efficiency and ‘Improve’ options dominate. Policies that are aimed at behaviour and lifestyle changes come with political risks for policymakers. However, the potential exists for broadening demand-side interventions to include ‘Avoid’ and ‘Shift’ policies. Longer term thinking and implementation that involves careful sequencing of policies as well as designing policy packages that address multiple co-benefits would be critical to manage interactions among supply-side and demand-side options to accelerate mitigation.
5.7Knowledge Gaps
Knowledge gap 1: Better metric to measure actual human well-being
Knowledge on climate action that starts with the social practices and how people live in various environments, cultures, contexts and attempts to improve their well-being, is still in its infancy. In models, climate solutions remain supply-side oriented, and evaluated against GDP, without acknowledging the reduction in well-being due to climate impacts. GDP is a poor metric of human well-being, and climate policy evaluation requires better grounding in relation to decent living standards and/or similar benchmarks. Actual solutions will invariably include demand, service provisioning and end use. Literature on how gender, informal economies mostly in developing countries, and solidarity and care frameworks translate into climate action, but also how climate action can improve the life of marginalised groups, remains scarce. The working of economic systems under a well-being-driven rather than GDP-driven paradigm requires better understanding.
Knowledge gap 2: Evaluation of climate implications of the digital economy
The digital economy, as well as shared and circular economy, is emerging as a template for great narratives, hopes and fears. Yet, there are few systematic evaluations of what is already happening and what can govern it towards a better narrative. Research needs to better gauge energy trends for rapidly evolving systems like data centres, increased use of social media and influence of consumption and choices, AI, blockchain; and implications of digital divides among social groups and countries on well-being. Governance decisions on AI, indirectly fostering either climate harming or climate mitigating activities remain unexplored. Better integration of mitigation models and consequential lifecycle analysis is needed for assessing how digitalisation, shared economy and circular economy change material and energy demand.
Knowledge gap 3: Scenario modelling of services
Scenarios start within parameter-rich models carrying more than a decade-long legacy of supply-side technologies that are not always gauged in recent technological developments. Service provisioning systems are not explicitly modelled, and diversity in concepts and patterns of lifestyles rarely considered. A new class of flexible and modular models with focus on services and activities, based on a variety of data sources including big data collected and compiled, is needed. There is scope for more sensitivity analysis on two aspects to better guide further detailed studies on societal response to policy. These aspects need to explore which socio-behavioural aspects and/or organisation changes has the biggest impact on energy/emissions reductions, and on the scale for take-back effects, due to interdependence on inclusion or exclusion of groups of people. Models mostly consider behavioural change free, and don’t account for how savings due to ‘Avoid’ measures may be re-spent. Most quantitatively measurable service indicators, for example passenger-kilometres travelled or tonne-kilometres of freight transport are also inadequate to measure services in the sense of well-being contributions. More research is needed on how to measure, for example, accessibility, social inclusion etc. Otherwise, services will also be poorly represented in scenarios.
Knowledge gap 4: Dynamic interaction between individual, social, and structural drivers of change
Better understanding is required on: (i) more detailed causal mechanisms in the mutual interactions between individual, social, and structural drivers of change and how these vary over time, that is, what is their relative importance in different transition phases; (ii) how narratives associated with specific technologies, group identities, and climate change influence each other and interact over time to enable and constrain mitigation outcomes; (iii) how social media influences the development and impacts of narratives about low-carbon transitions; (iv) the effects of social movements (for climate justice, youth climate activism, fossil fuel divestment, and climate action more generally) on social norms and political change, especially in less developed countries; (v) how existing provisioning systems and social practices destabilise through the weakening of various lock-in mechanisms, and resulting deliberate strategies for accelerating demand-side transitions; (vi) a dynamic understanding of feasibility, which addresses the dynamic mechanisms that lower barriers or drive mitigation options over the barriers; (vii) how shocks like prolonged pandemic impact willingness and capacity to change and their permanency for various social actors and country contexts. The debate on the most powerful leverage points and policies for speeding up change in social and technological systems need to be resolved with more evidence. Discussion on the policy interdependence and implications of end-user and efficiency focused strategies have only just started suggesting an important area for future research.
Table 5.7 | Examples of policies to enable‘Improve’options
Mitigation option | Perceived struggles to overcome | Policy to overcome struggles (Incentives) |
Lightweight vehicles, hydrogen cars, electric vehicles, ecodriving | Adequate infrastructure may be absent, speed a part of modern life | Monetary incentives and traffic regulations favouring electric vehicles; investment in public charging infrastructure; car purchase tax calculated by a combination of weight, CO2 and NOx emissions (Haugneland and Kvisle 2015; Globisch et al. 2018; Gnann et al. 2018; Lieven and Rietmann 2018; Rietmann and Lieven 2019) |
Use low-carbon materials in dwelling design | Manufacturing and R&D costs, recycling processes and aesthetic performance (Orsini and Marrone 2019). Access to secondary materials in the building sector (Nußholz et al. 2019) | Increasing recycling of construction and demolition waste; incentives must be available to companies in the waste collection and recovery markets to offer recovered material at higher value (Nußholz et al. 2019) |
Better insulation and retrofitting | –Policies to advance retrofitting and GHG emission reductions in buildings are laden with high expectations since they are core components of politically ambitious city climate targets (Haug et al. 2010) –Building owners’ to implement measures identified in auditing results –Lack of incentive for building owners to invest in higher efficiency than required norms (Trencher et al. 2016) | Grants and loans through development banks, building and heating system labels, and technical renovation requirements to continuously raise standards (Ortiz et al. 2019; Sebi et al. 2019); disclosure of energy use, financing and technical assistance (Sebi et al. 2019) |
Widen low-carbon energy access | Access to finance, capacity, robust policies, affordability for poor households for off-grid solutions until recently (Rolffs et al. 2015; Fuso Nerini et al. 2018; Mulugetta et al. 2019) | Feed-in tariffs and auctions to stimulate investment. Pay-as-you-go end-user financing scheme where customers pay a small up-front fee for the equipment, followed by monthly payments, using mobile payment system (Rolffs et al. 2015; Yadav et al. 2019) |
Improve illumination-related emission | Lack of supply-side solutions for low-carbon electricity provision | Building energy codes that set building standards; grants and other incentives for R&D |
Improve efficiency of cooking appliances | Reliability of power in many countries is not guaranteed; electricity tariff is high in many countries; cooking appliances are mostly imported using scarce foreign currency | Driven by a combination of government support for appliance purchases, shifting subsidies from kerosene or LPG to electricity; community-level consultation and awareness campaigns about the hazards associated with indoor air pollution from the use of fuelwood, coal and kerosene, as well as education on the multiple benefits of electric cooking (Martínez-Gómez et al. 2016; Yangka and Diesendorf 2016; Martínez et al. 2017; Gould and Urpelainen 2018; Dendup and Arimura 2019; Pattanayak et al. 2019) |
Shift to LED lamps | People spend increasing amounts of time indoors, with heavy dependence on and demand for artificial lighting (Ding et al. 2020) | Government incentives, utility incentive (Bertoldi et al. 2021). EU bans on directional and non-directional halogen bulbs (Franceschini et al. 2018) |
Solar water heating | Dominance of incumbent energy source i.e., electricity; cheap conventional energy; high initial investment costs and long payback (Joubert et al. 2016) | Subsidy for solar heaters (Li et al. 2013; Bessa and Prado 2015; Sgouridis et al. 2016) |
Frequently Asked Questions (FAQs)
FAQ 5.1 | What can every person do to limit warming to 1.5°C?
People can be educated through knowledge transfer so they can act in different roles, and in each role everyone can contribute to limit global warming to 1.5°C. Citizens with enough knowledge can organise and put political pressure on the system. Role models can set examples to others. Professionals (e.g., engineers, urban planners, teachers, researchers) can change professional standards in consistency with decarbonisation; for example urban planners and architects can design physical infrastructures to facilitate low-carbon mobility and energy use by making walking and cycling safe for children. Rich investors can make strategic plans to divest from fossils and invest in carbon-neutral technologies. Consumers, especially those in the top 10% of the world population in terms of income, can limit consumption, especially in mobility, and explore the good life consistent with sustainable consumption.
Policymakers support individual actions in certain contexts, not only by economic incentives, such as carbon pricing, but also by interventions that understand complex decision-making processes, habits, and routines. Examples of such interventions include, but are not limited to, choice architectures and nudges that set green options as default, shift away from cheap petrol or gasoline, increasing taxes on carbon-intensive products, or substantially tightening regulations and standards to support shifts in social norms, and thus can be effective beyond the direct economic incentive.
FAQ 5.2 | How does society perceive transformative change?
Humaninduced global warming, together with other global trends and events, such as digitalisation and automation, and the COVID-19 pandemic, induce changes in labour markets, and bring large uncertainty and ambiguity. History and psychology reveal that societies can thrive in these circumstances if they openly embrace uncertainty on the future and try out ways to improve life. Tolerating ambiguity can be learned, for example by interacting with history, poetry and the arts. Sometimes religion and philosophy also help.
As a key enabler, novel narratives created in a variety of ways, such as by advertising, images and the entertainment industry, help to break away from the established meanings, values and discourses and the status quo. For example, discourses that frame comfortable public transport services to avoid stress from driving cars on busy, congested roads help avoid car driving as a status symbol and create a new social norm to shift to public transport. Discourses that portray plant-based protein as healthy and natural promote and stabilise particular diets. Novel narratives and inclusive processes help strategies to overcome multiple barriers. Case studies demonstrate that citizens support transformative changes if participatory processes enable a design that meets local interests and culture. Promising narratives specify that even as speed and capabilities differ, humanity embarks on a joint journey towards well-being for all and a healthy planet.
FAQ 5.3 | Is demand reduction compatible with growth of human well-being?
There is a growing realisation that mere monetary value of income growth is insufficient to measure national welfare and individual well-being. Hence, any action towards climate change mitigation is best evaluated against a set of indicators that represent a broader variety of needs to define individual well-being, macroeconomic stability, and planetary health. Many solutions that reduce primary material and fossil energy demand, and thus reduce GHG emissions, provide better services to help achieve well-being for all.
Economic growth measured by total or individual income growth is a main driver of GHG emissions. Only a few countries with low economic growth rates have reduced both territorial and consumption-based GHG emissions, typically by switching from fossil fuels to renewable energy and by reduction in energy use and switching to low/zero carbon fuels, but until now at insufficient rates and levels for stabilising global warming at 1.5°C. High deployment of low/zero carbon fuels and associated rapid reduction in demand for and use of coal, gas, and oil can further reduce the interdependence between economic growth and GHG emissions.
References
Aaberge, R. and A. Brandolini, 2015: Multidimensional Poverty and Inequality. In: Handbook of Income Distribution[Atkinson, A. and F. Bourguignon, (eds.)], Vol. 2, Elsevier, Amsterdam, the Netherlands, pp. 141–216.
Abel, G.J., B. Barakat, S. KC, and W. Lutz, 2016: Meeting the Sustainable Development Goals leads to lower world population growth. Proc. Natl. Acad. Sci. , 113(50) , 14294–14299, doi:10.1073/PNAS.1611386113.
Aberilla, J.M., A. Gallego-Schmid, L. Stamford, and A. Azapagic, 2020: Environmental sustainability of cooking fuels in remote communities: Life cycle and local impacts. Sci. Total Environ. , 713, 136445, doi:10.1016/J.SCITOTENV.2019.136445.
Abraham, C.J., A.J. Rix, I. Ndibatya, and M.J. Booysen, 2021: Ray of hope for sub-Saharan Africa’s paratransit: Solar charging of urban electric minibus taxis in South Africa. Energy Sustain. Dev. , 64, 118–127, doi:10.1016/J.ESD.2021.08.003.
Abrahamse, W. and L. Steg, 2009: How do socio-demographic and psychological factors relate to households’ direct and indirect energy use and savings?J. Econ. Psychol. , 30(5) , 711–720, doi:10.1016/j.joep.2009.05.006.
Abrahamse, W. and L. Steg, 2013: Social influence approaches to encourage resource conservation: A meta-analysis. Glob. Environ. Change, 23(6) , 1773–1785, doi:10.1016/j.gloenvcha.2013.07.029.
Abrahamse, W., L. Steg, C. Vlek, and T. Rothengatter, 2005: A review of intervention studies aimed at household energy conservation. J. Environ. Psychol. , 25(3) , 273–291, doi:10.1016/j.jenvp.2005.08.002.
Abrahamse, W., L. Steg, C. Vlek, and T. Rothengatter, 2007: The effect of tailored information, goal setting, and tailored feedback on household energy use, energy-related behaviors, and behavioral antecedents. J. Environ. Psychol. , 27(4) , 265–276, doi:10.1016/j.jenvp.2007.08.002.
Acheampong, R.A. and A. Siiba, 2019: Modelling the determinants of car-sharing adoption intentions among young adults: the role of attitude, perceived benefits, travel expectations and socio-demographic factors. Transportation (Amst). , 47, 2557–2580, doi:10.1007/s11116-019-10029-3.
Ackah, M., 2017: Informal E-waste recycling in developing countries: review of metal(loid)s pollution, environmental impacts and transport pathways. Environ. Sci. Pollut. Res. , 24(31) , 24092–24101, doi:10.1007/s11356-017-0273-y.
Adaloudis, M. and J. Bonnin Roca, 2021: Sustainability tradeoffs in the adoption of 3D Concrete Printing in the construction industry. J. Clean. Prod. , 307, 127201, doi.org/10.1016/j.jclepro.2021.127201.
Adger, W.N. et al., 2003: Governance for Sustainability: Towards a ‘Thick’ Analysis of Environmental Decisionmaking. Environ. Plan. A Econ. Sp. , 35(6) , 1095–1110, doi:10.1068/a35289.
Adua, L. and B. Clark, 2019: Even for the environment, context matters! States, households, and residential energy consumption. Environ. Res. Lett. , 14(6) , 064008, doi:10.1088/1748-9326/AB1ABF.
Ahir, R.K. and B. Chakraborty, 2021: A meta-analytic approach for determining the success factors for energy conservation. Energy, 230 (September 1, 2021), 120821, doi:10.1016/j.energy.2021.120821.
Ahmad, S. and F. Creutzig, 2019: Spatially contextualized analysis of energy use for commuting in India. Environ. Res. Lett. , 14(4) , 045007, doi:10.1088/1748-9326/ab011f.
Ahmad, S., G. Baiocchi, and F. Creutzig, 2015: CO2 Emissions from Direct Energy Use of Urban Households in India. Environ. Sci. Technol. , 49(19) , 11312–11320, doi:10.1021/es505814g.
Ahmad, S., S. Pachauri, and F. Creutzig, 2017: Synergies and trade-offs between energy-efficient urbanization and health. Environ. Res. Lett. , 12(11) , doi:10.1088/1748-9326/aa9281.
AIGC, 2017: Asia International Grid Connection Study Group Interim Report . Renewable Energy Institute, Tokyo, Japan, 60 pp. https://www.renewable-ei.org/en/activities/reports/img/20170419/ASGInterimReport_170419_Web_en.pdf (Accessed December 16, 2019).
Aiken, G.T., L. Middlemiss, S. Sallu, and R. Hauxwell-Baldwin, 2017: Researching climate change and community in neoliberal contexts: an emerging critical approach. Wiley Interdiscip. Rev. Clim. Change, 8(4) , e463, doi:10.1002/WCC.463.
Ajzen, I., 1985: From Intentions to Actions: A Theory of Planned Behavior. In: Action Control, [Kuhl, J. and Beckmann, J. (eds.)]. Springer Berlin, Heidelberg, Germany, pp. 11–39.
Akyelken, N., D. Banister, and M. Givoni, 2018: The Sustainability of Shared Mobility in London: The Dilemma for Governance. Sustainability, 10(2) , 420, doi:10.3390/su10020420.
Alber, G., 2009: Gender and Climate Change Policy. In: Population Dynamics and Climate Change[Guzmán, J.M., G. Martinez, G. McGranahan, D. Schensul, and C. Tacoli, (eds.)], United Nations Population Fund/International Institute for Environment and Development, New York, NY, USA and London, UK, pp. 149–163.
Alberini, A., A. Bigano, M. Ščasný, and I. Zvěřinová, 2018: Preferences for Energy Efficiency vs. Renewables: What Is the Willingness to Pay to Reduce CO2 Emissions?Ecol. Econ. , 144, 171–185, doi:10.1016/j.ecolecon.2017.08.009.
Albrecht, G. et al., 2007: Solastalgia: The Distress Caused by Environmental Change. Australas. Psychiatry, 15, S95–S98, doi:10.1080/10398560701701288.
Aldaco, R. et al., 2020: Food waste management during the COVID-19 outbreak: a holistic climate, economic and nutritional approach. Sci. Total Environ. , 742, 140524, doi:10.1016/j.scitotenv.2020.140524.
Alegria, M.E.O., 2021: Optimization of Agro-Socio-Hydrological Networks under Water Scarcity Conditions. TU Dresden, Germany, 182 pp.
Alhumayani, H., M. Gomaa, V. Soebarto, and W. Jabi, 2020: Environmental assessment of large-scale 3D printing in construction: A comparative study between cob and concrete. J. Clean. Prod. , 270, 122463, doi:10.1016/J.JCLEPRO.2020.122463.
Alkire, S. and M.E. Santos, 2014: Measuring Acute Poverty in the Developing World: Robustness and Scope of the Multidimensional Poverty Index. World Dev. , 59, 251–274, doi:10.1016/j.worlddev.2014.01.026.
Alkire, S. and G. Robles, 2017: Multidimensional Poverty Index – Summer 2017: brief methodological note and results. Oxford Poverty and Human Development Initiative, Oxford, UK, 20 pp. https://ophi.org.uk/multidimensional-poverty-index-summer-2017-brief-methodological-note-and-results/.
Allcott, H., 2011: Social norms and energy conservation. J. Public Econ. , 95(9) , 1082–1095, doi:10.1016/j.jpubeco.2011.03.003.
Allcott, H. and T.T. Rogers, 2012: How long do treatment effects last? Persistence and durability of a descriptive norms intervention’s effect on energy conservation. https://dash.harvard.edu/bitstream/handle/1/9804492/RWP12-045_Rogers.pdf .
Allcott, H. and T. Rogers, 2014: The short-run and long-run effects of behavioral interventions: Experimental evidence from energy conservation. Am. Econ. Rev. , 104(10) , 3003–3037, doi:10.1257/aer.104.10.3003.
Allwood, J.M. and J.M. Cullen, 2012: Sustainable Materials with Both Eyes Open. Future Buildings, Vehicles, Products and Equipment – Made Efficiently and Made with Less New Material. UIT Cambridge Ltd., Cambridge, UK, 356 pp.
Allwood, J.M., J.M. Cullen, and R.L. Milford, 2010: Options for Achieving a 50% Cut in Industrial Carbon Emissions by 2050. Environ. Sci. Technol. , 44(6) , 1888–1894, doi:10.1021/es902909k.
Alon, T., M. Doepke, J. Olmstead-Rumsey, and M. Tertilt, 2020: The Impact of COVID-19 on Gender Equality. National Bureau of Economic Research, Cambridge, MA, USA.
Alstone, P., D. Gershenson, and D.M. Kammen, 2015: Decentralized energy systems for clean electricity access. Nat. Clim. Change, 5(4) , 305–314, doi:10.1038/nclimate2512.
Alvaredo, F., L. Chancel, T. Piketty, E. Saez, and G. Zucman, 2018: World Inequality Report 2018. 344 pp. www.wid.world/team (Accessed November 20, 2019).
Ameli, N. and N. Brandt, 2015: Determinants of households’ investment in energy efficiency and renewables: evidence from the OECD survey on household environmental behaviour and attitudes. Environ. Res. Lett. , 10(4) , doi:10.1088/1748-9326/10/4/044015.
Amini, M.H., H. Arasteh, and P. Siano, 2019: Sustainable smart cities through the lens of complex interdependent infrastructures: Panorama and state-of-the-art. In: Studies in Systems, Decision and Control, [M. Hadi Amini, Kianoosh G. Boroojeni, S. S. Iyengar, Panos M. Pardalos, Frede Blaabjerg, Asad M. Madni (eds.)], Vol. 186, Springer International Publishing, Zurich, Switzerland, pp. 45–68.
Amis, J.M., and B.D. Janz, 2020: Leading Change in Response to COVID-19. J. Appl. Behav. Sci. , 56(3) , 272–278, doi:10.1177/0021886320936703.
Amundsen, H., F. Berglund, and H. Westskogh, 2010: Overcoming barriers to climate change adaptation-a question of multilevel governance?Environ. Plan. C Gov. Policy, 28(2) , 276–289, doi:10.1068/c0941.
Andersen, C.B., and J. Quinn, 2020: Human Appropriation of Net Primary Production. Encycl. World’s Biomes,, 22–28, doi:10.1016/B978-0-12-409548-9.12434-0.
Anderson, S., I.E. Marinescu, and B. Shor, 2019: Can Pigou at the Polls Stop US Melting the Poles?SSRN Electron. J., doi:10.2139/ssrn.3400772.
Andor, M., A. Gerster, J. Peters and C. Schmidt, 2020: Social Norms and Energy Conservation Beyond the US. RWI, Essen, Germany, 25 pp. https://www.sciencedirect.com/science/article/abs/pii/S0095069620300747.
Andor, M.A. and K.M. Fels, 2018: Behavioral Economics and Energy Conservation – A Systematic Review of Non-price Interventions and Their Causal Effects. Ecol. Econ. , 148, 178–210, doi:10.1016/j.ecolecon.2018.01.018.
Andrae, A. and T. Edler, 2015: On Global Electricity Usage of Communication Technology: Trends to 2030. Challenges, 6(1) , 117–157, doi:10.3390/challe6010117.
Angrist, J.D., S. Caldwell, and J. V Hall, 2017: Uber vs. Taxi: A Driver’s Eye View. 75 pp.
Annecke, W., 2002: The rich get richer and the poor get renewables: the WSSD, energy and women, a malevolent perspective. Agenda, 17(52) , 8–16.
Añón Higón, D., R. Gholami, and F. Shirazi, 2017: ICT and environmental sustainability: A global perspective. Telemat. Informatics, 34(4) , 85–95, doi:10.1016/J.TELE.2017.01.001.
Anshelm, J. and M. Hultman, 2014: A green fatwā? Climate change as a threat to the masculinity of industrial modernity. NORMA, 9(2) , 84–96, doi:10.1080/18902138.2014.908627.
Antal, M., G. Mattioli, and I. Rattle, 2020: Let’s focus more on negative trends: A comment on the transitions research agenda. Environ. Innov. Soc. Transitions, 34, 359–362, doi:10.1016/J.EIST.2020.02.001.
Araña, J. and C. León, 2013: Can Defaults Save the Climate? Evidence from a Field Experiment on Carbon Offsetting Programs. Environ. Resour. Econ. , 54(4) , 613–626.
Arrow, K. et al., 2004: Are We Consuming Too Much?J. Econ. Perspect. , 18(3) , 147–172, doi:10.1257/0895330042162377.
Arrow, K.J., P. Dasgupta, L.H. Goulder, K.J. Mumford, and K. Oleson, 2013: Sustainability and the measurement of wealth: further reflections. Environ. Dev. Econ. , 18(4) , 504–516, doi:10.1017/s1355770x13000193.
Arto, I., I. Capellán-Pérez, R. Lago, G. Bueno, and R. Bermejo, 2016: The energy requirements of a developed world. Energy Sustain. Dev. , 33, 1–13, doi:0.1016/j.esd.2016.04.001.
Asim, M., S.A. Batool, and M.N. Chaudhry, 2012: Scavengers and their role in the recycling of waste in Southwestern Lahore. Resour. Conserv. Recycl. , 58, 152–162, doi.org/10.1016/j.resconrec.2011.10.013.
Ateba, B.B., J.J. Prinsloo, and E. Fourie, 2018: The impact of energy fuel choice determinants on sustainable energy consumption of selected South African households. J. Energy South. Africa, 29(3) , 51–65, doi:10.17159/2413-3051/2018/v29i3a4714.
Atkinson, R., T. Dörfler, M. Hasanov, E. Rothfuß, and I. Smith, 2017: Making the case for self-organisation: Understanding how communities make sense of sustainability and climate change through collective action. Int. J. Sustain. Soc. , 9(3) , 193–209, doi:10.1504/IJSSOC.2017.088300.
Atreya, A. and S. Ferreira, 2015: Seeing is Believing? Evidence from Property Prices in Inundated Areas. Risk Anal. , 35(5) , 828–848, doi:10.1111/risa.12307.
Attari, S.Z. et al., 2010: Public perceptions of energy consumption and savings. Proc. Natl. Acad. Sci. , 107(37) , 16054–16059, doi:10.1073/pnas.1001509107.
Attari, S.Z., D.H. Krantz, and E.U. Weber, 2016: Energy conservation goals: What people adopt, what they recommend, and why. Judgm. Decis. Mak. , 11(4) , 342–351.
Atteridge, A., M.K. Shrivastava, N. Pahuja, and H. Upadhyay, 2012: Climate Policy in India: What Shapes International, National and State Policy?Ambio, 41(1) , 68–77, doi:10.1007/S13280-011-0242-5.
Aubrey, S.B., 2019: Violence against the earth begets violence against women. Arizona J. Environ. Law Policy, 10 (Fall 2019), 34–67.
Auerswald, P.E. and L.M. Branscomb, 2003: Valleys of Death and Darwinian Seas : Financing the Invention to Innovation Transition in the United States. Technology, 28(3–4) , 227–239, doi:10.1023/A:1024980525678.
Ausubel, J.H., 1991: Rat-race dynamics and crazy companies. The diffusion of technologies and social behavior. Technol. Forecast. Soc. Change, 39(1–2) , 11–22, doi:10.1016/0040-1625(91)90025-B.
Avgerinou, M., P. Bertoldi, and L. Castellazzi, 2017: Trends in Data Centre Energy Consumption under the European Code of Conduct for Data Centre Energy Efficiency. Energies, 10(10) , 1–18, doi:10.3390/en10101470.
Axsen, J. and B.K. Sovacool, 2019: The roles of users in electric, shared and automated mobility transitions. Transp. Res. Part D Transp. Environ. , 71, 1–21, doi:10.1016/J.TRD.2019.02.012.
Ayers, J. and T. Forsyth, 2009: Community-Based Adaptation to Climate Change. Environ. Sci. Policy Sustain. Dev. , 51(4) , 22–31, doi:10.3200/ENV.51.4.22-31.
Ayres, I., S. Raseman, and A. Shih, 2013: Evidence from Two Large Field Experiments that Peer Comparison Feedback Can Reduce Residential Energy Usage. J. Law, Econ. Organ. , 29(5) , 992–1022.
Ayres, R.U., 1989: Energy Inefficiency in the US Economy: A New Case for Conservation. International Institute for Applied Systems Analysis, Laxenburg, Austria, 28 pp. http://pure.iiasa.ac.at/id/eprint/3220/ (Accessed September 12, 2019).
Ayres, R.U., and U.E. Simonis, 1994: Industrial Metabolism: Restructuring for Sustainable Development . United Nations University Press, Tokyo, Japan, 376 pp.
Ayres, R.U. and B. Warr, 2005: Accounting for growth: The role of physical work. Struct. Change Econ. Dyn. , 16(2) , 181–209, doi:10.1016/j.strueco.2003.10.003.
Azong, M., C.J. Kelso, and K. Naidoo, 2018: Vulnerability and resilience of female farmers in Oku, Cameroon, to Climate Change. African Sociol. Rev. , 22(1).
Azong, M.N. and C.J. Kelso, 2021: Gender, ethnicity and vulnerability to climate change: The case of matrilineal and patrilineal societies in Bamenda Highlands Region, Cameroon. Glob. Environ. Change, 67, 102241, doi:10.1016/J.GLOENVCHA.2021.102241.
Backstränd, K., J. Khan, A. Kronsell, and E. Lövbrand, eds., 2010: Environmental Politics and Deliberative Democracy: Examining the Promise of New Modes of Governance. Edward Elgar Publishing Limited, Cheltenham, UK, 256 pp.
Bailis, R., R. Drigo, A. Ghilardi, and O. Masera, 2015: The carbon footprint of traditional woodfuels. Nat. Clim. Change, 5(3) , 266–272, doi:10.1038/nclimate2491.
Bajželj, B. et al., 2014: Importance of food-demand management for climate mitigation. Nat. Clim. Change, 4(10) , 924–929, doi:10.1038/nclimate2353.
Baker, L., 2018: Of embodied emissions and inequality: Rethinking energy consumption. Energy Res. Soc. Sci. , 36 (December 2017), 52–60, doi:10.1016/j.erss.2017.09.027.
Bakker, S., M. Zuidgeest, H. de Coninck, and C. Huizenga, 2014: Transport, Development and Climate Change Mitigation: Towards an Integrated Approach. Transp. Rev. , 34(3) , 335–355, doi:10.1080/01441647.2014.903531.
Baldez, L., 2003: Women’s Movements and Democratic Transition in Chile, Brazil, East Germany, and Poland. Comp. Polit. , 35(3) , 253, doi:10.2307/4150176.
Baležentis, T., G. Liobikienė, D. Štreimikienė, and K. Sun, 2020: The impact of income inequality on consumption-based greenhouse gas emissions at the global level: A partially linear approach. J. Environ. Manage. , 267, 110635, doi:10.1016/J.JENVMAN.2020.110635.
Ballew, M. et al., 2020: Which racial/ethnic groups care most about climate change? Yale Program on Climate Change Communication. Yale University and George Mason University, New Haven, CT, USA, https://climatecommunication.yale.edu/publications/race-and-climate-change/ (Accessed June 5, 2020).
Ballew, M.T. et al., 2019: Climate Change in the American Mind: Data, Tools, and Trends. Environ. Sci. Policy Sustain. Dev., 61(3) , 4–18, doi:10.1080/00139157.2019.1589300.
Ballús-Armet, I., S.A. Shaheen, K. Clonts, and D. Weinzimmer, 2014: Peer-to-Peer Carsharing. Transp. Res. Rec. J. Transp. Res. Board, 2416(1) , 27–36, doi:10.3141/2416-04.
Baloch, M.A., Danish, S.U. Khan, and Z.Ş. Ulucak, 2020: Analyzing the relationship between poverty, income inequality, and CO2 emission in Sub-Saharan African countries. Sci. Total Environ. ,, 139867, 740 doi:10.1016/j.scitotenv.2020.139867.
Baltruszewicz, M. et al., 2021: Household final energy footprints in Nepal, Vietnam and Zambia: composition, inequality and links to well-being. Environ. Res. Lett. , 16(2) , 025011, doi:10.1088/1748-9326/ABD588.
Bamberg, S., D. Rölle, and C. Weber, 2003: Does habitual car use not lead to more resistance to change of travel mode?Transportation (Amst). , 30(1) , 97–108, doi:10.1023/A:1021282523910.
Bamberg, S., M. Hunecke, and A. Blöbaum, 2007: Social context, personal norms and the use of public transportation: Two field studies. J. Environ. Psychol. , 27(3) , 190–203, doi:10.1016/J.JENVP.2007.04.001.
Bamisile, O. et al., 2021: Impact of economic development on CO2 emission in Africa; the role of BEVs and hydrogen production in renewable energy integration. Int. J. Hydrogen Energy, 46(2) , 2755–2773, doi:10.1016/J.IJHYDENE.2020.10.134.
Banerjee, M., R. Prasad, I.H. Rehman, and B. Gill, 2016: Induction stoves as an option for clean cooking in rural India. Energy Policy, 88, 159–167, doi:10.1016/j.enpol.2015.10.021.
Baptista, P., S. Melo, and C. Rolim, 2014: Energy, Environmental and Mobility Impacts of Car-sharing Systems. Empirical Results from Lisbon, Portugal. Procedia – Soc. Behav. Sci. , 111, 28–37, doi:10.1016/j.sbspro.2014.01.035.
Baranzini, A., S. Carattini, and M. Péclat, 2017: What drives social contagion in the adoption of solar photovoltaic technology?Centre for Climate Change Economics and Policy and Grantham Research Institute on Climate Change and the Environment, London, UK, 38 pp. http://www.lse.ac.uk/GranthamInstitute/publication/what-drives-social-contagion-in-the-adoption-of-solar-photovoltaic-technology/ (Accessed June 23, 2021).
Barbier, E.B. and J.C. Burgess, 2020: Sustainability and development after COVID-19. World Dev. , 135, 105082, doi:10.1016/j.worlddev.2020.105082.
Bardhi, F. and G.M. Eckhardt, 2012: Access-Based Consumption: The Case of Car Sharing. J. Consum. Res. , 39(4) , 881–898, doi:10.1086/666376.
Bardsley, N. et al., 2019: Domestic thermal upgrades, community action and energy saving: A three-year experimental study of prosperous households. Energy Policy, 127, 475–485, doi:10.1016/j.enpol.2018.11.036.
Barnes, J., R. Durrant, F. Kern, and G. MacKerron, 2018: The institutionalisation of sustainable practices in cities: how initiatives shape local selection environments. Environ. Innov. Soc. Transitions, 29, 68–80, doi:10.1016/j.eist.2018.04.003.
Barnes, M.L. et al., 2020: Social determinants of adaptive and transformative responses to climate change. Nat. Clim. Change, 10, doi:10.1038/s41558-020-0871-4.
Barnett, J., 2003: Security and climate change. Glob. Environ. Change, 13(1) , 7–17, doi:10.1016/S0959-3780(02)00080-8.
Barnett, J., K. Burningham, G. Walker, and N. Cass, 2012: Imagined publics and engagement around renewable energy technologies in the UK. Public Underst. Sci. , 21 (1), 36–50, doi:10.1177/0963662510365663.
Barr, S. and J. Prillwitz, 2014: A smarter choice? Exploring the behaviour change agenda for environmentally sustainable mobility. Environ. Plan. C Gov. Policy, 32(1) , 1–19, doi:10.1068/c1201.
Barton, B. and P. Schütte, 2017: Electric vehicle law and policy: A comparative analysis. J. Energy Nat. Resour. Law, 35(2) , 147–170, doi:10.1080/02646811.2017.1262087.
Batchelor, S. et al., 2018: Solar electric cooking in Africa: Where will the transition happen first?Energy Res. Soc. Sci. , 40, 257–272, doi:10.1016/j.erss.2018.01.019.
Batchelor, S., E. Brown, N. Scott, and J. Leary, 2019: Two birds, one stone – reframing cooking energy policies in Africa and Asia. Energies, 12(9) , 1591, doi:10.3390/en12091591.
Bavel, J.J. Van et al., 2020: Using social and behavioural science to support COVID-19 pandemic response. Nat. Hum. Behav. , 4(5) , 460–471, doi:10.1038/s41562-020-0884-z.
Bayus, B.L., 1994: Are product life cycles really getting shorter?J. Prod. Innov. Manag. , 11(4) , 300–308, doi:10.1016/0737-6782(94)90085-X.
Beaunoyer, E., S. Dupéré, and M.J. Guitton, 2020: COVID-19 and digital inequalities: Reciprocal impacts and mitigation strategies. Comput. Human Behav. , 111, 106424, doi:10.1016/j.chb.2020.106424.
Beer, C.T., 2014: Climate Justice, the Global South, and Policy Preferences of Kenyan Environmental NGOs. Glob. South, 8(2) , 84–100, doi:10.2979/globalsouth.8.2.84.
Beeson, M., 2019: Environmental Populism: The Politics of Survival in the Anthropocene. Palgrave Macmillan, Singapore, 131 pp.
Behrens, P. et al., 2017: Evaluating the environmental impacts of dietary recommendations. Proc. Natl. Acad. Sci. , 114(51) , 13412–13417, doi:10.1073/pnas.1711889114.
Beiser-McGrath, L.F. and T. Bernauer, 2019: Could revenue recycling make effective carbon taxation politically feasible?Sci. Adv. , 5(9) , doi:10.1126/sciadv.aax3323.
Belkhir, L. and A. Elmeligi, 2018: Assessing ICT global emissions footprint: Trends to 2040 & recommendations. J. Clean. Prod. , 177, 448–463, doi:10.1016/J.JCLEPRO.2017.12.239.
Bell, S.E., C. Daggett, and C. Labuski, 2020: Toward feminist energy systems: Why adding women and solar panels is not enough ✰. Energy Res. Soc. Sci. , 68, 101557, doi:10.1016/J.ERSS.2020.101557.
Belzunegui-Eraso, A. and A. Erro-Garcés, 2020: Teleworking in the Context of the Covid-19 Crisis. Sustainability, 12(9) , 3662, doi:10.3390/SU12093662.
Benegal, S.D., 2018: The spillover of race and racial attitudes into public opinion about climate change. Env. Polit. , 27(4) , 733–756, doi:10.1080/09644016.2018.1457287.
Bengtsson, M., E. Alfredsson, M. Cohen, S. Lorek, and P. Schroeder, 2018: Transforming systems of consumption and production for achieving the sustainable development goals: moving beyond efficiency. Sustain. Sci. , 13(6) , 1533–1547, doi:10.1007/s11625-018-0582-1.
Bentley, M., 2014: An ecological public health approach to understanding the relationships between sustainable urban environments, public health and social equity. Health Promot. Int. , 29(3) , 528–537, doi:10.1093/heapro/dat028.
Bento, A.M., M.R. Jacobsen, and A.A. Liu, 2018a: Environmental policy in the presence of an informal sector. J. Environ. Econ. Manage. , 90, 61–77, doi:10.1016/j.jeem.2018.03.011.
Bento, N., 2013: New Evidence in Technology Scaling Dynamics and the Role of the Formative Phase. International Institute for Applied Systems Analysis, Laxenburg, Austria, 45 pp. http://pure.iiasa.ac.at/id/eprint/10752/ (Accessed July 12, 2021).
Bento, N., C. Wilson, and L.D. Anadon, 2018b: Time to get ready: Conceptualizing the temporal and spatial dynamics of formative phases for energy technologies. Energy Policy, 119 (May), 282–293, doi:10.1016/j.enpol.2018.04.015.
Benyus, J., 1997: Biomimicry: Innovation inspired by nature. 320 pp. William Morrow Paperbacks, New York, USA.
Bergek, A., C. Berggren, T. Magnusson, and M. Hobday, 2013: Technological discontinuities and the challenge for incumbent firms: Destruction, disruption or creative accumulation?Res. Policy, 42, 1210–1224, doi:10.1016/j.respol.2013.02.009.
Bergman, N., 2013: Why is renewable heat in the UK underperforming? A socio-technical perspective. Proc. Inst. Mech. Eng. Part A J. Power Energy, 227(1) , 124–131, doi:10.1177/0957650912471291.
Bergmann, Z. and R. Ossewaarde, 2020: Youth climate activists meet environmental governance: ageist depictions of the FFF movement and Greta Thunberg in German newspaper coverage. J. Multicult. Discourses, 15(3) , 267–290, doi:10.1080/17447143.2020.1745211.
Bergquist, M., A. Nilsson, and P. Wesley Schultz, 2019: Experiencing a severe weather event increases concern about climate change. Front. Psychol. , 10 (FEB), 220, doi:10.3389/fpsyg.2019.00220.
Berik, G., 2018: Toward more inclusive measures of economic well-being: Debates and practices. International Labour Organization, Geneva, Switzerland, 32 pp. https://www.ilo.org/global/topics/future-of-work/publications/research-papers/WCMS_649127/lang--en/index.htm (Accessed March 3, 2020).
Berkeley, N., D. Bailey, A. Jones, and D. Jarvis, 2017: Assessing the transition towards Battery Electric Vehicles: A Multi-Level Perspective on drivers of, and barriers to, take up. Transp. Res. Part A Policy Pract. , 106 (October), 320–332, doi:10.1016/j.tra.2017.10.004.
Bertoldi, P., M. Economidou, V. Palermo, B. Boza-Kiss, and V. Todeschi, 2021: How to finance energy renovation of residential buildings: Review of current and emerging financing instruments in the EU. Wiley Interdiscip. Rev. Energy Environ. , 10(1) , e384, doi:10.1002/wene.384.
Bertram, C. et al., 2021: COVID-induced low power demand and market forces starkly reduce CO2 emissions. Nat. Clim. Change, 11, 193–196, doi:10.1038/s41558-021-00987-x.
Bessa, V.M.T., and R.T.A. Prado, 2015: Reduction of carbon dioxide emissions by solar water heating systems and passive technologies in social housing. Energy Policy, 83, 138–150, doi:10.1016/j.enpol.2015.04.010.
Biber, E., N. Kelsey, and J. Meckling, 2017: The Political Economy of Decarbonization: A Research Agenda. Brooklyn Law Rev. , 82(2). https://brooklynworks.brooklaw.edu/blr/vol82/iss2/8.
Bilal et al., 2020: Environmental pollution and COVID-19 outbreak: insights from Germany. Air Qual. Atmos. Heal. , 13, 1385–1394, doi:10.1007/s11869-020-00893-9.
Billett, S., 2010: Dividing climate change: global warming in the Indian mass media. Clim. Change, 99(1–2) , 1–16, doi:10.1007/s10584-009-9605-3.
Bischoff, J. and M. Maciejewski, 2016: Autonomous Taxicabs in Berlin – A Spatiotemporal Analysis of Service Performance. Transp. Res. Procedia, 19, 176–186, doi:10.1016/J.TRPRO.2016.12.078.
Black, T., 2016: Race, gender, and climate justice: Dimensions of social and environmental inequality. In: Systemic crises of global climate change: intersections of race, class and gender[Godfrey, P. and D. Torres, (eds.)], Routledge, Abingdon, UK and New York, NY, USA, pp. 172–184.
Blok, K. et al., 2016: Implementing Circular Economy Globally Makes Paris Targets Achievable. Ecofys and Circle Economy, Utrecht, the Netherlands, 18 pp. https://assets.website-files.com/5d26d80e8836af2d12ed1269/5dea481576d89489dff8782e_ircle-economy-ecofys-2016-implementing-circular-economy-globally-makes-paris-targets-achievable.pdf (Accessed October 11, 2021).
Blomsma, F., and G. Brennan, 2017: The Emergence of Circular Economy: A New Framing Around Prolonging Resource Productivity. J. Ind. Ecol. , 21(3) , 603–614, doi:10.1111/jiec.12603.
Bob, U. and A. Babugura, 2014: Contextualising and conceptualising gender and climate change in Africa. Agenda, 28(3) , 3–15, doi:10.1080/10130950.2014.958907.
Bocken, N.M.P., E.A. Olivetti, J.M. Cullen, J. Potting, and R. Lifset, 2017: Taking the Circularity to the Next Level: A Special Issue on the Circular Economy. J. Ind. Ecol. , 21(3) , 476–482, doi:10.1111/jiec.12606.
Bodart, M. and A. De Herde, 2002: Global energy savings in offices buildings by the use of daylighting. Energy Build. , 34(5) , 421–429, doi:10.1016/S0378-7788(01)00117-7.
Bolderdijk, J.W., M. Gorsira, K. Keizer, and L. Steg, 2013: Values Determine the (In)Effectiveness of Informational Interventions in Promoting Pro-Environmental Behavior. PLoS One, 8(12) , e83911, doi:10.1371/journal.pone.0083911.
Bolsen, T., T.J. Leeper, and M.A. Shapiro, 2014: Doing What Others Do: Norms, Science, and Collective Action on Global Warming. Am. Polit. Res. , 42(1) , 65–89, doi:10.1177/1532673X13484173.
Bonacini, L., G. Gallo, and S. Scicchitano, 2021: Working from home and income inequality: risks of a ‘new normal’ with COVID-19. J. Popul. Econ. , 34(1) , 303–360, doi:10.1007/s00148-020-00800-7.
Bonan, J., C. Cattaneo, G. D’Adda, and M. Tavoni, 2020: The interaction of descriptive and injunctive social norms in promoting energy conservation. Nat. Energy, 5(11) , 900–909, doi:10.1038/s41560-020-00719-z.
Bongardt, D. et al., 2013: Low-carbon Land Transport: Policy Handbook. Routledge, New York, NY, USA.
Bonilla-Alicea, R.J., B.C. Watson, Z. Shen, L. Tamayo, and C. Telenko, 2020: Life cycle assessment to quantify the impact of technology improvements in bike-sharing systems. J. Ind. Ecol. , 24(1) , 138–148, doi:10.1111/jiec.12860.
Boomsma, C. and L. Steg, 2014: The effect of information and values on acceptability of reduced street lighting. J. Environ. Psychol. , 39, 22–31, doi:10.1016/j.jenvp.2013.11.004.
Boran, I., 2019: Political theory and global climate action: recasting the public sphere. 1st ed. Routledge, New York, NY, USA, 108 pp.
Borghei, B. and T. Magnusson, 2016: Niche experiments with alternative powertrain technologies: the case of electric city-buses in Europe. Int. J. Automot. Technol. Manag. , 16(3) , 274, doi:10.1504/ijatm.2016.080787.
Borghei, B.B. and T. Magnusson, 2018: Niche aggregation through cumulative learning: A study of multiple electric bus projects. Environ. Innov. Soc. Transitions, 28 (C), 108–121, doi:10.1016/j.eist.2018.01.004.
Bostrom, A., A.L. Hayes, and K.M. Crosman, 2019: Efficacy, Action, and Support for Reducing Climate Change Risks. Risk Anal. , 39(4) , 805–828, doi:10.1111/RISA.13210.
Bouman, E.A., E. Lindstad, A.I. Rialland, and A.H. Strømman, 2017: State-of-the-art technologies, measures, and potential for reducing GHG emissions from shipping – A review. Transp. Res. Part D Transp. Environ. , 52, 408–421, doi:10.1016/j.trd.2017.03.022.
Bouman, T., L. Steg, and T. Dietz, 2020a: Insights from early COVID-19 responses about promoting sustainable action. Nat. Sustain. , 4, 194–200, doi:10.1038/s41893-020-00626-x.
Bouman, T. et al., 2020b: When worry about climate change leads to climate action: How values, worry and personal responsibility relate to various climate actions. Glob. Environ. Change, 62, 102061, doi:10.1016/j.gloenvcha.2020.102061.
Bows-Larkin, A., 2015: All adrift: aviation, shipping, and climate change policy. Clim. Policy, 15(6) , 681–702, doi:10.1080/14693062.2014.965125.
Boyer, R., 2020: Les capitalismes à l’épreuve de la pandémie. La Découverte, Paris, France, 200 pp.
Bradshaw, S., 2018: Sex disaggregation alone will not energize equality. Nat. Energy, 3(10) , 813–815, doi:10.1038/s41560-018-0247-4.
Brambilla, G., M. Lavagna, G. Vasdravellis, and C.A. Castiglioni, 2019: Environmental benefits arising from demountable steel-concrete composite floor systems in buildings. Resour. Conserv. Recycl. , 141 (October 2018), 133–142, doi:10.1016/j.resconrec.2018.10.014.
Brand-Correa, L.I. and J.K. Steinberger, 2017: A Framework for Decoupling Human Need Satisfaction From Energy Use. Ecol. Econ. , 141, 43–52, doi:10.1016/j.ecolecon.2017.05.019.
Brand-Correa, L.I., J. Martin-Ortega, and J.K. Steinberger, 2018: Human Scale Energy Services: Untangling a ‘golden thread’. Energy Res. Soc. Sci. , 38 (August 2017), 178–187, doi:10.1016/j.erss.2018.01.008.
Brand-Correa, L.I., G. Mattioli, W.F. Lamb, and J.K. Steinberger, 2020: Understanding (and tackling) need satisfier escalation. Sustain. Sci. Pract. Policy, 16(1) , 309–325, doi:10.1080/15487733.2020.1816026.
Brand, C. and B. Boardman, 2008: Taming of the few – The unequal distribution of greenhouse gas emissions from personal travel in the UK. Energy Policy, 36(1) , 224–238, doi:10.1016/j.enpol.2007.08.016.
Brand, C. and J.M. Preston, 2010: ‘60-20 emission’ – The unequal distribution of greenhouse gas emissions from personal, non-business travel in the UK. Transp. Policy, 17(1) , 9–19, doi:10.1016/j.tranpol.2009.09.001.
Brand, C., J. Anable, and M. Tran, 2013: Accelerating the transformation to a low carbon passenger transport system: The role of car purchase taxes, feebates, road taxes and scrappage incentives in the UK. Transp. Res. Part A Policy Pract. , 49, 132–148, doi:10.1016/j.tra.2013.01.010.
Braungardt, S., J. van den Bergh, and T. Dunlop, 2019: Fossil fuel divestment and climate change: Reviewing contested arguments. Energy Res. Soc. Sci. , 50, 191–200, doi:10.1016/j.erss.2018.12.004.
Bray, J., N. Johns, and D. Kilburn, 2011: An Exploratory Study into the Factors Impeding Ethical Consumption. J. Bus. Ethics, 98(4) , 597–608, doi:10.1007/s10551-010-0640-9.
Breukers, S. and M. Wolsink, 2007: Wind energy policies in the Netherlands: Institutional capacity-building for ecological modernisation. Env. Polit. , 16(1) , 92–112, doi:10.1080/09644010601073838.
Brockway, P. et al., 2017: Energy Rebound as a Potential Threat to a Low-Carbon Future: Findings from a New Exergy-Based National-Level Rebound Approach. Energies, 10(1) , 51, doi:10.3390/en10010051.
Brockway, P.E., J.R. Barrett, T.J. Foxon, and J.K. Steinberger, 2014: Divergence of Trends in US and UK Aggregate Exergy Efficiencies 1960–2010. Environ. Sci. Technol. , 48(16) , 9874–9881, doi:10.1021/ES501217T.
Brockway, P.E., J.K. Steinberger, J.R. Barrett, and T.J. Foxon, 2015: Understanding China’s past and future energy demand: An exergy efficiency and decomposition analysis. Appl. Energy, 155, 892–903, doi:10.1016/J.APENERGY.2015.05.082.
Brockway, P.E., S. Sorrell, G. Semieniuk, M.K. Heun, and V. Court, 2021: Energy efficiency and economy-wide rebound effects: A review of the evidence and its implications. Renew. Sustain. Energy Rev. , 141, 110781, doi:10.1016/J.RSER.2021.110781.
Broomell, S.B., D.V. Budescu, and H.H. Por, 2015: Personal experience with climate change predicts intentions to act. Glob. Environ. Change, 32, 67–73, doi:10.1016/J.GLOENVCHA.2015.03.001.
Brounen, D. and N. Kok, 2011: On the economics of energy labels in the housing market. J. Environ. Econ. Manage. , 62(2) , 166–179, doi:10.1016/j.jeem.2010.11.006.
Brown, D. and G. McGranahan, 2016: The urban informal economy, local inclusion and achieving a global green transformation. Habitat Int. , 53, 97–105, doi:10.1016/j.habitatint.2015.11.002.
Brown, H.S., P. Vergragt, K. Green, and L. Berchicci, 2003: Learning for sustainability transition through bounded socio-technical experiments in personal mobility. Technol. Anal. Strateg. Manag. , 15(3) , 291–316, doi:10.1080/09537320310001601496.
Brown, K.E. and R. Dodder, 2019: Energy and emissions implications of automated vehicles in the U.S. energy system. Transp. Res. Part D Transp. Environ. , 77 (November), 132–147, doi:10.1016/j.trd.2019.09.003.
Brownell, K.D. and K.E. Warner, 2009: The perils of ignoring history: Big tobacco played dirty and millions died. How similar is big food?Milbank Q. , 87(1) , 259–294, doi:10.1111/j.1468-0009.2009.00555.x.
Brozovic, D., 2019: Business model based on strong sustainability: Insights from an empirical study. Bus. Strateg. Environ. , 29(2) , 763–778, doi:10.1002/bse.2440.
Bruck, B.P., V. Incerti, M. Iori, and M. Vignoli, 2017: Minimizing CO2 emissions in a practical daily carpooling problem. Comput. Oper. Res. , 81, 40–50, doi:10.1016/j.cor.2016.12.003.
Brügger, A., C. Demski, and S. Capstick, 2021: How Personal Experience Affects Perception of and Decisions Related to Climate Change: A Psychological View. Weather. Clim. Soc. , 13(3) , 397–408, doi:10.1175/WCAS-D-20-0100.1.
Brulle, R.J., 2019: Networks of Opposition: A Structural Analysis of U.S. Climate Change Countermovement Coalitions 1989–2015. Sociol. Inq. , 91(3) , 603–624, doi:10.1111/SOIN.12333.
Brütting, J., C. De Wolf, and C. Fivet, 2019: The reuse of load-bearing components. IOP Conf. Ser. Earth Environ. Sci. , 225(1) , doi:10.1088/1755-1315/225/1/012025.
Bryan, E., and J.A. Behrman, 2013: Community based adaptation to climate change: A theoretical framework, overview of key issues and discussion of gender differentiated priorities and participation. International Food Policy Research Institute (IFPRI), Washington, DC, USA.
Bryan, E., Q. Bernier, M. Espinal, and C. Ringler, 2018: Making climate change adaptation programmes in sub-Saharan Africa more gender responsive: insights from implementing organizations on the barriers and opportunities. Clim. Dev. , 10(5) , 417–431, doi:10.1080/17565529.2017.1301870.
Bryson, J., and P. Rauwolf, 2016: Trust, Communication, and Inequality. 7 pp. University of Bath, UK.
Büchs, M. and S.V. Schnepf, 2013: Who emits most? Associations between socio-economic factors and UK households’ home energy, transport, indirect and total CO2 emissions. Ecol. Econ. , 90, 114–123, doi:10.1016/j.ecolecon.2013.03.007.
Buckingham, S. and R. Kulcur, 2017: It’s not just the numbers: Challenging Masculinist Working Practices in Climate Change Decision-Making in UK Government and Environmental Non-Governmental Organizations. In: Climate Change and Gender in Rich Countries: Work, Public Policy and Action[Cohen, M.G. (ed.)], Routledge, Abingdon, UK, pp. 35–51.
Buckley, P., 2019: Incentivising households to reduce electricity consumption: A meta-analysis of the experimental evidence. HAL, Paris, France, 51 pp. https://econpapers.repec.org/paper/haljournl/hal-02485494.htm (Accessed August 9, 2020).
Buckley, P., 2020: Prices, information and nudges for residential electricity conservation: A meta-analysis. Ecol. Econ. , 172, 106635, doi:10.1016/j.ecolecon.2020.106635.
Budd, L. and S. Ison, 2020: Responsible Transport: A post-COVID agenda for transport policy and practice. Transp. Res. Interdiscip. Perspect. , 6, 100151, doi:10.1016/j.trip.2020.100151.
Bulkeley, H. and P. Newell, 2015: Governing Climate Change. [Weiss, T.G. (ed.)]. Routledge, Abingdon, UK.
Bullock, C., F. Brereton, and S. Bailey, 2017: The economic contribution of public bike-share to the sustainability and efficient functioning of cities. Sustain. Cities Soc. , 28, 76–87, doi:10.1016/j.scs.2016.08.024.
Burke, M.J., 2020: Energy-Sufficiency for a Just Transition: A Systematic Review. Energies, 13(10) , 2444, doi:10.3390/en13102444.
Burke, M.J. and J.C. Stephens, 2017: Energy democracy: Goals and policy instruments for sociotechnical transitions. Energy Res. Soc. Sci. , 33, 35–48, doi:10.1016/j.erss.2017.09.024.
Burkhardt, J., K. Gillingham, and P. Kopalle, 2019: Experimental Evidence on the Effect of Information and Pricing on Residential Electricity Consumption. Working Paper 25576, National Bureau of Economic Research, Cambridge, MA, USA, 71 pp. http://www.nber.org/papers/w25576.pdf (Accessed September 8, 2020).
Burstein, R. et al., 2019: Mapping 123 million neonatal, infant and child deaths between 2000 and 2017. Nature, 574(7778) , 353–358, doi:10.1038/s41586-019-1545-0.
Buschmann, P. and A. Oels, 2019: The overlooked role of discourse in breaking carbon lock-in: The case of the German energy transition. Wiley Interdiscip. Rev. Clim. Change, 10 (e574), 1–14, doi:10.1002/wcc.574.
Bush, R.E., C.S.E. Bale, and P.G. Taylor, 2016: Realising local government visions for developing district heating: Experiences from a learning country. Energy Policy, 98, 84–96, doi:10.1016/j.enpol.2016.08.013.
Buyle, M., W. Galle, W. Debacker, and A. Audenaert, 2019: Sustainability assessment of circular building alternatives: Consequential LCA and LCC for internal wall assemblies as a case study in a Belgian context. J. Clean. Prod. , 218(2019) , 141–156, doi:10.1016/j.jclepro.2019.01.306.
Calzadilla, P.V. and R. Mauger, 2017: The UN’s new sustainable development agenda and renewable energy: the challenge to reach SDG7 while achieving energy justice. J. Energy Nat. Resour. Law, 36(2) , 233–254, doi:10.1080/02646811.2017.1377951.
Campbell, A., 2018: Mass timber in the circular economy: Paradigm in practice?Proc. Inst. Civ. Eng. Eng. Sustain. , 172(3) , 141–152, doi:10.1680/jensu.17.00069.
Campbell, I., A. Kalanki, and S. Sachar, 2018: Solving the Global Cooling Challenge How to Counter the Climate Threat from Room Air Conditioners. Rocky Mountain Institute, New York, USA, https://rmi.org/wp-content/uploads/2018/11/Global_Cooling_Challenge_Report_2018.pdf (Accessed December 9, 2020).
Campbell, T.H. and A.C. Kay, 2014: Solution aversion: On the relation between ideology and motivated disbelief. J. Pers. Soc. Psychol. , 107(5) , 809–824, doi:10.1037/a0037963.
Caniglia, B.S., R.J. Brulle, and A. Szasz, 2015: Civil Society, Social Movements and Climate Change. In: Climate Change and Society: Sociological Perspective[Dunlap, R.E. and R.J. Brulle, (eds.)], Oxford University Press, Oxford, UK, pp. 235–268.
Cantzler, J. et al., 2020: Saving resources and the climate? A systematic review of the circular economy and its mitigation potential. Environ. Res. Lett. , 15(12) , 123001, doi:10.1088/1748-9326/abbeb7.
Carattini, S., A. Baranzini, and J. Roca, 2015: Unconventional Determinants of Greenhouse Gas Emissions: The role of trust. Environ. Policy Gov. , 25(4) , 243–257, doi:10.1002/eet.1685.
Carattini, S., A. Baranzini, P. Thalmann, F. Varone, and F. Vöhringer, 2017: Green Taxes in a Post-Paris World: Are Millions of Nays Inevitable?Environ. Resour. Econ. , 68(1) , 97–128, doi:10.1007/s10640-017-0133-8.
Carattini, S., S. Levin, and A. Tavoni, 2019: Cooperation in the Climate Commons. Rev. Environ. Econ. Policy, 13(2) , 227–247, doi:10.1093/reep/rez009.
Carley, S. and D.M. Konisky, 2020: The justice and equity implications of the clean energy transition. Nat. Energy, 5(8) , 569–577, doi:10.1038/s41560-020-0641-6.
Carlsson-Kanyama, A., and A.-L. Lindén, 2007: Energy efficiency in residences – Challenges for women and men in the North. Energy Policy, 35(4) , 2163–2172, doi:10.1016/j.enpol.2006.06.018.
Carr, E.R. and M.C. Thompson, 2014: Gender and Climate Change Adaptation in Agrarian Settings: Current Thinking, New Directions, and Research Frontiers. Geogr. Compass, 8(3) , 182–197, doi:10.1111/gec3.12121.
Carrington, M.J., B.A. Neville, and G.J. Whitwell, 2014: Lost in translation: Exploring the ethical consumer intention-behavior gap. J. Bus. Res. , 67(1) , 2759–2767, doi:10.1016/j.jbusres.2012.09.022.
Cass, N., T. Schwanen, and E. Shove, 2018: Infrastructures, intersections and societal transformations. Technol. Forecast. Soc. Change, 137, 160–167, doi:10.1016/J.TECHFORE.2018.07.039.
Cassiers, I., K. Maréchal, and D. Méda, 2018: Post-growth economics and society: exploring the paths of a social and ecological transition. [Cassiers, I., K. Maréchal, and D. Méda, (eds.)]. Routledge, Abingdon, UK.
Castro, R. and P. Pasanen, 2019: How to design buildings with Life Cycle Assessment by accounting for the material flows in refurbishment. IOP Conf. Ser. Earth Environ. Sci. , 225(1) , doi:10.1088/1755-1315/225/1/012019.
Cazorla, M. and M. Toman, 2001: International Equity and Climate Change Policy. In: Climate Change Economics and Policy: An RFF Anthology[Toman, M., (ed.)], Routledge, Abingdon, UK, pp. 235–245.
Cervantes Barron, K., 2020: Adequate service provision as the guide for energy transitions and international development. University of Cambridge, Cambridge, UK, 212 pp. https://www.repository.cam.ac.uk/bitstream/handle/1810/323462/KCB_Thesis.pdf?sequence=1&isAllowed=y (Accessed September 26, 2021).
Ceschin, F. and C. Vezzoli, 2010: The role of public policy in stimulating radical environmental impact reduction in the automotive sector: The need to focus on product-service system innovation. Int. J. Automot. Technol. Manag. , 10(2–3) , doi:10.1504/IJATM.2010.032631.
Chakravarty, D. and J. Roy, 2016: The global south: New estimates and insights from urban India. In: Rethinking Climate and Energy Policies: New Perspectives on the Rebound Phenomenon[Santarius, T., H.J. Walnum, and C. Aall, (eds.)], Springer International Publishing, Cham, Switzerland, pp. 55–72.
Chakravarty, D. and J. Roy, 2021: Solar Microgrids in Rural India: A Case Study of Household Benefits. Ecol. Econ. Soc. INSEE J. , 4(2) , 65–93, doi:10.37773/EES.V4I2.140.
Chakravarty, S. et al., 2009: Sharing global CO2 emission reductions among one billion high emitters. Proc. Natl. Acad. Sci. , 106(29) , 11884–11888, doi:10.1073/pnas.0905232106.
Chan, S. et al., 2019: Promises and risks of nonstate action in climate and sustainability governance. Wiley Interdiscip. Rev. Clim. Change, 10(3) , 1–8, doi:10.1002/wcc.572.
Chancel, L., and T. Piketty, 2015: Carbon and inequality: from Kyoto to Paris Trends in the global inequality of carbon emissions (1998-2013) & prospects for an equitable adaptation fund. Paris School of Economics, Paris, France, 50 pp, http://piketty.pse.ens.fr/files/ChancelPiketty2015.pdf (Accessed July 4, 2019).
Chandra, A., K.E. McNamara, P. Dargusch, A.M. Caspe, and D. Dalabajan, 2017: Gendered vulnerabilities of smallholder farmers to climate change in conflict-prone areas: A case study from Mindanao, Philippines. J. Rural Stud. , 50, 45–59, doi:10.1016/j.jrurstud.2016.12.011.
Chanza, N. and A. De Wit, 2016: Enhancing climate governance through indigenous knowledge: Case in sustainability science. S. Afr. J. Sci. , 112(3–4) , doi:10.17159/sajs.2016/20140286.
Chapman, A. and T. Fraser, 2019: Japan’s mega solar boom: quantifying social equity expectations and realities at the local scale. Sustain. Sci. , 14(2) , 355–374, doi:10.1007/s11625-018-0613-y.
Chapman, A.J., B.C. Mclellan, and T. Tezuka, 2018: Prioritizing mitigation efforts considering co-benefits, equity and energy justice: Fossil fuel to renewable energy transition pathways. Appl. Energy, 219(2018) , 187–198, doi:10.1016/j.apenergy.2018.03.054.
Charmes, J., 2016: The Informal Economy: Definitions, Size, Contribution and Main Characteristics. In: The Informal Economy in Developing Nations: Hidden Engine of Innovation?[Kraemer-Mbula, E. and S. Wunsch-Vincent, (eds.)], Intellectual Property, Innovation and Economic Development , Cambridge University Press, Cambridge, UK, pp. 13–52.
Chaturvedi, B. and V. Gidwani, 2011: The Right to Waste: Informal Sector Recyclers and Struggles for Social Justice in Post-Reform Urban India. In: India’s New Economic Policy A Critical Analysis[Ahmed, W., A. Kundu, and R. Peet, (eds.)], Routledge, New York, NY, USA, pp. 125–153.
Chen, D. and R. Li-Hua, 2011: Modes of technological leapfrogging: Five case studies from China. J. Eng. Technol. Manag. , 28(1–2) , 93–108, doi:10.1016/j.jengtecman.2010.12.006.
Chen, V.L., M.A. Delmas, S.L. Locke, and A. Singh, 2017: Information strategies for energy conservation: A field experiment in India. Energy Econ. , 68(2017) , 215–227, doi:10.1016/j.dib.2017.11.084.
Chenoweth, J., 2009: Is tourism with a low impact on climate possible?Worldw. Hosp. Tour. Themes, 1(3) , 274–287, doi:10.1108/17554210910980611.
Cheon, A., 2020: Advocacy, social movements, and climate change. In: Handbook of U.S. Environmental Policy[Konisky, D.M. (ed.)], Edward Elgar Publishing, pp. 315–327.
Cheon, A. and J. Urpelainen, 2018: Activism and the fossil fuel industry. Routledge, Abingdon, UK, 242 pp.
Cherry, C., K. Scott, J. Barrett, and N. Pidgeon, 2018: Public acceptance of resource-efficiency strategies to mitigate climate change. Nat. Clim. Change, 8(11) , 1007–1012, doi:10.1038/s41558-018-0298-3.
Cherry, C.R., H. Yang, L.R. Jones, and M. He, 2016: Dynamics of electric bike ownership and use in Kunming, China. Transp. Policy, 45(1) , 127–135, doi:10.1016/j.tranpol.2015.09.007.
Cherry, T.L., S. Kallbekken, and S. Kroll, 2017: Accepting market failure: Cultural worldviews and the opposition to corrective environmental policies. J. Environ. Econ. Manage. , 85(9) , 193–204, doi:10.1016/j.jeem.2017.05.004.
Chester, M.V. and A. Horvath, 2009: Environmental assessment of passenger transportation should include infrastructure and supply chains. Environ. Res. Lett. , 4(2) , doi:10.1088/1748-9326/4/2/024008.
Chevigny, P., 2003: The populism of fear: Politics of crime in the Americas. Punishm. Soc. , 5(1) , 77–96, doi:10.1177/1462474503005001293.
Chhatre, A. and A. Agrawal, 2009: Trade-offs and synergies between carbon storage and livelihood benefits from forest commons. Proc. Natl. Acad. Sci. , 106(42) , 17667–17670, doi:10.1073/pnas.0905308106.
Chitnis, M., S. Sorrell, A. Druckman, S.K. Firth, and T. Jackson, 2013: Turning lights into flights: Estimating direct and indirect rebound effects for UK households. Energy Policy, 55, 234–250, doi:10.1016/j.enpol.2012.12.008.
Cho, D.-S., D.-J. Kim, and D.K. Rhee, 1998: Latecomer Strategies: Evidence from the Semiconductor Industry in Japan and Korea. Organ. Sci. , 9(4) , 489–505, doi.org/10.1287/orsc.9.4.489.
Chu, E., 2016: The political economy of urban climate adaptation and development planning in Surat, India. Environ. Plan. C Gov. Policy, 34(2) , 281–298, doi:10.1177/0263774X15614174.
Chu, S., 2015: Car restraint policies and mileage in Singapore. Transp. Res. Part A Policy Pract. , 77, 404–412, doi:10.1016/j.tra.2015.04.028.
Chuang, F., E. Manley, and A. Petersen, 2020: The role of worldviews in the governance of sustainable mobility. Proc. Natl. Acad. Sci. , 117(8) , 4034–4042, doi:10.1073/pnas.1916936117.
Chuku, C.A., 2010: Pursuing an integrated development and climate policy framework in Africa: Options for mainstreaming. Mitig. Adapt. Strateg. Glob. Change, 15(1) , 41–52, doi:10.1007/s11027-009-9203-8.
Churkina, G. et al., 2020: Buildings as a global carbon sink. Nat. Sustain. , 3(4) , 269–276, doi:10.1038/s41893-019-0462-4.
Cialdini, R.B., 2006: Influence: The psychology of persuasion. Harper Collins, New York, NY, USA.
Cirera, X. and W.F. Maloney, 2017: The Innovation Paradox: Developing-Country Capabilities and the Unrealized Promise of Technological Catch-Up. World Bank, Washington, DC, USA, 186 pp.
Claeys, P. and D. Delgado Pugley, 2017: Peasant and indigenous transnational social movements engaging with climate justice. Can. J. Dev. Stud. / Rev. Can. D’études du développement , 38(3) , 325–340, doi:10.1080/02255189.2016.1235018.
Clancy, J. and M. Feenstra, 2019: Women, Gender Equality and the Energy Transition in the EU. European Parliament’s Policy Department for Citizens’ Rights and Constitutional Affairs, Brussels, Belgium, https://www.europarl.europa.eu/RegData/etudes/STUD/2019/608867/IPOL_STU(2019)608867_EN.pdf .
Clancy, J. et al., 2019: Gender in the transition to sustainable energy for all: From evidence to inclusive policies. Energ. Int. Netw. Gend. Sustain. Energy, 1–105. https://energia.org/assets/2019/04/Gender-in-the-transition-to-sustainable-energy-for-all_-From-evidence-to-inclusive-policies_FINAL.pdf .
Clausen, J., E. Göll, and V. Tappeser, 2017: Sticky Transformation – How path dependencies in socio-technical regimes are impeding the transformation to a Green Economy. J. Innov. Manag. , 5(2) , 111–138, doi:10.1007/BF00727536.
Clayton, S., 2018: The Role of Perceived Justice, Political Ideology, and Individual or Collective Framing in Support for Environmental Policies. Soc. Justice Res. , 31(3) , 219–237, doi:10.1007/s11211-018-0303-z.
Clayton, S. et al., 2015: Psychological research and global climate change. Nat. Clim. Change, 5(7) , 640–646, doi:10.1038/nclimate2622.
Clewlow, R.R. and G.S. Mishra, 2017: Disruptive Transportation: The Adoption, Utilization, and Impacts of Ride-Hailing in the United States. UC Davis Institute of Transportation Studies, Davis, California.
Climact, 2018: Net Zero by 2050: from whether to how. Climact, Louvain-la-Neuve, Belgium, 35 pp. https://europeanclimate.org/wp-content/uploads/2019/11/09-18-net-zero-by-2050-from-whether-to-how.pdf (Accessed November 4, 2020).
Climate Assembly UK, 2020: The path to net zero. Climate Assembly UK, https://www.climateassembly.uk/report/read/final-report-exec-summary.pdf (Accessed December 10, 2020).
Climate Change Committee, 2020: Sixth Carbon Budget: The UK’s path to Net Zero. Climate Change Committee, London, UK. https://www.theccc.org.uk/publication/sixth-carbon-budget/ (Accessed September 7, 2021).
Cloutier, G. et al., 2015: Planning adaptation based on local actors’ knowledge and participation: a climate governance experiment. Clim. Policy, 15(4) , 458–474, doi:10.1080/14693062.2014.937388.
Coates, S.J., L.K. Andersen, and M.D. Boos, 2020: Balancing public health and private wealth: lessons on climate inaction from the COVID-19 pandemic. Int. J. Dermatol. , doi:10.1111/ijd.14917.
Cohen, M., 2017: Gendered Emissions: Counting Greenhouse Gas Emissions by Gender and Why it Matters. In: Climate Change and its Discontents[Fanelli, C. and B. Evans, (eds.)]. Alternate Routes Critical Social Research.
Cohen, T. and C. Cavoli, 2019: Automated vehicles: exploring possible consequences of government (non)intervention for congestion and accessibility. Transp. Rev. , 39(1) , 129–151, doi:10.1080/01441647.2018.1524401.
Colenbrander, S. et al., 2016: Can low-carbon urban development be pro-poor? The case of Kolkata, India. Environ. Urban. , 29(1) , 139–158, doi:10.1177/0956247816677775.
Collins, C., 2019: Can Improving Women’s Representation in Environmental Governance Reduce Greenhouse Gas Emissions?Climate Institute, New York, NY, USA, 7 pp. http://climate.org/can-improving-womens-representation-in-environmental-governance-reduce-greenhouse-gas-emissions/ (Accessed July 4, 2019).
Colville-Andersen, M., 2018: Copenhagenize: the definitive guide to global bicycle urbanism. Island Press, Washington, DC, USA, 275 pp.
Comin, D. and B. Hobijn, 2003: Cross-country technology adoption: Making the theories face the facts. Federal Reserve Bank of New York, New York, NY, USA, 49 pp. http://hdl.handle.net/10419/60558 (Accessed May 23, 2021).
Comin, D., M. Dmitriev, and E. Rossi-Hansberg, 2012: Heavy technology: The process of technological diffusion over time and space. VoxEU CEPR. https://voxeu.org/article/heavy-technology-process-technological-diffusion-over-time-and-space (Accessed August 4, 2020).
Conte Grand, M., 2016: Carbon emission targets and decoupling indicators. Ecol. Indic. , 67, 649–656, doi:10.1016/J.ECOLIND.2016.03.042.
Cook, G., T. Dowdall, D. Pomerantz, and Y. Wang, 2014: Clicking Clean: How Companies are Creating the Green Internet . Greenpeace Inc, Washington, DC, USA, https://www.greenpeace.org/usa/wp-content/uploads/legacy/Global/usa/planet3/PDFs/clickingclean.pdf (Accessed May 23, 2021).
Cook, G. et al., 2017: Clicking Clean: Who is Winning the Race to Build A Green Internet?Greenpeace Inc, Washington, DC, USA, 102 pp. http://www.clickclean.org/downloads/ClickClean2016%20HiRes.pdf . (Accessed May 23, 2021).
Cook, N.J., T. Grillos, and K.P. Andersson, 2019: Gender quotas increase the equality and effectiveness of climate policy interventions. Nat. Clim. Change, 9(4) , 330–334, doi:10.1038/s41558-019-0438-4.
Cook, S., M. Brucoli, and M. Stevns, 2016: Distributed Energy Systems: Flexible and Efficient Power for the New Energy Era. 64 pp. Arup & Siemens. https://www.arup.com/perspectives/publications/research/section/distributed-energy-systems-flexible-and-efficient-power-for-the-new-energy-era.
Copland, S., 2019: Anti-politics and Global Climate Inaction: The Case of the Australian Carbon Tax. Crit. Sociol. , 46(4–5) , 623–641, doi:10.1177/0896920519870230.
Cordella, M., F. Alfieri, and J. Sanfelix, 2021: Reducing the carbon footprint of ICT products through material efficiency strategies: A life cycle analysis of smartphones. J. Ind. Ecol. , 25(2) , 448–464, doi:10.1111/JIEC.13119.
Cory, J., M. Lerner, and I. Osgood, 2021: Supply Chain Linkages and the Extended Carbon Coalition. Am. J. Pol. Sci. , 65(1) , 69–87, doi:10.1111/AJPS.12525.
Costa, D.L., and M.E. Kahn, 2013: Energy conservation “nudges” and environmentalist ideology: Evidence from a randomized residential electricity field experiment. J. Eur. Econ. Assoc. , 11(3) , 680–702, doi:10.1111/jeea.12011.
Costa, V. and A. Johnson, 2019: Global Food and Nutrition Trends: Driving Positive Momentum for Grains. Cereal Foods World, 64(3) , doi:10.1094/CFW-64-3-0032.
Coulombel, N., V. Boutueil, L. Liu, V. Viguié, and B. Yin, 2019: Substantial rebound effects in urban ridesharing: Simulating travel decisions in Paris, France. Transp. Res. Part D Transp. Environ. , 71 (December 2018), 110–126, doi:10.1016/j.trd.2018.12.006.
Court, V. and S. Sorrell, 2020: Digitalisation of goods: A systematic review of the determinants and magnitude of the impacts on energy consumption. Environ. Res. Lett. , 15(4) , doi:10.1088/1748-9326/ab6788.
Cowan, R., 1990: Nuclear Power Reactors: A Study in Technological Lock-in. J. Econ. Hist. , 50(3) , 541–567, doi:10.1017/S0022050700037153.
Cowan, R., 1991: Tortoises and hares: Choice among technologies of unknown merit. Econ. J. , 101, 801–814, doi:10.1016/s0262-4079(11)61100-7.
Cowie, A., G. Berndes, and T. Smith, 2013: On the Timing of Greenhouse Gas Mitigation Benefits of Forest-Based Bioenergy. IEA Bioenergy. https://www.ieabioenergy.com/wp-content/uploads/2013/10/On-the-Timing-of-Greenhouse-Gas-Mitigation-Benefits-of-Forest-Based-Bioenergy.pdf .
Cramton, P., A. Ockenfels, and J. Tirole, 2017: Translating the Collective Climate Goal Into a Common Climate Commitment. Rev. Environ. Econ. Policy, 11(1) , 165–171, doi:10.1093/reep/rew015.
Crawford, N.C., 2019: Pentagon Fuel Use, Climate Change, and the Costs of War. 46 pp. Watson Institute of Public Affairs and Law, Brown University. https://watson.brown.edu/costsofwar/files/cow/imce/papers/Pentagon%20Fuel%20Use%2C%20Climate%20Change%20and%20the%20Costs%20of%20War%20Revised%20November%202019%20Crawford.pdf (Accessed October 31, 2019).
Creamer, E. et al., 2018: Community energy: Entanglements of community, state, and private sector. Geogr. Compass, 12(7) , doi:10.1111/gec3.12378.
Creutzig, F., 2019: The Mitigation Trinity: Coordinating Policies to Escalate Climate Mitigation. One Earth, 1(1) , 76–85, doi:10.1016/j.oneear.2019.08.007.
Creutzig, F. et al., 2015a: Transport: A roadblock to climate change mitigation?Science, 350(6263) , 911–912, doi:10.1126/science.aac8033.
Creutzig, F., G. Baiocchi, R. Bierkandt, P.-P.P. Pichler, and K.C. Seto, 2015b: Global typology of urban energy use and potentials for an urbanization mitigation wedge. Proc. Natl. Acad. Sci. , 112(20) , 6283–6288, doi:10.1073/pnas.1315545112.
Creutzig, F. et al., 2016a: Urban infrastructure choices structure climate solutions. Nat. Clim. Change, 6(12) , 1054, doi:10.1038/nclimate3169.
Creutzig, F. et al., 2016b: Beyond technology: demand-side solutions for climate change mitigation. Annu. Rev. Environ. Resour. , 41(1) , 173–198, doi:10.1146/annurev-environ-110615-085428.
Creutzig, F. et al., 2018: Towards demand-side solutions for mitigating climate change. Nat. Clim. Change, 8(4) , 260–263, doi:10.1038/s41558-018-0121-1.
Creutzig, F. et al., 2019a: Assessing human and environmental pressures of global land-use change 2000–2010. Glob. Sustain. , 2, doi:10.1017/SUS.2018.15.
Creutzig, F. et al., 2019b: Leveraging Digitalization for Sustainability in Urban Transport. Glob. Sustain. , 2 (e14), 1–6, doi:10.1017/sus.2019.11.
Creutzig, F. et al., 2020: Fair street space allocation: ethical principles and empirical insights. Transp. Rev. , 40(6) , 711–733, doi:10.1080/01441647.2020.1762795.
Creutzig, F. et al., 2021a: A typology of 100,000 publications on demand, services and social aspects of climate change mitigation. Environ. Res. Lett. , 16(3) , 033001, doi:10.1088/1748-9326/abd78b.
Creutzig, F. et al., 2021b: Demand-side solutions to climate change mitigation consistent with high levels of wellbeing. Nat. Clim. Change, 12, 36–46.
Creutzig, F. et al., 2021c: Considering sustainability thresholds for BECCS in IPCC and biodiversity assessments. GCB Bioenergy, 13(4) , 510–515, doi:10.1111/gcbb.12798.
Crick, F., S.M.S.U. Eskander, S. Fankhauser, and M. Diop, 2018a: How do African SMEs respond to climate risks? Evidence from Kenya and Senegal. World Dev. , 108, 157–168, doi:10.1016/j.worlddev.2018.03.015.
Crick, F., K.E. Gannon, M. Diop, and M. Sow, 2018b: Enabling private sector adaptation to climate change in sub-Saharan Africa. Wiley Interdiscip. Rev. Clim. Change, 9(2) , e505, doi:10.1002/wcc.505.
Cuenot, F., L. Fulton, and J. Staub, 2010: The prospect for modal shifts in passenger transport worldwide and impacts on energy use and CO2. Energy Policy, 41, 98–106, doi:10.1016/j.enpol.2010.07.017.
Cullen, J., 2017: Circular economy: theoretical benchmark or perpetual motion machine?Circ. Econ. , 21, 483–486, doi:10.1111/jiec.12599.
Cullen, J.M. and J.M. Allwood, 2010: Theoretical efficiency limits for energy conversion devices. Energy, 35(5) , 2059–2069, doi:10.1016/j.energy.2010.01.024.
Cunningham, P., J. Edler, K. Flanagan, and P. Laredo, 2013: Innovation policy mix and instrument interaction: a review. 47 pp. https://media.nesta.org.uk/documents/innovation_policy_mix_and_instrument_interaction.pdf .
Curnow, J. and A. Gross, 2016: Injustice is not an investment: student activism, climate justice, and the fossil fuel divestment campaign. In: Contemporary Youth Activism: Advancing Social Justice in the United States[Connor, J. and Rosen, S. (ed.)], ABC-CLIO, Santa Barbara, CA, USA, 433 pp.
Curran, G., 2020: Divestment, energy incumbency and the global political economy of energy transition: the case of Adani’s Carmichael mine in Australia. Clim. Policy, 20(8) , 949–962, doi:10.1080/14693062.2020.1756731.
Curtis, S.K. and M. Lehner, 2019: Defining the sharing economy for sustainability. Sustainability, 11(3) , doi:10.3390/su11030567.
D’Alessandro, S., A Cieplinski, T. Distefano, and P. Guarnieri, 2019: Societal transition for a sustainable economy. Agrochimica, Special Issue December 2019, pp. 293–336.
Dagnachew, A.G., P.L. Lucas, and D.P. van Vuuren, and A.F. Hof, 2019: Towards Universal Access to Clean Cooking Solutions in Sub-Saharan Africa: An integrated assessment of the cost, health and environmental implications of policies and targets. PBL Netherlands Environmental Assessment Agency, The Hague, the Netherlands, 60 pp. https://www.pbl.nl/sites/default/files/downloads/pbl-2019-clean-cooking-solutions-sub-saharan-africa_3421_0.pdf (Accessed July 22, 2020).
Dana, L.-P., C. Gurău, F. Hoy, V. Ramadani, and T. Alexander, 2021: Success factors and challenges of grassroots innovations: Learning from failure. Technol. Forecast. Soc. Change, 164(119600) , doi:10.1016/j.techfore.2019.03.009.
Dankelman, I., 2010: Gender and climate change: an introduction. [Dankelman, I., (ed.)]. Routledge/Earthscan, London, UK, 284 pp.
Dankelman, I. and W.H.M. Jansen, 2010: Gender, Environment and Climate Change: understanding the linkages. doi:10.4324/9781849775274.
Darby, S., 2006: The effectiveness of feedback on energy consumption: a review for DEFRA of the literature on metering, billing and direct displays. Environmental Change Institute, Oxford University, Oxford, UK, 24 pp. https://www.eci.ox.ac.uk/research/energy/downloads/smart-metering-report.pdf (Accessed November 28, 2020).
Darier, É. and R. Schüle, 1999: Think globally, act locally’? Climate change and public participation in Manchester and Frankfurt. Local Environ. , 4(3) , 317–329, doi:10.1080/13549839908725602.
Das, K., G. Pradhan, and S. Nonhebel, 2019: Human energy and time spent by women using cooking energy systems: A case study of Nepal. Energy, 182, 493–501, doi:10.1016/j.energy.2019.06.074.
Das, S. et al., 2016: Vehicle lightweighting energy use impacts in U.S. light-duty vehicle fleet. Sustain. Mater. Technol. , 8, 5–13, doi:10.1016/j.susmat.2016.04.001.
Dasgupta, A. and P. Dasgupta, 2017: Socially Embedded Preferences, Environmental Externalities, and Reproductive Rights. Popul. Dev. Rev. , 43(3) , 405–441, doi:10.1111/padr.12090.
Dasgupta, P., D. Southerton, A. Ulph, and D. Ulph, 2016: Consumer Behaviour with Environmental and Social Externalities: Implications for Analysis and Policy. Environ. Resour. Econ. , 65(1) , 191–226, doi:10.1007/s10640-015-9911-3.
Daube, M. and D. Ulph, 2016: Moral Behaviour, Altruism and Environmental Policy. Environ. Resour. Econ. , 63(2) , 505–522, doi:10.1007/s10640-014-9836-2.
David, M., 2017: Moving beyond the heuristic of creative destruction: Targeting exnovation with policy mixes for energy transitions. Energy Res. Soc. Sci. , 33, 138–146, doi:10.1016/j.erss.2017.09.023.
David Tàbara, J. et al., 2018: Positive tipping points in a rapidly warming world. Curr. Opin. Environ. Sustain. , 31, 120–129, doi:10.1016/j.cosust.2018.01.012.
Davidescu, S., R. Hiteva, and T. Maltby, 2018: Two steps forward, one step back: Renewable energy transitions in Bulgaria and Romania. Public Adm. , 96(3) , 611–625, doi:10.1111/padm.12522.
Davis, S., 1979: The Diffusion of Process Innovations. Cambridge University Press, Cambridge, UK, 193 pp.
Davis, S.J. and K. Caldeira, 2010: Consumption-based accounting of CO2 emissions. Proc. Natl. Acad. Sci. , 107(12) , 5687–5692, doi:10.1073/pnas.0906974107.
de Abreu e Silva, J., and P.C. Melo, 2018: Does home-based telework reduce household total travel? A path analysis using single and two worker British households. J. Transp. Geogr. , 73, 148–162, doi:10.1016/j.jtrangeo.2018.10.009.
De Boer, J., H. Schösler, and H. Aiking, 2014: “Meatless days” or “less but better”? Exploring strategies to adapt Western meat consumption to health and sustainability challenges. Appetite, 76, 120–128, doi:10.1016/j.appet.2014.02.002.
de Bortoli, A. and Z. Christoforou, 2020: Consequential LCA for territorial and multimodal transportation policies: method and application to the free-floating e-scooter disruption in Paris. J. Clean. Prod. , 273, 122898, doi:10.1016/J.JCLEPRO.2020.122898.
De Dominicis, S., R. Sokoloski, C.M. Jaeger, and P.W. Schultz, 2019: Making the smart meter social promotes long-term energy conservation. Palgrave Commun. , 5(1) , 1–8, doi:10.1057/s41599-019-0254-5.
de Feijter, F.J., B.J.M. van Vliet, and Y. Chen, 2019: Household inclusion in the governance of housing retrofitting: Analysing Chinese and Dutch systems of energy retrofit provision. Energy Res. Soc. Sci. , 53, 10–22, doi:10.1016/j.erss.2019.02.006.
De Rubens, Z.G., L. Noel, and B.K. Sovacool, 2018: Dismissive and deceptive car dealerships create barriers to electric vehicle adoption at the point of sale. Nat. Energy, 3, 501–507, doi:10.1038/s41560-018-0152-x.
De Stercke, S., 2014: Dynamics of Energy Systems: a Useful Perspective. International Institute for Applied Systems Analysis, Laxenburg, Austria, 68 pp. http://pure.iiasa.ac.at/id/eprint/11254/1/IR-14-013.pdf (Accessed July 22, 2020).
de Vries, A., 2018: Bitcoin’s Growing Energy Problem. Joule, 2(5) , 801–805, doi:10.1016/j.joule.2018.04.016.
de Zoysa, U., 2011: Millennium consumption goals: A fair proposal from the poor to the rich. Sustain. Sci. Pract. Policy, 7(1) , 1–5, doi:10.1080/15487733.2011.11908060.
Decancq, K., A. Decoster, and E. Schokkaert, 2009: The Evolution of World Inequality in Well-being. World Dev. , 37(1) , 11–25, doi:10.1016/j.worlddev.2007.12.006.
Dechezleprêtre, A., M. Glachant, and Y. Ménière, 2013: What Drives the International Transfer of Climate Change Mitigation Technologies? Empirical Evidence from Patent Data. Environ. Resour. Econ. , 54(2) , 161–178, doi:10.1007/s10640-012-9592-0.
Dechezleprêtre, A., E. Neumayer, and R. Perkins, 2015: Environmental regulation and the cross-border diffusion of new technology: Evidence from automobile patents. Res. Policy, 44(1) , 244–257, doi:10.1016/j.respol.2014.07.017.
Decker, K. et al., 2017: Conceptual Feasibility Study of the Hyperloop Vehicle for Next-Generation Transport . NASA, Cleveland, OH, USA, 22 pp. https://ntrs.nasa.gov/search.jsp?R=20170001624 (Accessed December 16, 2019).
della Porta, D. and L. Parks, 2014: Framing Processes in the Climate Movement: from climate change to climate justice. In: Handbook of the climate change movement [Dietz, M. and H. Garrelts, (eds.)], Routledge, New York, NY, USA, pp. 19–30.
Delmas, M.A., M. Fischlein, and O.I. Asensio, 2013: Information strategies and energy conservation behavior: A meta-analysis of experimental studies from 1975 to 2012. Energy Policy, 61, 729–739, doi:10.1016/j.enpol.2013.05.109.
Demski, C., C. Butler, K.A. Parkhill, A. Spence, and N.F. Pidgeon, 2015: Public values for energy system change. Glob. Environ. Change, 34, 59–69, doi:10.1016/j.gloenvcha.2015.06.014.
den Hartog, H. et al., 2018: Low-carbon promises and realities: Lessons from three socio-technical experiments in Shanghai. J. Clean. Prod. , 181, 692–702, doi:10.1016/j.jclepro.2018.02.003.
Dendup, N., and T.H. Arimura, 2019: Information leverage: The adoption of clean cooking fuel in Bhutan. Energy Policy, 125, 181–195, doi:10.1016/j.enpol.2018.10.054.
Deng, T. and J.D. Nelson, 2011: Recent developments in bus rapid transit: A review of the literature. Transp. Rev. , 31(1) , 69–96, doi:10.1080/01441647.2010.492455.
Dengler, C. and B. Strunk, 2018: The Monetized Economy Versus Care and the Environment: Degrowth Perspectives On Reconciling an Antagonism. Fem. Econ. , 24(3) , 160–183, doi:10.1080/13545701.2017.1383620.
Devaney, L., D. Torney, P. Brereton, and M. Coleman, 2020: Ireland’s Citizens’ Assembly on Climate Change: Lessons for Deliberative Public Engagement and Communication. Environ. Commun. , 14(2) , 141–146, doi:10.1080/17524032.2019.1708429.
Devine-Wright, P., 2009: Rethinking NIMBYism: The role of place attachment and place identity in explaining place-protective action. J. Community Appl. Soc. Psychol. , 19(6) , 426–441, doi:10.1002/casp.1004.
Devine-Wright, P., 2011: Public engagement with large-scale renewable energy technologies: Breaking the cycle of NIMBYism. Wiley Interdiscip. Rev. Clim. Change, 2(1) , 19–26, doi:10.1002/wcc.89.
Devine-Wright, P. et al., 2020: “Re-placed” – Reconsidering relationships with place and lessons from a pandemic. J. Environ. Psychol. , 72, 101514, doi:10.1016/j.jenvp.2020.101514.
Dewald, U. and B. Truffer, 2011: Market formation in technological innovation systems-diffusion of photovoltaic applications in Germany. Ind. Innov. , 18(3) , 285–300, doi:10.1080/13662716.2011.561028.
Dhar, S., M. Pathak, and P.R. Shukla, 2017: Electric vehicles and India’s low carbon passenger transport: a long-term co-benefits assessment. J. Clean. Prod. , 146, 139–148, doi:10.1016/j.jclepro.2016.05.111.
Di Chiro, G., 2019: Care not growth: Imagining a subsistence economy for all. Br. J. Polit. Int. Relations, 21(2) , 303–311, doi:10.1177/1369148119836349.
Di Gregorio, M. et al., 2019: Multi-level governance and power in climate change policy networks. Glob. Environ. Change, 54, 64–77, doi:10.1016/j.gloenvcha.2018.10.003.
Diao, M., H. Kong, and J. Zhao, 2021: Impacts of transportation network companies on urban mobility. Nat. Sustain. , 4(6) , 494–500, doi:10.1038/s41893-020-00678-z.
Dibb, S. and I. Fitzpatrick, 2014: Let’s talk about meat: changing dietary behaviour for the 21st century. Eating Better, 32 pp. https://www.eating-better.org/uploads/Documents/LetsTalkAboutMeat.pdf (Accessed December 10, 2019).
Dietrich, F. and C. List, 2016: Reason-based choice and context-dependence: an explanatory framework. Econ. Philos. , 32(2) , 175–229, doi:10.1017/S0266267115000474.
Dietz, T., 2014: Understanding environmentally significant consumption. Proc. Natl. Acad. Sci. , 111(14) , 5067–5068, doi:10.1073/pnas.1403169111.
Dietz, T. and P.C. Stern, 2008: Public participation in environmental assessment and decision making. National Academies Press, Washington, DC, USA, 305 pp.
Dietz, T., G.T. Gardner, J. Gilligan, P.C. Stern, and M.P. Vandenbergh, 2009: Household actions can provide a behavioral wedge to rapidly reduce US carbon emissions. Proc. Natl. Acad. Sci. , 106(44) , 18452–18456, doi:10.1073/pnas.0908738106.
Diffenbaugh, N.S. and M. Burke, 2019: Global warming has increased global economic inequality. Proc. Natl. Acad. Sci. , 116(20) , 9808–9813, doi:10.1073/pnas.1816020116.
Diffenbaugh, N.S. et al., 2020: The COVID-19 lockdowns: a window into the Earth System. Nat. Rev. Earth Environ. , 1(9) , 470–481, doi:10.1038/s43017-020-0079-1.
Ding, Q., X. Liang, H. Chen, M. Liu, and J. Yang, 2020: Study on Policy and Standard System of LED Lighting Industry in EU. E3S Web Conf. , 194, 2016, doi:10.1051/e3sconf/202019402016.
Djerf-Pierre, M., 2012: Green metacycles of attention: Reassessing the attention cycles of environmental news reporting 1961–2010. Public Underst. Sci. , 22(4) , 495–512, doi:10.1177/0963662511426819.
Docherty, I., G. Marsden, and J. Anable, 2018: The governance of smart mobility. Transp. Res. Part A Policy Pract. , 115 (October 2017), 114–125, doi:10.1016/j.tra.2017.09.012.
Dodson, J.C., P. Dérer, P. Cafaro, and F. Götmark, 2020: Population growth and climate change: Addressing the overlooked threat multiplier. Sci. Total Environ. , 748, 141346, doi:10.1016/J.SCITOTENV.2020.141346.
Dolan, P. and R. Metcalfe, 2013: Neighbors, Knowledge, and Nuggets: Two Natural Field Experiments on the Role of Incentives on Energy Conservation. CEP Discussion Papers dp1222, Centre for Economic Performance, London School of Economics and Political Science, London, UK, https://ideas.repec.org/p/cep/cepdps/dp1222.html.
Dombrowski, K., 2010: Filling the gap? An analysis of non-governmental organizations responses to participation and representation deficits in global climate governance. Int. Environ. Agreements Polit. Law Econ. , 10(4) , 397–416, doi:10.1007/s10784-010-9140-8.
Dombrowski, U., S. Ernst, and A. Reimer, 2016: A New Training for Factory Planning Engineers to Create Awareness of Climate Change. Procedia CIRP, 48, 443–448, doi:10.1016/j.procir.2016.04.083.
Dorling, D., 2019: Inequality and the 1%. 3rd ed. Verso, London, UK, 272 pp.
Douenne, T. and A. Fabre, 2019: Can We Reconcile French People with the Carbon Tax? Disentangling Beliefs from Preferences. FAERE, French Association of Environmental and Resource Economists.
Douenne, T. and A. Fabre, 2020: French attitudes on climate change, carbon taxation and other climate policies. Ecol. Econ. , 169, doi:10.1016/j.ecolecon.2019.106496.
Downs, A., 1972: Up and Down with Ecology: The Issue Attention Cycle. Public Interest , 28, pp. 38–50.
Doyal, L. and I. Gough, 1991: Introduction. In: A Theory of Human Need, Palgrave, London, UK, pp. 1–2.
Doyle, J., 2011: Where has all the oil gone? BP branding and the discursive elimination of climate change risk. In: Culture, environment and eco- politics[Heffernan, N. and D. Wragg, (eds.)], Cambridge Scholars Publishing, Newcastle, UK, pp. 200–225.
Doyle, J., N. Farrell, and M.K. Goodman, 2019: The cultural politics of climate branding: Project Sunlight, the biopolitics of climate care and the socialisation of the everyday sustainable consumption practices of citizens-consumers. Clim. Change, 163(1) , 117–133, doi:10.1007/s10584-019-02487-6.
Drews, S. and J.C.J.M. van den Bergh, 2016: What explains public support for climate policies? A review of empirical and experimental studies. Clim. Policy, 16(7) , 855–876, doi:10.1080/14693062.2015.1058240.
Dreyfus, G. et al., 2020: Assessment of climate and development benefits of efficient and climate-friendly cooling. Institute for Governance & Sustainable Development and Centro Mario Molina, La Jolla, CA, USA, https://ccacoalition.org/en/resources/assessment-climate-and-development-benefits-efficient-and-climate-friendly-cooling (Accessed December 9, 2020).
Drolet, J.L., 2021: Societal adaptation to climate change. In: The Impacts of Climate Change[Letcher, T.M., (ed.)], Elsevier, Amsterdam, the Netherlands, pp. 365–377.
Druckman, A. and T. Jackson, 2010: The bare necessities: How much household carbon do we really need?Ecol. Econ. , 69(9) , 1794–1804, doi:10.1016/j.ecolecon.2010.04.018.
Dryzek, J.S. et al., 2019: The crisis of democracy and the science of deliberation. Science, 363(6432) , 1144–1146, doi:10.1126/scienceaaw2694.
Dubash, N.K., 2013: The politics of climate change in India: Narratives of equity and cobenefits. Wiley Interdiscip. Rev. Clim. Change, 4(3) , 191–201, doi:10.1002/wcc.210.
Dubois, G. et al., 2019: It starts at home? Climate policies targeting household consumption and behavioral decisions are key to low-carbon futures. Energy Res. Soc. Sci. , 52, 144–158, doi:10.1016/j.erss.2019.02.001.
Dulal, H., K. Shah, and N. Ahmad, 2009: Social Equity Considerations in the Implementation of Caribbean Climate Change Adaptation Policies. Sustainability, 1(3) , 363–383, doi:10.3390/su1030363.
Duncan, G. and A. Gulbahar, 2019: Climate change mitigation and food loss and waste reduction: Exploring the business case. CCAFS Report No. 18. CGIAR Research Program on Climate Change, Wageningen, the Netherlands, https://ccafs.cgiar.org/resources/publications/climate-change-mitigation-and-food-loss-and-waste-reduction-exploring (Accessed August 25, 2021).
Dunlap, R.E., and A.M. McCright, 2015: Challenging climate change: The denial countermovement. In: Climate Change and Society: Sociological Perspective[Dunlap, R.E. and R.J. Brulle, (eds.)], Oxford University Press, Oxford, UK, pp. 300–332.
Dünnhoff, E. and M. Duscha, 2008: Effiziente Beratungsbausteine zur Minderung des Stromverbrauchs in privaten Haushalten. Endbericht [Efficient building blocks for energy counseling aimed at reducing electricity consumption in private households]. Inst. für Energie-und Umweltforsch.
Durán Heras, M.A. (ed.), 2012: Unpaid Work in the Global Economy. Fundación BBVA, Spain, 511 pp.
Dussaux, D., A. Dechezleprêtre, and M. Glachant, 2017: Intellectual property rights protection and the international transfer of low-carbon technologies. Centre for Climate Change Economics and Policy Working Paper No. 323, Grantham Research Institute on Climate Change and the Environment Working Paper No. 288, London, UK, 48 pp. https://www.lse.ac.uk/granthaminstitute/publication/intellectual-property-rights-protection-international-transfer-low-carbon-technologies/ (Accessed April 12, 2021).
Easterlin, R.A., L.A. McVey, M. Switek, O. Sawangfa, and J.S. Zweig, 2010: The happiness-income paradox revisited. Proc. Natl. Acad. Sci. , 107(52) , doi:10.1073/pnas.1015962107.
Eastin, J., 2018: Climate change and gender equality in developing states. World Dev. , 107, 289–305, doi:10.1016/j.worlddev.2018.02.021.
Eberhardt, L.C.M., H. Birgisdottir, and M. Birkved, 2019: Potential of Circular Economy in Sustainable Buildings. IOP Conf. Ser. Mater. Sci. Eng. , 471(9) , doi:10.1088/1757-899X/471/9/092051.
Edjabou, L.D. and S. Smed, 2013: The effect of using consumption taxes on foods to promote climate friendly diets – The case of Denmark. Food Policy, 39, 84–96, doi:10.1016/j.foodpol.2012.12.004.
Edmondson, D.L., F. Kern, and K.S. Rogge, 2019: The co-evolution of policy mixes and socio-technical systems: Towards a conceptual framework of policy mix feedback in sustainability transitions. Res. Policy, 48(10) , Article 103555, doi:10.1016/j.respol.2018.03.010.
Eguiguren-Cosmelli, J.M., 2018: Responsiveness of low-income households to hybrid price/non-price policies in the presence of energy shortages: evidence from Colombia. Energy Effic. , 11(3) , 641–661, doi:10.1007/S12053-017-9595-3.
Ehrhardt-Martinez, K., 2015: Behaviour wedge profiles for cities. eceee 2015 Summer Study energy Effic. First fuel now, Panel: 3. , 691–702.
Ehrhardt-Martinez, K., K.A. Donnelly, and J.A. Laitner, 2010: Advanced Metering Initiatives and Residential Feedback Programs: A Meta-Review for Household Electricity-Saving Opportunities. American Council for an Energy-Efficient Economy, Washington, DC, USA, 140 pp. https://www.aceee.org/sites/default/files/publications/researchreports/e105.pdf (Accessed February 13, 2020).
Ehrlich, P.R., and A.H. Ehrlich, 2013: Can a collapse of global civilization be avoided?Proc. R. Soc. B Biol. Sci. , 280(1754) , 1–9, doi:10.1098/rspb.2012.2845.
Elias, T., N.S. Dahmen, D.D. Morrison, D. Morrison, and D.L. Morris, 2018: Understanding Climate Change Perceptions and Attitudes Across Racial/Ethnic Groups. Howard J. Commun. , 30(1) , 38–56, doi:10.1080/10646175.2018.1439420.
Ellenbeck, S. and J. Lilliestam, 2019: How modelers construct energy costs: Discursive elements in Energy System and Integrated Assessment Models. Energy Res. Soc. Sci. , 47, 69–77, doi:10.1016/j.erss.2018.08.021.
Elliot, S., 2011: Transdisciplinary Perspectives on Environmental Sustainability: A Resource Base and Framework for IT-Enabled Business Transformation. MIS Q. , 35(1) , 197, doi:10.2307/23043495.
Elnakat, A. and J.D. Gomez, 2015: Energy engenderment: An industrialized perspective assessing the importance of engaging women in residential energy consumption management. Energy Policy, 82(1) , 166–177, doi:10.1016/j.enpol.2015.03.014.
Enoch, M.P. and J. Taylor, 2006: A worldwide review of support mechanisms for car clubs. Transp. Policy, 13(5) , 434–443, doi:10.1016/J.TRANPOL.2006.04.001.
Erb, K.-H. et al., 2016: Exploring the biophysical option space for feeding the world without deforestation. Nat. Clim. Change, 48(7) , 829–834, doi.org/10.1038/ncomms11382.
Erdmann, L. and L.M. Hilty, 2010: Scenario Analysis. J. Ind. Ecol. , 14(5) , 826–843, doi:10.1111/J.1530-9290.2010.00277.X.
Ergas, C. and R. York, 2012: Women’s status and carbon dioxide emissions: A quantitative cross-national analysis. Soc. Sci. Res. , 41(4) , 965–976, doi:10.1016/j.ssresearch.2012.03.008.
Erwin, A. et al., 2021: Intersectionality shapes adaptation to social-ecological change. World Dev. , 138, 105282, doi:10.1016/J.WORLDDEV.2020.105282.
ESRB, 2016: Too late, too sudden: Transition to a low-carbon economy and systemic risk. European Systemic Risk Board, Frankfurt am Main, Germany.
Ettlinger, N., 2017: Open innovation and its discontents. Geoforum, 80, 61–71, doi:10.1016/j.geoforum.2017.01.011.
Eurostat, 2018: Glossary: Material deprivation. Eurostat Stat. Explain. , https://ec.europa.eu/eurostat/statistics-explained/index.php?title=Glossary:Material_deprivation_rate (Accessed February 21, 2019).
Fagan, M. and C. Huang, 2019: How people worldwide view climate change. Pew Research Center. https://www.pewresearch.org/fact-tank/2019/04/18/a-look-at-how-people-around-the-world-view-climate-change/ (Accessed November 30, 2019).
Fairbrother, M., I. Johansson Sevä, and J. Kulin, 2019: Political trust and the relationship between climate change beliefs and support for fossil fuel taxes: Evidence from a survey of 23 European countries. Glob. Environ. Change, 59, doi:10.1016/j.gloenvcha.2019.102003.
Fanning, A.L. and D.W. O’Neill, 2019: The Wellbeing–Consumption paradox: Happiness, health, income, and carbon emissions in growing versus non-growing economies. J. Clean. Prod. , 212, 810–821, doi:10.1016/j.jclepro.2018.11.223.
Farmer, J.D. et al., 2019: Sensitive intervention points in the post-carbon transition. Science, 364(6436) , 132–134, doi:10.1126/science.aaw7287.
Faruqui, A., S. Sergici, and A. Sharif, 2010: The impact of informational feedback on energy consumption – A survey of the experimental evidence. Energy, 35(4) , 1598–1608, doi:10.1016/j.energy.2009.07.042.
Favier, A., C. De Wolf, K. Scrivener, and G. Habert, 2018: A sustainable future for the European Cement and Concrete Industry. ETH Zurich, Zürich, Switzerland.
Fawcett, T., J. Rosenow, and P. Bertoldi, 2019: Energy efficiency obligation schemes: their future in the EU. Energy Effic. , 12(1) , 57–71, doi:10.1007/s12053-018-9657-1.
Feder, G. and D.L. Umali, 1993: The adoption of agricultural innovations: A review. Technol. Forecast. Soc. Change, 43(3) , 215–239, doi.org/10.1016/0040-1625(93)90053-A.
Fedrigo, D. et al., 2010: Sustainable Consumption and Production. J. Ind. Ecol. , 14(1) , 10–12, doi.org/10.1111/j.1530-9290.2009.00214.x.
Fell, M.J., 2017: Energy services : A conceptual review. Energy Res. Soc. Sci. , 27(2017) , 129–140, doi:10.1016/j.erss.2017.02.010.
Fernström Nåtby, K. and H. Rönnerfalk, 2018: Gender Equality and CO2-Emissions: A Panel Data Study. Lund University, Department of Economics, Sweden, 40 pp. https://lup.lub.lu.se/student-papers/search/publication/8934039 (Accessed July 4, 2019).
Fichter, K. and J. Clausen, 2016: Diffusion Dynamics of Sustainable Innovation – Insights on Diffusion Patterns Based on the Analysis of 100 Sustainable Product and Service Innovations. J. Innov. Manag. , 4(2) , 30–67, doi:10.24840/2183-0606_004.002_0004.
Figge, F., W. Young, and R. Barkemeyer, 2014: Sufficiency or efficiency to achieve lower resource consumption and emissions? I role of the rebound effect. J. Clean. Prod. , 69, 216–224, doi:10.1016/j.jclepro.2014.01.031.
Firnkorn, J. and M. Müller, 2011: What will be the environmental effects of new free-floating car-sharing systems? The case of car2go in Ulm. Ecol. Econ. , 70(8) , 1519–1528, doi:10.1016/j.ecolecon.2011.03.014.
Fischedick, M., J. Roy, A. Abdel-Aziz, A. Acquaye, J. Allwood, J.P. Ceron, Y. Geng, H. Kheshgi, A. Lanza, D. Perczyk, L. Price, E. Santalla, C. Sheinbaum, and K. Tanaka, Kanako, 2014: Industry. In: Climate Change 2014: Mitigation of Climate Change. Contri-bution of Working Group III to the Fifth Assessment Report of the Intergovernmental Panel on Climate Change[Edenhofer, O., R. Pichs-Madruga, Y. Sokona, E. Farahani, S. Kadner, K. Seyboth, A. Adler, I. Baum, S. Brunner, P. Eickemeier, B. Kriemann, J. Savolainen, S. Schlömer, C. von Stechow, T. Zwickel and J.C. Minx, (eds.)], Cambridge University Press, Cambridge, UK and New York, NY, USA, pp. 739–810.
Fischer-Kowalski, M. et al., 2011: Methodology and indicators of economy-wide material flow accounting: State of the art and reliability across sources. J. Ind. Ecol. , 15(6) , 855–876, doi:10.1111/j.1530-9290.2011.00366.x.
Fischer, C., 2008: Feedback on household electricity consumption: A tool for saving energy?Energy Effic. , 1(1) , 79–104, doi:10.1007/s12053-008-9009-7.
Fisher, D.R., 2019: The broader importance of #FridaysForFuture. Nat. Clim. Change, 9(6) , 430–431, doi:10.1038/s41558-019-0484-y.
Fisher, D.R. and S. Nasrin, 2020: Climate activism and its effects. Wiley Interdiscip. Rev. Clim. Change, 12(1) , doi:10.1002/wcc.683.
Fishman, E., S. Washington, and N. Haworth, 2014: Bike share’s impact on car use: Evidence from the United States, Great Britain, and Australia. Transp. Res. Part D Transp. Environ. , 31, 13–20, doi:10.1016/j.trd.2014.05.013.
Fitzgerald, J.B., A.K. Jorgenson, and B. Clark, 2015: Energy consumption and working hours: a longitudinal study of developed and developing nations, 1990–2008. Environ. Sociol. , 1(3) , 213–223, doi:10.1080/23251042.2015.1046584.
Fitzgerald, J.B., J.B. Schor, and A.K. Jorgenson, 2018: Working Hours and Carbon Dioxide Emissions in the United States, 2007–2013. Soc. Forces, 96(4) , 1851–1874, doi:10.1093/SF/SOY014.
Flatø, M., R. Muttarak, and A. Pelser, 2017: Women, Weather, and Woes: The Triangular Dynamics of Female-Headed Households, Economic Vulnerability, and Climate Variability in South Africa. World Dev. , 90, 41–62, doi:10.1016/j.worlddev.2016.08.015.
Fleurbaey, M. and K. Tadenuma, 2014: Universal Social Orderings: An Integrated Theory of Policy Evaluation, Inter-Society Comparisons, and Interpersonal Comparisons. Rev. Econ. Stud. , 81(3) , 1071–1101, doi:10.1093/restud/rdu006.
Flyvbjerg, B., 2020: The law of regression to the tail: How to survive Covid-19, the climate crisis, and other disasters. Environ. Sci. Policy, 114(2020) , 614–618, doi:10.1016/j.envsci.2020.08.013.
Forster, H.A., H. Kunreuther, and E.U. Weber, 2021: Planet or pocketbook? Environmental motives complement financial motives for energy efficiency across the political spectrum in the United States. Energy Res. Soc. Sci. , 74, 101938, doi:10.1016/j.erss.2021.101938.
Forti V., Baldé C.P., Kuehr R., B.G., 2020: The Global E-waste Monitor 2020: Quantities, flows and the circular economy potential. United Nations University (UNU)/United Nations Institute for Training and Research (UNITAR) – co-hosted SCYCLE Programme, International Telecommunication Union (ITU) & International Solid Waste Association (ISWA), Bonn/Geneva/Rotterdam, 120 pp. https://www.itu.int/en/ITU-D/Environment/Documents/Toolbox/GEM_2020_def.pdf .
Fortnam, M. et al., 2019: The Gendered Nature of Ecosystem Services. Ecol. Econ. , 159, 312–325, doi:10.1016/j.ecolecon.2018.12.018.
Fox-Glassman, K.T. and E.U. Weber, 2016: What makes risk acceptable? Revisiting the 1978 psychological dimensions of perceptions of technological risks. J. Math. Psychol. , 75, 157–169, doi:10.1016/j.jmp.2016.05.003.
Foxon, T., Z. Makuch, M. Mata, and P. Pearson, 2004: Governance for Industrial Transformation. 96–112 pp.
Franceschini, S. and F. Alkemade, 2016: Non-disruptive regime changes – The case of competing energy efficient lighting trajectories. Environ. Innov. Soc. Transitions, 21, 56–68, doi:10.1016/j.eist.2016.04.003.
Franceschini, S., M. Borup, and J. Rosales-Carreón, 2018: Future indoor light and associated energy consumption based on professionals’ visions: A practice- and network-oriented analysis. Technol. Forecast. Soc. Change, 129, 1–11, doi:10.1016/j.techfore.2018.01.013.
Frank, L.D., A. Hong, and V.D. Ngo, 2019: Causal evaluation of urban greenway retrofit: A longitudinal study on physical activity and sedentary behavior. Prev. Med. (Baltim). , 123, 109–116, doi:10.1016/j.ypmed.2019.01.011.
Frank, R.H., 1999: Luxury Fever: Weighing the Cost of Excess. Princeton University Press, Princeton, NJ, USA.
Frank, R.H., 2020: Under the Influence: Putting Peer Pressure to Work. Princeton University Press, Princeton, NJ, USA.
Frank, S., 2017: Reducing greenhouse gas emissions in agriculture without compromising food security?Environ. Res. Lett. , 12, doi:10.1088/1748-9326/aa8c83.
Fraune, C. and M. Knodt, 2018: Sustainable energy transformations in an age of populism, post-truth politics, and local resistance. Energy Res. Soc. Sci. , 43, 1–7, doi:10.1016/j.erss.2018.05.029.
Fremstad, A., 2017: Does Craigslist Reduce Waste? Evidence from California and Florida. Ecol. Econ. , 132, 135–143, doi:10.1016/J.ECOLECON.2016.10.018.
Fremstad, A. and M. Paul, 2019: The Impact of a Carbon Tax on Inequality. Ecol. Econ. , 163, 88–97, doi:10.1016/j.ecolecon.2019.04.016.
Frenken, K., 2017: Political economies and environmental futures for the sharing economy. Philos. Trans. R. Soc. A Math. Phys. Eng. Sci. , 375(2095) , doi:10.1098/rsta.2016.0367.
Friedmann, R. and C. Sheinbaum, 1998: Mexican electric end-use efficiency: Experiences to date. Annu. Rev. Energy Environ. , 23(1) , 225–252, doi:10.1146/annurev.energy.23.1.225.
Fritze, J.C.G., G.A. Blashki, S. Burke, and J. Wiseman, 2008: Hope, despair and transformation: Climate change and the promotion of mental health and wellbeing. Int. J. Ment. Health Syst. , 2(1) , 13, doi:10.1186/1752-4458-2-13.
Frongillo, E.A., H.T. Nguyen, M.D. Smith, and A. Coleman-Jensen, 2019: Food Insecurity Is More Strongly Associated with Poor Subjective Well-Being in More-Developed Countries than in Less-Developed Countries. J. Nutr. , 149(2) , 330–335, doi:10.1093/jn/nxy261.
Frye, I. et al., 2018: Decent Standard of Living Index: Final Report . 1–69 pp. http://spii.org.za/wp-content/uploads/2018/11/DSL-Report-SD-v3.doc.pdf (Accessed November 30, 2019).
Fujimori, S., M. Kainuma, T. Masui, T. Hasegawa, and H. Dai, 2014: The effectiveness of energy service demand reduction: A scenario analysis of global climate change mitigation. Energy Policy, 75, doi:10.1016/j.enpol.2014.09.015.
Fulton, L., P. Cazzola, and F. Cuenot, 2009: IEA Mobility Model (MoMo) and its use in the ETP 2008. Energy Policy, 37(10) , 3758–3768, doi:10.1016/j.enpol.2009.07.065.
Fumo, N., 2014: A review on the basics of building energy estimation. Renew. Sustain. Energy Rev. , 31, 53–60, doi:10.1016/j.rser.2013.11.040.
Fuso Nerini, F. et al., 2018: Mapping synergies and trade-offs between energy and the Sustainable Development Goals. Nat. Energy, 3(1) , 10–15, doi:10.1038/s41560-017-0036-5.
Gabriel, C.A. and C. Bond, 2019: Need, Entitlement and Desert: A Distributive Justice Framework for Consumption Degrowth. Ecol. Econ. , 156, 327–336, doi:10.1016/j.ecolecon.2018.10.006.
Gach, E., 2019: Normative Shifts in the Global Conception of Climate Change: The Growth of Climate Justice. Soc. Sci. , 8(1) , 24, doi:10.3390/socsci8010024.
Gadrey, J. and F. Jany-Catrice, 2006: The new indicators of well-being and development . Palgrave Macmillan, London, UK, 135 pp.
Galaskiewicz, J., 1985: Professional Networks and the Institutionalization of a Single Mind Set. Am. Sociol. Rev. , 50(5) , 639–658, doi:10.2307/2095379.
Gallagher, K.P. and L. Zarsky, 2007: The enclave economy: foreign investment and sustainable development in Mexico’s Silicon Valley. [Gottlieb, R. and H.R. Luce, (eds.)]. Massachusetts Institute of Technology, Cambridge, MA, USA, and London, UK, 214 pp.
Gallagher, K.S., 2006: Limits to leapfrogging in energy technologies? Evidence from the Chinese automobile industry. Energy Policy, 34(4) , 383–394, doi:10.1016/j.enpol.2004.06.005.
Gallego-Schmid, A., H.M. Chen, M. Sharmina, and J.M.F. Mendoza, 2020: Links between circular economy and climate change mitigation in the built environment. J. Clean. Prod. , 260, 121115, doi:10.1016/j.jclepro.2020.121115.
Gallie, W.B., 1955: Essentially Contested Concepts. Proc. Aristot. Soc. , 56, 167–198, doi:10.2307/4544562.
Ganglmair-Wooliscroft, A. and B. Wooliscroft, 2019: Well-Being and Everyday Ethical Consumption. J. Happiness Stud. , 20(1) , 141–163, doi:10.1007/s10902-017-9944-0.
Garg, A., 2011: Pro-equity Effects of Ancillary Benefits of Climate Change Policies: A Case Study of Human Health Impacts of Outdoor Air Pollution in New Delhi. World Dev. , 39(6) , 1002–1025, doi:10.1016/j.worlddev.2010.01.003.
Garland, A.M. (ed) 2015: Urban Opportunities: Perspectives on Climate Change, Resilience, Inclusion, and the Informal Economy. Wilson Center, Washington, DC, USA, 181 pp.
Garnett, T., 2011: Where are the best opportunities for reducing greenhouse gas emissions in the food system (including the food chain)?Food Policy, 36 (SUPPL. 1), doi:10.1016/j.foodpol.2010.10.010.
Garvey, A., J.B. Norman, A. Owen, and J. Barrett, 2021: Towards net zero nutrition: The contribution of demand-side change to mitigating UK food emissions. J. Clean. Prod. , 290, 125672, doi:10.1016/J.JCLEPRO.2020.125672.
Gebler, M., A.J.M. Schoot Uiterkamp, and C. Visser, 2014: A global sustainability perspective on 3D printing technologies. Energy Policy, 74 (C), doi:10.1016/j.enpol.2014.08.033.
Gebreslassie, M.G., 2020: Solar home systems in Ethiopia: Sustainability challenges and policy directions. Sustain. Energy Technol. Assessments, 42, doi:10.1016/j.seta.2020.100880.
Geels, F. and R. Raven, 2006: Non-linearity and expectations in niche-development trajectories: Ups and downs in Dutch biogas development (1973–2003). Technol. Anal. Strateg. Manag. , 18(3–4) , 375–392, doi:10.1080/09537320600777143.
Geels, F.W., 2020: Changing the Climate Change Discourse. Joule, 4(1) , 18–20, doi:10.1016/J.JOULE.2019.12.011.
Geels, F.W., B.K. Sovacool, T. Schwanen, and S. Sorrell, 2017: Sociotechnical transitions for deep decarbonization. Science, 357(6357) , 1242–1244, doi:10.1126/science.aao3760.
Geels, F.W., T. Schwanen, S. Sorrell, K. Jenkins, and B.K. Sovacool, 2018: Reducing energy demand through low carbon innovation: A sociotechnical transitions perspective and thirteen research debates. Energy Res. Soc. Sci. , 40, 23–35, doi:10.1016/j.erss.2017.11.003.
Geffner, T., 2017: Land Use Zoning in America: The Case for Inclusionary Policy. Anthós, 8(1) , doi:10.15760/anthos.2017.49.
Gehl, J., B.B. Svarre, and J. Risom, 2011: Cities for People. Plan. News, 37(4) , 6–8.
Gelenbe, E. and Y. Caseau, 2015: The impact of information technology on energy consumption and carbon emissions. Ubiquity, 1530–2180 (June), 1–15, doi:10.1145/2755977.
Ghesla, C., M. Grieder, and R. Schubert, 2020: Nudging the poor and the rich – A field study on the distributional effects of green electricity defaults. Energy Econ. , 86, doi:10.1016/j.eneco.2019.104616.
Ghisellini, P., M. Ripa, and S. Ulgiati, 2018: Exploring environmental and economic costs and benefits of a circular economy approach to the construction and demolition sector. A literature review. J. Clean. Prod. , 178, 618–643, doi:10.1016/j.jclepro.2017.11.207.
Gholami, R., A.B. Sulaiman, T. Ramayah, and A. Molla, 2013: Senior managers’ perception on green information systems (IS) adoption and environmental performance: Results from a field survey. Inf. Manag. , 50(7) , 431–438, doi:10.1016/J.IM.2013.01.004.
Ghosh, A., 2016: The great derangement . University of Chicago Press, Chicago, IL, USA, 182 pp.
Ghosh, B., 2019: Transformation beyond experimentation: Sustainability transitions in megacities. University of Sussex, Brighton, UK, 246 pp. http://sro.sussex.ac.uk/id/eprint/82511/ (Accessed December 10, 2019).
Ghosh, B. and J. Schot, 2019: Towards a novel regime change framework: Studying mobility transitions in public transport regimes in an Indian megacity. Energy Res. Soc. Sci. , 51, 82–95, doi:10.1016/J.ERSS.2018.12.001.
Gifford, R., 2011: The Dragons of Inaction: Psychological Barriers That Limit Climate Change Mitigation and Adaptation. Am. Psychol. , 66(4) , 290–302, doi:10.1037/a0023566.
Gimpel, H., V. Graf, and V. Graf-Drasch, 2020: A comprehensive model for individuals’ acceptance of smart energy technology – A meta-analysis. Energy Policy, 138 (March 2020), 111196, doi:10.1016/j.enpol.2019.111196.
Girod, B. and P. De Haan, 2010: More or Better? A Model for Changes in Household Greenhouse Gas Emissions due to Higher Income. J. Ind. Ecol. , 14(1) , 31–49, doi:10.1111/j.1530-9290.2009.00202.x.
Givoni, M., 2014: Addressing transport policy challenges through policy-packaging. Transp. Res. Part A Policy Pract. , 60, 1–8, doi:10.1016/j.tra.2013.10.012.
Givoni, M., J. Macmillen, D. Banister, and E. Feitelson, 2013: From Policy Measures to Policy Packages. Transp. Rev. , 33(1) , 1–20, doi:10.1080/01441647.2012.744779.
Glemarec, Y., F. Bayat-Renoux, and O. Waissbein, 2016: Removing barriers to women entrepreneurs’ engagement in decentralized sustainable energy solutions for the poor. AIMS Energy, 4(1) , 136–172, doi:10.3934/energy.2016.1.136.
Globisch, J., P. Plötz, E. Dütschke, and M. Wietschel, 2018: Consumer evaluation of public charging infrastructure for electric vehicles. Fraunhofer-Institut für System- und Innovationsforschung ISI, Karlsruhe, http://nbn-resolving.de/urn:nbn:de:0011-n-497713-14.
Gnann, T. et al., 2018: Fast charging infrastructure for electric vehicles: Today’s situation and future needs. Transp. Res. Part D Transp. Environ. , 62, 314–329, doi:10.1016/j.trd.2018.03.004.
Göckeritz, S. et al., 2010: Descriptive mormative belief and conservative behaviour: The moderating roles of personal involvement and injunctive normative belief. Eur. J. Soc. Psychol. , 40, 514–523, doi:10.1002/ejsp.643.
Godfray, H. et al., 2018: Meat consumption, health, and the environment. Science, 361(6399) , doi:10.1126/science.aam5324.
Godfray, H.C.J. and T. Garnett, 2014: Food security and sustainable intensification. Philos. Trans. R. Soc. London B Biol. Sci. , 369(1639) , 20120273, doi:10.1098/rstb.2012.0273.
Godfrey, P. and D. Torres (eds.), 2016: Systemic Crises of Global Climate Change: Intersection of race, class and gender. Routledge, Abingdon, UK and New York, NY, USA.
Goldberg, T., 2017: What about the Circularity of Hazardous Materials?J. Ind. Ecol. , 21(3) , 491–493, doi:10.1111/jiec.12585.
Goldemberg, J., 1991: Leapfrogging: A New Energy Policy for Developing Countries. World Energy Counc. , 27–30.
Goldemberg, J., T.B. Johansson, A.K.N. Reddy, and R.H. Williams, 1985: Basic needs and much more with one kilowatt per capita (energy). Ambio, 14(4–5) , 190–200, doi:10.2307/4313148.
Goldemberg, J., T.B. Johansson, A.K.N. Reddy, and R.H. Williams, 1988: Energy for a sustainable world. Wiley-Eastern, New Delhi, India.
Goldthau, A., 2014: Rethinking the governance of energy infrastructure: Scale, decentralization and polycentrism. Energy Res. Soc. Sci. , 1, 134–140, doi:10.1016/j.erss.2014.02.009.
Golley, J. and X. Meng, 2012: Income inequality and carbon dioxide emissions: The case of Chinese urban households. Energy Econ. , 34(6) , 1864–1872, doi:10.1016/J.ENECO.2012.07.025.
Gölz, S. and U.J.J. Hahnel, 2016: What motivates people to use energy feedback systems? A multiple goal approach to predict long-term usage behaviour in daily life. Energy Res. Soc. Sci. , 21, 155–166, doi:10.1016/j.erss.2016.07.006.
Gonzalez, C.G., 2020: Climate Change, Race, and Migration. J. Law Polit. Econ., 1(1) , 109–146, doi:10.4337/JHRE.2016.01.02.
Goodman, A., S. Sahlqvist, and D. Ogilvie, 2013: Who uses new walking and cycling infrastructure and how? Longitudinal results from the UK iConnect study. Prev. Med. (Baltim). , 57(5) , 518–524, doi:10.1016/j.ypmed.2013.07.007.
Goodman, A., S. Sahlqvist, and D. Ogilvie, 2014: New walking and cycling routes and increased physical activity: One- and 2-year findings from the UK iConnect study. Am. J. Public Health, 104(9) , 38–46, doi:10.2105/AJPH.2014.302059.
Goodman, J., 2009: From global justice to climate justice? Justice ecologism in an era of global warming. New Polit. Sci. , 31(4) , 499–514, doi:10.1080/07393140903322570.
Goodrich, C.G., P.B. Udas, and H. Larrington-Spencer, 2019: Conceptualizing gendered vulnerability to climate change in the Hindu Kush Himalaya: Contextual conditions and drivers of change. Environ. Dev. , 31, 9–18, doi:10.1016/j.envdev.2018.11.003.
Gore, T., 2015: Extreme Carbon Inequality: Why the Paris climate deal must put the poorest, lowest emitting and most vulnerable people first . Oxfam International, London, UK, 14 pp. https://oxfamilibrary.openrepository.com/handle/10546/582545 (Accessed September 12, 2019).
Gore, T., 2020: Confronting carbon inequality. Oxfam, https://www.oxfam.org/en/research/confronting-carbon-inequality (Accessed October 2, 2021).
Gori-Maia, A., 2013: Relative Income, Inequality and Subjective Wellbeing: Evidence for Brazil. Soc. Indic. Res. , 113(3) , 1193–1204, doi:10.1007/s11205-012-0135-4.
Gossart, C., 2015: Rebound Effects and ICT: A Review of the Literature. In: ICT Innovations for Sustainability[Hilty, L.M. and B. Aebischer, (eds.)], Springer, ETH Zurich, Switzerland, pp. 435–448.
Gössling, S., 2019: Celebrities, air travel, and social norms. Ann. Tour. Res. , 79, 102775, doi:10.1016/j.annals.2019.102775.
Gössling, S. and A. Humpe, 2020: The global scale, distribution and growth of aviation: Implications for climate change. Glob. Environ. Change, 65, 102194, doi:10.1016/j.gloenvcha.2020.102194.
Gota, S., C. Huizenga, K. Peet, N. Medimorec, and S. Bakker, 2019: Decarbonising transport to achieve Paris Agreement targets. Energy Effic. , 12(2) , 363–386, doi:10.1007/s12053-018-9671-3.
Gough, I., 2015: Climate change and sustainable welfare: the centrality of human needs. Cambridge J. Econ. , 39, 1191–1214, doi:10.1093/cje/bev039.
Gough, I., 2017: Heat, Greed and Human Need: Climate Change, Capitalism and Sustainable Wellbeing. Elgar, London, UK, 283 pp.
Gould, C.F. and J. Urpelainen, 2018: LPG as a clean cooking fuel: Adoption, use, and impact in rural India. Energy Policy, 122, 395–408, doi:10.1016/j.enpol.2018.07.042.
Gould, C.F. et al., 2018: Government policy, clean fuel access, and persistent fuel stacking in Ecuador. Energy Sustain. Dev. , 46, 111–122, doi:10.1016/j.esd.2018.05.009.
Graça, J., C.A. Godinho, and M. Truninger, 2019: Reducing meat consumption and following plant-based diets: Current evidence and future directions to inform integrated transitions. Trends Food Sci. Technol. , 91, 380–390, doi:10.1016/j.tifs.2019.07.046.
Grady-Benson, J. and B. Sarathy, 2016: Fossil fuel divestment in US higher education: student-led organising for climate justice. Local Environ. , 21(6) , 661–681, doi:10.1080/13549839.2015.1009825.
Gramkow, C. and A. Anger-Kraavi, 2019: Developing Green: A Case for the Brazilian Manufacturing Industry. Sustainability, 11(23) , 6783, doi:10.3390/su11236783.
Grandclément, C., A. Karvonen, and S. Guy, 2015: Negotiating comfort in low energy housing: The politics of intermediation. Energy Policy, 84, 213–222, doi:10.1016/j.enpol.2014.11.034.
Green, D. and G. Raygorodetsky, 2010: Indigenous knowledge of a changing climate. Clim. Change, 100(2) , 239–242, doi:10.1007/s10584-010-9804-y.
Greenblatt, J.B. and S. Saxena, 2015: Autonomous taxis could greatly reduce greenhouse-gas emissions of US light-duty vehicles. Nat. Clim. Change, 5(9) , 860–863, doi:10.1038/nclimate2685.
Grilli, G. and J. Curtis, 2021: Encouraging pro-environmental behaviours: A review of methods and approaches. Renew. Sustain. Energy Rev. , 135, 110039, doi:10.1016/j.rser.2020.110039.
Grinblatt, M., M. Keloharju, and S. Ikaheimo, 2008: Social Influence and Consumption: Evidence from the Automobile Purchases of Neighbors. Rev. Econ. Stat. , 90(4) , 735–753, doi:10.2139/ssrn.995855.
Grinde, B., R.B. Nes, I.F. MacDonald, and D.S. Wilson, 2018: Quality of Life in Intentional Communities. Soc. Indic. Res. , 137(2) , 625–640, doi:10.1007/s11205-017-1615-3.
Grubb, M. et al., 2020: Consumption-oriented policy instruments for fostering greenhouse gas mitigation. Clim. Policy, 20 (sup1), S58–S73, doi:10.1080/14693062.2020.1730151.
Grubler, A., 1991: Energy in the 21st century: From resource to environmental and lifestyle constraints. Entropie Rev. Sci. Tech. Thermodyn. , 164, 29–33.
Grubler, A., 1996: Time for a change: on the patterns of diffusion of innovation. Daedalus, 125(3) , 19–42.
Grubler, A. et al., 2012a: Policies for the Energy Technology Innovation System (ETIS). In: Global Energy Assessment – Toward a Sustainable Future, Cambridge University Press, Cambridge, UK and New York, NY, USA and the International Institute for Applied Systems Analysis, Laxenburg, Austria, pp. 1665–1744.
Grubler, A. et al., 2012b: Energy Primer. In: Global Energy Assessment – Toward a Sustainable Future, Cambridge University Press, Cambridge, UK and New York, NY, USA and the International Institute for Applied Systems Analysis, Laxenburg, Austria, pp. 99–150.
Grubler, A. et al., 2018: A low energy demand scenario for meeting the 1.5°C target and sustainable development goals without negative emission technologies. Nat. Energy, 3(6) , 515–527, doi:10.1038/s41560-018-0172-6.
Grubler, A., N. Nakićenović, and D.G. Victor, 1999: Dynamics of energy technologies and global change. Energy Policy, 27(5) , 247–280, doi:10.1016/S0301-4215(98)00067-6.
Grunewald, N., S. Klasen, I. Martinez-Zarzoso, and C. Muris, 2011: Income Inequality and Carbon Emissions.
Grunewald, N. et al., 2017: The Trade-off Between Income Inequality and Carbon Dioxide Emissions. Ecol. Econ. , 142, 249–256, doi:10.1016/j.ecolecon.2017.06.034.
Guevara, Z., T. Sousa, and T. Domingos, 2016: Insights on Energy Transitions in Mexico from the Analysis of Useful Exergy 1971–2009. Energies 2016, Vol. 9, Page 488, 9(7) , 488, doi:10.3390/EN9070488.
Gulyani, S., D. Talukdar, and E.M. Bassett, 2018: A sharing economy? Unpacking demand and living conditions in the urban housing market in Kenya. World Dev. , 109, 57–72, doi:10.1016/j.worlddev.2018.04.007.
Gumbert, T., 2019: Anti-Democratic Tenets? Behavioural-Economic Imaginaries of a Future Food System. Polit. Gov. , 7(4) , doi:10.17645/pag.v7i4.2216.
Gunders, D. et al., 2017: Wasted: How America is Losing up to 40% of its Food from Farm to Fork to Landfill. Natural Resources Defense Council, New York, NY, USA.
Gür, N., 2020: Does social trust promote behaviour aimed at mitigating climate change?Econ. Aff. , 40(1) , 36–49, doi:10.1111/ecaf.12384.
Guruswamy, L., 2010: Energy Justice and Sustainable Development. Colo. J. Int. Environ. Law Policy, 231.
Guruswamy, L. (ed.), 2016: International energy and poverty: The emerging contours. Routledge, Abingdon, UK, 329 pp.
Guruswamy, L., 2020: Global Energy Poverty: the Relevance of Faith and Reason. Belmont Law Rev. , 7(2) , 199–244.
Gutberlet, J., 2008: Organized and informal recycling: social movements contributing to sustainability. In: Waste Management and the Environment IV[Zamorano, M., C.A. Brebbia, A.G. Kungolos, and V. Popov, (eds.)], WIT Press, Southampton, UK, pp. 223–232.
Gutowski, T.G., S. Sahni, A. Boustani, and S.C. Graves, 2011: Remanufacturing and Energy Savings. Environ. Sci. Technol. , 45(10) , 4540–4547, doi:10.1021/es102598b.
Gutowski, T.G., J.M. Allwood, C. Herrmann, and S. Sahni, 2013: A Global Assessment of Manufacturing: Economic Development, Energy Use, Carbon Emissions, and the Potential for Energy Efficiency and Materials Recycling. Annu. Rev. Environ. Resour. , 38(1) , 81–106, doi:10.1146/annurev-environ-041112-110510.
Haas, W., F. Krausmann, D. Wiedenhofer, and M. Heinz, 2015: How Circular is the Global Economy?: An Assessment of Material Flows, Waste Production, and Recycling in the European Union and the World in 2005. J. Ind. Ecol. , 19(5) , 765–777, doi:10.1111/jiec.12244.
Haas, W., F. Krausmann, D. Wiedenhofer, C. Lauk, and A. Mayer, 2020: Spaceship earth’s odyssey to a circular economy – a century long perspective. Resour. Conserv. Recycl. , 163, 105076, doi.org/10.1016/j.resconrec.2020.105076.
Haberl, H., K.-H. Erb, and F. Krausmann, 2014: Human Appropriation of Net Primary Production: Patterns, Trends, and Planetary Boundaries. Annu. Rev. Environ. Resour. , 39 (October 2014), 363–391, doi:10.1146/ANNUREV-ENVIRON-121912-094620.
Haberl, H., D. Wiedenhofer, K.H. Erb, C. Görg, and F. Krausmann, 2017: The Material Stock–Flow–Service Nexus: A New Approach for Tackling the Decoupling Conundrum. Sustainability, 9(7) , 1049, doi:10.3390/su9071049.
Haberl, H. et al., 2019: Contributions of sociometabolic research to sustainability science. Nat. Sustain. , 2(3) , 173–184, doi:10.1038/s41893-019-0225-2.
Haberl, H. et al., 2021: Stocks, flows, services and practices: Nexus approaches to sustainable social metabolism. Ecol. Econ. , 182 (April 2021), 106949, doi:10.1016/J.ECOLECON.2021.106949.
Habtezion, S., 2013: Gender and Climate Change Asia and the Pacific. United Nations Development Programme, New York, NY, USA, 6 pp. https://www.undp.org/publications/gender-and-climate-change-asia-and-pacific (Accessed November 26, 2021).
Hafner, R., D. Elmes, D. Read, and M.P. White, 2019: Exploring the role of normative, financial and environmental information in promoting uptake of energy efficient technologies. J. Environ. Psychol. , 63, 26–35, doi:10.1016/j.jenvp.2019.03.004.
Hagen, B., 2016: The role of planning in minimizing the negative impacts of global climate change. Urban Plan. , 1(3) , 13–24, doi:10.17645/up.v1i3.671.
Hahnel, U.J.J. et al., 2015: The power of putting a label on it: green labels weigh heavier than contradicting product information for consumers’ purchase decisions and post-purchase behavior. Front. Psychol. , 6, 1392, doi:10.3389/fpsyg.2015.01392.
Haluza-DeLay, R., 2014: Religion and climate change: varieties in viewpoints and practices. Wiley Interdiscip. Rev. Clim. Change, 5(2) , 261–279, doi:10.1002/wcc.268.
Hammar, H. and S.C. Jagers, 2006: Can trust in politicians explain individuals’ support for climate policy? The case of CO2 tax. Clim. Policy, 5(6) , 613–625, doi:10.1080/14693062.2006.9685582.
Hammar, H. and S.C. Jagers, 2007: What is a fair CO2 tax increase? On fair emission reductions in the transport sector. Ecol. Econ. , 61(2–3) , 377–387, doi:10.1016/j.ecolecon.2006.03.004.
Han, H. and S.W. Ahn, 2020: Youth Mobilization to Stop Global Climate Change: Narratives and Impact. Sustainability. 12(10) , 4127, doi:10.3390/SU12104127.
Handgraaf, M.J.J., M.A. Van Lidth de Jeude, and K.C. Appelt, 2013: Public praise vs. private pay: Effects of rewards on energy conservation in the workplace. Ecol. Econ. , 86, 86–92, doi:10.1016/j.ecolecon.2012.11.008.
Hans, A., S. Hazra, S. Das, and A. Patel, 2019: Encountering Gendered Spaces in Climate Change Policy in India: Migration and Adaptation. J. Migr. Aff. , II(1) , 1–24, doi:10.36931/jma.2019.2.1.1-24.
Hao, Y., H. Chen, and Q. Zhang, 2016: Will income inequality affect environmental quality? Analysis based on China’s provincial panel data. Ecol. Indic. , 67, 533–542, doi:10.1016/j.ecolind.2016.03.025.
Haque, K.N.H., F.A. Chowdhury, and K.R. Khatun, 2015: Participatory environmental governance and climate change adaptation: Mainstreaming of tidal river management in South-West Bangladesh. In: Land and Disaster Management Strategies in Asia[Ha, H. (ed.)], Springer, India, pp. 189–208.
Harding, M. and A. Hsiaw, 2014: Goal setting and energy conservation. J. Econ. Behav. Organ. , 107, 209–227, doi:10.1016/j.jebo.2014.04.012.
Harguess, J.M., N.C. Crespo, and M.Y. Hong, 2020: Strategies to reduce meat consumption: A systematic literature review of experimental studies. Appetite, 144, 104478, doi:10.1016/j.appet.2019.104478.
Harring, N. and S.C. Jagers, 2013: Should We Trust in Values? Explaining Public Support for Pro-Environmental Taxes. Sustainability, 5(2013) , 210–227, doi:10.3390/su5010210.
Harriss, R. and B. Shui, 2010: Consumption, not CO2 emissions: Reframing perspectives on climate change and sustainability. Environment , 52(6) , 8–15, doi:10.1080/00139157.2010.522461.
Hartmann, C. and M. Siegrist, 2017: Consumer perception and behaviour regarding sustainable protein consumption: A systematic review. Trends Food Sci. Technol. , 61, 11–25, doi:10.1016/j.tifs.2016.12.006.
Haug, C. et al., 2010: Navigating the dilemmas of climate policy in Europe: Evidence from policy evaluation studies. Clim. Change, 101(3) , 427–445, doi:10.1007/s10584-009-9682-3.
Haugneland, P. and H.H. Kvisle, 2015: Norwegian electric car user experience. Int. J. Automot. Technol. Manag. , 15(2) , 194–221, doi:10.1504/IJATM.2015.068548.
Hausknost, D. et al., 2018: Investigating patterns of local climate governance: How low‐carbon municipalities and intentional communities intervene in social practices. Environ. Policy Gov. , 28(6) , 371–382, doi:10.1002/eet.1804.
Havas, L., J. Ballweg, C. Penna, and D. Race, 2015: Power to change: Analysis of household participation in a renewable energy and energy efficiency programme in Central Australia. Energy Policy, 87 (December 2015), 325–333, doi:10.1016/j.enpol.2015.09.017.
Hayward, B. and J. Roy, 2019: Sustainable Living: Bridging the North-South Divide in Lifestyles and Consumption Debates. Annu. Rev. Environ. Resour. , 44(6) , 1–9, doi:10.1146/annurev-environ-101718-033119.
Healy, N. and J. Barry, 2017: Politicizing energy justice and energy system transitions: Fossil fuel divestment and a “just transition”. Energy Policy, 108, 451–459, doi:10.1016/j.enpol.2017.06.014.
Heffron, R.J. and D. McCauley, 2018: What is the ‘Just Transition’?Geoforum, 88, 74–77, doi:10.1016/j.geoforum.2017.11.016.
Heinzle, S.L. and R. Wüstenhagen, 2012: Dynamic Adjustment of Eco-labeling Schemes and Consumer Choice – the Revision of the EU Energy Label as a Missed Opportunity?Bus. Strateg. Environ. , 21(1) , 60–70, doi:10.1002/bse.722.
Helferty, A. and A. Clarke, 2009: Student-led campus climate change initiatives in Canada. Int. J. Sustain. High. Educ. , 10(3) , 287–300, doi:10.1108/14676370910972594.
Henao, A. and W.E. Marshall, 2019: The impact of ride hailing on parking (and vice versa). J. Transp. Land Use, 12(1) , doi:10.5198/jtlu.2019.1392.
Henry, M.L., P.J. Ferraro, and A. Kontoleon, 2019: The behavioural effect of electronic home energy reports: Evidence from a randomised field trial in the United States. Energy Policy, 132, 1256–1261, doi:10.1016/j.enpol.2019.06.039.
Henryson, J., T. Håkansson, and J. Pyrko, 2000: Energy efficiency in buildings through information – Swedish perspective. Energy Policy, 28(3) , 169–180, doi:10.1016/S0301-4215(00)00004-5.
Hepburn, C. et al., 2020: Will COVID-19 fiscal recovery packages accelerate or retard progress on climate change?Oxford Rev. Econ. Policy, 36 (Supplement_1), S359–S381, doi:10.1093/oxrep/graa015.
Herendeen, R. and J. Tanaka, 1976: Energy cost of living. Energy, 1(2) , 165–178, doi:10.1016/0360-5442(76)90015-3.
Herrmann, S., F. Schulte, and S. Voß, 2014: Increasing acceptance of free-floating car sharing systems using smart relocation strategies: A survey based study of car2go hamburg. Lecture Notes in Computer Science, Vol. 8760, 151–162.
Hershfield, H.E., H.M. Bang, and E.U. Weber, 2014: National Differences in Environmental Concern and Performance Are Predicted by Country Age. Psychol. Sci. , 25(1) , 152–160, doi:10.1177/0956797613501522.
Hertwich, E.G. and G.P. Peters, 2009: Carbon footprint of nations: A global, trade-linked analysis. Environ. Sci. Technol. , 43(16) , 6414–6420, doi:10.1021/es803496a.
Hertwich, E.G. et al., 2019: Material efficiency strategies to reducing greenhouse gas emissions associated with buildings, vehicles, and electronics – a review. Environ. Res. Lett. , 14(4) , 043004, doi:10.1088/1748-9326/ab0fe3.
Hertwich, E.G. et al., 2020: Resource Efficiency and Climate Change: Material Efficiency Strategies for a Low-Carbon Future. United Nations Environment Programme, Nairobi, Kenya.
Hess, D.J., 2019a: Coalitions, framing, and the politics of energy transitions: Local democracy and community choice in California. Energy Res. Soc. Sci. , 50, 38–50, doi:10.1016/j.erss.2018.11.013.
Hess, D.J., 2019b: Cooler coalitions for a warmer planet: A review of political strategies for accelerating energy transitions. Energy Res. Soc. Sci. , 57, 101246, doi:10.1016/j.erss.2019.101246.
Heun, M.K. and P.E. Brockway, 2019: Meeting 2030 primary energy and economic growth goals: Mission impossible?Appl. Energy, 251, 112697, doi:10.1016/j.apenergy.2019.01.255.
Hickel, J. and G. Kallis, 2019: Is Green Growth Possible?New Polit. Econ. , 25(4) , 469–486, doi:10.1080/13563467.2019.1598964.
Hickel, J. et al., 2021: Urgent need for post-growth climate mitigation scenarios. Nat. Energy, 6(8) , 766–768, doi:10.1038/s41560-021-00884-9.
Hicks, J. and N. Ison, 2018: An exploration of the boundaries of ‘community’ in community renewable energy projects: Navigating between motivations and context.’Energy Policy, 113, 523–534, doi:10.1016/j.enpol.2017.10.031.
Hidalgo, D. and C. Huizenga, 2013: Implementation of sustainable urban transport in Latin America. Res. Transp. Econ. , 40(1) , 66–77, doi:10.1016/j.retrec.2012.06.034.
Hillebrand, H. et al., 2018: Biodiversity change is uncoupled from species richness trends: Consequences for conservation and monitoring. J. Appl. Ecol. , 55(1) , 169–184, doi:10.1111/1365-2664.12959.
Hilson, C., 2019: Climate Populism, Courts, and Science. J. Environ. Law, 31(3) , 395–398, doi:10.1093/jel/eqz021.
Himmelweit, S., 2002: Making visible the hidden economy: The case for gender-impact analysis of economic policy. Fem. Econ. , 8(1) , 49–70, doi:10.1080/13545700110104864.
Hintemann, R. and S. Hinterholzer, 2019: Energy consumption of data centers worldwide: How will the Internet become green? In: Proceedings of the 6th International Conference on ICT for Sustainability, Lappeenranta, Finland, 8 pp. http://ceur-ws.org/Vol-2382/ICT4S2019_paper_16.pdf (Accessed December 4, 2021).
Hiteva, R. and J. Watson, 2019: Governance of interactions between infrastructure sectors: The making of smart grids in the UK. Environ. Innov. Soc. Transitions, 32, 140–152, doi:10.1016/j.eist.2019.02.006.
Hobbs, J.E., 2020: Food supply chains during the COVID‐19 pandemic. Can. J. Agric. Econ. Can. d’agroeconomie, 68(2) , 171–176, doi:10.1111/cjag.12237.
Hobson, K., 2019: ‘Small stories of closing loops’: social circularity and the everyday circular economy. Clim. Change, doi:10.1007/s10584-019-02480-z.
Hockerts, K. and R. Wüstenhagen, 2010: Greening Goliaths versus emerging Davids: Theorizing about the role of incumbents and new entrants in sustainable entrepreneurship. J. Bus. Ventur. , 25(5) , 481–492, doi:10.1016/j.jbusvent.2009.07.005.
Hoegh-Guldberg, O. et al., 2019: The Ocean as a Solution to Climate Change: Five Opportunities for Action. World Resources Institute., Washington, DC, USA, https://oceanpanel.org/sites/default/files/2019-10/HLP_Report_Ocean_Solution_Climate_Change_final.pdf (Accessed October 29, 2021).
Hofstad, H. and T. Vedeld, 2020: Urban climate governance and co-creation – In Cape Town, Copenhagen, Gothenburg and Oslo. Norwegian Institute for Urban and Regional Research, Oslo. Norway, 115 pp. https://oda.oslomet.no/oda-xmlui/handle/20.500.12199/3126 (Accessed June 12, 2020).
Hollingsworth, J., B. Copeland, and J.X. Johnson, 2019: Are e-scooters polluters? The environmental impacts of shared dockless electric scooters. Environ. Res. Lett. , 14(8) , doi:10.1088/1748-9326/ab2da8.
Hong, J.H., B.C. Kim, and K.S. Park, 2019: Optimal risk management for the sharing economy with stranger danger and service quality. Eur. J. Oper. Res. , 279(3) , 1024–1035, doi:10.1016/j.ejor.2019.06.020.
Hook, A., V. Court, B.K. Sovacool, and S. Sorrell, 2020: A systematic review of the energy and climate impacts of teleworking. Environ. Res. Lett. , 15(9) , doi:10.1088/1748-9326/ab8a84.
Hoolohan, C., C. McLachlan, and S. Mander, 2018: Food related routines and energy policy: A focus group study examining potential for change in the United Kingdom. Energy Res. Soc. Sci. , 39, 93–102, doi:10.1016/j.erss.2017.10.050.
Hoor, M., 2020: The bicycle as a symbol of lifestyle, status and distinction. A cultural studies analysis of urban cycling (sub)cultures in Berlin. Appl. Mobilities, 1–18, doi:10.1080/23800127.2020.1847396.
Hopkinson, P., H.M. Chen, K. Zhou, Y. Wang, and D. Lam, 2018: Recovery and reuse of structural products from end-of-life buildings. Proc. Inst. Civ. Eng. Eng. Sustain. , 172(3) , 119–128, doi:10.1680/jensu.18.00007.
Hordijk, M.A., 2000: Of Dreams and Deeds: the role of local initiatives for community-based environmental management in Lima, Peru. https://dare.uva.nl/search?identifier=6f7a4580-e9b6-454d-9d7e-c8225ee89234 (Accessed December 9, 2019).
Horen Greenford, D., T. Crownshaw, C. Lesk, K. Stadler, and H.D. Matthews, 2020: Shifting economic activity to services has limited potential to reduce global environmental impacts due to the household consumption of labour. Environ. Res. Lett. , 15(6).
Hornsey, M.J., 2020: Why Facts Are Not Enough: Understanding and Managing the Motivated Rejection of Science: Curr. Dir. Psychol. Sci. , 29(6) , 583–591, doi:10.1177/0963721420969364.
Hossain, M., 2016: Grassroots innovation: A systematic review of two decades of research. J. Clean. Prod. , 137, 973–981, doi:10.1016/j.jclepro.2016.07.140.
Houde, S., A. Todd, A. Sudarshan, J.A. Flora, and K.C. Armel, 2013: Real-time Feedback and Electricity Consumption: A Field Experiment Assessing the Potential for Savings and Persistence. Energy J. , 34(1) , 87–102, doi:10.5547/01956574.34.1.4.
Howlett, M. and J. Rayner, 2013: Patching vs packaging in policy formulation: Assessing policy portfolio design. Polit. Gov. , 1(2) , 170–182, doi:10.12924/pag2013.01020170.
Huang, H. et al., 2019: Emissions trading systems and social equity: A CGE assessment for China. Appl. Energy, 235, 1254–1265, doi:10.1016/j.apenergy.2018.11.056.
Huang, P. et al., 2020: A review of data centers as prosumers in district energy systems: Renewable energy integration and waste heat reuse for district heating. Appl. Energy, 258, 114109, doi:10.1016/J.APENERGY.2019.114109.
Huang, R. et al., 2016: Energy and emissions saving potential of additive manufacturing: the case of lightweight aircraft components. J. Clean. Prod. , 135, 1559–1570, doi:10.1016/j.jclepro.2015.04.109.
Huang, R. et al., 2017: Environmental and Economic Implications of Distributed Additive Manufacturing: The Case of Injection Mold Tooling. J. Ind. Ecol. , 21 (S1), S130–S143, doi:10.1111/jiec.12641.
Hubacek, K., G. Baiocchi, K. Feng, L. Sun, and J. Xue, 2017: Global carbon inequality. Energy, Ecol. Environ. , 2(6) , 361–369, doi:10.1007/s40974-017-0072-9.
Huber, J., W.K. Viscusi, and J. Bell, 2020: Dynamic relationships between social norms and pro-environmental behavior: evidence from household recycling. Behav. Public Policy, 4(1) , 1–25, doi:10.1017/bpp.2017.13.
Hübler, M., 2017: The inequality-emissions nexus in the context of trade and development: A quantile regression approach. Ecol. Econ. , 134, 174–185, doi:10.1016/j.ecolecon.2016.12.015.
Hugo, J. and C. du Plessis, 2019: A quantitative analysis of interstitial spaces to improve climate change resilience in Southern African cities. Clim. Dev. , 12(7) , 1–9, doi:10.1080/17565529.2019.1664379.
Hulme, M., 2015: Varieties of religious engagement with climate change. In: Routledge Handbook of Religion and Ecology[Jenkins, W., M.E. Tucker, and J. Grim, (eds.)], Routledge, Abingdon, UK, pp. 239.
Hummel, D. and A. Maedche, 2019: How effective is nudging? A quantitative review on the effect sizes and limits of empirical nudging studies. J. Behav. Exp. Econ. 80, 47–58, doi:10.1016/j.socec.2019.03.005.
Hunsberger, C. et al., 2017: Climate change mitigation, land grabbing and conflict: towards a landscape-based and collaborative action research agenda. Can. J. Dev. Stud. , 38(3) , 305–324, doi:10.1080/02255189.2016.1250617.
Huyer, S. and S. Partey, 2020: Weathering the storm or storming the norms? Moving gender equality forward in climate-resilient agriculture: Introduction to the Special Issue on Gender Equality in Climate-Smart Agriculture: Approaches and Opportunities. Clim. Change, 158(1) , 1–12, doi:10.1007/s10584-019-02612-5.
Hynes, M., 2014: Telework Isn’t Working: A Policy Review. Econ. Soc. Rev. (Irel). , 45(4) , 579–602.
Hynes, M., 2016: Developing (tele)work? A multi-level sociotechnical perspective of telework in Ireland. Res. Transp. Econ. , 57, 21–31, doi:10.1016/j.retrec.2016.06.008.
IEA, 2016: Energy Technology Perspectives 2016. OECD, Paris, France, 418 pp.
IEA, 2017a: Digitalization & Energy. OECD, Paris, France, 185 pp.
IEA, 2017b: Energy Technology Perspectives 2017: Catalysing Energy Technology Transformations. OECD, Paris, France, 443 pp.
IEA, 2017c: Energy Access Outlook 2017: From Poverty to Prosperity. OECD, Paris, France.
IEA, 2018: The Future of Cooling: Opportunities for energy-efficient air conditioning. OECD, Paris, France, 92 pp.
IEA, 2019a: World Energy Outlook 2019. OECD, Paris, France.
IEA, 2019b: Material efficiency in clean energy transitions. OECD, Paris, France, 162 pp.
IEA, 2019c: SDG7: Data and Projections – Access to affordable, reliable, sustainable and modern energy for all. OECD, Paris, France, https://www.iea.org/reports/sdg7-data-and-projections (Accessed December 6, 2019).
IEA, 2020a: World Energy Outlook 2020. OECD, Paris, France.
IEA, 2020b: World Energy Balances: Overview. OECD, Paris, France, https://www.iea.org/reports/world-energy-balances-overview (Accessed July 12, 2021).
IEA, 2021: Net Zero by 2050: A Roadmap for the Global Energy Sector. OECD, Paris, France, 224 pp.
ILO, 2020: Policy Brief The COVID-19 response: Getting gender equality right for a better future for women at work. International Labour Organization, Geneva, Switzerland.
IMO, 2020: Fourth IMO GHG Study 2020. International Maritime Organization, London, UK, 524 pp. https://www.imo.org/en/OurWork/Environment/Pages/Fourth-IMO-Greenhouse-Gas-Study-2020.aspx (Accessed June 21, 2021).
Inderberg, T.H., S.H. Eriksen, K.L. O’Brien, and L. Sygna (eds.) 2015: Climate change adaptation and development: transforming paradigms and practices. Routledge, Abingdon, UK and New York, NY, USA, 296 pp.
International Transport Forum, 2016: Shared mobility: innovation for liveable cities. International Transport Forum, Paris, France, 56 pp.
IPCC, 2007: Climate Change 2007: Mitigation. Contribution of Working Group III to the Fourth Assessment Report of the Intergovernmental Panel on Climate Change. [Metz, B., O.R. Davidson, P.R. Bosch, R. Dave, and L.A. Meyer, (eds.)]. Cambridge University Press, Cambridge, UK and New York, NY, USA, 861 pp.
IPCC, 2014a: Summary for Policymakers. In: Climate Change 2014: Mitigation of Climate Change. Contribution of Working Group III to the Fifth Assessment Report of the Intergovernmental Panel on Climate Change[Edenhofer, O., R. Pichs-Madruga, Y. Sokona, E. Farahani, S. Kadner, K. Seyboth, A. Adler, I. Baum, S. Brunner, P. Eickemeier, B. Kriemann, J. Savolainen, S. Schlömer, C. von Stechow, T. Zwickel and J.C. Minx (eds.)], Cambridge University Press, Cambridge, UK and New York, NY, USA, pp. 1–30.
IPCC, 2014b: Climate Change 2014: Mitigation of Climate Change: Working Group III contribution to the Fifth Assessment Report of the Intergovernmental Panel on Climate Change. [Edenhofer, O., R. Pichs-Madruga, Y. Sokona, E. Farahani, S. Kadner, K. Seyboth, A. Adler, I. Baum, S. Brunner, P. Eickemeier, B. Kriemann, J. Savolainen, S. Schlömer, C. von Stechow, T. Zwickel and J.C. Minx (eds.)]. Cambridge University Press, Cambridge, UK and New York, NY, USA.
IPCC, 2018: Global Warming of 1.5°C. An IPCC Special Report on the impacts of global warming of 1.5°C above pre-industrial levels and related global greenhouse gas emission pathways, in the context of strengthening the global response to the threat of climate change, sustainable development, and efforts to eradicate poverty. [Masson-Delmotte, V., P. Zhai, H.-O. Pörtner, D. Roberts, J. Skea, P.R. Shukla, A. Pirani, W. Moufouma-Okia, C. Péan, R. Pidcock, S. Connors, J.B.R. Matthews, Y. Chen, X. Zhou, M.I. Gomis, E. Lonnoy, T. Maycock, M. Tignor, and T. Waterfield (eds.)]. Cambridge University Press, Cambridge, UK and New York, NY, USA pp.
IPCC, 2021: Summary for Policymakers. In: Climate Change 2021: The Physical Science Basis. Contribution of Working Group I to the Sixth Assessment Report of the Intergovernmental Panel on Climate Change[Masson-Delmotte, V., P. Zhai, A. Pirani, S.L. Connors, C. Péan, S. Berger, N. Caud, Y. Chen, L. Goldfarb, M.I. Gomis, M. Huang, K. Leitzell, E. Lonnoy, J.B.R. Matthews, T.K. Maycock, T. Waterfield, O. Yelekçi, R. Yu, and B. Zhou (eds.)]. In press.
Isenhour, C., 2019: A consuming globalism: On power and the post-Paris Agreement politics of climate and consumption. In: Power and Politics in Sustainable Consumption Research and Practice[Isenhour, C., M Martiskainen, and L Middlemiss (eds.)], Routledge, Abingdon, UK, pp. 21–44.
Isenhour, C. and M. Ardenfors, 2009: Gender and sustainable consumption: Policy implications. Int. J. Innov. Sustain. Dev. , 4(2–3) , 135–149, doi:10.1504/IJISD.2009.028068.
Israel-Akinbo, S., J. Snowball, and G. Fraser, 2018: The energy transition patterns of low-income households in South Africa: An evaluation of energy programme and policy. J. Energy South. Africa, 29(3) , 75–85, doi:10.17159/2413-3051/2017/v29i3a3310.
ISSC, IDS, and UNESCO, 2016: World Social Science Report 2016, Challenging Inequalities; Pathways to a Just World. UNESCO Publishing, Paris, France, 359 pp.
ITF, 2017a: Transition to Shared Mobility: How large cities can deliver inclusive transport services. International Transport Forum, Paris, France.
ITF, 2017b: Shared Mobility Simulations for Helsinki. International Transport Forum, Paris, France, 95 pp.
ITF, 2017c: Shared Mobility Simulations for Auckland. International Transport Forum, Paris, France, 91 pp.
ITF, 2018: Shared Mobility Simulations for Dublin. Case-specific policy analysis. International Transport Forum, Paris, France, 97 pp.
ITF, 2019: ITF Transport Outlook 2019. OECD Publishing, Paris, France, 200 pp.
ITF, 2020a: Good to Go? Assessing the Environmental Performance of New Mobility. International Transport Forum, Paris, France, https://www.itf-oecd.org/good-go-assessing-environmental-performance-new-mobility (Accessed June 21, 2021).
ITF, 2020b: Shared Mobility Simulations for Lyon. International Transport Forum, Paris, France, 91 pp.
ITF, 2021: Reversing Car Dependency: Summary and Conclusions. International Transport Forum, Paris, France, 43 pp. www.itf-oecd.org/avoiding-car-dependency (Accessed August 25, 2021).
Ivanova, D. and R. Wood, 2020: The unequal distribution of household carbon footprints in Europe and its link to sustainability. Glob. Sustain. , 3, doi:10.1017/SUS.2020.12.
Ivanova, D. et al., 2016: Environmental Impact Assessment of Household Consumption. J. Ind. Ecol. , 20(3) , 526–536, doi:10.1111/jiec.12371.
Ivanova, D. et al., 2018: Carbon mitigation in domains of high consumer lock-in. Glob. Environ. Change, 52, 117–130, doi:10.1016/j.gloenvcha.2018.06.006.
Ivanova, D. et al., 2020: Quantifying the potential for climate change mitigation of consumption options. Environ. Res. Lett. , 15(9) , 093001, doi:10.1088/1748-9326/ab8589.
Ives, C.D. and J. Kidwell, 2019: Religion and social values for sustainability. Sustain. Sci., 14(5) , 1355–1362, doi:10.1007/S11625-019-00657-0.
Iwafune, Y., Y. Mori, T. Kawai, and Y. Yagita, 2017: Energy-saving effect of automatic home energy report utilizing home energy management system data in Japan. Energy, 125 (15 April 2017), 382–392, doi:10.1016/j.energy.2017.02.136.
Iweka, O., S. Liu, A. Shukla, and D. Yan, 2019: Energy and behaviour at home: A review of intervention methods and practices. Energy Res. Soc. Sci. , 57 (November 2019), 101238, doi:10.1016/j.erss.2019.101238.
Jachimowicz, J.M., O.P. Hauser, J.D. O’Brien, E. Sherman, and A.D. Galinsky, 2018: The critical role of second-order normative beliefs in predicting energy conservation. Nat. Hum. Behav. , 2(10) , 757–764, doi:10.1038/s41562-018-0434-0.
Jachimowicz, J.M., S. Duncan, E.U. Weber, and E.J. Johnson, 2019: When and why defaults influence decisions: a meta-analysis of default effects. Behav. Public Policy, 3(02) , 159–186, doi:10.1017/bpp.2018.43.
Jack, B.K. and G. Smith, 2016: Charging Ahead: Prepaid Electricity Metering in South Africa. Working Paper 22895, National Bureau of Economic Research, Cambridge, MA, USA, 41 pp. http://www.nber.org/papers/w22895.pdf (Accessed June 21, 2021).
Jackson, T., 2008: Live Better by Consuming Less?: Is There a “Double Dividend” in Sustainable Consumption?J. Ind. Ecol. , 9(1–2) , 19–36, doi:10.1162/1088198054084734.
Jackson, T., 2009: Prosperity without growth? The transition to a sustainable economy. Sustainable Development Commission, 133 pp.
Jackson, T., 2016: Prosperity without growth: foundations for the economy of tomorrow. 2nd ed. Routledge, Abingdon, UK, 310 pp.
Jackson, T. and N. Marks, 1999: Consumption, sustainable welfare and human needs – With reference to UK expenditure patterns between 1954 and 1994. Ecol. Econ. , 28(3) , 421–441, doi:10.1016/S0921-8009(98)00108-6.
Jackson, T. and E. Papathanasopoulou, 2008: Luxury or “lock-in”? An exploration of unsustainable consumption in the UK: 1968 to 2000. Ecol. Econ. , 68(1–2) , 80–95, doi:10.1016/j.ecolecon.2008.01.026.
Jackson, T. and P.A. Victor, 2016: Does slow growth lead to rising inequality? Some theoretical reflections and numerical simulations. Ecol. Econ. , 121, 206–219, doi:10.1016/j.ecolecon.2015.03.019.
Jacobs, C. et al., 2019: Patterns of outdoor exposure to heat in three South Asian cities. Sci. Total Environ. , 674, 264–278, doi:10.1016/J.SCITOTENV.2019.04.087.
Jacobsen, G.D., M.J. Kotchen, and M.P. Vandenbergh, 2012: The behavioral response to voluntary provision of an environmental public good: Evidence from residential electricity demand. Eur. Econ. Rev. , 56, 946–960, doi:10.1016/j.euroecorev.2012.02.008.
Jacobson, S.H. and D.M. King, 2009: Fuel saving and ridesharing in the US: Motivations, limitations, and opportunities. Transp. Res. Part D Transp. Environ. , 14(1) , 14–21, doi:10.1016/j.trd.2008.10.001.
Jacobsson, S. and V. Lauber, 2006: The politics and policy of energy system transformation—explaining the German diffusion of renewable energy technology. Energy Policy, 34(3) , 256–276.
Jaffe, R. and M. Koster, 2019: The Myth of Formality in the Global North: Informality‐as‐Innovation in Dutch Governance. Int. J. Urban Reg. Res. , 43(3) , 563–568, doi:10.1111/1468-2427.12706.
Jafry, T., (ed.) 2019: Handbook of climate justice. Routledge, Abingdon, UK and New York, NY, USA, 542 pp.
Jagers, S.C., Å. Löfgren, and J. Stripple, 2010: Attitudes to personal carbon allowances: Political trust, fairness and ideology. Clim. Policy, 10(4) , 410–431, doi:10.3763/cpol.2009.0673.
Jagger, P., I. Das, S. Handa, L.A. Nylander-French, and K.B. Yeatts, 2019: Early Adoption of an Improved Household Energy System in Urban Rwanda. Ecohealth, 16(1) , 7–20, doi:10.1007/s10393-018-1391-9.
Jain, R.K., J. Qin, and R. Rajagopal, 2017: Data-driven planning of distributed energy resources amidst socio-technical complexities. Nat. Energy, 2(8) , 17112, doi:10.1038/nenergy.2017.112.
Janda, K.B. and Y. Parag, 2013: A middle-out approach for improving energy performance in buildings. Build. Res. Inf. , 41(1) , 39–50, doi:10.1080/09613218.2013.743396.
Jarmul, S. et al., 2020: Climate change mitigation through dietary change: a systematic review of empirical and modelling studies on the environmental footprints and health effects of ‘sustainable diets.’Environ. Res. Lett. , 15(12) , 123014, doi:10.1088/1748-9326/abc2f7.
Javaid, A., S. Bamberg, and F. Creutzig, 2020: Determinants of low-carbon transport mode adoption: Systematic review of reviews. Environ. Res. Lett , 15(10) , 103002, doi:10.1088/1748-9326/aba032.
Jenkins, W., E. Berry, and L.B. Kreider, 2018: Religion and Climate Change. Annu. Rev. Environ. Resour. , 43, 85–108, doi:10.1146/annurev-environ-102017-025855.
Jewell, J. and A. Cherp, 2020: On the political feasibility of climate change mitigation pathways: Is it too late to keep warming below 1.5°C?Clim. Change, 11(1) , e621, doi:10.1002/WCC.621.
Jo, A. and S. Carattini, 2021: Trust and CO2 Emissions: Cooperation on a Global Scale. J. Econ. Behav. Organ. , 190(10) , 992–937, doi:10.1016/j.jebo.2021.08.010.
Jodoin, S., S. Duyck, and K. Lofts, 2015: Public Participation and Climate Governance: An Introduction. Rev. Eur. Comp. Int. Environ. Law, 24(2) , 117–122, doi:10.1111/reel.12126.
Johannsdottir, L., 2014: Transforming the linear insurance business model to a closed-loop insurance model: A case study of Nordic non-life insurers. J. Clean. Prod. , 83, 341–355, doi:10.1016/j.jclepro.2014.07.010.
Johansson, T., A. Patwardhan, N. Nakićenović, and L. Gomez-Echeverri, 2012: Global Energy Assessment – Toward a Sustainable Future., Cambridge University Press, Cambridge, UK and New York, NY, USA, and the International Institute for Applied Systems Analysis, Laxenburg, Austria.
Johnson, C., 2020: Is demand side response a woman’s work? Domestic labour and electricity shifting in low income homes in the United Kingdom. Energy Res. Soc. Sci. , 68, doi:10.1016/j.erss.2020.101558.
Johnson, E.J. et al., 2012: Beyond nudges: Tools of a choice architecture. Mark. Lett. , 23(2) , 487–504, doi:10.1007/s11002-012-9186-1.
Jokinen, M., S. Sarkki, and H.I. Heikkinen, 2016: The Well-being effects of localized multi-level environmental governance: Case of Kilpisjärvi. Nord. Geogr. Publ. , 45(2) , 19–36.
Jones, E.C. and B.D. Leibowicz, 2019: Contributions of shared autonomous vehicles to climate change mitigation. Transp. Res. Part D Transp. Environ. , 72, 279–298, doi:10.1016/j.trd.2019.05.005.
Jorgenson, A., J. Schor, and X. Huang, 2017: Income Inequality and Carbon Emissions in the United States: A State-level Analysis, 1997–2012. Ecol. Econ. , 134, 40–48, doi:10.1016/j.ecolecon.2016.12.016.
Jorgenson, A.K., J.B. Schor, K.W. Knight, and X. Huang, 2016: Domestic Inequality and Carbon Emissions in Comparative Perspective. Sociol. Forum, 31 (September), 770–786, doi:10.1111/socf.12272.
Jorgenson, A.K. et al., 2018: Social science perspectives on drivers of and responses to global climate change. WIREs Clim. Change, 10 (February 2018), 1–17, doi:10.1002/wcc.554.
Joskow, P.L., 1995: Utility-Subsidized Energy-Efficiency Programs. Annu. Rev. Energy Environ. , 20(1) , 526–534, doi:10.1146/annurev.eg.20.110195.002522.
Joubert, E.C., S. Hess, and J.L. Van Niekerk, 2016: Large-scale solar water heating in South Africa: Status, barriers and recommendations. Renew. Energy, 97, 809–822, doi:10.1016/j.renene.2016.06.029.
Jung, J. and Y. Koo, 2018: Analyzing the effects of car sharing services on the reduction of greenhouse gas (GHG) emissions. Sustainability, 10(2) , doi:10.3390/su10020539.
Jürisoo, M., N. Serenje, F. Mwila, F. Lambe, and M. Osborne, 2019: Old habits die hard: Using the energy cultures framework to understand drivers of household-level energy transitions in urban Zambia. Energy Res. Soc. Sci. , 53, 59–67, doi:10.1016/j.erss.2019.03.001.
Jylhä, K.M., C. Cantal, N. Akrami, and T.L. Milfont, 2016: Denial of anthropogenic climate change: Social dominance orientation helps explain the conservative male effect in Brazil and Sweden. Pers. Individ. Dif. , 98, 184–187, doi:10.1016/j.paid.2016.04.020.
Kaenzig, J. and R. Wüstenhagen, 2010: The Effect of Life Cycle Cost Information on Consumer Investment Decisions Regarding Eco-Innovation. J. Ind. Ecol. , 14(1) , 121–136, doi:10.1111/j.1530-9290.2009.00195.x.
Kahneman, D. and A. Deaton, 2010: High income improves evaluation of life but not emotional well-being. Proc. Natl. Acad. Sci. , 107(38) , 16489–16493, doi:10.1073/pnas.1011492107.
Kaiser, C.M., 2020: State Steering in Polycentric Governance Systems: Climate Policy Integration in Ontario and California’s Transportation Sectors. York University, Toronto, Canada, https://yorkspace.library.yorku.ca/xmlui/handle/10315/37701 (Accessed October 2, 2021).
Kaiser, F.G., 2006: A general measure of ecological behavior. J. Appl. Soc. Psychol. , 28(5) , 395–422, doi:10.1111/j.1559-1816.1998.tb01712.x.
Kaiser, M., M. Bernauer, C.R. Sunstein, and L.A. Reisch, 2020: The power of green defaults: the impact of regional variation of opt-out tariffs on green energy demand in Germany. Ecol. Econ. , 174, 106685, doi:10.1016/j.ecolecon.2020.106685.
Kallbekken, S., S. Kroll, and T.L. Cherry, 2011: Do you not like Pigou, or do you not understand him? Tax aversion and revenue recycling in the lab. J. Environ. Econ. Manage. , 62(1) , 53–64, doi:10.1016/j.jeem.2010.10.006.
Kallis, G., C. Kerschner, and J. Martinez-Alier, 2012: The economics of degrowth. Ecol. Econ. , 84, 172–180, doi:10.1016/j.ecolecon.2012.08.017.
Kalt, G., D. Wiedenhofer, C. Görg, and H. Haberl, 2019: Conceptualizing energy services: A review of energy and well-being along the Energy Service Cascade. Energy Res. Soc. Sci. , 53 (November 2018), 47–58, doi:10.1016/j.erss.2019.02.026.
Kammermann, L. and C. Dermont, 2018: How beliefs of the political elite and citizens on climate change influence support for Swiss energy transition policy. Energy Res. Soc. Sci. , 43, 48–60, doi:10.1016/j.erss.2018.05.010.
Kane, R. and N. Srinivas, 2014: Unlocking the Potential of Behavioral Energy Efficiency: Methodology for Calculating Technical, Economic, and Achievable Savings Potential. In: Proceedings of the 2014ACEEE 2014: The Next Generation: Reaching for High Energy Savings, pp. 198–209.
Kanger, L., F.W. Geels, B. Sovacool, and J. Schot, 2019: Technological diffusion as a process of societal embedding: Lessons from historical automobile transitions for future electric mobility. Transp. Res. Part D Transp. Environ. , 71, 47–66, doi:10.1016/j.trd.2018.11.012.
Kariuki, D., 2018: Barriers to Renewable Energy Technologies Development.Energy Today, https://www.researchgate.net/publication/348936339_Barriers_to_Renewable_Energy_Technologies_Development (Accessed December 2, 2020).
Karlin, B., J.F. Zinger, and R. Ford, 2015: The effects of feedback on energy conservation: A meta-analysis. Psychol. Bull. , 141(6) , 1205–1227, doi:10.1037/a0039650.
Kartha, S., E. Kemp-Benedict, E. Ghosh, A. Nazareth, and T. Gore, 2020: The carbon inequality era. Stockholm Environment Institute and Oxfam International, Oxford, UK, 51 pp.
Kattumuri, R. and T. Kruse, 2019: Renewable technologies in Karnataka, India: jobs potential and co-benefits. Clim. Dev. , 11(2) , 124–137, doi:10.1080/17565529.2017.1410085.
Kavitha, N.V., N. Gandhimathi, and S. Gandhimathi, 2020: Do carbon emissions and economic growth decouple in India? An empirical analysis based on Tapio decoupling model. Stud. Indian Place Names, 40(25) , 146–152.
Keller, W., 2004: International Technology Diffusion. J. Econ. Lit. , 42(3) , 752–782, doi:10.1257/0022051042177685.
Kemp, R., J. Schot, and R. Hoogma, 1998: Regime shifts to sustainability through processes of niche formation: The approach of strategic niche management. Technol. Anal. Strateg. Manag. , 10(2) , 175–195, doi:10.1080/09537329808524310.
Kenner, D. 2015: Inequality of overconsumption: The ecological footprint of the richest . GSI Working Paper 2015/2. Global Sustainability Institute, Anglia Ruskin University, Cambridge, UK.
Kenner, D., 2019: Carbon Inequality: The Role of the Richest in Climate Change – 1st Edition. Routledge, Abingdon, UK, 146 pp.
Kern, F., and K.S. Rogge, 2016: The pace of governed energy transitions: Agency, international dynamics and the global Paris agreement accelerating decarbonisation processes?Energy Res. Soc. Sci. , 22, 13–17, doi:10.1016/j.erss.2016.08.016.
Kern, F., P. Kivimaa, and M. Martiskainen, 2017: Policy packaging or policy patching? The development of complex energy efficiency policy mixes. Energy Res. Soc. Sci. , 23, 11–25, doi:10.1016/j.erss.2016.11.002.
Kern, K. and H. Bulkeley, 2009: Cities, Europeanization and Multi-level Governance: Governing Climate Change through Transnational Municipal Networks. JCMS, 47(2) , 309–332.
Keskitalo, E.C.H. (ed.) 2010: Developing Adaptation Policy and Practice in Europe: Multi-level Governance of Climate Change. Springer Nature, Dordecht, The Netherlands.
Kester, J., L. Noel, G. Zarazua de Rubens, and B.K. Sovacool, 2018: Policy mechanisms to accelerate electric vehicle adoption: A qualitative review from the Nordic region. Renew. Sustain. Energy Rev. , 94 (September 2017), 719–731, doi:10.1016/j.rser.2018.05.067.
Ketlhoilwe, M.J., 2013: Improving resilience to protect women against adverse effects of climate change. Clim. Dev. , 5(2) , 153–159, doi:10.1080/17565529.2013.789788.
Keyßer, L.T. and M. Lenzen, 2021: 1.5°C degrowth scenarios suggest the need for new mitigation pathways. Nat. Commun. 2021 121, 12(1) , 1–16, doi:10.1038/s41467-021-22884-9.
Khanna, T.M. et al., 2021: A multi-country meta-analysis on the role of behavioural change in reducing energy consumption and CO2 emissions in residential buildings. Nat. Energy, 6 (September 2021), 925–932, doi:10.1038/s41560-021-00866-x.
Khosla, R., N. Sircar, and A. Bhardwaj, 2019: Energy demand transitions and climate mitigation in low-income urban households in India. Environ. Res. Lett. , 14(9) , 095008, doi:10.1088/1748-9326/AB3760.
Kikstra, J.S. et al., 2021a: Climate mitigation scenarios with persistent COVID-19-related energy demand changes. Nat. Energy, pp. 1114–1123, doi:10.1038/s41560-021-00904-8.
Kikstra, J.S., A. Mastrucci, J. Min, K. Riahi, and N.D. Rao, 2021b: Decent living gaps and energy needs around the world. Environ. Res. Lett. , 16(9) , 095006, doi:10.1088/1748-9326/AC1C27.
Kim, B.F. et al., 2020: Country-specific dietary shifts to mitigate climate and water crises. Glob. Environ. Change, 62, 101926, doi:10.1016/j.gloenvcha.2019.05.010.
Kim, S.-N., S. Choo, and P.L. Mokhtarian, 2015: Home-based telecommuting and intra-household interactions in work and non-work travel: A seemingly unrelated censored regression approach. Transp. Res. Part A Policy Pract. , 80, 197–214, doi:10.1016/j.tra.2015.07.018.
Kimemia, D. and H. Annegarn, 2016: Domestic LPG interventions in South Africa: Challenges and lessons. Energy Policy, 93, 150–156, doi:10.1016/j.enpol.2016.03.005.
King, D.A., M.J. Smart, and M. Manville, 2019: The Poverty of the Carless: Toward Universal Auto Access. J. Plan. Educ. Res. ,, doi:10.1177/0739456X18823252.
Kirchherr, J., D. Reike, and M. Hekkert, 2017: Conceptualizing the circular economy: An analysis of 114 definitions. Resour. Conserv. Recycl. , 127, 221–232.
Kivimaa, P. and V. Virkamäki, 2014: Policy mixes, policy interplay and low carbon transitions: The case of passenger transport in Finland. Environ. Policy Gov. , 24(1) , 28–41, doi:10.1002/eet.1629.
Kivimaa, P. and F. Kern, 2016: Creative destruction or mere niche support? Innovation policy mixes for sustainability transitions. Res. Policy, 45(1) , 205–217, doi:10.1016/j.respol.2015.09.008.
Kivimaa, P. and M. Martiskainen, 2018: Energy Research & Social Science Dynamics of policy change and intermediation : The arduous transition towards low-energy homes in the United Kingdom. Energy Res. Soc. Sci. , 44 (October 2017), 83–99, doi:10.1016/j.erss.2018.04.032.
Klaniecki, K., I.A. Duse, L.M. Lutz, J. Leventon, and D.J. Abson, 2020: Applying the energy cultures framework to understand energy systems in the context of rural sustainability transformation. Energy Policy, 137, 111092, doi:10.1016/J.ENPOL.2019.111092.
Klasen, S., 2018: Inequality and Greenhouse Gas Emissions. J. Income Distrib. , 26(3) , 1–14.
Klausbruckner, C., H. Annegarn, L.R.F. Henneman, and P. Rafaj, 2016: A policy review of synergies and trade-offs in South African climate change mitigation and air pollution control strategies. Environ. Sci. Policy, 57, 70–78, doi:10.1016/j.envsci.2015.12.001.
Klausner, M., W.M. Grimm, and C. Hendrickson, 1998: Reuse of Electric Motors in Consumer Products. J. Ind. Ecol. , 2(2) , 89–102, doi:10.1162/jiec.1998.2.2.89.
Klemeš, J.J., Y. Van Fan, R.R. Tan, and P. Jiang, 2020: Minimising the present and future plastic waste, energy and environmental footprints related to COVID-19. Renew. Sustain. Energy Rev. , 127, 109883, doi:10.1016/j.rser.2020.109883.
Klenert, D. and L. Mattauch, 2016: How to make a carbon tax reform progressive: The role of subsistence consumption. Econ. Lett. , 138, 100–103, doi:10.1016/j.econlet.2015.11.019.
Klenert, D. et al., 2018: Making carbon pricing work for citizens. Nat. Clim. Change, 8(8) , 669–677, doi:10.1038/s41558-018-0201-2.
Klenert, D., F. Funke, L. Mattauch, and B. O’Callaghan, 2020: Five Lessons from COVID-19 for Advancing Climate Change Mitigation. Environmental and Resource Economics. , 76(4) , 751–778, doi:10.2139/ssrn.3622201.
Klinsky, S. and H. Winkler, 2014: Equity, sustainable development and climate policy. Clim. Policy, 14(1) , 1–7, doi:10.1080/14693062.2014.859352.
Klinsky, S. et al., 2016: Why equity is fundamental in climate change policy research. Glob. Environ. Change, doi:10.1016/j.gloenvcha.2016.08.002.
Klitkou, A., S. Bolwig, T. Hansen, and N. Wessberg, 2015: The role of lock-in mechanisms in transition processes: The case of energy for road transport. Environ. Innov. Soc. Transitions, 16, 22–37, doi:10.1016/j.eist.2015.07.005.
Klopp, J.M., 2012: Towards a Political Economy of Transportation Policy and Practice in Nairobi. Urban Forum, 23(1) , 1–21, doi:10.1007/s12132-011-9116-y.
Koh, H., 2016: A new app to save food at the 11th Hour. Eco-Business, November 15.
Komiyama, H., 2014: Beyond the limits to growth: New ideas for sustainability from Japan. Springer Japan, Tokyo, Japan, 103 pp.
Konrad, K., 2016: Expectation dynamics: Ups and downs of alternative fuels. Nat. Energy, 1(16022) , doi:10.1038/nenergy.2016.22.
Koomey, J.G., S. Berard, M. Sanchez, and H. Wong, 2011: Implications of historical trends in the electrical efficiency of computing. IEEE Ann. Hist. Comput. , 33(3) , doi:10.1109/MAHC.2010.28.
Korhonen, J., A. Honkasalo, and J. Seppälä, 2018: Circular Economy: The Concept and its Limitations. Ecol. Econ. , 143, 37–46, doi:10.1016/j.ecolecon.2017.06.041.
Koronen, C., M. Åhman, and L.J. Nilsson, 2020: Data centres in future European energy systems – energy efficiency, integration and policy. Energy Effic. , 13(1) , doi:10.1007/s12053-019-09833-8.
Kotchen, M.J., Z.M. Turk, and A.A. Leiserowitz, 2017: Public willingness to pay for a US carbon tax and preferences for spending the revenue. Environ. Res. Lett , 12, 94012, doi:10.1088/1748-9326/aa822a.
Kraemer-Mbula, E. and S. Wunsch-Vincent, (eds.), 2016: Chapter 7: Innovation policy and the informal economy: Towards a new policy framework, Comment 7.1. In: The Informal Economy in Developing Nations: Hidden Engine of Innovation?, Intellectual Property, Innovation and Economic Development , Cambridge University Press, Cambridge, UK, pp. 327–331.
Krausmann, F. et al., 2009: Growth in global materials use, GDP and population during the 20th century. Ecol. Econ. , 68(10) , 2696–2705, doi:10.1016/j.ecolecon.2009.05.007.
Krausmann, F. et al., 2017: Global socioeconomic material stocks rise 23-fold over the 20th century and require half of annual resource use. Proc. Natl. Acad. Sci. , 114(8) , 1880–1885, doi:10.1073/PNAS.1613773114.
Krey, V. et al., 2019: Looking under the hood: A comparison of techno-economic assumptions across national and global integrated assessment models. Energy, 172, 1254–1267, doi:10.1016/J.ENERGY.2018.12.131.
Krieger, N., 2020: ENOUGH: COVID-19, Structural Racism, Police Brutality, Plutocracy, Climate Change – and Time for Health Justice, Democratic Governance, and an Equitable, Sustainable Future. Am. J. Public Health, 110(11) , 1620–1623, doi:10.2105/ajph.2020.305886.
Kriegler, E. et al., 2014: A new scenario framework for climate change research: The concept of shared climate policy assumptions. Clim. Change, 122(3) , 401–414, doi:10.1007/s10584-013-0971-5.
Kronsell, A., 2017: The contribution of feminist perspectives to climate governance. In: Understanding Climate Change through Gender Relations[Buckingham, S. and V. Le Masson, (eds.)], Routledge, Abingdon, UK, pp. 104–120.
Kuhnhenn, K., L. Costa, E. Mahnke, L. Schneider, and S. Lange, 2020: A Societal Transformation Scenario for Staying Below 1.5°C. Heinrich Böll Foundation, Berlin, Germany, https://www.boell.de/sites/default/files/2020-12/A Societal Transformation Scenario for Staying Below 1.5C.pdf?dimension1=division_iup (Accessed October 29, 2021).
Kulin, J. and I. Johansson Sevä, 2019: The Role of Government in Protecting the Environment: Quality of Government and the Translation of Normative Views about Government Responsibility into Spending Preferences. Int. J. Sociol. , 49(2) , 110–129, doi:10.1080/00207659.2019.1582964.
Kumar, P., R.K. Rao, and N.H. Reddy, 2016: Sustained uptake of LPG as cleaner cooking fuel in rural India: Role of affordability, accessibility, and awareness. World Dev. Perspect. , 4, 33–37, doi:10.1016/j.wdp.2016.12.001.
Kumar, S.V., 2019: Rural roads and the SDGs. The Energy and Resources Institute, New Delhi, India, https://www.teriin.org/sites/default/files/2019-05/rural-roads-sdgs.pdf .
Kungl, G. and F.W. Geels, 2018: Sequence and alignment of external pressures in industry destabilisation: Understanding the downfall of incumbent utilities in the German energy transition (1998–2015). Environ. Innov. Soc. Transitions, 26, 78–100, doi.org/10.1016/j.eist.2017.05.003.
Kuokkanen, A. et al., 2018: Agency in regime destabilization through the selection environment: The Finnish food system’s sustainability transition. Res. Policy, 47(8) , 1513–1522, doi:10.1016/j.respol.2018.05.006.
Kurz, T., N. Donaghue, and I. Walker, 2005: Utilizing a social-ecological framework to promote water and energy conservation: A field experiment. J. Appl. Soc. Psychol. , 35(6) , 1281–1300, doi:10.1111/j.1559-1816.2005.tb02171.x.
La Viña, A.G., J.M. Tan, T.I.M. Guanzon, M.J. Caleda, and L. Ang, 2018: Navigating a trilemma: Energy security, equity, and sustainability in the Philippines’ low-carbon transition. Energy Res. Soc. Sci. , 35, 37–47, doi:10.1016/j.erss.2017.10.039.
Lacey-Barnacle, M., R. Robison, and C. Foulds, 2020: Energy justice in the developing world: a review of theoretical frameworks, key research themes and policy implications. Energy Sustain. Dev. , 55, 122–138, doi:10.1016/J.ESD.2020.01.010.
Lachapelle, U., G.A. Tanguay, and L. Neumark-Gaudet, 2018: Telecommuting and sustainable travel: Reduction of overall travel time, increases in non-motorised travel and congestion relief?Urban Stud. , 55(10) , 2226–2244, doi:10.1177/0042098017708985.
Laestadius, L.I., R.A. Neff, C.L. Barry, and S. Frattaroli, 2016: No Meat, Less Meat, or Better Meat: Understanding NGO Messaging Choices Intended to Alter Meat Consumption in Light of Climate Change. Environ. Commun. , 10(1) , 84–103, doi:10.1080/17524032.2014.981561.
Laitner, J.A. “Skip,” K. Ehrhardt-Martinez, and V. McKinney, 2009: Examining the scale of the Behaviour Energy Efficiency Continuum. In: Proceedings of the 2009 eceee Summer Study, Panel 1. T, European Council for an Energy Efficient Economy, Stockholm, Sweden, pp. 217–223.
Lamb, A. et al., 2016: The potential for land sparing to offset greenhouse gas emissions from agriculture. Nat. Clim. Change, 6 (5), 488–492, doi:10.1038/nclimate2910.
Lamb, W.F. and N.D. Rao, 2015: Human development in a climate-constrained world: What the past says about the future. Glob. Environ. Change, 33, 14–22, doi:10.1016/j.gloenvcha.2015.03.010.
Lamb, W.F. and J.K. Steinberger, 2017: Human well-being and climate change mitigation. Wiley Interdiscip. Rev. Clim. Change, 8(6) , doi:10.1002/wcc.485.
Lamb, W.F. et al., 2014: Transitions in pathways of human development and carbon emissions. Environ. Res. Lett. , 9(1) , doi:10.1088/1748-9326/9/1/014011.
Lambert, H. et al., 2020: COVID-19 as a global challenge: towards an inclusive and sustainable future. Lancet Planet. Heal. , 4(8) , e312–e314, doi:10.1016/S2542-5196(20)30168-6.
Lange, A., C. Vogt, and A. Ziegler, 2007: On the importance of equity in international climate policy: An empirical analysis. Energy Econ. , 29(3) , 545–562, doi:10.1016/j.eneco.2006.09.002.
Langhelle, O., 2000: Sustainable Development and Social Justice: Expanding the Rawlsian Framework of Global Justice. Environ. Values, 9(3) , 295–323.
Larcom, S., F. Rauch, and T. Willems, 2017: The Benefits of Forced Experimentation: Striking Evidence from the London Underground Network. Q. J. Econ. , 132(4) , 2019–2055, doi:10.1093/qje/qjx020.
Larrick, R.P. and J.B. Soll, 2008: The MPG illusion. Science, 320(5883) , 1593–1594, doi:10.1126/science.1154983.
Larson, A.M. et al., 2018: Gender lessons for climate initiatives: A comparative study of REDD+ impacts on subjective wellbeing. World Dev. , 108, 86–102, doi:10.1016/j.worlddev.2018.02.027.
Latvala, T. et al., 2012: Diversifying meat consumption patterns: Consumers’ self-reported past behaviour and intentions for change. Meat Sci. , 92(1) , 71–77, doi:10.1016/j.meatsci.2012.04.014.
Lau, J.D., D. Kleiber, S. Lawless, and P.J. Cohen, 2021: Gender equality in climate policy and practice hindered by assumptions. Nat. Clim. Change, 11(3) , 186–192, doi:10.1038/s41558-021-00999-7.
Le Quéré, C. et al., 2019: Drivers of declining CO2 emissions in 18 developed economies. Nat. Clim. Change, 9(3) , 213–217, doi:10.1038/s41558-019-0419-7.
Le Quéré, C. et al., 2020: Temporary reduction in daily global CO2 emissions during the COVID-19 forced confinement. Nat. Clim. Change, 10(7) , 647–653, doi:10.1038/s41558-020-0797-x.
Leach, M., H. MacGregor, I. Scoones, and A. Wilkinson, 2021: Post-pandemic transformations: How and why COVID-19 requires us to rethink development. World Dev. , 138, 105233, doi:10.1016/j.worlddev.2020.105233.
Lee, E., N.-K. Park, and J.H. Han, 2013: Gender Difference in Environmental Attitude and Behaviors in Adoption of Energy-Efficient Lighting at Home. J. Sustain. Dev. , 6(9) , doi:10.5539/jsd.v6n9p36.
Lee, K., N. Gjersoe, S. O’Neill, and J. Barnett, 2020: Youth perceptions of climate change: A narrative synthesis. Wiley Interdiscip. Rev. Clim. Change, 11(3) , 1–24, doi:10.1002/wcc.641.
Lee, S. and E. Zusman, 2019: Participatory climate governance in Southeast Asia: Lessons learned from gender-responsive climate mitigation. In: Routledge Handbook of Climate Justice[Jafry, T., (ed.)], Routledge, New York, USA, pp. 393–404.
Lee, T. and C. Koski, 2015: Multilevel governance and urban climate change mitigation. Environ. Plan. C Gov. Policy, 33(6) , 1501–1517, doi:10.1177/0263774X15614700.
Lei, N., E. Masanet, and J. Koomey, 2021: Best practices for analyzing the direct energy use of blockchain technology systems: Review and policy recommendations. Energy Policy, 156, 112422, doi:10.1016/J.ENPOL.2021.112422.
Leibowicz, B.D., 2018: Policy recommendations for a transition to sustainable mobility based on historical diffusion dynamics of transport systems. Energy Policy, 119, 357–366, doi:10.1016/j.enpol.2018.04.066.
Leipprand, A. and C. Flachsland, 2018: Energy Research & Social Science Regime destabilization in energy transitions : The German debate on the future of coal. Energy Res. Soc. Sci. , 40, 190–204, doi:10.1016/j.erss.2018.02.004.
Leiserowitz, A. and K. Akerlof, 2010: Race, ethnicity and public responses to climate change. Yale University and George Mason University, New Haven, CT, USA, https://climatecommunication.yale.edu/wp-content/uploads/2016/02/2010_04_Race-Ethnicity-and-Public-Responses-to-Climate-Change.pdf (Accessed June 5, 2020).
Leiserowitz, A. et al., 2020: Climate change in the American mind. Yale University and George Mason University. New Haven, CT, USA,, doi:10.31234/osf.io/z3wtx.
Leiserson, C.E. et al., 2020: There’s plenty of room at the Top: What will drive computer performance after Moore’s law?Science, 368(6495) , doi:10.1126/SCIENCE.AAM9744.
Lejano, R.P. and S.J. Nero, 2020: The Power of Narrative: Climate Skepticism and the Deconstruction of Science. Oxford University Press, Oxford, UK.
Lepeley, M.-T., 2017: Bhutan’s Gross National Happiness: An Approach to Human Centred Sustainable Development. South Asian J. Hum. Resour. Manag. , 4(2) , 174–184, doi:10.1177/2322093717731634.
Levin, K., B. Cashore, S. Bernstein, and G. Auld, 2012: Overcoming the tragedy of super wicked problems: Constraining our future selves to ameliorate global climate change. Policy Sci. , 45(2) , 123–152, doi:10.1007/s11077-012-9151-0.
Lewandowski, M., 2016: Designing the business models for circular economy – Towards the conceptual framework. Sustainability, 8(1) , 1–28, doi:10.3390/su8010043.
Lewis, G.B., R. Palm, and B. Feng, 2018: Cross-national variation in determinants of climate change concern. Env. Polit. , 28(5) , 793–821, doi:10.1080/09644016.2018.1512261.
Li, J., J. Zhang, D. Zhang, and Q. Ji, 2019: Does gender inequality affect household green consumption behaviour in China?Energy Policy, 135, 111071, doi:10.1016/j.enpol.2019.111071.
Li, L. and W. Wang, 2020: The effects of online trust-building mechanisms on trust in the sharing economy: The perspective of providers. Sustainability, 12(5) , doi:10.3390/su12051717.
Li, W., T.H. Rubin, and P.A. Onyina, 2013: Comparing solar water heater popularization policies in China, Israel and Australia: The roles of governments in adopting green innovations. Sustain. Dev. , 21(3) , 160–170, doi:10.1002/sd.1547.
Liang, S., H. Gu, R. Bergman, and S.S. Kelley, 2020: Comparative life-cycle assessment of a mass timber building and concrete alternative. Wood Fiber Sci. , 52(2) , 217–229, doi:10.22382/wfs-2020-019.
Liao, L., M.E. Warner, and G.C. Homsy, 2019: Sustainability’s forgotten third E: what influences local government actions on social equity?Local Environ. , 24(12) , 1197–1208, doi:10.1080/13549839.2019.1683725.
Lidskog, R. and I. Elander, 2009: Addressing climate change democratically. Multi-level governance, transnational networks and governmental structures. Sustain. Dev. , 18(1) , doi:10.1002/sd.395.
Lieder, M. and A. Rashid, 2016: Towards circular economy implementation: a comprehensive review in context of manufacturing industry. J. Clean. Prod. , 115, 36–51, doi.org/10.1016/j.jclepro.2015.12.042.
Liedtke, C., H. Rohn, M. Kuhndt, and R. Nickel, 1998: Applying Material Flow Accounting: Ecoauditing and Resource Management at the Kambium Furniture Workshop. J. Ind. Ecol. , 2(3) , 131–147, doi:10.1162/jiec.1998.2.3.131.
Lieu, J., A.H. Sorman, O.W. Johnson, L.D. Virla, and B.P. Resurrección, 2020: Three sides to every story: Gender perspectives in energy transition pathways in Canada, Kenya and Spain. Energy Res. Soc. Sci. , 68, 101550, doi:10.1016/J.ERSS.2020.101550.
Lieven, T. and N. Rietmann, 2018: Do policy measures in fact promote electric mobility? A study across 20 countries. In: Transport and the City[Ricci, S. and C.A. Brebbia, (eds.)], Edward Elgar Publications, London, UK, pp. 41–50.
Linder, M. and M. Williander, 2017: Circular Business Model Innovation: Inherent Uncertainties. Bus. Strateg. Environ. , 26(2) , 182–196, doi:10.1002/bse.1906.
Liu, C.J. and F. Hao, 2020: The impact of social and ecological factors on environmentally responsible behavior. J. Clean. Prod. , 254, 120173, doi:10.1016/j.jclepro.2020.120173.
Liu, J.Y. et al., 2018: Socioeconomic factors and future challenges of the goal of limiting the increase in global average temperature to 1.5°C. Carbon Manag. , 9(5) , 447–457, doi:10.1080/17583004.2018.1477374.
Liu, Q., S. Wang, W. Zhang, J. Li, and Y. Kong, 2019: Examining the effects of income inequality on CO2 emissions: Evidence from non-spatial and spatial perspectives. Appl. Energy, 236, 163–171, doi:10.1016/J.APENERGY.2018.11.082.
Liu, Y. et al., 2020a: Energy consumption and emission mitigation prediction based on data center traffic and PUE for global data centers. Glob. Energy Interconnect. , 3(3) , 272–282, doi.org/10.1016/j.gloei.2020.07.008.
Liu, Y., M. Zhang, and R. Liu, 2020b: The impact of income inequality on Carbon emissions in China; A Household-level analysis. Sustainability, 12(7) , 2715.
Liu, Z., T. Li, Q. Jiang, and H. Zhang, 2014: Life Cycle Assessment–based Comparative Evaluation of Originally Manufactured and Remanufactured Diesel Engines. J. Ind. Ecol. , 18(4) , 567–576, doi:10.1111/JIEC.12137.
Liyanage, S. et al., 2019: Flexible Mobility On-Demand: An Environmental Scan. Sustainability, 11(5) , 1262, doi:10.3390/su11051262.
Lockwood, M., 2018: Right-wing populism and the climate change agenda: exploring the linkages. Env. Polit ., 27(4), 712–732, doi:10.1080/09644016.2018.1458411.
Löfgren, Å., P. Martinsson, M. Hennlock, and T. Sterner, 2012: Are experienced people affected by a pre-set default option – Results from a field experiment. J. Environ. Econ. Manage. , 63(1) , 66–72.
Loiseau, E. et al., 2016: Green economy and related concepts: An overview. J. Clean. Prod. , 139, 361–371, doi.org/10.1016/j.jclepro.2016.08.024.
Loiter, J.M., and V. Norberg-Bohm, 1999: Technology policy and renewable energy: public roles in the development of new energy technologies. Energy Policy, 27(2), 85–97.
Lokhandwala, M. and H. Cai, 2018: Dynamic ride sharing using traditional taxis and shared autonomous taxis: A case study of NYC. Transp. Res. Part C Emerg. Technol. , 97 (November 2017), 45–60, doi:10.1016/j.trc.2018.10.007.
Lopes, M.A.R., C.H. Antunes, A. Reis, and N. Martins, 2017: Estimating energy savings from behaviours using building performance simulations. Build. Res. Inf. , 45(3) , 303–319, doi:10.1080/09613218.2016.1140000.
López-García, D., L. Calvet-Mir, M. Di Masso, and J. Espluga, 2019: Multi-actor networks and innovation niches: university training for local Agroecological Dynamization. Agric. Human Values, 36(3) , 567–579, doi:10.1007/s10460-018-9863-7.
Lorenz, D.F., 2013: The diversity of resilience: contributions from a social science perspective. Nat. Hazards, 67(1) , 7–24, doi:10.1007/s11069-010-9654-y.
Lorenzoni, I., S. Nicholson-Cole, and L. Whitmarsh, 2007: Barriers perceived to engaging with climate change among the UK public and their policy implications. Glob. Environ. Change, 17(3–4) , 445–459, doi:10.1016/J.GLOENVCHA.2007.01.004.
Lounsbury, M. and M.A. Glynn, 2001: Cultural entrepreneurship: Stories, legitimacy, and the acquisition of resources. Strateg. Manag. J. , 22(6–7) , 545–564, doi:10.1002/smj.188.
Lovins, A.B., 1976: Energy Strategy: The Road Not Taken?Economics, 55, 65, doi:10.2307/20039628.
Lovins, A., 1979: Soft Energy Paths: Toward a Durable Peace. Harper & Row, New York, NY, USA.
Lovins, A., 2015: The nuclear distraction. Bulletin of the Atomic Scientists, https://thebulletin.org/commentary/the-nuclear-distraction/ (Accessed December 16, 2019).
Lovins, A. et al., 2003: Small is Profitable: The Hidden Economic Benefits of Making Electrical Resources the Right Size. Rocky Mountain Institute, New York, NY, USA, 398 pp.
Lovins, A.B., T. Palazzi, R. Laemel, and E. Goldfield, 2018: Relative deployment rates of renewable and nuclear power: A cautionary tale of two metrics. Energy Res. Soc. Sci. , 38, 188–192, doi.org/10.1016/j.erss.2018.01.005.
Lucon, O. et al., 2014: Buildings. In: Climate Change 2014: Mitigation of Climate Change. Contribution of Working Group III to the Fifth Assessment Report of the Intergovernmental Panel on Climate Change[Edenhofer, O., R. Pichs-Madruga, Y. Sokona, E. Farahani, S. Kadner, K. Seyboth, A. Adler, I. Baum, S. Brunner, P. Eickemeier, B. Kriemann, J. Savolainen, S. Schlömer, C. von Stechow, T. Zwickel and J.C. Minx (eds.)], Cambridge University Press, Cambridge, UK and New York, NY, USA, pp. 671–738.
Ludmann, S., 2019: Ökologische Betrachtung des Peer-to-Peer Sharing. In: Digitale Kultur des Teilens[Behrendt, S., C, Henseling, and G. Scholl (eds.)] Springer Fachmedien Wiesbaden, Wiesbaden, Germany, pp. 71–93.
Lundqvist, J., C. de Fraiture, and D. Molden, 2008: Saving Water: From Field to Fork – Curbing Losses and Wastage in the Food Chain. Stockholm International Water Institute, Stockholm, Sweden, 36 pp. http://www.siwi.org/publications/ (Accessed May 23, 2021).
Lutzenhiser, L., 1993: Social and behavioral aspects of energy use contents introduction. Annu. Rev. Energy Env. , 18, 247–289, doi:10.1146/annurev.eg.18.110193.001335.
Lynch, M.J., M.A. Long, P.B. Stretesky, and K.L. Barrett, 2019: Measuring the Ecological Impact of the Wealthy: Excessive Consumption, Ecological Disorganization, Green Crime, and Justice. Soc. Curr. , 6(4) , 377–395, doi:10.1177/2329496519847491.
Ma, T., A. Grubler, N. Nakicenovic, and W.B. Arthur, 2008: Technologies as agents of change: A simulation model of the evolving complexity of the global energy system. International Institute for Applied Systems Analysis, Laxenburg, Austria, http://pure.iiasa.ac.at/id/eprint/8762/ (Accessed May 23, 2021).
Macgregor, S., 2014: Only Resist: Feminist Ecological Citizenship and the Post-politics of Climate Change. Hypatia, 29(3) , 617–633, doi:10.1111/hypa.12065.
Maestre-Andrés, S., S. Drews, and J. van den Bergh, 2019: Perceived fairness and public acceptability of carbon pricing: a review of the literature. Clim. Policy, 19(9) , 1186–1204, doi:10.1080/14693062.2019.1639490.
Mahadevan, M., A. Francis, and A. Thomas, 2020: A simulation-based investigation of sustainability aspects of 3D printed structures. J. Build. Eng. , 32, 101735, doi.org/10.1016/j.jobe.2020.101735.
Mahajan, V., E. Muller, and F.M. Bass, 1990: New product diffusion models in marketing: A review and directions for research. J. Mark. , 54(1) , 1–26, doi:10.2307/1252170.
Mahapatra, K. and L. Gustavsson, 2008: An adopter-centric approach to analyze the diffusion patterns of innovative residential heating systems in Sweden. Energy Policy, 36(2) , 577–590, doi:10.1016/J.ENPOL.2007.10.006.
Mahler, D.G., C. Lakner, R.A.C. Aguilar, and H. Wu, 2020: Updated estimates of the impact of COVID-19 on global poverty. World Bank Blog, https://blogs.worldbank.org/opendata/updated-estimates-impact-covid-19-global-poverty-turning-corner-pandemic-2021 (Accessed November 26, 2020).
Maibach, E.W., A. Leiserowitz, C. Roser-Renouf, and C.K. Mertz, 2011: Identifying Like-Minded Audiences for Global Warming Public Engagement Campaigns: An Audience Segmentation Analysis and Tool Development. PLoS One, 6(3) , e17571, doi:10.1371/journal.pone.0017571.
Maïzi, N. and V. Mazauric, 2019: From centralized to decentralized power systems: The shift on finitude constraints. Energy Procedia, 158(2019) , 4262–4267, doi:10.1016/j.egypro.2019.01.800.
Maïzi, N. et al., 2017: Maximizing intermittency in 100% renewable and reliable power systems: A holistic approach applied to Reunion Island in 2030. Appl. Energy, 227, 332–341, doi:10.1016/j.apenergy.2017.08.058.
Maki, A. and A.J. Rothman, 2017: Understanding proenvironmental intentions and behaviors: The importance of considering both the behavior setting and the type of behavior. J. Soc. Psychol. , 157(5) , 517–531, doi:10.1080/00224545.2016.1215968.
Makov, T. and D. Font Vivanco, 2018: Does the Circular Economy Grow the Pie? The Case of Rebound Effects From Smartphone Reuse. Front. Energy Res. , 6, 39, doi:10.3389/fenrg.2018.00039.
Malmodin, J., 2020: The power consumption of mobile and fixed network data services – The case of streaming video and downloading large files. In: Proceedings of the Electronics Goes Green 2020+ Conference, Berlin, Germany, September 1, 87–96.
Malmodin, J. and D. Lundén, 2018: The energy and carbon footprint of the global ICT and E&M sectors 2010–2015. Sustainability, 10(9) , 3027, doi:10.3390/su10093027.
Malmqvist, T. et al., 2018: Design and construction strategies for reducing embodied impacts from buildings – Case study analysis. Energy Build. , 166, 35–47, doi:10.1016/J.ENBUILD.2018.01.033.
Malone, E., N.E. Hultman, K.L. Anderson, and V. Romeiro, 2017: Energy Research & Social Science Stories about ourselves : How national narratives influence the diff usion of large-scale energy technologies. 31 (July), 70–76, doi:10.1016/j.erss.2017.05.035.
Mang-Benza, C., 2021: Many shades of pink in the energy transition: Seeing women in energy extraction, production, distribution, and consumption. Energy Res. Soc. Sci. , 73, 101901, doi:10.1016/J.ERSS.2020.101901.
Mani, A., S. Mullainathan, E. Shafir, and J. Zhao, 2013: Poverty impedes cognitive function. Science, 341(6149) , 976–980, doi:10.1126/science.1238041.
Mansfield, E., 1968: The Economics of Technological Change. W.W. Norton & Co., New York, NY, USA, 150 pp.
Manzanedo, R.D. and P. Manning, 2020: COVID-19: Lessons for the climate change emergency. Sci. Total Environ. , 742, 140563, doi:10.1016/j.scitotenv.2020.140563.
Maobe, A. and J. Atela, 2021: Gender Intersectionality and Disaster Risk Reduction-Context Analysis. UK Research and Innovation (UKRI) Global Challenges Research Fund (GCRF) Urban Disaster Risk Hub, Edinburgh, UK, https://tomorrowscities.org/sites/default/files/resources/2021-03/Gender Intersectionality and Disaster Risk Reduction.pdf (Accessed October 2, 2021).
Mardani, A., D. Streimikiene, F. Cavallaro, N. Loganathan, and M. Khoshnoudi, 2019: Carbon dioxide (CO2) emissions and economic growth: A systematic review of two decades of research from 1995 to 2017. Sci. Total Environ. , 649, 31–49, doi:10.1016/j.scitotenv.2018.08.229.
Mariam, N., K. Valerie, D. Karin, W.-R. Angelika, and L. Nina, 2020: Limiting food waste via grassroots initiatives as a potential for climate change mitigation: a systematic review. Environ. Res. Lett. , 15(12) , 123008, doi:10.1088/1748-9326/ABA2FE.
Markard, J. and V.H. Hoffmann, 2016: Analysis of complementarities: Framework and examples from the energy transition. Technol. Forecast. Soc. Change, 111, 63–75, doi:10.1016/j.techfore.2016.06.008.
Markard, J., R. Raven, and B. Truffer, 2012: Sustainability transitions : An emerging field of research and its prospects. Res. Policy, 41(6) , 955–967, doi:10.1016/j.respol.2012.02.013.
Marquardt, J., 2017: Conceptualizing power in multi-level climate governance. J. Clean. Prod. , 154, 167–175, doi:10.1016/j.jclepro.2017.03.176.
Marres, N., 2011: The costs of public involvement: everyday devices of carbon accounting and the materialization of participation. Econ. Soc. , 40(4) , 510–533, doi:10.1080/03085147.2011.602294.
Martin, C.J., 2016: The sharing economy: A pathway to sustainability or a nightmarish form of neoliberal capitalism?Ecol. Econ. , 121, 149–159, doi.org/10.1016/j.ecolecon.2015.11.027.
Martin, E. and S. Shaheen, 2016: Impacts of car2go on Vehicle Ownership, Modal Shift, Vehicle Miles Traveled, and Greenhouse Gas Emissions: An Analysis of Five North American Cities. Transportation Sustainability Research Center, Berkeley, CA, USA, 25 pp. http://innovativemobility.org/wp-content/uploads/2016/07/Impactsofcar2go_FiveCities_2016.pdf (Accessed July 23, 2021).
Martin, E.W. and S.A. Shaheen, 2011: Greenhouse gas emission impacts of carsharing in North America. IEEE Trans. Intell. Transp. Syst. , 12(4) , 1074–1086, doi:10.1109/TITS.2011.2158539.
Martínez-Gómez, J., D. Ibarra, S. Villacis, P. Cuji, and P.R. Cruz, 2016: Analysis of LPG, electric and induction cookers during cooking typical Ecuadorian dishes into the national efficient cooking program. Food Policy, 59, 88–102, doi:10.1016/j.foodpol.2015.12.010.
Martínez, J., J. Martí-Herrero, S. Villacís, A.J.J. Riofrio, and D. Vaca, 2017: Analysis of energy, CO2 emissions and economy of the technological migration for clean cooking in Ecuador. Energy Policy, 107, 182–187, doi:10.1016/j.enpol.2017.04.033.
Martinez, L.M. and J.M. Viegas, 2017: Assessing the impacts of deploying a shared self-driving urban mobility system: An agent-based model applied to the city of Lisbon, Portugal. Int. J. Transp. Sci. Technol. , 6(1) , 13–27, doi:10.1016/J.IJTST.2017.05.005.
Martinez, N.B., 2020: The Politics of Sociocultural Impacts in Mexico’s Ongoing Energy Transition. UC Berkeley, CA, USA, https://escholarship.org/uc/item/7pm2p7g7 (Accessed October 2, 2021).
Martino, J.P., K.-L. Chen, and R.C. Lenz, 1978: Predicting the Diffusion Rate of Industrial Innovations. University of Dayton Research Institute Technical Report UDRI-TR-78-42, Springfield, VA, USA.
Martiskainen, M. et al., 2020: Contextualizing climate justice activism: Knowledge, emotions, motivations, and actions among climate strikers in six cities. Glob. Environ. Change, 65, 102180, doi:10.1016/j.gloenvcha.2020.102180.
Masanet, E. and H.S. Matthews, 2010: Exploring Environmental Applications and Benefits of Information and Communication Technology. J. Ind. Ecol. , 14(5) , 687–691, doi:10.1111/J.1530-9290.2010.00285.X.
Masanet, E., A. Shehabi, N. Lei, S. Smith, and J. Koomey, 2020: Recalibrating global data center energy-use estimates: Growth in energy use has slowed owing to efficiency gains that smart policies can help maintain in the near term. Science, 367(6481) , doi:10.1126/science.aba3758.
Masanet, E.R., R.E. Brown, A. Shehabi, J.G. Koomey, and B. Nordman, 2011: Estimating the energy use and efficiency potential of U.S. data centers. Proc. IEEE, 99(8) , 1440–1453, doi:10.1109/JPROC.2011.2155610.
Mastrucci, A. and N.D. Rao, 2017: Decent housing in the developing world: Reducing life-cycle energy requirements. Energy Build. , 152, 629–642, doi:10.1016/j.enbuild.2017.07.072.
Mastrucci, A. and N.D. Rao, 2019: Bridging India’s housing gap: lowering costs and CO2 emissions. Build. Res. Inf. , 47(1) , 8–23, doi:10.1080/09613218.2018.1483634.
Mastrucci, A., J. Min, A. Usubiaga-Liaño, and N.D. Rao, 2020: A Framework for Modelling Consumption-Based Energy Demand and Emission Pathways. Environ. Sci. Technol. , 54(3) , 1799–1807, doi:10.1021/ACS.EST.9B05968.
Material Economics, 2018: The Circular Economy: a Powerful Force for Climate Mitigation. Material Economics, Stockholm, Sweden, 176 pp. https://materialeconomics.com/publications/the-circular-economy-a-powerful-force-for-climate-mitigation-1.
Matson, P., W.C. Clark, and K. Andersson, 2016: Pursuing Sustainability. Princeton University Press, Princeton, NJ, USA.
Mattauch, L. and C. Hepburn, 2016: Climate Policy When Preferences Are Endogenous – and Sometimes They Are. Midwest Stud. Philos. , 40(1) , 76–95, doi:10.1111/misp.12048.
Mattauch, L., M. Ridgway, and F. Creutzig, 2016: Happy or liberal? Making sense of behavior in transport policy design. Transp. Res. Part D Transp. Environ. , 45 (June 2016), 64–83, doi:10.1016/j.trd.2015.08.006.
Mattauch, L., C. Hepburn, and N. Stern, 2018: Pigou Pushes Preferences: Decarbonisation and Endogenous Values. Climate Change Economics and Policy Working Paper 346/Grantham Research Institute on Climate Change and the Environment Working Paper 314. London School of Economics and Political Science, London, UK, 37 pp. http://www.lse.ac.uk/GranthamInstitute/wp-content/uploads/2018/12/working-paper-314-Mattauch-et-al.pdf (Accessed July 4, 2019).
Matthies, E., C.A. Klockner, and C.L. Preissner, 2006: Applying a Modified Moral Decision Making Model to Change Habitual Car Use: How Can Commitment be Effective?Appl. Psychol. , 55(1) , 91–106, doi:10.1111/j.1464-0597.2006.00237.x.
Mattioli, G., 2016: Transport needs in a climate-constrained world. A novel framework to reconcile social and environmental sustainability in transport. Energy Res. Soc. Sci. , 18, 118–128, doi:10.1016/j.erss.2016.03.025.
Mattioli, G., C. Roberts, J.K. Steinberger, and A. Brown, 2020: The political economy of car dependence: A systems of provision approach. Energy Res. Soc. Sci. , 66, doi:10.1016/j.erss.2020.101486.
Maumbe, B.M., 2006: Digital Financial Service Delivery to Poor Communities in South Africa: A Preliminary Assessment. Int. Rev. Bus. Res. Pap. , 2(2) , 72–79.
Max-Neef, M., 1995: Economic growth and quality of life: a threshold hypothesis. Ecol. Econ. , 15(2) , 115–118, doi.org/10.1016/0921-8009(95)00064-X.
Max-Neef, M., A. Elizalde, and Martín Hopenhayn, 1989: Human scale development: An option for the future. Development Dialogue 1(1) , pp. 7–80.
Max-Neef, M.A., M. Hopenhayn, and A. Elizalde, 1991: Human scale development: conception, application and further reflections. 2nd ed. The Apex Press, New York, NY, USA.
Mazeka, B., C. Sutherland, S. Buthelezi, and D. Khumalo, 2019: Community-Based Mapping Methodology for Climate Change Adaptation: A Case Study of Quarry Road West Informal Settlement, Durban, South Africa. In: The Geography of Climate Change Adaptation in Urban Africa[Cobbinah, P.B. and Addaney, M. (eds.)] Springer International Publishing, Cham, Switzerland, pp. 57–88.
Mazorra, J., E. Sánchez-Jacob, C. de la Sota, L. Fernández, and J. Lumbreras, 2020: A comprehensive analysis of cooking solutions co-benefits at household level: Healthy lives and well-being, gender and climate change. Sci. Total Environ. , 707, 135968, doi:10.1016/J.SCITOTENV.2019.135968.
Mazur, A., and E. Rosa, 1974: Energy and life-style. Science, 186(4164) , 607–610, doi:10.1126/science.186.4164.607.
Mbaye, A.A. and F. Gueye, 2018: The Competitiveness Challenge of the Formal Sector in Francophone Africa: Understanding the Role of the Informal Sector and the Business Environment. In: Africa’s Competitiveness in the Global Economy[Adeleye, I. and M. Esposito (eds.)], Springer International Publishing, Cham, Switzerland, pp. 25–51.
Mbow, C. C. Rosenzweig, L.G. Barioni, T.G. Benton, M. Herrero, M. Krishnapillai, E. Liwenga, P. Pradhan, M.G. Rivera-Ferre, T. Sapkota, F.N. Tubiello, Y. Xu, 2019: Food security. In: Climate Change and Land: an IPCC special report on climate change, desertification, land degradation, sustainable land management, food security, and greenhouse gas fluxes in terrestrial ecosystems[P.R. Shukla, J. Skea, E. Calvo Buendia, V. Masson-Delmotte, H.-O. Pörtner, D.C. Roberts, P. Zhai, R. Slade, S. Connors, R. van Diemen, M. Ferrat, E. Haughey, S. Luz, S. Neogi, M. Pathak, J. Petzold, J. Portugal Pereira, P. Vyas, E. Huntley, K. Kissick, M. Belkacemi, J. Malley, (eds.)]. Cambridge University Press, Cambridge, UK and New York, NY, USA, pp. 437–550.
McCalley, L.T. and C.J.H. Midden, 2002: Energy conservation through product-integrated feedback: The roles of goal-setting and social orientation. J. Econ. Psychol. , 23(5) , 589–603, doi:10.1016/S0167-4870(02)00119-8.
McCright, A.M. and R.E. Dunlap, 2011: Cool dudes: The denial of climate change among conservative white males in the United States. Glob. Environ. Change, 21(4) , 1163–1172, doi:10.1016/j.gloenvcha.2011.06.003.
McCright, A.M. and C. Xiao, 2014: Gender and Environmental Concern: Insights from Recent Work and for Future Research. Soc. Nat. Resour. , 27(10) , 1109–1113, doi:10.1080/08941920.2014.918235.
McDonough, W., and M. Braungart, 2002: Cradle to cradle: remaking the way we make things. North Point Press, 193 pp.
McDowall, W. et al., 2017: Circular Economy Policies in China and Europe. J. Ind. Ecol. , 21(3) , 651–661, doi.org/10.1111/jiec.12597.
McGee, J.A., and P.T. Greiner, 2018: Can Reducing Income Inequality Decouple Economic Growth from CO2 Emissions?Socius Sociol. Res. A Dyn. World, 4, 1–11, doi:10.1177/2378023118772716.
McKerracher, C. and J. Torriti, 2013: Energy consumption feedback in perspective: integrating Australian data to meta-analyses on in-home displays. Energy Effic. , 6(2) , 387–405, doi:10.1007/s12053-012-9169-3.
McLaren, H.J., K.R. Wong, K.N. Nguyen, and K.N.D. Mahamadachchi, 2020: Covid-19 and women’s triple burden: Vignettes from Sri Lanka, Malaysia, Vietnam and Australia. Soc. Sci. , 9(5) , 87, doi:10.3390/SOCSCI9050087.
McMeekin, A. and D. Southerton, 2012: Sustainability transitions and final consumption: Practices and socio-technical systems. Technol. Anal. Strateg. Manag. , 24(4) , 345–361, doi:10.1080/09537325.2012.663960.
McMeekin, A., F.W. Geels, and M. Hodson, 2019: Mapping the winds of whole system reconfiguration: Analysing low-carbon transformations across production, distribution and consumption in the UK electricity system (1990–2016). Res. Policy, 48(5) , 1216–1231, doi:10.1016/j.respol.2018.12.007.
Meade, N. and T. Islam, 2006: Modelling and forecasting the diffusion of innovation – A 25-year review. Int. J. Forecast. , 22(3) , 519–545, doi:10.1016/j.ijforecast.2006.01.005.
Meadowcroft, J., 2011: Environmental Innovation and Societal Transitions Engaging with the politics of sustainability transitions. Environ. Innov. Soc. Transitions, 1(1) , 70–75, doi:10.1016/j.eist.2011.02.003.
Mearns, R. and A. Norton, 2009: Social dimensions of climate change : equity and vulnerability in a warming world. World Bank, Washington, DC, USA, 319 pp.
Meckling, J., T. Sterner, and G. Wagner, 2017: Policy sequencing toward decarbonization. Nat. Energy, 2(12) , 918–922, doi:10.1038/s41560-017-0025-8.
Medina, M.A.P. and A.G. Toledo-Bruno, 2016: Ecological footprint of university students: Does gender matter?Autumn 2016 Glob. J. Environ. Sci. Manag. , 2(4) , 339–344, doi:10.22034/gjesm.2016.02.04.003.
Méjean, A., C. Guivarch, J. Lefèvre, and M. Hamdi-Cherif, 2019: The transition in energy demand sectors to limit global warming to 1.5°C. Energy Effic. , 12(2) , 441–462, doi:10.1007/s12053-018-9682-0.
Mekuriaw, A., 2017: Towards a methodological approach to document and analyze local knowledge of climate change: with evidence from Rift Balley and Blue Nile Basins, Ethiopia. In: Climate Change Adaptation in Africa: Fostering Resilience and Capacity to Adapt [Leal Filho, W. et al. (eds.)], Springer, Cham, Switzerland, pp. 689–710.
Mekuriaw Bizuneh, A., 2013: Climate Variability and Change in the Rift Valley and Blue Nile Basin. Logos Verlag, Berlin, Germany.
Melville, N.P., 2010: Information Systems Innovation for Environmental Sustainability. MIS Q. , 34(1) , 1–21, doi:10.2307/20721412.
Mendiluce, M., 2021: Your Company Pledged to Reduce Its Carbon Footprint. Now What?Harvard Business Review.
Mendoza, M.E.B., and O.G.M. Roa, 2014: Educomunicación y medio ambiente: en la búsqueda y construcción de fisuras. Rev. Investig. Agrar. y Ambient. , 5(1) , doi:10.22490/21456453.960.
Merlin, L.A., 2019: Transportation Sustainability Follows From More People in Fewer Vehicles, Not Necessarily Automation. J. Am. Plan. Assoc. , 85(4) , 501–510, doi:10.1080/01944363.2019.1637770.
Messner, D., 2015: A social contract for low carbon and sustainable development: Reflections on non-linear dynamics of social realignments and technological innovations in transformation processes. Technol. Forecast. Soc. Change, 98, 260–270, doi:10.1016/j.techfore.2015.05.013.
Mi, L. et al., 2020: Evaluating the effect of eight customized information strategies on urban households’ electricity saving: A field experiment in China. Sustain. Cities Soc. , 62 (November 2020), 102344, doi:10.1016/j.scs.2020.102344.
Mi, Z. and D.M. Coffman, 2019: The sharing economy promotes sustainable societies. Nat. Commun. , 10(1) , 5–7, doi:10.1038/s41467-019-09260-4.
Michie, S., M.M. van Stralen, and R. West, 2011: The behaviour change wheel: A new method for characterising and designing behaviour change interventions. Implement. Sci. , 6(1) , 42, doi:10.1186/1748-5908-6-42.
Milfont, T.L., J. Wilson, and P. Diniz, 2012: Time perspective and environmental engagement: A meta-analysis. Int. J. Psychol. , 47(5) , 325–334, doi:10.1080/00207594.2011.647029.
Milkoreit, M., 2017: Imaginary politics: Climate change and making the future. Elementa, 5(62) , doi:10.1525/elementa.249.
Miller, D.T. and D.A. Prentice, 2016: Changing Norms to Change Behavior. Annu. Rev. Psychol. , 67(1) , 339–361, doi:10.1146/annurev-psych-010814-015013.
Miller, S.A., 2020: The role of cement service-life on the efficient use of resources. Environ. Res. Lett. , 15(2) , 024004, doi:10.1088/1748-9326/AB639D.
Millot, A. et al., 2018: France 2072: Lifestyles at the core of carbon neutrality challenges. In: Limiting Global Warming to Well Below 2°C: Energy System Modelling and Policy Development. Lecture Notes in Energy 54[Giannakidis, G., K.B. Karlsson, M. Labriet, and B. Gallachóir, (eds.)], Vol. 64, Springer Verlag, Berlin, Germany, pp. 173–190.
Mills, B. and J. Schleich, 2012: Residential energy-efficient technology adoption, energy conservation, knowledge, and attitudes: An analysis of European countries. Energy Policy, 49, 616–628, doi:10.1016/J.ENPOL.2012.07.008.
Millward-Hopkins, J. and Y. Oswald, 2021: ‘Fair’ inequality, consumption and climate mitigation. Environ. Res. Lett. , 16(3) , 034007, doi:10.1088/1748-9326/ABE14F.
Millward-Hopkins, J., J.K. Steinberger, N.D. Rao, and Y. Oswald, 2020: Providing decent living with minimum energy: A global scenario. Glob. Environ. Change, 65, 102168, doi:10.1016/j.gloenvcha.2020.102168.
MINTEL, 2019: MINTEL Global New Products Database. https://www.mintel.com/global-new-products-database/features (Accessed November 27, 2020).
Mitchell, J.K., 2015: Governance of megacity disaster risks: Confronting the contradictions. In: Risk Governance: The Articulation of Hazard, Politics and Ecology[Fra Paleo, U., (ed.)], Springer, Dordrecht, the Netherlands, pp. 413–439.
Moberg, K.R. et al., 2019: Mobility, food and housing: responsibility, individual consumption and demand-side policies in European deep decarbonisation pathways. Energy Effic. , 12(2) , 497–519, doi:10.1007/s12053-018-9708-7.
Moeckel, R. and R. Lewis, 2017: Two decades of smart growth in Maryland (U.S.A): impact assessment and future directions of a national leader. Urban, Plan. Transp. Res. , 5(1) , 22–37, doi:10.1080/21650020.2017.1304240.
Möhlmann, M., 2015: Collaborative consumption: determinants of satisfaction and the likelihood of using a sharing economy option again. J. Consum. Behav. , 14(3) , 193–207, doi:10.1002/cb.1512.
Mokhtarian, P.L., 2002: Telecommunications and travel: The case for complementarity. J. Ind. Ecol. , 6(2) , 43–57, doi:10.1162/108819802763471771.
Monasterolo, I. and M. Raberto, 2019: The impact of phasing out fossil fuel subsidies on the low-carbon transition. Energy Policy, 124, 355–370, doi:10.1016/j.enpol.2018.08.051.
Mondal, M.A.H., E. Bryan, C. Ringler, D. Mekonnen, and M. Rosegrant, 2018: Ethiopian energy status and demand scenarios: Prospects to improve energy efficiency and mitigate GHG emissions. Energy, 149, 161–172, doi:10.1016/j.energy.2018.02.067.
Mont, O., Y.V. Palgan, K. Bradley, and L. Zvolska, 2020: A decade of the sharing economy: Concepts, users, business and governance perspectives. J. Clean. Prod. , 269, 122215, doi:10.1016/j.jclepro.2020.122215.
Moran, D. et al., 2020: Quantifying the potential for consumer-oriented policy to reduce European and foreign carbon emissions. Clim. Policy, 20 (sup1), doi:10.1080/14693062.2018.1551186.
Moreau, V., M. Sahakian, P. van Griethuysen, and F. Vuille, 2017: Coming Full Circle: Why Social and Institutional Dimensions Matter for the Circular Economy. J. Ind. Ecol. , 21(3) , 497–506, doi:10.1111/jiec.12598.
Morello Frosch, R., M. Pastor, J. Sadd, and S. Shonkoff, 2009: The Climate Gap: Inequalities in How Climate Change Hurts Americans & How to Close the Gap. Equity Research Institute, https://dornsife.usc.edu/pere/climategap/ (Accessed December 3, 2020).
Morris, C., J. Kirwan, and R. Lally, 2014: Less Meat Initiatives: An Initial Exploration of a Diet-focused Social Innovation in Transitions to a More Sustainable Regime of Meat Provisioning. Int. J. Sociol. Agric. Food, 21(2) , 189–208.
Morstyn, T., N. Farrell, S.J. Darby, and M.D. McCulloch, 2018: Using peer-to-peer energy-trading platforms to incentivize prosumers to form federated power plants. Nat. Energy, 3(2) , doi:10.1038/s41560-017-0075-y.
Mortensen, C.R. et al., 2019: Trending Norms: A Lever for Encouraging Behaviors Performed by the Minority. Soc. Psychol. Personal. Sci. , 10(2) , 201–210, doi:10.1177/1948550617734615.
Moser, S.C. and J.A. Ekstrom, 2010: A framework to diagnose barriers to climate change adaptation. Proc. Natl. Acad. Sci. , 107(51) , 22026, doi:10.1073/PNAS.1007887107.
Muchie, M., S. Bhaduri, A. Baskaran, and F.A. Sheikh (eds.), 2016: Informal Sector Innovations: Insights from the Global South. Routledge, Abingdon, UK, 178 pp.
Mulder, L.B., E. Van Dijk, D. De Cremer, and H.A.M. Wilke, 2006: Undermining trust and cooperation: The paradox of sanctioning systems in social dilemmas. J. Exp. Soc. Psychol. , 42, 147–162, doi:10.1016/j.jesp.2005.03.002.
Muller, A. et al., 2017: Strategies for feeding the world more sustainably with organic agriculture. Nat. Commun. , 8(1) , doi:10.1038/s41467-017-01410-w.
Mulugetta, Y., E. Ben Hagan, and D. Kammen, 2019: Energy access for sustainable development . Institute of Physics Publishing, Bristol, UK.
Mundaca, L., H. Busch, and S. Schwer, 2018: ‘Successful’ low-carbon energy transitions at the community level? An energy justice perspective.’Appl. Energy, 218, 292–303, doi:10.1016/j.apenergy.2018.02.146.
Mundaca, L., D. Ürge-Vorsatz, and C. Wilson, 2019: Demand-side approaches for limiting global warming to 1.5°C. Energy Effic. , 12(2) , 343–362, doi:10.1007/s12053-018-9722-9.
Muñoz, I. et al., 2021: Life cycle assessment of integrated additive–subtractive concrete 3D printing. Int. J. Adv. Manuf. Technol. , 112(7) , 2149–2159, doi:10.1007/S00170-020-06487-0.
Murray, A., K. Skene, and K. Haynes, 2017: The Circular Economy: An Interdisciplinary Exploration of the Concept and Application in a Global Context. J. Bus. Ethics, 140(3) , 369–380, doi:10.1007/s10551-015-2693-2.
Muttitt, G. and S. Kartha, 2020: Equity, climate justice and fossil fuel extraction: principles for a managed phase out. Clim. Policy, 1–19, doi:10.1080/14693062.2020.1763900.
Mylan, J., 2018: Sustainable consumption in everyday life: A qualitative study of UK consumer experiences of meat reduction. Sustainability, 10(7) , 2307, doi:10.3390/su10072307.
Myrick, J.G. and S. Evans Comfort, 2019: The Pope May Not Be Enough: How Emotions, Populist Beliefs, and Perceptions of an Elite Messenger Interact to Influence Responses to Climate Change Messaging. Mass Commun. Soc. , 23(1) , 1–21, doi:10.1080/15205436.2019.1639758.
Nabi, A.A. et al., 2020: Relationship between population growth, price level, poverty incidence, and carbon emissions in a panel of 98 countries. Environ. Sci. Pollut. Res. , 27(2020) , 31778–31792, doi:10.1007/s11356-020-08465-1.
Nadel, S. and L. Ungar, 2019: Halfway there: Energy efficiency can cut energy use and greenhouse gas emissions in half by 2050. American Council for an Energy-Efficient Economy, Washington, DC, USA, 70 pp. https://www.aceee.org/sites/default/files/publications/researchreports/u1907.pdf .
Nagel, J., 2015: Gender and climate change: Impacts, science, policy. Routledge, Abingdon, UK, 249 pp.
Nagy, D., J. Schuessler, and A. Dubinsky, 2016: Defining and identifying disruptive innovations. Ind. Mark. Manag. , 57, doi:10.1016/j.indmarman.2015.11.017.
Nakićenović, N. et al., 1993: Long term strategies for mitigating global warming. Energy, 18(5) , 401–609, doi:10.1016/0360-5442(93)90019-A.
Nakićenović, N., P.V. Gilli, and R. Kurz, 1996a: Regional and global exergy and energy efficiencies. Energy, 21(3) , 223–237, doi:10.1016/0360-5442(96)00001-1.
Nakićenović, N., A. Grübler, H. Ishitani, T. Johansson, G. Marland, J.R. Moreira, H-H. Rogner, 1996b: Energy Primer. In: Climate Change 1995: Impacts, Adaptations and Mitigation of Climate Change: Scientific-Technical Analyses. Contribution of Working Group II to the Second Assessment Report of the Intergovernmental Panel on Climate Change[Watson, R.T., M.C. Zinyowera, and R.H. Moss, (eds.)], Cambridge University Press, Cambridge, UK, and New York, NY, USA, pp. 77–94.
Namazu, M. and H. Dowlatabadi, 2015: Characterizing the GHG emission impacts of carsharing: A case of Vancouver. Environ. Res. Lett. , 10(12) , doi:10.1088/1748-9326/10/12/124017.
Nandi, S., J. Sarkis, A.A. Hervani, and M.M. Helms, 2020: Redesigning Supply Chains using Blockchain-Enabled Circular Economy and COVID-19 Experiences. Sustain. Prod. Consum. , 27, 10–22, doi:10.1016/j.spc.2020.10.019.
Nandy, B. et al., 2015: Recovery of consumer waste in India – A mass flow analysis for paper, plastic and glass and the contribution of households and the informal sector. Resour. Conserv. Recycl. , 101, 167–181, doi:10.1016/j.resconrec.2015.05.012.
Napp, T.A. et al., 2019: The role of advanced demand-sector technologies and energy demand reduction in achieving ambitious carbon budgets. Appl. Energy, 238, pp. 351–367, doi:10.1016/j.apenergy.2019.01.033.
Narayan, L., 2017: Contextualizing unpaid care work and women empowerment. Int. J. Appl. Res. , 3(7) , 654–659.
Nasir, M.H.A., A. Genovese, A.A. Acquaye, S.C.L. Koh, and F. Yamoah, 2017: Comparing linear and circular supply chains: A case study from the construction industry. Int. J. Prod. Econ. , 183, 443–457, doi:10.1016/j.ijpe.2016.06.008.
Nasr, N. et al., 2018: Redefining value: manufacturing revolution-remanufacturing, refurbishment, repair and direct reuse in the circular economy. United Nations Environment Programme, Nairobi, Kenya, 267 pp.
Nayak, B.P., C. Werthmann, and V. Aggarwal, 2015: Trust and cooperation among urban poor for transition to cleaner and modern cooking fuel. Environ. Innov. Soc. Transitions, 14, 116–127, doi:10.1016/j.eist.2014.09.002.
négawatt Association, 2018: négaWatt scenario 2017–2050: A blueprint for a succesful energy transition in France. négaWatt Association, Valence, France, https://negawatt.org/IMG/pdf/181128_negawatt-scenario_eng_12p.pdf (Accessed December 5, 2021).
Nelson, E.J. et al., 2013: Climate change’s impact on key ecosystem services and the human well‐being they support in the US. Front. Ecol. Environ. , 11(9) , 483–893, doi:10.1890/120312.
Nelson, R. and E.S. Phelps, 1966: Investment in Humans, Technological Diffusion, and Economic Growth. Am. Econ. Rev. , 56(1) , 69–75, doi:10.1016/b978-0-12-554002-5.50015-7.
Nemati, M. and J. Penn, 2020: The impact of information-based interventions on conservation behavior: A meta-analysis. Resour. Energy Econ. , 62, 101201, doi:10.1016/j.reseneeco.2020.101201.
Nepal, M., A. Nepal, and K. Grimsrud, 2010: Unbelievable but improved cookstoves are not helpful in reducing firewood demand in Nepal. Environ. Dev. Econ. , 16(1) , 1–23, doi:10.1017/S1355770X10000409.
Newell, P., 2005: Climate for Change? Civil Society and the Politics of Global Warming. In: Global Civil Society 2005/6[Glasius, M., M. Kaldor, and H. Anheier, (eds.)], SAGE Publications Inc., pp. 120–149.
Newell, R.G. and J. Siikamäki, 2014: Nudging Energy Efficiency Behavior: The Role of Information Labels. J. Assoc. Environ. Resour. Econ. , 1(4) , 555–598, doi:10.1086/679281.
Newman, P. and J.R. Kenworthy, 2015: The End of Automobile Dependence: How Cities are Moving Beyond Car-based Planning. Island Press, Washington, DC, USA, 320 pp.
Newman, P., T. Beatley, and H. Boyer, 2017: Resilient Cities: Overcoming Fossil Fuel Dependence. 2nd ed. Island Press, Washington, DC, USA, 264 pp.
Ng, W. and E. Diener, 2019: Affluence and Subjective Well-Being: Does Income Inequality Moderate their Associations?Appl. Res. Qual. Life, 14(1) , 155–170, doi:10.1007/s11482-017-9585-9.
Ngamaba, K.H., M. Panagioti, and C.J. Armitage, 2018: Income inequality and subjective well-being: a systematic review and meta-analysis. Qual. Life Res. , 27(3) , 577–596, doi:10.1007/s11136-017-1719-x.
Niamir, L., 2019: Behavioural Climate Change Mitigation: from individual energy choices to demand-side potential. University of Twente, Enschede, the Netherlands, 267 pp.
Niamir, L., T. Filatova, A. Voinov, and H. Bressers, 2018: Transition to low-carbon economy: Assessing cumulative impacts of individual behavioral changes. Energy Policy, 118, 325–345, doi:10.1016/j.enpol.2018.03.045.
Niamir, L., O. Ivanova, and T. Filatova, 2020a: Economy-wide impacts of behavioral climate change mitigation: Linking agent-based and computable general equilibrium models. Environ. Model. Softw. , 134, 104839, doi:10.1016/j.envsoft.2020.104839.
Niamir, L., O. Ivanova, T. Filatova, A. Voinov, and H. Bressers, 2020b: Demand-side solutions for climate mitigation: Bottom-up drivers of household energy behavior change in the Netherlands and Spain. Energy Res. Soc. Sci. , 62(101356) , 101356, doi:10.1016/j.erss.2019.101356.
Niamir, L. et al., 2020c: Assessing the macroeconomic impacts of individual behavioral changes on carbon emissions. Clim. Change, 158, 141–160, doi:10.1007/s10584-019-02566-8.
Nicoson, C., 2021: Towards climate resilient peace: an intersectional and degrowth approach. Sustain. Sci. , 16(4) , 1147–1158, doi:10.1007/S11625-021-00906-1.
Nielsen, K.R., L.A. Reisch, and J. Thøgersen, 2016: Sustainable user innovation from a policy perspective: a systematic literature review. J. Clean. Prod. , 133, 65–77, doi:10.1016/j.jclepro.2016.05.092.
Nijland, H. and J. van Meerkerk, 2017: Mobility and environmental impacts of car sharing in the Netherlands. Environ. Innov. Soc. Transitions, 23, 84–91, doi:10.1016/j.eist.2017.02.001.
Nijland, H., J. Van Meerkerk, and A. Hoen, 2015: Impact of car sharing on mobility and CO2 emissions. PBL Netherlands Environmental Assessment Agency, The Hague, the Netherlands, 12 pp. https://www.pbl.nl/sites/default/files/downloads/PBL_2015_Note_Impact_of_car_sharing_1842.pdf (Accessed December 9, 2020).
Nikas, A. et al., 2020: The desirability of transitions in demand: Incorporating behavioural and societal transformations into energy modelling. Energy Res. Soc. Sci. , 70, 101780, doi:10.1016/J.ERSS.2020.101780.
Nisa, C.F., J.J. Bélanger, B.M. Schumpe, and D.G. Faller, 2019: Meta-analysis of randomised controlled trials testing behavioural interventions to promote household action on climate change. Nat. Commun. , 10(1) , 4545, doi:10.1038/s41467-019-12457-2.
Nkrumah, B., 2021: Beyond Tokenism: The “Born Frees” and Climate Change in South Africa. Int. J. Ecol. , 2021, doi:10.1155/2021/8831677.
Nolan, J.M., P.W. Schultz, R.B. Cialdini, N.J. Goldstein, and V. Griskevicius, 2008: Normative social influence is underdetected. Personal. Soc. Psychol. Bull. , 34(7) , 913–923, doi:10.1177/0146167208316691.
Noppers, E.H., K. Keizer, J.W. Bolderdijk, and L. Steg, 2014: The adoption of sustainable innovations: Driven by symbolic and environmental motives. Glob. Environ. Change, 25(1) , 52–62, doi:10.1016/j.gloenvcha.2014.01.012.
Noppers, E.H., K. Keizer, M. Bockarjova, and L. Steg, 2015: The adoption of sustainable innovations: The role of instrumental, environmental, and symbolic attributes for earlier and later adopters. J. Environ. Psychol. , 44, 74–84, doi:10.1016/j.jenvp.2015.09.002.
Noppers, E.H., K. Keizer, M. Milovanovic, and L. Steg, 2016: The importance of instrumental, symbolic, and environmental attributes for the adoption of smart energy systems. Energy Policy, 98, 12–18, doi:10.1016/j.enpol.2016.08.007.
Nordhaus, T., 2019: The Empty Radicalism of the Climate Apocalypse. Issues Sci. Technol. , 35(4) , 69–78.
Norouzi, N., G. Zarazua de Rubens, S. Choubanpishehzafar, and P. Enevoldsen, 2020: When pandemics impact economies and climate change: Exploring the impacts of COVID-19 on oil and electricity demand in China. Energy Res. Soc. Sci. , 68, 101654, doi:10.1016/j.erss.2020.101654.
Norton, B., 2012: No Title. Saving waste: Energy use and waste analysis by end-use. Presentation. November 13.
Noy, K, and M. Givoni, 2018: Is ‘Smart Mobility’ Sustainable? Examining the Views and Beliefs of Transport’s Technological Entrepreneurs. Sustainability, 10(2) , 422, doi:10.3390/su10020422.
Nußholz, J.L.K., F. Nygaard Rasmussen, and L. Milios, 2019: Circular building materials: Carbon saving potential and the role of business model innovation and public policy. Resour. Conserv. Recycl. , 141 (November 2018), 308–316, doi:10.1016/j.resconrec.2018.10.036.
Nyborg, K. and M. Rege, 2003: On social norms: the evolution of considerate smoking behavior. J. Econ. Behav. Organ. , 52(3) , 323–340, doi:10.1016/S0167-2681(03)00031-3.
Nyborg, K. et al., 2016: Social norms as solutions. Science, 354(6308) , 42–43, doi:10.1126/science.aaf8317.
O’Brien, K., E. Selboe, and B. Hayward, 2018: Exploring youth activism on climate change: dutiful, disruptive, and dangerous dissent. Ecol. Soc. , 23(3) , doi:10.5751/ES-10287-230342.
O’Connor, N., 2017: Three connections between rising economic inequality and the rise of populism. Irish Stud. Int. Aff. , 28, 29–43, doi:10.3318/isia.2017.28.5.
O’Neill, D.W. et al., 2018: A good life for all within planetary boundaries. Nat. Sustain. , 1(2) , 88–95, doi:10.1038/s41893-018-0021-4.
O’Neill, S.J. and N. Smith, 2014: Climate change and visual imagery. Wiley Interdiscip. Rev. Clim. Change, 5(1) , 73–87, doi:10.1002/wcc.249.
Ochsendorf, J. et al., 2011: Methods, impacts, and opportunities in the concrete building life cycle. Concrete Sustainability Hub, Massachusetts Institute of Technology, Cambridge, MA, USA, 119 pp. http://cshub.mit.edu/sites/default/files/documents/MIT Buildings LCA Report.pdf .
OECD, 2019a: Accelerating Climate Action: Refocusing Policies through a Well-being Lens. Organisation for Economic Co-operation and Development, Paris, France, 193 pp.
OECD, 2019b: Global Material Resources Outlook to 2060. Organisation for Economic Co-operation and Development, Paris, France, 212 pp.
OECD/FAO, 2018: OECD-FAO Agricultural Outlook 2018–2027. OECD Publishing, Paris, France and FAO, Rome, Italy, 108 pp.
Ohler, A.M., D.G. Loomis, and K. Ilves, 2020: A study of electricity savings from energy star appliances using household survey data. Energy Policy, 144 (September 2020), 111607, doi:10.1016/j.enpol.2020.111607.
Oishi, S., K. Kushlev, and U. Schimmack, 2018: Progressive taxation, income inequality, and happiness. Am. Psychol. , 73(2) , 157–168, doi:10.1037/amp0000166.
Okvat, H.A. and A.J. Zautra, 2011: Community Gardening: A Parsimonious Path to Individual, Community, and Environmental Resilience. Am. J. Community Psychol. , 47(3–4) , 374–387, doi:10.1007/s10464-010-9404-z.
Olatunji, O.O. et al., 2019: Competitive advantage of carbon efficient supply chain in manufacturing industry. J. Clean. Prod. , 238, 117937, doi:10.1016/j.jclepro.2019.117937.
Oliva, R. and R. Kallenberg, 2003: Managing the transition from products to services. Int. J. Serv. Ind. Manag. , 14(2) , 160–172, doi:10.1108/09564230310474138.
Onyige, C.D., 2017: Women, indigenous knowledge and climate change in Nigeria. Osun Sociol. Rev. , 4(1 & 2).
Oparaocha, S. and S. Dutta, 2011: Gender and energy for sustainable development. Curr. Opin. Environ. Sustain. , 3(4) , 265–271, doi:10.1016/j.cosust.2011.07.003.
Oreskes, N. and E.M. Conway, 2011: Merchants of Doubt: How a Handful of Scientists Obscured the Truth on Issues from Tobacco Smoke to Global Warming. 1st ed. Bloomsbury Press, New York, USA, London, UK, New Delhi, India and Sydney, Australia.
Orsini, F. and P. Marrone, 2019: Approaches for a low-carbon production of building materials: A review. J. Clean. Prod. , 241, doi:10.1016/j.jclepro.2019.118380.
Ortega-Ruiz, G., A. Mena-Nieto, and J.E. García-Ramos, 2020: Is India on the right pathway to reduce CO2 emissions? Decomposing an enlarged Kaya identity using the LMDI method for the period 1990–2016. Sci. Total Environ. , 737, 139638, doi:10.1016/j.scitotenv.2020.139638.
Ortiz, J., N. Casquero-Modrego, and J. Salom, 2019: Health and related economic effects of residential energy retrofitting in Spain. Energy Policy, 130, 375–388, doi:10.1016/j.enpol.2019.04.013.
Osuoka, A. and A. Haruna, 2019: Boiling Over: Global Warming, Hunger and Violence in the Lake Chad Basin. http://saction.org/books/boiling_over.pdf .
Oswald, Y., A. Owen, and J.K. Steinberger, 2020: Large inequality in international and intranational energy footprints between income groups and across consumption categories. Nat. Energy, 5(2020) , 231–239, doi:10.1038/s41560-020-0579-8.
Oswald, Y., J.K. Steinberger, D. Ivanova, and J. Millward-Hopkins, 2021: Global redistribution of income and household energy footprints: a computational thought experiment. Glob. Sustain. , 4, doi:10.1017/SUS.2021.1.
Otto, I.M., K.M. Kim, N. Dubrovsky, and W. Lucht, 2019: Shift the focus from the super-poor to the super-rich. Nat. Clim. Change, 9(2) , 82–84, doi:10.1038/s41558-019-0402-3.
Otto, I.M. et al., 2020: Social tipping dynamics for stabilizing Earth’s climate by 2050. Proc. Natl. Acad. Sci. , 117(5) , 2354–2365, doi:10.1073/pnas.1900577117.
Overland, I. and B.K. Sovacool, 2020: The misallocation of climate research funding. Energy Res. Soc. Sci. , 62, 101349, doi:10.1016/j.erss.2019.101349.
Owens, S., 2000: ‘Engaging the Public’: Information and Deliberation in Environmental Policy. Environ. Plan. A Econ. Sp. , 32(7) , 1141–1148, doi:10.1068/a3330.
Ozturk, I., 2010: A literature survey on energy-growth nexus. Energy Policy, 38(1) , 340–349, doi:10.1016/j.enpol.2009.09.024.
Pachauri, S., 2007: An energy analysis of household consumption: Changing patterns of direct and indirect use in India. 1st ed. Springer-Verlag Berlin.
Pachauri, S. and D. Spreng, 2002: Direct and indirect energy requirements of households in India. Energy Policy, 30(6) , 511–523, doi:10.1016/S0301-4215(01)00119-7.
Pacheco, E.B.A.V., L.M. Ronchetti, and E. Masanet, 2012: An overview of plastic recycling in Rio de Janeiro. Resour. Conserv. Recycl. , 60 (March) pp. 140–146, doi:10.1016/j.resconrec.2011.12.010.
Pagliano, L. and S. Erba, 2019: Energy sufficiency in (strongly intertwined) building and city design – Examples for temperate and Mediterranean climates. Proceedings of the 2019eceee Summer Study, European Council for an Energy Efficient Economy, Stockholm, Sweden, pp. 1505–1514.
Pahle, M. et al., 2018: Sequencing to ratchet up climate policy stringency. Nat. Clim. Change, 8(10) , 861–867, doi:10.1038/s41558-018-0287-6.
Pallak, M.S. and W. Cummings, 1976: Commitment and Voluntary Energy Conservation. Personal. Soc. Psychol. Bull. , 2(1) , 27–30, doi:10.1177/014616727600200105.
Pan, X. et al., 2019: Carbon Palma Ratio: A new indicator for measuring the distribution inequality of carbon emissions among individuals. J. Clean. Prod. , 241, 118418, doi:10.1016/j.jclepro.2019.118418.
Pant, K.P., S.K. Pattanayak, and M.B.M. Thakuri, 2014: Climate change, cookstoves and coughs and colds: Thinking global acting locally in rural Nepal. In: Environment and Development Economics: Essays in Honour of Sir Partha Dasgupta[Barrett, S., K.-G. Mäler, and E.S. Maskin, (eds.)], Oxford University Press, Oxford, pp. 145–168.
Parag, Y. and K.B. Janda, 2014: More than filler: Middle actors and socio-technical change in the energy system from the “middle-out.”Energy Res. Soc. Sci. , 3 (C), 102–112, doi:10.1016/j.erss.2014.07.011.
Parker, S. and M.I. Bhatti, 2020: Dynamics and drivers of per capita CO2 emissions in Asia. Energy Econ. , 89(2020) , 104798, doi:10.1016/j.eneco.2020.104798.
Pascale, A., S. Chakravarty, P. Lant, S. Smart, and C. Greig, 2020: The rise of (sub)nations? Sub-national human development, climate targets, and carbon dioxide emissions in 163 countries. Energy Res. Soc. Sci. , 68, 101546, doi:10.1016/j.erss.2020.101546.
Patel, J.A. et al., 2020: Poverty, inequality and COVID-19: the forgotten vulnerable. Public Health, 183, 110–111, doi:10.1016/j.puhe.2020.05.006.
Patra, S.K. and M. Muchie, 2017: Science, technology and innovation in BRICS countries: Introduction to the special issue. African J. Sci. Technol. Innov. Dev. , 9(5) , 499–501, doi:10.1080/20421338.2017.1380586.
Pattanayak, S.K. et al., 2019: Experimental evidence on promotion of electric and improved biomass cookstoves. Proc. Natl. Acad. Sci. , 116(27) , 13282–13287, doi:10.1073/pnas.1808827116.
Patterson, J.J. and D. Huitema, 2019: Institutional innovation in urban governance: The case of climate change adaptation. J. Environ. Plan. Manag. , 62(3) , 374–398, doi:10.1080/09640568.2018.1510767.
Patterson, J.J. et al., 2018: Political feasibility of 1.5°C societal transformations: the role of social justice. Curr. Opin. Environ. Sustain. , 31, 1–9, doi:10.1016/J.COSUST.2017.11.002.
Pauliuk, S., A. Arvesen, K. Stadler, and E.G. Hertwich, 2017: Industrial ecology in integrated assessment models. Nat. Clim. Change, 7, pp. 13–20, doi:10.1038/nclimate3148.
Pauliuk, S. et al., 2021: Global Scenarios of Resource and Emissions Savings from Systemic Material Efficiency in Buildings and Cars. Nat. Commun. , 12, doi:10.1038/s41467-021-25300-4.
Pearce, W., S. Niederer, S.M. Özkula, and N. Sánchez Querubín, 2019: The social media life of climate change: Platforms, publics, and future imaginaries. Wiley Interdiscip. Rev. Clim. Change, 10(2) , doi:10.1002/wcc.569.
Pearl-Martinez, R. and J.C. Stephens, 2017: Toward a gender diverse workforce in the renewable energy transition. Sustain. Sci. Pract. Policy, 12(1) , doi:10.1080/15487733.2016.11908149.
Pearse, R., 2017: Gender and climate change. Wiley Interdiscip. Rev. Clim. Change, 8(2) , e451, doi:10.1002/wcc.451.
Pearson-Stuttard, J. et al., 2017: Comparing effectiveness of mass media campaigns with price reductions targeting fruit and vegetable intake on US cardiovascular disease mortality and race disparities. Am. J. Clin. Nutr. , 106(1) , 199–206, doi:10.3945/ajcn.
Pearson, A.R. et al., 2017: Race, Class, Gender and Climate Change Communication. In: Oxford Research Encyclopedia of Climate Science, Oxford University Press, Oxford, UK.
Pecl, G.T. et al., 2017: Biodiversity redistribution under climate change: Impacts on ecosystems and human well-being. Science, 355(6332) , doi:10.1126/science.aai9214.
Pendrill, F. et al., 2019: Agricultural and forestry trade drives large share of tropical deforestation emissions. Glob. Environ. Change, 56 (March), 1–10, doi:10.1016/j.gloenvcha.2019.03.002.
Perch, L., 2011: Mitigation of what and by what? Adaptation by whom and for whom? Dilemmas in delivering for the poor and the vulnerable in international climate policy., IPC-IG, Brasilia Brazil, https://www.ipc-undp.org/pub/IPCWorkingPaper79.pdf .
Peres, R., E. Muller, and V. Mahajan, 2010: Innovation diffusion and new product growth models: A critical review and research directions. Int. J. Res. Mark. , 27(2) , 91–106, doi:10.1016/j.ijresmar.2009.12.012.
Perez, C. et al., 2015: How resilient are farming households and communities to a changing climate in Africa? A gender-based perspective. Glob. Environ. Change, 34, 95–107, doi:10.1016/j.gloenvcha.2015.06.003.
Perkins, P.E., 2019: Climate justice, commons, and degrowth. Ecol. Econ. , 160, 183–190, doi:10.1016/j.ecolecon.2019.02.005.
Perkins, R., 2003: Environmental leapfrogging in developing countries: A critical assessment and reconstruction. Nat. Resour. Forum, 27(3) , 177–188, doi:10.1111/1477-8947.00053.
Perlaviciute, G., G. Schuitema, P. Devine-Wright, and B. Ram, 2018: At the heart of a sustainable energy transition: The public acceptability of energy projects. IEEE Power Energy Mag. , 16(1) , 49–55, doi:10.1109/MPE.2017.2759918.
Permana, A.S., N.A. Aziz, and H.C. Siong, 2015: Is mom energy efficient? A study of gender, household energy consumption and family decision making in Indonesia. Energy Res. Soc. Sci. , 6, 78–86, doi:10.1016/j.erss.2014.12.007.
Peters, M. et al., 2012: Tropical Forage-based Systems to Mitigate Greenhouse Gas Emissions. In: Eco-Efficiency: From Vision to Reality[Hershey, C.H., (ed.)], International Center for Tropical Agriculture (CIAT), Cali, Colombia.
Petheram, L., N. Stacey, and A. Fleming, 2015: Future sea changes: Indigenous women’s preferences for adaptation to climate change on South Goulburn Island, Northern Territory (Australia). Clim. Dev. , 7(4) , 339–352, doi:10.1080/17565529.2014.951019.
Petrovic, N., J. Madrigano, and L. Zaval, 2014: Motivating mitigation: when health matters more than climate change. Clim. Change, 126, 245–254, doi:10.1007/s10584-014-1192-2.
Pettifor, H. and C. Wilson, 2020: Low carbon innovations for mobility, food, homes and energy: A synthesis of consumer attributes. Renew. Sustain. Energy Rev. , 130, doi:10.1016/j.rser.2020.109954.
Pettifor, H., C. Wilson, J. Axsen, W. Abrahamse, and J. Anable, 2017: Social influence in the global diffusion of alternative fuel vehicles – A meta-analysis. J. Transp. Geogr. , 62 (June), 247–261, doi:10.1016/j.jtrangeo.2017.06.009.
Phillips, C.A. et al., 2020: Compound climate risks in the COVID-19 pandemic. Nat. Clim. Change, 10(7) , 586–588, doi:10.1038/s41558-020-0804-2.
Phuong, L.T.H., G.R. Biesbroek, and A.E.J. Wals, 2017: The interplay between social learning and adaptive capacity in climate change adaptation: A systematic review. NJAS – Wageningen J. Life Sci. , 82, 1–9, doi:10.1016/j.njas.2017.05.001.
Pichler, P.P., I.S. Jaccard, U. Weisz, and H. Weisz, 2019: International comparison of health care carbon footprints. Environ. Res. Lett. , 14(6) , 064004, doi:10.1088/1748-9326/ab19e1.
Pigato, M.A. et al., 2020: Technology Transfer and Innovation for Low-Carbon Development . World Bank, Washington, DC, USA, 192 pp.
Piggot, G., 2018: The influence of social movements on policies that constrain fossil fuel supply. Clim. Policy, 18(7) , 942–954, doi:10.1080/14693062.2017.1394255.
Piggot, G., M. Boyland, A. Down, and A.R. Torre, 2019: Realizing a just and equitable transition away from fossil fuels. Stockholm Environment Institute, Stockholm, Sweden.
Pigou, A., 1920: The Economics of Welfare. Macmillan, London, UK.
Pizzigati, S., 2018: Can an Unequal Earth Beat Climate Change? Inequality.org, https://inequality.org/great-divide/can-an-unequal-earth-beat-climate-change/ (Accessed July 4, 2019).
Polonsky, M.J., A. Vocino, S.L. Grau, R. Garma, and A.S. Ferdous, 2012: The impact of general and carbon-related environmental knowledge on attitudes and behaviour of US consumers. J. Mark. Manag. , 28(3–4) , 238–263, doi:10.1080/0267257X.2012.659279.
Poore, J. and T. Nemecek, 2018: Reducing food’s environmental impacts through producers and consumers. Science, 360(6392) , 987–992, doi:10.1126/science.aaq0216.
Porio, E., 2011: Vulnerability, adaptation, and resilience to floods and climate change-related risks among marginal, riverine communities in Metro Manila. Asian J. Soc. Sci. , 39(4) , 425–445, doi:10.1163/156853111X597260.
Porter, G., 2016: Mobilities in rural Africa: New connections, new challenges. Ann. Am. Assoc. Geogr. , 106(2) , 434–441, doi:10.1080/00045608.2015.1100056.
Porter, L. et al., 2020: Climate Justice in a Climate Changed World. Plan. Theory, 21(2) , 293–321, doi:10.1080/14649357.2020.1748959.
Porter, M.E. and M.R. Kramer, 2006: Strategy & Society: The link between competitive advantage and corporate social responsibility. Harv. Bus. Rev. , 84(12) , 78–92.
Porter, M.E., S. Stern, and M. Green, 2017: Social Progress Index 2017. Social Progress Imperative, Washington, DC, USA, 95 pp.
Pottier, A., E. Combet, J. Cayla, S. De Lauretis, and F. Nadaud, 2021: Who emits CO2? Landscape of ecological inequalities in France from a critical perspective. FEEM Working Paper No. 14.2021, Fondazione Eni Enrico Mattei (FEEM), Milan, Italy.
Potting, J. et al., 2018: Circular Economy: What We Want To Know and Can Measure. PBL Netherlands Environmental Assessment Agency, The Hague, the Netherlands, 20 pp.
Pouri, M.J. and L.M. Hilty, 2018: Conceptualizing the Digital Sharing Economy in the Context of Sustainability. Sustainability, 10(12) , 4453, doi:10.3390/su10124453.
Powless, B., 2012: An Indigenous Movement to Confront Climate Change. Globalizations, 9(3) , 411–424, doi:10.1080/14747731.2012.680736.
Prata, J.C., A.L.P. Silva, T.R. Walker, A.C. Duarte, and T. Rocha-Santos, 2020: COVID-19 Pandemic Repercussions on the Use and Management of Plastics. Environ. Sci. Technol. , 54(13) , 7760–7765, doi:10.1021/acs.est.0c02178.
Prideaux, B., M. Thompson, and A. Pabel, 2020: Lessons from COVID-19 can prepare global tourism for the economic transformation needed to combat climate change. Tour. Geogr. , 22(3) , 667–678, doi:10.1080/14616688.2020.1762117.
Princen, T., 2003: Principles for Sustainability: From Cooperation and Efficiency to Sufficiency. Glob. Environ. Polit. , 3(1) , 33–50, doi:10.1162/152638003763336374.
Pucher, J. and R. Buehler, 2017: Cycling towards a more sustainable transport future. Transp. Rev. , 37(6) , 689–694, doi:10.1080/01441647.2017.1340234.
Puzzolo, E. et al., 2019: Supply Considerations for Scaling Up Clean Cooking Fuels for Household Energy in Low‐ and Middle‐Income Countries. GeoHealth, 3(12) , pp. 370–390, doi:10.1029/2019GH000208.
Quandt, A., 2019: Variability in perceptions of household livelihood resilience and drought at the intersection of gender and ethnicity. Clim. Change, 152, 1–15, doi:10.1007/s10584-018-2343-7.
Quayson, M., C. Bai, and V. Osei, 2020: Digital Inclusion for Resilient Post-COVID-19 Supply Chains: Smallholder Farmer Perspectives. IEEE Eng. Manag. Rev. , 48(3) , 104–110, doi:10.1109/EMR.2020.3006259.
Rabbitt, N. and B. Ghosh, 2016: Economic and environmental impacts of organised Car Sharing Services: A case study of Ireland. Res. Transp. Econ. , 57, 3–12, doi:10.1016/j.retrec.2016.10.001.
Rademaekers, K., K. Svatikova, J. Vermeulen, T. Smit, and L. Baroni, 2017: Environmental potential of the collaborative economy. European Commission, Directorate-General for Environment.
Rafaty, R., 2018: Perceptions of corruption, political distrust, and the weakening of climate policy. Glob. Environ. Polit. , 18(3) , 106–129, doi:10.1162/glep_a_00471.
Ramakrishnan, A. and F. Creutzig, 2021: Status consciousness in energy consumption: a systematic review. Environ. Res. Lett. , 16(5) , 053010, doi:10.1088/1748-9326/ABF003.
Rao, N.D. and P. Baer, 2012: “Decent Living” Emissions: A Conceptual Framework. Sustainability, 4(4) , 656–681, doi:10.3390/su4040656.
Rao, N.D. and S. Pachauri, 2017: Energy access and living standards: some observations on recent trends. Environ. Res. Lett. , 12(2) , 025011, doi:10.1088/1748-9326/aa5b0d.
Rao, N.D. and J. Min, 2018a: Less global inequality can improve climate outcomes. Wiley Interdiscip. Rev. Clim. Change, 9(2) , doi:10.1002/wcc.513.
Rao, N.D. and J. Min, 2018b: Decent Living Standards: Material Prerequisites for Human Wellbeing. Soc. Indic. Res. , 138(1) , 225–244, doi:10.1007/s11205-017-1650-0.
Rao, N.D. and J. Min, 2018c: Is less global inequality good for climate change?IIASA. https://pure.iiasa.ac.at/id/eprint/15078/1/RaoMin-GlobalInequalityandEmissionsWIRES2018-postacceptance.pdf .
Rao, N.D., K. Riahi, and A. Grubler, 2014: Climate impacts of poverty eradication. Nat. Clim. Change, 4(9) , 749–751, doi:10.1038/nclimate2340.
Rao, N., E. T. Lawson, W. N. Raditloaneng, D. Solomon, and M. N. Angula, 2019a: Gendered vulnerabilities to climate change: insights from the semi-arid regions of Africa and Asia. Clim. Dev. , 11(1) , 14–26, doi:10.1080/17565529.2017.1372266.
Rao, N.D., J. Min, and A. Mastrucci, 2019b: Energy requirements for decent living in India, Brazil and South Africa. Nat. Energy, 4(12) , 1025–1032, doi:10.1038/s41560-019-0497-9.
Räty, R. and A. Carlsson-Kanyama, 2009: Comparing energy use by gender, age and income in some European countries. FOI, Swedish Defence Research Agency, Stockholm, Sweden, 40 pp. pp. https://www.compromisorse.com/upload/estudios/000/101/foir2800.pdf (Accessed September 12, 2019).
Räty, R. and A. Carlsson-Kanyama, 2010: Energy consumption by gender in some European countries. Energy Policy, 38(1) , 646–649, doi.org/10.1016/j.enpol.2009.08.010.
Rausch, S., G.E. Metcalf, and J.M. Reilly, 2011: Distributional impacts of carbon pricing: A general equilibrium approach with micro-data for households. Energy Econ. , 33 (SUPPL. 1), doi:10.1016/j.eneco.2011.07.023.
Ravallion, M., M. Heil, and J. Jalan, 1997: A less poor world, but a hotter one? Carbon emissions, economic growth and income inequality. World Bank, Washington, DC, USA.
Raven, R. and G. Verbong, 2007: Multi-regime interactions in the Dutch energy sector: The case of combined heat and power technologies in the Netherlands 1970–2000. Technol. Anal. Strateg. Manag. , 19(4) , 491–507, doi:10.1080/09537320701403441.
Raven, R. et al., 2017: Unpacking sustainabilities in diverse transition contexts: solar photovoltaic and urban mobility experiments in India and Thailand. Sustain. Sci. , 12(4) , 579–596, doi:10.1007/s11625-017-0438-0.
Raven, R.P.J.M., E. Heiskanen, M. Hodson, and B. Brohmann, 2008: The Contribution of Local Experiments and Negotiation Processes to Field-Level Learning in Emerging (Niche) Technologies: Meta-Analysis of 27 New Energy Projects in Europe. Bull. Sci. Technol. Soc. , 28(6) , 464–477, doi:10.1177/0270467608317523.
Reckien, D. et al., 2017: Climate change, equity and the Sustainable Development Goals: an urban perspective. Environ. Urban. , 29(1) , 159–182, doi:10.1177/0956247816677778.
Reckwitz, A., 2002: Toward a Theory of Social Practices: A Development in Culturalist Theorizing. Eur. J. Soc. Theory, 5(2) , 243–263, doi:10.1177/13684310222225432.
Requena, F., 2016: Rural–Urban Living and Level of Economic Development as Factors in Subjective Well-Being. Soc. Indic. Res. , 128(2) , 693–708, doi:10.1007/s11205-015-1051-1.
Resurrección, B.P., 2013: Persistent women and environment linkages in climate change and sustainable development agendas. Womens. Stud. Int. Forum, 40, 33–43, doi:10.1016/j.wsif.2013.03.011.
Retamal, M., 2019: Collaborative consumption practices in Southeast Asian cities: Prospects for growth and sustainability. J. Clean. Prod. , 222, 143–152, doi.org/10.1016/j.jclepro.2019.02.267.
Reusser, D. et al., 2013: Relating climate compatible development and human livelihood. Energy Procedia, 40, 192–201.
Ricci, M., 2015: Bike sharing: A review of evidence on impacts and processes of implementation and operation. Res. Transp. Bus. Manag. , 15, 28–38, doi:10.1016/j.rtbm.2015.03.003.
Richards, M., 2003: Poverty reduction, equity and climate change: challenges for global governance. Overseas Development Institute, London, UK, https://cdn.odi.org/media/documents/2792.pdf (Accessed December 17, 2019).
Richards, T.J. and S.F. Hamilton, 2018: Food waste in the sharing economy. Food Policy, 75, 109–123, doi.org/10.1016/j.foodpol.2018.01.008.
Rietmann, N. and T. Lieven, 2019: How policy measures succeeded to promote electric mobility – Worldwide review and outlook. J. Clean. Prod. , 206, 66–75, doi:10.1016/j.jclepro.2018.09.121.
Ritchie, H., D.S. Reay, and P. Higgins, 2018: Potential of Meat Substitutes for Climate Change Mitigation and Improved Human Health in High-Income Markets. Front. Sustain. Food Syst. , 2, 16, doi:10.3389/fsufs.2018.00016.
Roberts, C. and F.W. Geels, 2019: Conditions for politically accelerated transitions: Historical institutionalism, the multi-level perspective, and two historical case studies in transport and agriculture. Technol. Forecast. Soc. Change, 140 (December 2018), 221–240, doi:10.1016/j.techfore.2018.11.019.
Roberts, C. et al., 2018: The politics of accelerating low-carbon transitions: Towards a new research agenda. Energy Res. Soc. Sci. , 44 (February), 304–311, doi:10.1016/j.erss.2018.06.001.
Roberts, J.C.D., 2017: Discursive destabilisation of socio-technical regimes: Negative storylines and the discursive vulnerability of historical American railroads. Energy Res. Soc. Sci. , 31 (May), 86–99, doi:10.1016/j.erss.2017.05.031.
Roesler, T. and M. Hassler, 2019: Creating niches – The role of policy for the implementation of bioenergy village cooperatives in Germany. Energy Policy, 124, 95–101, doi:10.1016/j.enpol.2018.07.012.
Rogelj, J., D. Shindell, K. Jiang, S. Fifita, P. Forster, V. Ginzburg, C. Handa, H. Kheshgi, S. Kobayashi, E. Kriegler, L. Mundaca, R. Séférian, and M.V. Vilariño, 2018: Mitigation pathways compatible with 1.5°C in the context of sustainable development. In: Global Warming of 1.5°C an IPCC special report on the impacts of global warming of 1.5°C above pre-industrial levels and related global greenhouse gas emission pathways, in the context of strengthening the global response to the threat of climate change, sustainable development, and efforts to eradicate poverty[Masson-Delmotte, V., P. Zhai, H.-O. Pörtner, D. Roberts, J. Skea, P.R. Shukla, A. Pirani, W. Moufouma-Okia, C. Péan, R. Pidcock, S. Connors, J.B.R. Matthews, Y. Chen, X. Zhou, M.I. Gomis, E. Lonnoy, T. Maycock, M. Tignor, and T. Waterfield (eds.)], Cambridge University Press, Cambridge, UK and New York, NY, USA, pp. 93–174.
Rogelj, J., P.M. Forster, E. Kriegler, C.J. Smith, and R. Séférian, 2019: Estimating and tracking the remaining carbon budget for stringent climate targets. Nature, 571(7765) , 335–342, doi:10.1038/s41586-019-1368-z.
Rogers, E.M., 2003: Diffusion of Innovations. Fifth edit. Free Press of Glencoe and Macmillan, New York, USA and London, UK, 576 pp.
Rogge, K.S. and K. Reichardt, 2013: Towards a more comprehensive policy mix conceptualization for environmental technological change: A literature synthesis. Working Papers “Sustainability and Innovation” S3/2013, Fraunhofer Institute for Systems and Innovation Research (ISI), Karlsruhe, Germany, 67 pp. https://www.econstor.eu/bitstream/10419/77924/1/749915005.pdf (Accessed December 17, 2019).
Rogge, K.S. and K. Reichardt, 2016: Policy mixes for sustainability transitions: An extended concept and framework for analysis. Res. Policy, 45(8) , 1620–1635, doi:10.1016/j.respol.2016.04.004.
Rogge, K.S. and P. Johnstone, 2017: Exploring the role of phase-out policies for low-carbon energy transitions: The case of the German Energiewende. Energy Res. Soc. Sci. , 33, 128–137, doi:10.1016/j.erss.2017.10.004.
Rojas-Rueda, D., A. de Nazelle, O. Teixidó, and M.J. Nieuwenhuijsen, 2012: Replacing car trips by increasing bike and public transport in the greater Barcelona metropolitan area: A health impact assessment study. Environ. Int. , 49, 100–109, doi:10.1016/j.envint.2012.08.009.
Rolffs, P., D. Ockwell, and R. Byrne, 2015: Beyond technology and finance: pay-as-you-go sustainable energy access and theories of social change. Environ. Plan. A, 47(12) , 2609–2627, doi:10.1177/0308518X15615368.
Røpke, I., 2009: Theories of practice – New inspiration for ecological economic studies on consumption. Ecol. Econ. , 68(10) , 2490–2497, doi:10.1016/j.ecolecon.2009.05.015.
Rosane, O., 2019: 7.6 Million Join Week of Global Climate Strikes. EcoWatch, https://www.ecowatch.com/global-climate-strikes-week-2640790405.html (Accessed December 1, 2020).
Rosenbloom, D., 2018: Framing low-carbon pathways: A discursive analysis of contending storylines surrounding the phase-out of coal-fired power in Ontario. Environ. Innov. Soc. Transitions, 27, 129–145, doi:10.1016/j.eist.2017.11.003.
Rosenbloom, D., B. Haley, and J. Meadowcroft, 2018a: Critical choices and the politics of decarbonization pathways: Exploring branching points surrounding low-carbon transitions in Canadian electricity systems. Energy Res. Soc. Sci. , 37, 22–36, doi:10.1016/j.erss.2017.09.022.
Rosenbloom, D., J. Meadowcroft, S. Sheppard, S. Burch, and S. Williams, 2018b: Transition Experiments: Opening Up Low-Carbon Transition Pathways for Canada through Innovation and Learning. Can. Public Policy, 44(4) , 1–6, doi:10.3138/cpp.2018-020.
Rosenbloom, D., J. Markard, F.W. Geels, and L. Fuenfschilling, 2020: Opinion: Why carbon pricing is not sufficient to mitigate climate change – and how “sustainability transition policy” can help. Proc. Natl. Acad. Sci. , 117(16) , 8664–8668, doi:10.1073/PNAS.2004093117.
Rosenow, J., T. Fawcett, N. Eyre, and V. Oikonomou, 2016: Energy efficiency and the policy mix. Build. Res. Inf. , 44(5–6) , 562–574, doi:10.1080/09613218.2016.1138803.
Rosenow, J., F. Kern, and K. Rogge, 2017: The need for comprehensive and well targeted instrument mixes to stimulate energy transitions: The case of energy efficiency policy. Energy Res. Soc. Sci. , 33, 95–104, doi:10.1016/j.erss.2017.09.013.
Rosenthal, J., A. Quinn, A.P. Grieshop, A. Pillarisetti, and R.I. Glass, 2018: Clean cooking and the SDGs: Integrated analytical approaches to guide energy interventions for health and environment goals. Energy Sustain. Dev. , 42, 152–159, doi:10.1016/j.esd.2017.11.003.
Rothstein, B., 2011: The Quality of Government: Corruption, Social Trust, and Inequality in International Perspective. University of Chicago Press, Chicago, IL, USA.
Rothstein, B. and J. Teorell, 2008: What Is Quality of Government? A Theory of Impartial Government Institutions. Governance, 21(2) , 165–190, doi:10.1111/j.1468-0491.2008.00391.x.
Rotmans, J., R. Kemp, and M. Van Asselt, 2001: More evolution than revolution: Transition management in public policy. Foresight , 3(1) , 15–31, doi:10.1108/14636680110803003.
Rouse, M. and G. Verhoef, 2016: Mobile banking in Africa: The current state of play. In: The Book of Payments: Historical and Contemporary Views on the Cashless Society[Batiz-Lazo, B. and L. Efthymiou, (eds.)], Palgrave Macmillan, London, UK, pp. 233–257.
Rowlands, L. and N. Gomez Peña, 2019: We will not be silenced: Climate activism from the frontlines to the UN. Civicus, https://www.civicus.org/documents/WeWillNotBeSilenced_eng_Nov19.pdf (Accessed October 2, 2021).
Roy, B. and A. Schaffartzik, 2020: Talk renewables, walk coal: The paradox of India’s energy transition. Ecol. Econ. , 180, 106871, doi:10.1016/j.ecolecon.2020.106871.
Roy, J. and S. Pal, 2009: Lifestyles and climate change: link awaiting activation. Curr. Opin. Environ. Sustain. , 1(2) , 192–200, doi:10.1016/j.cosust.2009.10.009.
Roy, J. et al., 2012: Lifestyles, Well-Being and Energy. In: Global Energy Assessment – Toward a Sustainable Future, Cambridge University Press, Cambridge, UK, New York, NY, USA and Laxenburg, Austria, pp. 1527–1548.
Roy, J., P. Tschakert, H. Waisman, S. Abdul Halim, P. Antwi-Agyei, P. Dasgupta, B. Hayward, M. Kanninen, D. Liverman, C. Okereke, P.F. Pinho, K. Riahi, and A.G. Suarez Rodriguez, 2018a: Sustainable Development, Poverty Eradication and Reducing Inequalities. In: Global Warming of 1.5°C. An IPCC Special Report on the impacts of global warming of 1.5°C above pre-industrial levels and related global greenhouse gas emission pathways, in the context of strengthening the global response to the threat of climate change, sustainable development, and efforts to eradicate poverty[Masson-Delmotte, V., P. Zhai, H.-O. Pörtner, D. Roberts, J. Skea, P.R. Shukla, A. Pirani, W. Moufouma-Okia, C. Péan, R. Pidcock, S. Connors, J.B.R. Matthews, Y. Chen, X. Zhou, M.I. Gomis, E. Lonnoy, T. Maycock, M. Tignor, and T. Waterfield (eds.)]. Cambridge University Press, Cambridge, UK and New York, NY, USA, pp. 445–538.
Roy, J. et al., 2018b: Where is the hope? Blending modern urban lifestyle with cultural practices in India. Curr. Opin. Environ. Sustain. , 31, 96–103, doi:10.1016/j.cosust.2018.01.010.
Roy, J. et al., 2018c: Governing National Actions for Global Climate Change Stabilization: Examples from India. In: Climate Change Governance and Adaptation[Barua, A., V. Narain, and S. Vij, (eds.)], CRC Press, pp. 137–159.
Roy, J., S. Some, N. Das, and M. Pathak, 2021: Demand side climate change mitigation actions and SDGs: literature review with systematic evidence search. Environ. Res. Lett. , 16(4) , 043003, doi:10.1088/1748-9326/ABD81A.
Roy, R., 2000: Sustainable product-service systems. Futures, 32(3–4) , 289–299, doi:10.1016/S0016-3287(99)00098-1.
Rubin, E.S., M.L. Azevedo, P. Jaramillo, and S. Yeh, 2016: A review of learning rates for electricity supply technologies. Energy Policy, 86, 198–218, doi:10.1016/j.enpol.2015.06.011.
Ruggiero, S., M. Martiskainen, and T. Onkila, 2018: Understanding the scaling-up of community energy niches through strategic niche management theory: Insights from Finland. J. Clean. Prod. , 170, 581–590, doi:10.1016/j.jclepro.2017.09.144.
Ruzek, W., 2015: The Informal Economy as a Catalyst for Sustainability. Sustainability, 7(1) , doi:10.3390/su7010023.
Ryan, R.M. and E.L. Deci, 2001: On happiness and human potentials: a review of research on hedonic and eudaimonic well-being. Annu. Rev. Psychol. , 52, 141–166, doi:10.1146/annurev.psych.52.1.141.
Rynikiewicz, C. and A. Chetaille, 2006: Poverty reduction, climate change mitigation and adaptation: The need for intermediate public policies harnessing technology appropriation. The future of science, technology and innovation : 40th anniversary conference, Science Policy Research Unit, Falmer, UK, https://pdfs.semanticscholar.org/c59f/90000428a5c81e12daf3b9a7a96983996813.pdf?_ga=2.171553252.57338894.1575697081-1617201598.1561360840 (Accessed November 30, 2019).
Saade, M.R.M., A. Yahia, and B. Amor, 2020: How has LCA been applied to 3D printing? A systematic literature review and recommendations for future studies. J. Clean. Prod. , 244, 118803, doi:10.1016/J.JCLEPRO.2019.118803.
Saavedra, Y.Y.M.B. et al., 2018: Theoretical contribution of industrial ecology to circular economy. J. Clean. Prod. , 170, 1514–1522, doi:10.1016/J.JCLEPRO.2017.09.260.
Sachs, J.D. and A.M. Warner, 1995: Natural Resource Abundance and Economic Growth. Working Paper 5398, National Bureau of Economic Research, Cambridge, MA, USA, 47 pp. https://www.nber.org/papers/w5398 (Accessed December 17, 2019).
Sadras, V.O., P. Grassini, and P. Steduto, 2011: Status of water use efficiency of main crops: SOLAW Background Thematic Report-TR07. UN Food and Agriculture Organization, Rome, Italy, 41 pp. http://www.fao.org/fileadmin/templates/solaw/files/thematic_reports/TR_07_web.pdf (Accessed December 20, 2019).
Sager, L., 2017: Income inequality and carbon consumption: evidence from environmental Engel curves, Centre for Climate Change Economics and Policy and Grantham Research Institute on Climate Change and the Environment, London, UK, 55 pp. http://www.lse.ac.uk/GranthamInstitute/publication/income-inequality-and-carbon-consumption-evidence-from-environmental-engel-curves/ (Accessed July 4, 2019).
Sahakian, M., 2018: Toward a more solidaristic sharing economy. In: Social Change and the Coming of Post-Consumer Society[Cohen, M.J., H.S. Brown, and P.J. Vergragt, (eds.)], Routledge, Abingdon, UK, pp. 43–60.
Sahakian, M., L. Godin, and I. Courtin, 2020: Promoting ‘pro’, ‘low’, and ‘no’ meat consumption in Switzerland: The role of emotions in practices. Appetite, 150, 104637, doi:10.1016/j.appet.2020.104637.
Salas, R.N. and A.K. Jha, 2019: Climate change threatens the achievement of effective universal healthcare. BMJ, 366, doi:10.1136/bmj.l5302.
Salehi, S., Z. Pazuki Nejad, H. Mahmoudi, and A. Knierim, 2015: Gender, responsible citizenship and global climate change. Womens. Stud. Int. Forum, 50, 30–36, doi:10.1016/j.wsif.2015.02.015.
Salick, J. and N. Ross, 2009: Traditional peoples and climate change. Glob. Environ. Change, 19(2) , 137–139, doi:10.1016/j.gloenvcha.2009.01.004.
Säll, S. and I.M. Gren, 2015: Effects of an environmental tax on meat and dairy consumption in Sweden. Food Policy, 55, 41–53, doi:10.1016/j.foodpol.2015.05.008.
Samadi, S. et al., 2017: Sufficiency in energy scenario studies: Taking the potential benefits of lifestyle changes into account. Technol. Forecast. Soc. Change, 124, 126–134, doi:10.1016/j.techfore.2016.09.013.
Sanderson, S.W. and K.L. Simons, 2014: Light emitting diodes and the lighting revolution: The Emergence of a solid-state lighting industry. Res. Policy, 43(10) , 1730–1746, doi:10.1016/j.respol.2014.07.011.
Sandin, S., L. Neij, and P. Mickwitz, 2019: Transition governance for energy efficiency –insights from a systematic review of Swedish policy evaluation practices. Energy. Sustain. Soc. , 9(1) , 17, doi:10.1186/s13705-019-0203-6.
Sanguinetti, A., E. Queen, C. Yee, and K. Akanesuvan, 2020: Average impact and important features of onboard eco-driving feedback: A meta-analysis. Transp. Res. Part F-Traffic Psychol. Behav. , 70, 1–14, doi:10.1016/j.trf.2020.02.010.
Sankhyayan, P. and S. Dasgupta, 2019: ‘Availability’ and/or ‘Affordability’:What matters in household energy access in India?Energy Policy, 131 (April), 131–143, doi:10.1016/j.enpol.2019.04.019.
Santarius, T., H.J. Walnum, and C. Aall, 2016: Rethinking climate and energy policies: New perspectives on the rebound phenomenon. Springer Cham.
Santillán Vera, M., A. de la Vega Navarro, and J. Islas Samperio, 2021: Climate change and income inequality: An I-O analysis of the structure and intensity of the GHG emissions in Mexican households. Energy Sustain. Dev. , 60, 15–25, doi:10.1016/J.ESD.2020.11.002.
Santos, G., 2018: Sustainability and Shared Mobility Models. Sustainability, 10(9), 3194, doi:10.3390/su10093194Satterthwaite, D. et al., 2018: Responding to climate change in cities and in their informal settlements and economies. 61 pp. IIED and IIED-América Latina, https://pubs.iied.org/sites/default/files/pdfs/migrate/G04328.pdf (Accessed November 30, 2019).
Saujot, M., T. Le Gallic, and H. Waisman, 2020: Lifestyle changes in mitigation pathways: policy and scientific insights. Environ. Res. Lett. , 16(1) , 015005, doi:10.1088/1748-9326/ABD0A9.
Saunders, H.D. et al., 2021: Energy Efficiency: What has it Delivered in the Last 40 years?Annu. Rev. Energy Environ. , 46, 135–165, doi:10.1146/ANNUREV-ENVIRON-012320-084937.
Schaefers, T., S.J. Lawson, and M. Kukar-Kinney, 2016: How the burdens of ownership promote consumer usage of access-based services. Mark. Lett. , 27(3) , 569–577, doi:10.1007/s11002-015-9366-x.
Schäfer, A.W. and S. Yeh, 2020: A holistic analysis of passenger travel energy and greenhouse gas intensities. Nat. Sustain. , 3(6) , doi:10.1038/s41893-020-0514-9.
Schanes, K., K. Dobernig, and B. Gözet, 2018: Food waste matters – A systematic review of household food waste practices and their policy implications. J. Clean. Prod. , 182, 978–991.
Scheffran, J., E. Marmer, and P. Sow, 2012: Migration as a contribution to resilience and innovation in climate adaptation: Social networks and co-development in Northwest Africa. Appl. Geogr. , 33(1) , 119–127, doi:10.1016/j.apgeog.2011.10.002.
Scherer, L. et al., 2018: Trade-offs between social and environmental Sustainable Development Goals. Environ. Sci. Policy, 90 (September), 65–72, doi:10.1016/j.envsci.2018.10.002.
Schlosberg, D. and L.B. Collins, 2014: From environmental to climate justice: climate change and the discourse of environmental justice. Wiley Interdiscip. Rev. Clim. Change, 5(3) , 359–374, doi:10.1002/wcc.275.
Schlosberg, D. and R. Coles, 2016: The new environmentalism of everyday life: Sustainability, material flows and movements. Contemp. Polit. Theory, 15(2) , 160–181, doi:10.1057/CPT.2015.34.
Schneider-Mayerson, M. et al., 2020: Environmental Literature as Persuasion: An Experimental Test of the Effects of Reading Climate Fiction. Environ. Commun. , doi:10.1080/17524032.2020.1814377.
Schneider, S.M., 2016: Income Inequality and Subjective Wellbeing: Trends, Challenges, and Research Directions. J. Happiness Stud. , 17(4) , 1719–1739, doi:10.1007/s10902-015-9655-3.
Schot, J. and F.W. Geels, 2008: Strategic niche management and sustainable innovation journeys: Theory, findings, research agenda, and policy. Technol. Anal. Strateg. Manag. , 20(5) , 537–554, doi:10.1080/09537320802292651.
Schot, J. and L. Kanger, 2018: Deep transitions: Emergence, acceleration, stabilization and directionality. Res. Policy, 47(6) , 1045–1059, doi:10.1016/j.respol.2018.03.009.
Schot, J. and W.E. Steinmueller, 2018: Three frames for innovation policy: R&D, systems of innovation and transformative change. Res. Policy, 47(9) , 1554–1567, doi:10.1016/j.respol.2018.08.011.
Schot, J., L. Kanger, and G. Verbong, 2016: The roles of users in shaping transitions to new energy systems. Nat. Energy, 1(5) , 1–7, doi:10.1038/NENERGY.2016.54.
Schröder, P. et al., 2019: Advancing sustainable consumption and production in cities – A transdisciplinary research and stakeholder engagement framework to address consumption-based emissions and impacts. J. Clean. Prod. , 213, 114–125, doi.org/10.1016/j.jclepro.2018.12.050.
Schroeder, P., 2013: Assessing effectiveness of governance approaches for sustainable consumption and production in China. J. Clean. Prod., 63, 64–73, doi:10.1016/j.jclepro.2013.05.039.
Schuelke-Leech, B.A., 2018: A model for understanding the orders of magnitude of disruptive technologies. Technol. Forecast. Soc. Change, 129, doi:10.1016/j.techfore.2017.09.033.
Schuldt, J.P. and A.R. Pearson, 2016: The role of race and ethnicity in climate change polarization: evidence from a U.S. national survey experiment. Clim. Change, 136(3–4) , 495–505, doi:10.1007/s10584-016-1631-3.
Schultz, P.W., J.M. Nolan, R.B. Cialdini, N.J. Goldstein, and V. Griskevicius, 2007: The Constructive, Destructive, and Reconstructive Power of Social Norms. Psychol. Sci. , 18(5) , 429–434, doi:10.1111/j.1467-9280.2007.01917.x.
Schumacher, E.F., 1974: Small is Beautiful: A Study of Economics as if People Mattered. Abacus, London, UK, 255 pp.
Schumacher, I., 2015: The endogenous formation of an environmental culture. Eur. Econ. Rev. , 76, 200–221, doi:10.1016/j.euroecorev.2015.03.002.
Schwartz, S.H., 1977: Normative influences on altruism. Adv. Exp. Soc. Psychol. , 10 (C), 221–279, doi:10.1016/S0065-2601 (08) 60358-5.
Scrivener, K.L. and E.M. Gartner, 2018: Eco-efficient cements: Potential economically viable solutions for a low-CO2 cement-based materials industry. Cem. Concr. Res. , 114, 2–26, doi:10.1016/J.CEMCONRES.2018.03.015.
Sebi, C., S. Nadel, B. Schlomann, and J. Steinbach, 2019: Policy strategies for achieving large long-term savings from retrofitting existing buildings. Energy Effic. , 12(1) , 89–105, doi:10.1007/s12053-018-9661-5.
Semieniuk, G., L. Taylor, A. Rezai, and D.K. Foley, 2021: Plausible energy demand patterns in a growing global economy with climate policy. Nat. Clim. Change 2021 114, 11(4) , 313–318, doi:10.1038/s41558-020-00975-7.
Sen, A., 1985: Well-being, agency and freedom: The Dewey Lectures 1984. J. Philos. , 82 (April), 169–221, doi:10.2307/2026184.
Sen, B., 2017: How States can boost renewables, with benefits for all. Institute for Policy Studies, Washington, DC, USA, https://ips-dc.org/report-how-states-can-boost-renewables-with-benefits-for-all/.
Serrano-Medrano, M. et al., 2018: Promoting LPG, clean woodburning cookstoves or both? Climate change mitigation implications of integrated household energy transition scenarios in rural Mexico. Environ. Res. Lett. , 13(11) , doi:10.1088/1748-9326/aad5b8.
Serrao-Neumann, S., F. Crick, B. Harman, G. Schuch, and D.L. Choy, 2015: Maximising synergies between disaster risk reduction and climate change adaptation: Potential enablers for improved planning outcomes. Environ. Sci. Policy, 50, 46–61, doi:10.1016/j.envsci.2015.01.017.
Serrenho, A.C., T. Sousa, B. Warr, R.U. Ayres, and T. Domingos, 2014: Decomposition of useful work intensity: The EU (European Union)-15 countries from 1960 to 2009. Energy, 76, 704–715, doi:10.1016/J.ENERGY.2014.08.068.
Seto, K.C., S. Dhakal, A. Bigio, H. Blanco, G.C. Delgado, D. Dewar, L. Huang, A. Inaba, A. Kansal, S. Lwasa, J.E. McMahon, D.B. Müller, J. Murakami, H. Nagendra, and A. Ramaswami, 2014: Human Settlements, Infrastructure, and Spatial Planning. In: Climate Change 2014: Mitigation of Climate Change. Contribution of Working Group III to the Fifth Assessment Report of the Intergovernmental Panel on Climate Change[Edenhofer, O., R. Pichs-Madruga, Y. Sokona, E. Farahani, S. Kadner, K. Seyboth, A. Adler, I. Baum, S. Brunner, P. Eickemeier, B. Kriemann, J. Savolainen, S. Schlömer, C. von Stechow, T. Zwickel and J.C. Minx, (eds.)], Cambridge University Press Cambridge, UK, and New York, NY, USA, pp. 67–76.
Seto, K.C. et al., 2016: Carbon Lock-In: Types, Causes, and Policy Implications. Annu. Rev. Environ. Resour. , 41(1) , 425–452, doi:10.1146/annurev-environ-110615-085934.
Sgouridis, S. et al., 2016: RE-mapping the UAE’s energy transition: An economy-wide assessment of renewable energy options and their policy implications. Renew. Sustain. Energy Rev. , 55, 1166–1180, doi:10.1016/j.rser.2015.05.039.
Shabanpour, R., N. Golshani, M. Tayarani, J. Auld, and A. (Kouros) Mohammadian, 2018: Analysis of telecommuting behavior and impacts on travel demand and the environment. Transp. Res. Part D Transp. Environ. , 62, 563–576, doi:10.1016/j.trd.2018.04.003.
Shaheen, S. and N. Chan, 2016: Mobility and the Sharing Economy: Potential to Facilitate the First- and Last-Mile Public Transit Connections. Built Environ. , 42(4) , 573–588, doi:10.2148/benv.42.4.573.
Shaheen, S. and A. Cohen, 2019: Shared ride services in North America: definitions, impacts, and the future of pooling. Transp. Rev. , 39(4) , 427–442, doi:10.1080/01441647.2018.1497728.
Shangguan, S. et al., 2019: A Meta-Analysis of Food Labeling Effects on Consumer Diet Behaviors and Industry Practices. Am. J. Prev. Med. , 56(2) , 300–314, doi:10.1016/j.amepre.2018.09.024.
Shanks, W. et al., 2019: How much cement can we do without? Lessons from cement material flows in the UK. Resour. Conserv. Recycl. , 141, 441–454, doi:10.1016/J.RESCONREC.2018.11.002.
Sharifi, A., 2020: Trade-offs and conflicts between urban climate change mitigation and adaptation measures: A literature review. J. Clean. Prod. , 276, 122813, doi:10.1016/j.jclepro.2020.122813.
Shaw, C., S. Hales, P. Howden-Chapman, and R. Edwards, 2014: Health co-benefits of climate change mitigation policies in the transport sector. Nat. Clim. Change, 4(6) , 427–433, doi:10.1038/nclimate2247.
Shehabi, A., S.J. Smith, E. Masanet, and J. Koomey, 2018: Data center growth in the United States: decoupling the demand for services from electricity use. Environ. Res. Lett. , 13(12) , 124030, doi:10.1088/1748-9326/aaec9c.
Sheikh, F.A., 2019: Undervaluation of informal sector innovations: Making a case for revisiting methodology. African J. Sci. Technol. Innov. Dev. , 11(4) , 505–512, doi:10.1080/20421338.2018.1532630.
Sheikh, F.A. and S. Bhaduri, 2020: Grassroots innovations in the informal economy: insights from value theory. Oxford Dev. Stud. , 48(1) , 85–99, doi:10.1080/13600818.2020.1717453.
Shelley, S., 2017: More and better jobs in a low carbon future: provocations and possibilities. 35th International Labour Process Conference , ‘Reconnecting work and political economy’, Sheffield, UK, 22 pp, https://uhra.herts.ac.uk/bitstream/handle/2299/19605/Accepted_Manuscript.pdf?sequence=2 (Accessed November 12, 2019).
Shi, X., 2019: Inequality of opportunity in energy consumption in China. Energy Policy, 124 (May 2018), 371–382, doi:10.1016/j.enpol.2018.09.029.
Shonkoff, S.B., R. Morello-Frosch, M. Pastor, and J. Sadd, 2011: The climate gap: Environmental health and equity implications of climate change and mitigation policies in California – a review of the literature. Clim. Change, 109(sup1) , 485–503, doi:10.1007/s10584-011-0310-7.
Shove, E., 2003: Comfort, Cleanliness and Convenience: The Social Organization of Normality. 1st ed. Berg Publishers/Bloomsbury, Oxford, UK, 240 pp.
Shove, E. and D. Southerton, 2000: Defrosting the freezer: From Novelty to convenience. A Narrative of Normalization. J. Mater. Cult. , 5(3) , 301–319, doi:10.1177/135918350000500303.
Shove, E. and G. Walker, 2014: What Is Energy For? Social Practice and Energy Demand. Theory, Cult. Soc. , 31(5) , 41–58, doi:10.1177/0263276414536746.
Shuai, C., X. Chen, Y. Wu, Y. Zhang, and Y. Tan, 2019: A three-step strategy for decoupling economic growth from carbon emission: Empirical evidences from 133 countries. Sci. Total Environ. , 646, 524–543, doi:10.1016/j.scitotenv.2018.07.045.
Simon, D.R., 2003: Meatonomics: how the rigged economics of meat and dairy make you consume too much – and how to eat better, live longer, and spend smarter. Conari Press, Newburyport, MA, USA, 289 pp.
Simon, F., 2020: Expert: ‘Lack of trust’ hampers energy efficiency services industry. Euractiv, June 16.
Simpson, N.P., 2019: Accommodating landscape-scale shocks: Lessons on transition from Cape Town and Puerto Rico. Geoforum, 102, 226–229, doi.org/10.1016/j.geoforum.2018.12.005.
Sims, R., R. Schaeffer, F. Creutzig, X. Cruz-Núñez, M. D’Agosto, D. Dimitriu, M. J. Figueroa Meza, L. Fulton, S. Kobayashi, O. Lah, A. McKinnon, P. Newman, M. Ouyang, J. J. Schauer, D. Sperling, and G. Tiwari, 2014: Transport. In: Climate Change 2014: Mitigation of Climate Change. Contribution of Working Group III to the Fifth Assessment Report of the Intergovernmental Panel on Climate Change[Edenhofer, O., R. Pichs-Madruga, Y. Sokona, E. Farahani, S. Kadner, K. Seyboth, A. Adler, I. Baum, S. Brunner, P. Eickemeier, B. Kriemann, J. Savolainen, S. Schlömer, C. von Stechow, T. Zwickel and J.C. Minx, (eds.)], Cambridge University Press, Cambridge, United Kingdom and New York, NY, USA, pp. 559–670.
Singh, C., J. Ford, D. Ley, A. Bazaz, and A. Revi, 2020: Assessing the feasibility of adaptation options: methodological advancements and directions for climate adaptation research and practice. Clim. Change 2020, 162(2) , 255–277, doi:10.1007/S10584-020-02762-X.
Singh, C., M. Madhavan, J. Arvind, and A. Bazaz, 2021: Climate change adaptation in Indian cities: A review of existing actions and spaces for triple wins. Urban Clim. , 36, 100783, doi:10.1016/J.UCLIM.2021.100783.
Singh, T., C. Siderius, and Y. Van der Velde, 2018: When do Indians feel hot? Internet searches indicate seasonality suppresses adaptation to heat. Environ. Res. Lett. , 13(5) , 054009, doi:10.1088/1748-9326/AABA82.
Sinha, A., 2016: Trilateral association between SO2/NO2 emission, inequality in energy intensity, and economic growth: A case of Indian cities. Atmos. Pollut. Res. , 7(4) , 647–658, doi:10.1016/j.apr.2016.02.010.
Sirgy, M.J., 2012: The psychology of quality of life: Hedonic well-being, life satisfaction, and eudaimonia. 2nd ed. Springer Netherlands, Dordrecht, the Netherlands, 622 pp.
Sisco, M.R., V. Bosetti, and E.U. Weber, 2017: When do extreme weather events generate attention to climate change?Clim. Change, 143(1–2) , 227–241, doi:10.1007/s10584-017-1984-2.
Skjelvik, J.M., A.M. Erlandsen, and O. Haavardsholm, 2017: Environmental impacts and potential of the sharing economy. Nordic Council of Ministers, Copenhagen, Denmark, 554 pp.
Slavin, R.E., J.S. Wodarski, and B.L. Blackburn, 1981: A group contingency for electricity conservation in master-metered apartments. J. Appl. Behav. Anal. , 14(3) , 357–363, doi:10.1901/jaba.1981.14–357.
Slocum, R., 2018: Climate Politics and Race in the Pacific Northwest. Soc. Sci. , 7(10) , 192, doi:10.3390/socsci7100192.
Smetschka, B. et al., 2019: Time Matters: The Carbon Footprint of Everyday Activities in Austria. Ecol. Econ. , 164, 106357, doi:10.1016/j.ecolecon.2019.106357.
Smil, V., 2017: Energy and civilization: a history. MIT Press, Cambridge, MA, USA, 552 pp.
Smit, B., O. Pilifosova, I. Burton, B. Challenger, S. Huq, R.J.T. Klein, and G. Yohe, 2001: Adaptation to Climate Change in the Context of Sustainable Development and Equity. In: Climate Change 2001: Impacts, Adaptation and Vulnerability. Contribution of Working Group II to the Third Assessment Report of the Intergovernmental Panel on Climate Change[McCarthy, J., Canziani, O., Leary, N., Dokken, D., and White, K. (eds.)]. Cambridge University Press, Cambridge, UK, pp. 879–912.
Smith, A. and R. Raven, 2012: What is protective space? Reconsidering niches in transitions to sustainability. Res. Policy, 41(6) , 1025–1036, doi:10.1016/j.respol.2011.12.012.
Smith, E.K. and A. Mayer, 2018: A social trap for the climate? Collective action, trust and climate change risk perception in 35 countries. Glob. Environ. Change, 49, 140–153, doi:10.1016/j.gloenvcha.2018.02.014.
Smith, J. et al., 2017: Gathering around stories: Interdisciplinary experiments in support of energy system transitions. Energy Res. Soc. Sci. , 31, 284–294, doi:10.1016/j.erss.2017.06.026.
Smith, K.R., G.U. Shuhua, H. Kun, and Q. Daxiong, 1993: One hundred million improved cookstoves in China: How was it done?World Dev. , 21(6) , 941–961, doi:10.1016/0305-750X(93)90053-C.
Smith, P. et al., 2013: How much land-based greenhouse gas mitigation can be achieved without compromising food security and environmental goals?Glob. Change Biol. , 19(8) , 2285–2302, doi:10.1111/gcb.12160.
Smith, P., M. Bustamante, H. Ahammad, H. Clark, H. Dong, E.A. Elsiddig, H. Haberl, R. Harper, J. House, M. Jafari, O. Masera, C. Mbow, N.H. Ravindranath, C.W. Rice, C. Robledo Abad, A. Romanovskaya, F. Sperling, and F. Tubiello, 2014: Agriculture, Forestry and Other Land Use (AFOLU). In: Climate Change 2014: Mitigation of Climate Change. Contribution of Working Group III to the Fifth Assessment Report of the Intergovernmental Panel on Climate Change[Edenhofer, O., R. Pichs-Madruga, Y. Sokona, E. Farahani, S. Kadner, K. Seyboth, A. Adler, I. Baum, S. Brunner, P. Eickemeier, B. Kriemann, J. Savolainen, S. Schlömer, C. von Stechow, T. Zwickel and J.C. Minx (eds.)], Cambridge University Press, Cambridge, UK and New York, NY, USA, pp. 881–922.
Smith, P. and N.C. Howe, 2015: Climate change as social drama: global warming in the public sphere. Cambridge University Press, Cambridge, UK, 242 pp.
Smith, P. et al., 2016: Biophysical and economic limits to negative CO2 emissions. Nat. Clim. Change, 6(1) , 42–50, doi:10.1038/nclimate2870.
Smith, P., J. Nkem, K. Calvin, D. Campbell, F. Cherubini, G. Grassi, V. Korotkov, A.L. Hoang, S. Lwasa, P. McElwee, E. Nkonya, N. Saigusa, J.-F. Soussana, and M.A. Taboada, 2019: Interlinkages between desertification, land degradation, food security and greenhouse gas fluxes: Synergies, trade-offs and integrated response options. In: Climate Change and Land: an IPCC special report on climate change, desertification, land degradation, sustainable land management, food security, and greenhouse gas fluxes in terrestrial ecosystems[Shukla, P.R., J. Skea, E. Calvo Buendia, V. Masson-Delmotte, H.-O. Portner, D.C. Roberts, P. Zhai, R. Slade, S. Connors, R. van Diemen, M. Ferrat, E. Haughey, S. Luz, S. Neogi, M. Pathak, J. Petzold, J. Portugal Pereira, P. Vyas, E. Huntley, K. Kissick, M. Belkacemi, and J. Malley, (eds.)], Cambridge University Press, Cambridge, UK and New York, NY, USA, pp. 551–672.
Smith, T. et al., 2015: The English Indices of Deprivation 2015. Department for Communities and Local Government, London, UK, 126 pp.
Smith, T.S.J., and L. Reid, 2018: Which ‘being’ in wellbeing? Ontology, wellness and the geographies of happiness. Prog. Hum. Geogr. , 42(6) , 807–829, doi:10.1177/0309132517717100.
Soete, L., 1985: International diffusion of technology, industrial development and technological leapfrogging. World Dev. , 13(3) , 409–422, doi.org/10.1016/0305-750X(85)90138-X.
Soliev, I. and I. Theesfeld, 2020: Benefit sharing for solving transboundary commons dilemma in central Asia. Int. J. Commons, 14(1) , 61–77, doi:10.5334/ijc.955.
Song, Y., J. Preston, and D. Ogilvie, 2017: New walking and cycling infrastructure and modal shift in the UK: A quasi-experimental panel study. Transp. Res. Part A Policy Pract. , 95 (January 2017), 320–333, doi.org/10.1016/j.tra.2016.11.017.
Sorrell, S., 2015: Reducing energy demand: A review of issues, challenges and approaches. Renew. Sustain. Energy Rev. , 47, 74–82, doi:10.1016/J.RSER.2015.03.002.
Sorrell, S., J. Dimitropoulos, and M. Sommerville, 2009: Empirical estimates of the direct rebound effect: A review. Energy Policy, 37(4) , 1356–1371, doi:10.1016/J.ENPOL.2008.11.026.
Sousa, T. et al., 2017: The Need for Robust, Consistent Methods in Societal Exergy Accounting. Ecol. Econ. , 141, 11–21, doi:10.1016/j.ecolecon.2017.05.020.
Sovacool, B.K. and I.M. Drupady, 2016: Energy access, poverty, and development: the governance of small-scale renewable energy in developing Asia. Routledge, Abingdon, UK, 328 pp.
Sovacool, B.K., A. Gilbert, and D. Nugent, 2014: An international comparative assessment of construction cost overruns for electricity infrastructure. Energy Res. Soc. Sci. , 3 (C), 152–160, doi:10.1016/j.erss.2014.07.016.
Sovacool, B.K. et al., 2015: Integrating social science in energy research. Energy Res. Soc. Sci. , 6, 95–99, doi:10.1016/j.erss.2014.12.005.
Sovacool, B.K., D. Furszyfer Del Rio, and S. Griffiths, 2020a: Contextualizing the Covid-19 pandemic for a carbon-constrained world: Insights for sustainability transitions, energy justice, and research methodology. Energy Res. Soc. Sci. , 68, 101701, doi:10.1016/j.erss.2020.101701.
Sovacool, B.K., M. Martiskainen, A. Hook, and L. Baker, 2020b: Beyond cost and carbon: The multidimensional co-benefits of low carbon transitions in Europe. Ecol. Econ. , 169, doi:10.1016/j.ecolecon.2019.106529.
Spangenberg, J., 2014: Institutional change for strong sustainable consumption: Sustainable consumption and the degrowth economy. Sustain. Sci. Pract. Policy, 10(1) , 62–77, doi:10.1080/15487733.2014.11908125.
Spangenberg, J.H. and S. Germany, 2016: Sufficiency, Degrowth and Sustainable Consumption. Sustainable Consumption and Social Justice in a Constrained World SCORAI Europe Workshop Proceedings, Budapest, Hungary, Sustainable Consumption Transitions Series, Issue 6, 25–33.
Spangenberg, J.H. and S. Lorek, 2019: Sufficiency and consumer behaviour: From theory to policy. Energy Policy, 129, 1070–1079, doi:10.1016/j.enpol.2019.03.013.
Spengler, L., 2016: Two types of ‘enough’: sufficiency as minimum and maximum. Env. Polit. , 25(5) , 921–940, doi:10.1080/09644016.2016.1164355.
Speranza, C.I., B. Kiteme, P. Ambenje, U. Wiesmann, and S. Makali, 2010: Indigenous knowledge related to climate variability and change: Insights from droughts in semi-arid areas of former Makueni District, Kenya. Clim. Change, 100(2) , 295–315, doi:10.1007/s10584-009-9713-0.
Springmann, M. et al., 2016: Global and regional health effects of future food production under climate change: A modelling study. Lancet , 387(10031) , 1937–1946, doi:10.1016/S0140-6736(15)01156-3.
Springmann, M. et al., 2018: Options for keeping the food system within environmental limits. Nature, 562(7728) , 519–525, doi:10.1038/s41586-018-0594-0.
Stahel, W., 2016: The circular economy. Nature, 531(7595) , 435–438, doi:10.1038/531435a.
Standal, K., M. Talevi, and H. Westskog, 2020: Engaging men and women in energy production in Norway and the United Kingdom: The significance of social practices and gender relations. Energy Res. Soc. Sci. , 60, 101338, doi:10.1016/J.ERSS.2019.101338.
Stankuniene, G., D. Streimikiene, and G.L. Kyriakopoulos, 2020: Systematic Literature Review on Behavioral Barriers of Climate Change Mitigation in Households. Sustainability, 12(18) , 7369, doi:10.3390/SU12187369.
Stark, C., 2020: Covid‐19 recovery and climate change. IPPR Progress. Rev. , 27(2) , 132–139, doi:10.1111/newe.12207.
Steckel, J.C., R.J. Brecha, M. Jakob, J. Stre, and G. Luderer, 2013: Development without energy ? Assessing future scenarios of energy consumption in developing countries. Ecol. Econ. , 90, 53–67, doi:10.1016/j.ecolecon.2013.02.006.
Steemers, K., 2003: Energy and the city: density, buildings and transport. Energy Build. , 35(1) , 3–14, doi.org/10.1016/S0378-7788(02)00075-0.
Steffen, B., D. Hischier, and T.S. Schmidt, 2018a: Historical and projected improvements in net energy performance of power generation technologies. Energy Environ. Sci. , 11(12) , 3524–3530, doi:10.1039/C8EE01231H.
Steffen, W. et al., 2018b: Trajectories of the Earth System in the Anthropocene. Proc. Natl. Acad. Sci. , 115(33) , 8252–8259, doi:10.1073/pnas.1810141115.
Steg, L., 2005: Car use: Lust and must. Instrumental, symbolic and affective motives for car use. Transp. Res. Part A Policy Pract. , 39(2–3 special issue) , 147–162, doi:10.1016/j.tra.2004.07.001.
Steg, L., 2008: Promoting household energy conservation. Energy Policy, 36(12) , 4449–4453, doi:10.1016/j.enpol.2008.09.027.
Steg, L., 2016: Values, Norms, and Intrinsic Motivation to Act Proenvironmentally. Annu. Rev. Environ. Resour. , 41(1) , 277–292, doi:10.1146/annurev-environ-110615-085947.
Stein, R. (ed.), 2004: New Perspectives on Environmental Justice: Gender, Sexuality, and Activism. Rutgers University Press, New Brunswick, NJ, USA.
Steinberger, J.K. et al., 2012: Pathways of human development and carbon emissions embodied in trade. Nat. Clim. Change, 2(2) , 81–85, doi:10.1038/nclimate1371.
Steinberger, J.K., W.F. Lamb, and M. Sakai, 2020: Your money or your life? The carbon-development paradox. Environ. Res. Lett. , 15(4) , 044016, doi:10.1088/1748-9326/AB7461.
Steinberger, J.K., and J.T. Roberts, 2010: From constraint to sufficiency: The decoupling of energy and carbon from human needs, 1975–2005. Ecol. Econ. , 70(2) , 425–433, doi:10.1016/j.ecolecon.2010.09.014.
Stephenson, J. et al., 2015: The energy cultures framework: Exploring the role of norms, practices and material culture in shaping energy behaviour in New Zealand. Energy Res. Soc. Sci. , 7, 117–123, doi:10.1016/j.erss.2015.03.005.
Sterman, J.D. and L.B. Sweeney, 2002: Cloudy skies: assessing public understanding of global warming. Syst. Dyn. Rev. , 18(2) , 207–240, doi:10.1002/sdr.242.
Stern, P.C., 2000: New Environmental Theories: Toward a Coherent Theory of Environmentally Significant Behavior. J. Soc. Issues, 56(3) , 407–424, doi:10.1111/0022-4537.00175.
Stern, P.C. et al., 1985: The effectiveness of incentives for residential energy conservation. Evol. Rev. , 10(2) , 147–176.
Stiles, J., 2020: Strategic niche management in transition pathways: Telework advocacy as groundwork for an incremental transformation. Environ. Innov. Soc. Transitions, 34, 139–150, doi:10.1016/J.EIST.2019.12.001.
Stojanovski, O., G.W. Leslie, F.A. Wolak, J.E.H. Wong, and M.C. Thurber, 2020: Increasing the energy cognizance of electricity consumers in Mexico: Results from a field experiment. J. Environ. Econ. Manage. , 102 (July 2020), 102323, doi:10.1016/j.jeem.2020.102323.
Stokes, L.C., and C. Warshaw, 2017: Renewable energy policy design and framing influence public support in the United States. Nat. Energy, 2(8) , 17107, doi:10.1038/nenergy.2017.107.
Stolaroff, J.K. et al., 2018: Energy use and life cycle greenhouse gas emissions of drones for commercial package delivery. Nat. Commun. , 9(1) , 409, doi:10.1038/s41467-017-02411-5.
Stoll, C., L. Klaaßen, and U. Gallersdörfer, 2019: The Carbon Footprint of Bitcoin. Joule, 3(7) , doi:10.1016/j.joule.2019.05.012.
Strand, J., 2020: Supporting Carbon Tax Implementation in Developing Countries through Results-Based Payments for Emissions Reductions. Policy Research Working Paper No. 9443. World Bank, Washington, DC, USA.
Stratford, B., 2020: The Threat of Rent Extraction in a Resource-constrained Future. Ecol. Econ. , 169, 106524, doi:10.1016/j.ecolecon.2019.106524.
Strauch, Y., 2020: Beyond the low-carbon niche: Global tipping points in the rise of wind, solar, and electric vehicles to regime scale systems. Energy Res. Soc. Sci. , 62, doi:10.1016/j.erss.2019.101364.
Streeby, S., 2018: Imagining the Future of Climate Change World-Making through Science Fiction and Activism. University of California Press, Berkeley, CA, USA.
Strubell, E., A. Ganesh, and A. McCallum, 2020: Energy and policy considerations for deep learning in NLP. In: Proceedings of the 57th Annual Meeting of the Association for Computational Linguistics, Florence, Italy, 3645–3650.
Stuart, D., R. Gunderson, and B. Petersen, 2017: Climate Change and the Polanyian Counter-movement: Carbon Markets or Degrowth?New Polit. Econ. , 24(1) , 89–102, doi:10.1080/13563467.2017.1417364.
Stubbs, W. and C. Cocklin, 2008: An ecological modernist interpretation of sustainability: The Case of Interface Inc. Bus. Strateg. Environ. , 17(8) , 512–523, doi:10.1002/bse.544.
Stuber, J., S. Galea, and B.G. Link, 2008: Smoking and the emergence of a stigmatized social status. Soc. Sci. Med. , 67(3) , 420–430, doi:10.1016/j.socscimed.2008.03.010.
Suatmadi, A.Y., F. Creutzig, and I.M. Otto, 2019: On-demand motorcycle taxis improve mobility, not sustainability. Case Stud. Transp. Policy, 7(2) , 218–229, doi:10.1016/J.CSTP.2019.04.005.
Sudbury, A.W. and E.B. Hutchinson, 2016: A Cost Analysis Of Amazon Prime Air (Drone Delivery). J. Econ. Educ. , 16(1) , 1–12.
Sulemana, I., L. McCann, and H.S. James, 2016: Perceived environmental quality and subjective well-being: are African countries different from developed countries?Int. J. Happiness Dev. , 3(1) , 64, doi:10.1504/ijhd.2016.076209.
Sultana, F., 2021: Climate change, COVID-19, and the co-production of injustices: a feminist reading of overlapping crises. Soc. Cult. Geogr. , 22(4) , 447–460, doi:10.1080/14649365.2021.1910994.
Sumner, A., C. Hoy, and E. Ortiz-Juarez, 2020: Estimates of the impact of COVID-19 on global poverty. WIDER Working Paper 2020/43. United Nations University World Institute for Development Economics Research (UNU-WIDER), Helsinki, Finland.
Sunderland, L. A. Jahn, M. Hogan, J. Rosenow, and R. Cowart, 2020: Equity in the energy transition Who pays and who benefits?Regulatory Assistance Project, Brussels, Belgium.
Sunguya, B.F. et al., 2014: Strong nutrition governance is a key to addressing nutrition transition in low and middle-income countries: Review of countries’ nutrition policies. Nutr. J. , 13(1) , doi:10.1186/1475-2891-13-65.
Sunstein, C.R., 2019: Conformity: The Power of Social Influences. New York University Press, New York, NY, USA, 192 pp.
Sunstein, C.R. and L.A. Reisch, 2014: Automatically Green: Behavioral Economics and Environmental Protection. Harvard Environ. Law Rev. , 38(1) , 127–158, doi:10.2139/ssrn.2245657.
Sunstein, C.R., L.A. Reisch, and M. Kaiser, 2019: Trusting nudges? Lessons from an international survey. J. Eur. Public Policy, 26(10) , 1417–1443, doi:10.1080/13501763.2018.1531912.
Sweerts, B., R.J. Detz, and B. van der Zwaan, 2020: Evaluating the Role of Unit Size in Learning-by-Doing of Energy Technologies. Joule, 4(5) , 967–970, doi.org/10.1016/j.joule.2020.03.010.
Swim, J.K., N. Geiger, and M.L. Lengieza, 2019: Climate Change Marches as Motivators for Bystander Collective Action. Front. Commun. , 4, 4, doi:10.3389/FCOMM.2019.00004.
Swyngedouw, E., 2011: Climate Change as Post-Political and Post-Democratic Populism. In: Politik im Klimawandel, Nomos, Baden-Baden, Germany, pp. 65–81.
Szałek, B.Z., 2013: Some Praxiological Reflections on the So-called ‘Overton Window of Political Possibilities’, ‘Framing’ and Related Problems. Real. Polit. Estim. – Comments – Forecast. , (04) , 237–257.
Tanikawa, H. et al., 2021: A framework of indicators for associating material stocks and flows to service provisioning: Application for Japan 1990–2015. J. Clean. Prod. , 285, 125450, doi:10.1016/J.JCLEPRO.2020.125450.
Tanner, T., T. Mitchell, E. Polack, and B. Guenther, 2009: Urban Governance for Adaptation: Assessing Climate Change Resilience in Ten Asian Cities. IDS Work. Pap. , 2009(315) , 1–47, doi:10.1111/j.2040-0209.2009.00315_1.x.
Taufik, D., M.C.D. Verain, E.P. Bouwman, and M.J. Reinders, 2019: Determinants of real-life behavioural interventions to stimulate more plant-based and less animal-based diets: A systematic review. Trends Food Sci. Technol. , 93, 281–303, doi:10.1016/j.tifs.2019.09.019.
Tauhid, F.A. and H. Zawani, 2018: Mitigating climate change related floods in urban poor areas: Green infrastructure approach. J. Reg. City Plan. , 29(2) , 98–112, doi:10.5614/jrcp.2018.29.2.2.
Taylor, A. and C. Peter, 2014: Strengthening Climate Resilience in African Cities A Framework for Working with Informality. Climate and Development Knowledge Network (CDKN), 20 pp. https://cdkn.org/wp-content/uploads/2014/05/CDKN_ACC_WP_final_web-res.pdf (Accessed October 11, 2021).
Taylor, A.L., S. Dessai, and W. Bruine de Bruin, 2014: Public perception of climate risk and adaptation in the UK: A review of the literature. Clim. Risk Manag. , 4, 1–16, doi:10.1016/j.crm.2014.09.001.
Teame, G.T. and A.T. Habte, 2020: Economic Growth and Carbon Dioxide Emissions in East African Countries: A Pooled Mean Group Approach. Int. J. Bus. Econ. Res. , 9(4) , 160–169, doi:10.11648/j.ijber.20200904.11.
Teece, D.J., 2018: Tesla and the Reshaping of the Auto Industry. Manag. Organ. Rev. , 14(3) , 501–512, doi:10.1017/mor.2018.33.
Temper, L. et al., 2020: Movements shaping climate futures: A systematic mapping of protests against fossil fuel and low-carbon energy projects. Environ. Res. Lett , 15, 123004.
Temple, J., 2020: Why we need broader coalitions to combat environmental racism and climate change MIT Technol. Rev. https://www.technologyreview.com/2020/06/11/1003162/a-green-new-deal-architect-explains-how-the-protests-and-climate-crisis-are-connected/ (Accessed June 19, 2020).
Terry, G., 2009: No climate justice without gender justice: an overview of the issues. Gend. Dev. , 17(1) , 5–18, doi:10.1080/13552070802696839.
Terzi, A., 2020: Crafting an effective narrative on the green transition. Energy Policy, 147, doi:10.1016/j.enpol.2020.111883.
Tesfamichael, M., Y. Mulugetta, A.D. Beyene, and S. Sebsibie, 2021: Counting the cost: Coping with tariff increases amidst power supply shortfalls in urban households in Ethiopia. Energy Res. Soc. Sci. , 71, 101860, doi:10.1016/j.erss.2020.101860.
Teske, S. et al., 2015: Energy [R]evolution: A sustainable world energy outlook 2015. Greenpeace International, Hamburg, Germany, https://elib.dlr.de/98314/.
Thacker, S. et al., 2019: Infrastructure for sustainable development. Nat. Sustain. , 2(4) , 324–331, doi:10.1038/s41893-019-0256-8.
Thaler, R. and C. Sunstein, 2009: Nudge: Improving decisions about health, wealth, and happiness. Penguin Books Ltd, New York, NY, USA.
Thaler, R.H., 2015: Misbehaving: the making of behavioral economics. W.W. Norton & Co., New York, NY, USA, 415 pp.
Theotokis, A. and E. Manganari, 2015: The Impact of Choice Architecture on Sustainable Consumer Behavior: The Role of Guilt. J. Bus. Ethics, 131(2) , 423–437, doi:10.1007/s10551-014-2287-4.
Thomas, D.S.G. and C. Twyman, 2005: Equity and justice in climate change adaptation amongst natural-resource-dependent societies. Glob. Environ. Change, 15(2) , 115–124, doi:10.1016/j.gloenvcha.2004.10.001.
Thoyre, A., 2020: Home climate change mitigation practices as gendered labor. Womens. Stud. Int. Forum, 78, 102314, doi:10.1016/j.wsif.2019.102314.
Thyberg, K.L. and D.J. Tonjes, 2016: Drivers of food waste and their implications for sustainable policy development. Resour. Conserv. Recycl. , 106, 110–123, doi:10.1016/j.resconrec.2015.11.016.
Tiba, S. and A. Omri, 2017: Literature survey on the relationships between energy, environment and economic growth. Renew. Sustain. Energy Rev. , 69 (August 2015), 1129–1146, doi:10.1016/j.rser.2016.09.113.
Tiefenbeck, V., T. Staake, K. Roth, and O. Sachs, 2013: For better or for worse? Empirical evidence of moral licensing in a behavioral energy conservation campaign. Energy Policy, 57, 160–171, doi:10.1016/j.enpol.2013.01.021.
Timko, M.T., 2019: A World Without Waste. IEEE Eng. Manag. Rev. , 47(1) , 106–109, doi:10.1109/EMR.2019.2900636.
Toroitich, I.K. and G. Kerber, 2014: Diakonia, Sustainability, and Climate Change. Ecum. Rev. , 66(3) , 288–301, doi:10.1111/erev.12106.
Torres-Carrillo, S., H.R. Siller, C. Vila, C. López, and C.A. Rodríguez, 2020: Environmental analysis of selective laser melting in the manufacturing of aeronautical turbine blades. J. Clean. Prod. , 246, 119068, doi:10.1016/J.JCLEPRO.2019.119068.
Toth, G. and C. Szigeti, 2016: The historical ecological footprint: From over-population to over-consumption. Ecol. Indic. , 60, 283–291, doi:10.1016/j.ecolind.2015.06.040.
Townsend, P., 1979: Poverty in the United Kingdom: A Survey of Household Resources and Standards of Living. Penguin Books Ltd, Middlesex, England; New York, New York; Ringwood, Victoria, Australia; Markham, Ontario, Canada; Auckland, New Zealand, 1216 pp.
Trancik, J.E., 2014: Renewable energy: Back the renewables boom. Nature, 507(7492) , 300–302, doi:10.1038/507300a.
Trencher, G. et al., 2016: Innovative policy practices to advance building energy efficiency and retrofitting: Approaches, impacts and challenges in ten C40 cities. Environ. Sci. Policy, 66, 353–365, doi:10.1016/j.envsci.2016.06.021.
Truelove, H.B., A.R. Carrico, E.U. Weber, K.T. Raimi, and M.P. Vandenbergh, 2014: Positive and negative spillover of pro-environmental behavior: An integrative review and theoretical framework. Glob. Environ. Change, 29, 127–138, doi:10.1016/j.gloenvcha.2014.09.004.
Tschakert, P. et al., 2017: Climate change and loss, as if people mattered: values, places, and experiences. Wiley Interdiscip. Rev. Clim. Change, 8(5) , e476, doi:10.1002/wcc.476.
Turnheim, B. and F.W. Geels, 2012: Regime destabilisation as the flipside of energy transitions: Lessons from the history of the British coal industry (1913–1997). Energy Policy, 50, 35–49, doi:10.1016/j.enpol.2012.04.060.
Turnheim, B. and F.W. Geels, 2019: Incumbent actors, guided search paths, and landmark projects in infra-system transitions: Re-thinking Strategic Niche Management with a case study of French tramway diffusion (1971–2016). Res. Policy, 48(6) , 1412–1428, doi:10.1016/j.respol.2019.02.002.
Turnheim, B., P. Kivimaa, and F. Berkhout, eds., 2018: Innovating Climate Governance: Moving Beyond Experiments. Cambridge University Press, Cambridge, UK, 250 pp.
Tussyadiah, I.P. and J. Pesonen, 2016: Impacts of Peer-to-Peer Accommodation Use on Travel Patterns. J. Travel Res. , 55(8) , 1022–1040, doi:10.1177/0047287515608505.
Tvinnereim, E. and M. Mehling, 2018: Carbon pricing and deep decarbonisation. Energy Policy, 121, 185–189, doi:10.1016/j.enpol.2018.06.020.
Tvinnereim, E., K. Fløttum, Ø. Gjerstad, M.P. Johannesson, and Å.D. Nordø, 2017: Citizens’ preferences for tackling climate change. Quantitative and qualitative analyses of their freely formulated solutions. Glob. Environ. Change, 46, 34–41, doi:10.1016/j.gloenvcha.2017.06.005.
TWI2050, 2018: Transformations to Achieve the Sustainable Development Goals – Report prepared by The World in 2050 Initiative. International Institute for Applied Systems Analysis (IIASA), Laxenburg, Austria, 154 pp.
TWI2050, 2019: The Digital Revolution and Sustainable Development: Opportunities and Challenges. International Institute for Applied Systems Analysis (IIASA), Laxenburg, Austria, 100 pp.
Ulph, A., and D. Ulph, 2021: Environmental policy when consumers value conformity. J. Environ. Econ. Manage. , 109 (September 2021), 102172, doi:10.1016/j.jeem.2018.09.001.
UN-Habitat, 2013: Planning and design for sustainable urban mobility: Global report on human settlements 2013. United Nations Human Settlements Programme, Nairobi, Kenya, 348 pp.
UN, 2015: Transforming Our World: The 2030 Agenda for Sustainable Development . 41 pp. https://sustainabledevelopment.un.org/post2015/transformingourworld (Accessed October 11, 2021).
UN, 2020: Shared Responsibility, Global Solidarity: Responding to the socio-economic impacts of COVID-19., New York, https://www.imf.org/en/News/Articles/2020/03/27/sp032720-opening-remarks-at-press-briefing-following-imfc-conference-call (Accessed December 7, 2020).
UNDESA, 2020: World Social Report 2020. Department of Economic and Social Affairs, 216 pp.
UNEP, 2010: ABC of SCP: Clarifying Concepts on Sustainable Consumption and Production. United Nations Environment Programme, Nairobi, Kenya.
UNEP, 2013: Women and natural resources: unlocking the peacebuilding potential. United Nations Environment Programme, Nairobi, Kenya. 1–70 pp.
UNESC, 2017: Report of the UN Inter-agency and Expert Group on Sustainable Development Goal Indicators. 49 pp. https://digitallibrary.un.org/record/821651?ln=en.
UNFCCC, 2016 : Decision 1/CP.21: Adoption of the Paris Agreement. In: Report of the Conference of the Parties on its twenty-first session, held in Paris from 30 November to 13 December 2015. Addendum: Part two: Action taken by the Conference of the Parties at its twenty-first session. FCCC/CP/2015/10/ Add.1, United Nations Framework Convention on Climate Change (UNFCCC), pp. 1–36.
UNFCCC, 2016 : Decision 21/CP.22: Gender and climate change. In: Report of the Conference of the Parties on its twenty-second session, held in Marrakech from 7 to 18 November 2016. FCCC/CP/2016/10/Add.2, United Nations Framework Convention on Climate Change, Marrakech, pp. 17–20, https://unfccc.int/resource/docs/2016/cop22/eng/10a02.pdf (Accessed December 4, 2020).
Unruh, G.C., 2000: Understanding carbon lock-in. Energy Policy, 28(12) , 817–830, doi:10.1016/S0301-4215(00)00070-7.
Ürge-Vorsatz, D., S.T. Herrero, N.K. Dubash, and F. Lecocq, 2014: Measuring the co-benefits of climate change mitigation. Annu. Rev. Environ. Resour. , 39, 549–582, doi:10.1146/annurev-environ-031312-125456.
Uyttebrouck, C., E. van Bueren, and J. Teller, 2020: Shared housing for students and young professionals: evolution of a market in need of regulation. J. Hous. Built Environ. , (0123456789), doi:10.1007/s10901-020-09778-w.
Uzar, U. and K. Eyuboglu, 2019: The nexus between income inequality and CO2 emissions in Turkey. J. Clean. Prod. , 227, 149–157, doi:10.1016/j.jclepro.2019.04.169.
Vadén, T. et al., 2020: Decoupling for ecological sustainability: A categorisation and review of research literature. Environ. Sci. Policy, 112 (July 2), 236, doi:10.1016/J.ENVSCI.2020.06.016.
van de Ven, D.J., M. González-Eguino, and I. Arto, 2018: The potential of behavioural change for climate change mitigation: a case study for the European Union. Mitig. Adapt. Strateg. Glob. Change, 23(6) , 835–886, doi:10.1007/s11027-017-9763-y.
Van den Berg, N.J. et al., 2019: Improved modelling of lifestyle changes in Integrated Assessment Models: Cross-disciplinary insights from methodologies and theories. Energy Strateg. Rev. , 26, 100420, doi:10.1016/j.esr.2019.100420.
Van den Bulte, C., and S. Stremersch, 2004: Social Contagion and Income Heterogeneity in New Product Diffusion: A Meta-Analytic Test. Mark. Sci. , 23(4) , 530–544, doi:10.1287/mksc.1040.0054.
van der Linden, S. and M.H. Goldberg, 2020: Alternative meta-analysis of behavioral interventions to promote action on climate change yields different conclusions. Nat. Commun. , 11(1) , 3915, doi:10.1038/s41467-020-17613-7.
van Houwelingen, J.H. and W.F. van Raaij, 1989: The Effect of Goal-Setting and Daily Electronic Feedback on In-Home Energy Use. J. Consum. Res. , 16(1) , 98, doi:10.1086/209197.
van Mierlo, B. and P.J. Beers, 2020: Understanding and governing learning in sustainability transitions: A review. Environ. Innov. Soc. Transitions, 34 (September 2017), 255–269, doi.org/10.1016/j.eist.2018.08.002.
van Sluisveld, M.A.E., S.H. Martínez, V. Daioglou, and D.P. van Vuuren, 2016: Exploring the implications of lifestyle change in 2°C mitigation scenarios using the IMAGE integrated assessment model. Technol. Forecast. Soc. Change, 102, 309–319, doi:10.1016/j.techfore.2015.08.013.
van Sluisveld, M.A.E. et al., 2018: Aligning integrated assessment modelling with socio-technical transition insights: An application to low-carbon energy scenario analysis in Europe. Technol. Forecast. Soc. Change, 151(Feb), 119177, doi:10.1016/j.techfore.2017.10.024.
Van Vossole, J., 2012: Global Climate Governance: A Legitimation Crisis: Capitalism, Power, and Alienation from Marxist and Polanyian Perspectives. Rev. (Fernand Braudel Center) , 35(1) , 1–27.
Van Vuuren, D.P. et al., 2018: Alternative pathways to the 1.5°C target reduce the need for negative emission technologies. Nat. Clim. Change, 8(5) , 391–397, doi:10.1038/s41558-018-0119-8.
Vandeweerdt, C., B. Kerremans, and A. Cohn, 2016: Climate voting in the US Congress: the power of public concern. Env. Polit. , 25(2) , 268–288, doi:10.1080/09644016.2016.1116651.
Vanegas Cantarero, M.M., 2020: Of renewable energy, energy democracy, and sustainable development: A roadmap to accelerate the energy transition in developing countries. Energy Res. Soc. Sci. , 70, 101716, doi:10.1016/J.ERSS.2020.101716.
Vatn, A., 2015: Environmental governance: institutions, policies and actions. Edward Elgar Publications, Cheltenham, UK.
Verhoef, L.A., B.W. Budde, C. Chockalingam, B. García Nodar, and A.J.M. van Wijk, 2018: The effect of additive manufacturing on global energy demand: An assessment using a bottom-up approach. Energy Policy, 112, doi:10.1016/j.enpol.2017.10.034.
Verplanken, B., 2006: Beyond frequency: Habit as mental construct. Br. J. Soc. Psychol. , 45(3) , 639–656, doi:10.1348/014466605X49122.
Verplanken, B., I. Walker, A. Davis, and M. Jurasek, 2008: Context change and travel mode choice: Combining the habit discontinuity and self-activation hypotheses. J. Environ. Psychol. , 28(2) , 121–127, doi:10.1016/j.jenvp.2007.10.005.
Versey, H.S., 2021: Missing Pieces in the Discussion on Climate Change and Risk: Intersectionality and Compounded Vulnerability: Policy Insights from Behav. Brain Sci. , 8(1) , 67–75, doi:10.1177/2372732220982628.
Viana Cerqueira, E.D., B. Motte-Baumvol, L.B. Chevallier, and O. Bonin, 2020: Does working from home reduce CO2 emissions? An analysis of travel patterns as dictated by workplaces. Transp. Res. Part D Transp. Environ. , 83 (June), 2020, doi:10.1016/j.trd.2020.102338.
Victor, P., 2019: Managing Without Growth – Slower by Design, Not Disaster. 2nd ed. Centre for the Understanding of Sustainable Prosperity (CUSP), 413 pp.
Vijeyarasa, R., 2021: Quantifying CEDAW: Concrete Tools for Enhancing Accountability for Women’s Rights. Harv. Hum. Rights J. , 34(2021).
Vinnari, M. and E. Vinnari, 2014: A Framework for Sustainability Transition: The Case of Plant-Based Diets. J. Agric. Environ. Ethics, 27(3) , 369–396, doi:10.1007/s10806-013-9468-5.
Vinyeta, K., K. Whyte, and K. Lynn, 2016: Climate Change Through an Intersectional Lens: Gendered Vulnerability and Resilience in Indigenous Communities in the United States. US Department of Agriculture, Forest Service, Pacific Northwest Research Station, https://www.researchgate.net/publication/291523872_Climate_change_through_an_intersectional_lens_Gendered_vulnerability_and_resilience_in_indigenous_communities_in_the_United_States (Accessed July 4, 2019).
Vita, G., E.G. Hertwich, K. Stadler, and R. Wood, 2019a: Connecting global emissions to fundamental human needs and their satisfaction. Environ. Res. Lett. , 14(1) , 014002, doi:10.1088/1748-9326/aae6e0.
Vita, G. et al., 2019b: The Environmental Impact of Green Consumption and Sufficiency Lifestyles Scenarios in Europe: Connecting Local Sustainability Visions to Global Consequences. Ecol. Econ. , 164 (March), 106322, doi:10.1016/j.ecolecon.2019.05.002.
Vita, G. et al., 2020: Happier with less? Members of European environmental grassroots initiatives reconcile lower carbon footprints with higher life satisfaction and income increases. Energy Res. Soc. Sci. , 60, doi:10.1016/j.erss.2019.101329.
Vogel, J., J.K. Steinberger, D.W. O’Neill, W.F. Lamb, and J. Krishnakumar, 2021: Socio-economic conditions for satisfying human needs at low energy use: An international analysis of social provisioning. Glob. Environ. Change, 69 (July 2021), 102287, doi:10.1016/J.GLOENVCHA.2021.102287.
Völlink, T. and R.M. Meertens, 1999: De effectiviteit van elektronische feedback over het energie-en waterverbruik door middel van teletekst bij huishoudens. (The effectiveness of electronic feedback on household energy use and water use by means of text TV). In: Sociale psychologie en haar toepassingen (Social psychology and its applications) [Meertens, R.M., R. Vermunt, J.B.F. De Wit, and J.F. Ybema (eds.)]. Eburon, Delft, the Netherlands, pp. 79–91.
Von Stechow, C. et al., 2016: 2°C and SDGs: united they stand, divided they fall?Environ. Res. Lett. , 11(3) , 034022, doi:10.1088/1748-9326/11/3/034022.
Voytenko Palgan, Y., L. Zvolska, and O. Mont, 2017: Sustainability framings of accommodation sharing. Environ. Innov. Soc. Transitions, 23, 70–83, doi:10.1016/J.EIST.2016.12.002.
Vranken, H., 2017: Sustainability of bitcoin and blockchains. Curr. Opin. Environ. Sustain. , 28, 1–9, doi:10.1016/j.cosust.2017.04.011.
Wachsmuth, J. and V. Duscha, 2019: Achievability of the Paris targets in the EU – the role of demand-side-driven mitigation in different types of scenarios. Energy Effic. , 12(2) , 403–421, doi:10.1007/s12053-018-9670-4.
Wadud, Z., D. MacKenzie, and P. Leiby, 2016: Help or hindrance? The travel, energy and carbon impacts of highly automated vehicles. Transp. Res. Part A Policy Pract. , 86, 1–18, doi.org/10.1016/j.tra.2015.12.001.
Walker, G., N. Simcock, and R. Day, 2016: Necessary energy uses and a minimum standard of living in the United Kingdom: Energy justice or escalating expectations?Energy Res. Soc. Sci. , 18, 129–138, doi:10.1016/j.erss.2016.02.007.
Wall, R. and T. Crosbie, 2009: Potential for reducing electricity demand for lighting in households: An exploratory socio-technical study. Energy Policy, 37(3) , 1021–1031, doi:10.1016/j.enpol.2008.10.045.
Wallace-Wells, D., 2019: Rhiana Gunn-Wright on the Rapid Evolution of Climate Policy. Intelligencer, September 20.
Waller, L. et al., 2020: Contested framings of greenhouse gas removal and its feasibility: Social and political dimensions. WIREs Clim. Change, 11(4) , doi:10.1002/wcc.649.
Wallsten, S., 2015: The Competitive Effects of the Sharing Economy: How is Uber Changing Taxis?Technology Policy Institute, Washington, DC, USA, 22 pp. https://techpolicyinstitute.org/wp-content/uploads/2015/06/the-competitive-effects-of-the-2007713.pdf (Accessed July 14, 2019).
Walsh, E., 2016: Why We Need Intersectionality to Understand Climate Change. intercontinentalcry.org, https://intercontinentalcry.org/need-intersectionality-understand-climate-change/ (Accessed December 3, 2020).
Wang, D., T. Schwanen, and Z. Mao, 2019: Does exposure to richer and poorer neighborhoods influence wellbeing?Cities, 95, doi:10.1016/j.cities.2019.102408.
Ward, J.D. et al., 2016: Is Decoupling GDP Growth from Environmental Impact Possible?PLoS One, 11(10) , e0164733, doi:10.1371/journal.pone.0164733.
Ward, J.W., J.J. Michalek, and C. Samaras, 2021: Air Pollution, Greenhouse Gas, and Traffic Externality Benefits and Costs of Shifting Private Vehicle Travel to Ridesourcing Services. Environ. Sci. Technol. , 55(19) , 13174–13185, doi:10.1021/acs.est.1c01641.
Watson, J. and R. Sauter, 2011: Sustainable innovation through leapfrogging: A review of the evidence. Int. J. Technol. Glob. , 5(3–4) , 170–189, doi.org/10.1504/IJTG.2011.039763.
Watson, R.T., J. Corbett, M.C. Boudreau, and J. Webster, 2012: An information strategy for environmental sustainability. Commun. ACM, 55(7) , 28, doi:10.1145/2209249.2209261.
WBGU, 2019: Digital Momentum for the UN Sustainability Agenda in the 21st Century. WBGU (German Advisory Council on Global Change), Berlin, Germany, 28 pp. https://www.wbgu.de/fileadmin/user_upload/wbgu/publikationen/politikpapiere/pp10_2019/pdf/WBGU_PP10_EN.pdf (Accessed July 14, 2019).
Weber, E.U., 2006: Experience-based and description-based perceptions of long-term risk: Why global warming does not scare us (yet). Clim. Change, 77(1–2) , 103–120, doi:10.1007/s10584-006-9060-3.
Weber, E.U., 2013: Psychology: Seeing is believing. Nat. Clim. Change, 3 (April 2013), doi:10.1038/nclimate1845.
Weber, E.U., 2016: What shapes perceptions of climate change? New research since 2010. Wiley Interdiscip. Rev. Clim. Change, 7(1) , 125–134, doi:10.1002/wcc.377.
Weinberger, R. and F. Goetzke, 2010: Unpacking Preference: How Previous Experience Affects Auto Ownership in the United States. Urban Stud. , 47(10) , 2111–2128, doi:10.1177/0042098009357354.
Wellesley, L. and A. Froggatt, 2015: Changing Climate, Changing Diets: Pathways to Lower Meat Consumption. Chatham House, London, UK, https://www.chathamhouse.org/2015/11/changing-climate-changing-diets-pathways-lower-meat-consumption.
Wells, P., X. Wang, L. Wang, H. Liu, and R. Orsato, 2020: More friends than foes? The impact of automobility-as-a-service on the incumbent automotive industry. Technol. Forecast. Soc. Change, 154 (November 2018), 119975, doi:10.1016/j.techfore.2020.119975.
Wenham, C., J. Smith, and R. Morgan, 2020: COVID-19: the gendered impacts of the outbreak. Lancet , 395(10227) , 846–848, doi:10.1016/S0140-6736(20)30526-2.
Wester, M. and P.D. Lama, 2019: Women as agents of change? Reflections on women in climate adaptation and mitigation in the Global North and the Global South. In: Climate Hazards, Disasters, and Gender Ramifications[Kinnvall, C. and H. Rydstrom, (eds.)], Routledge, Abingdon, UK, pp. 67–85.
Wester, P., A. Mishra, A. Mukherji, and A.B. Shrestha, 2019: The Hindu Kush Himalaya Assessment: Mountains, Climate Change, Sustainability and People. Springer, Cham, Switzerland, 627 pp.
White, R., 2011: Climate change, uncertain futures and the sociology of youth. Youth Stud. Aust. , 30(3) , 13–19.
Whiting, K., L.G. Carmona, L. Brand-Correa, and E. Simpson, 2020: Illumination as a material service: A comparison between Ancient Rome and early 19th century London. Ecol. Econ. , 169, 106502, doi:10.1016/j.ecolecon.2019.106502.
Whitmarsh, L. and A. Corner, 2017: Tools for a new climate conversation: A mixed-methods study of language for public engagement across the political spectrum. Glob. Environ. Change, 42, 122–135, doi:10.1016/j.gloenvcha.2016.12.008.
Whittle, C., L. Whitmarsh, P. Hagger, P. Morgan, and G. Parkhurst, 2019: User decision-making in transitions to electrified, autonomous, shared or reduced mobility. Transp. Res. Part D Transp. Environ. , 71 (January), 302–319, doi:10.1016/j.trd.2018.12.014.
Whyte, K., 2017: Indigenous climate change studies: Indigenizing futures, decolonizing the anthropocene. Engl. Lang. Notes, 55(1–2) , 153–162, doi:10.1215/00138282-55.1-2.153.
Whyte, K.P., 2014: A concern about shifting interactions between indigenous and non-indigenous parties in US climate adaptation contexts. Interdiscip. Environ. Rev. , 15(2/3) , 114, doi:10.1504/IER.2014.063658.
Whyte, K.P., 2018: Indigenous science (fiction) for the Anthropocene: Ancestral dystopias and fantasies of climate change crises. Environ. Plan. E Nat. Sp. , 1(1–2) , 224–242, doi:10.1177/2514848618777621.
Wickramasinghe, A., 2015: Energy for rural women: beyond energy access. In: International Energy and Poverty: The emerging contours[Guruswamy, L., (ed.)], Routledge, Abingdon, UK and New York, NY, USA, pp. 231–244.
Wiedenhofer, D., B. Smetschka, L. Akenji, M. Jalas, and H. Haberl, 2018: Household time use, carbon footprints, and urban form: a review of the potential contributions of everyday living to the 1.5°C climate target. Curr. Opin. Environ. Sustain. , 30 (February 2018), 7–17, doi:10.1016/j.cosust.2018.02.007.
Wiedenhofer, D. et al., 2020: A systematic review of the evidence on decoupling of GDP, resource use and GHG emissions, part I: Bibliometric and conceptual mapping. Environ. Res. Lett. , 15(6) , 063002, doi:10.1088/1748-9326/ab842a.
Wiedmann, T. and J. Minx, 2008: A Definition of “Carbon Footprint.” In: Ecological Economics Research Trends[Pertsova, C.C., (ed.)], Nova Science Publishers, New York, NY, USA.
Wiedmann, T., M. Lenzen, L.T. Keyßer, and J.K. Steinberger, 2020: Scientists’ warning on affluence. Nat. Commun. , 11(1) , 1–10, doi:10.1038/s41467-020-16941-y.
Wildavsky, A. and K. Dake, 1990: Theories of Risk Perception: Who Fears What and Why?Daedalus, 119(4) , 41–60.
Wildcat, D.R., 2014: Introduction: Climate change and indigenous peoples of the USA. In: Climate Change and Indigenous Peoples in the United States: Impacts, Experiences and Actions[Maldonado, J.K., B. Colombi, and R. Pandya (eds.)] Springer International Publishing, pp. 1–7.
Wilhite, H., 2009: The conditioning of comfort. Build. Res. Inf. , 37(1) , 84–88, doi:10.1080/09613210802559943.
Wilhite, H. and R. Ling, 1995: Measured energy savings from a more informative energy bill. Energy Build. , 22(2) , 145–155, doi:10.1016/0378-7788(94)00912-4.
Willett, W. et al., 2019: Food in the Anthropocene: the EAT–Lancet Commission on healthy diets from sustainable food systems. Lancet , 393(10170) , 447–492, doi:10.1016/S0140-6736(18)31788-4.
Williams, A., 2006: Product-service systems in the automotive industry: The case of micro-factory retailing. J. Clean. Prod. , 14(2) , doi:10.1016/j.jclepro.2004.09.003.
Williams, D.S., M. Máñez Costa, C. Sutherland, L. Celliers, and J. Scheffran, 2019: Vulnerability of informal settlements in the context of rapid urbanization and climate change. Environ. Urban. , 31(1) , 157–176, doi:10.1177/0956247818819694.
Williams, M. and B. Jaftha, 2020: Attitudes, beliefs and readiness to act on climate change: A preregistered replication. Ecopsychology.
Williams, R.C. et al., 2015: The Initial Incidence of a Carbon Tax Across Income Groups. Natl. Tax J. , 68(1) , 195–214.
Wilson, C., 2009: Meta-analysis of unit and industry level scaling dynamics in energy technologies and climate change mitigation scenarios. International Institute for Applied Systems Analysis (IIASA), Laxenburg, Austria, 119 pp.
Wilson, C., 2012: Up-scaling, formative phases, and learning in the historical diffusion of energy technologies. Energy Policy, 50, 81–94, doi:10.1016/j.enpol.2012.04.077.
Wilson, C., A. Grubler, K.S. Gallagher, and G.F. Nemet, 2012: Marginalization of end-use technologies in energy innovation for climate protection. Nat. Clim. Change, 2(11) , 780–788, doi:10.1038/nclimate1576.
Wilson, C., N. Bento, B. Boza-Kiss, and A. Grubler, 2019a: Near-term actions for transforming energy-service efficiency to limit global warming to 1.5°C. In: Proceedings of the eceee 2019 Summer Study on energy efficiency: Is efficient sufficient?, Belambra, Presqu’île de Giens, France.
Wilson, C., H. Pettifor, E. Cassar, L. Kerr, and M. Wilson, 2019b: The potential contribution of disruptive low-carbon innovations to 1.5°C climate mitigation. Energy Effic. , 12(2) , doi:10.1007/s12053-018-9679-8.
Wilson, C. et al., 2020a: Granular technologies to accelerate decarbonization. Science, 368(6486) , 36–39, doi:10.1126/science.aaz8060.
Wilson, C., L. Kerr, F. Sprei, E. Vrain, and M. Wilson, 2020b: Potential Climate Benefits of Digital Consumer Innovations. Annu. Rev. Environ. Resour. , 45(1) , doi:10.1146/annurev-environ-012320-082424.
Wilson, C., L. Kerr, F. Sprei, E. Vrain, and M. Wilson, 2020c: Potential Climate Benefits of Digital Consumer Innovations. Annu. Rev. Environ. Resour. , 45, 113–144, doi:10.1146/ANNUREV-ENVIRON-012320-082424.
Wilson, D.C., C. Velis, and C. Cheeseman, 2006: Role of informal sector recycling in waste management in developing countries. Habitat Int. , 30(4) , 797–808, doi.org/10.1016/j.habitatint.2005.09.005.
Wilson, J.R. et al., 2018: Adaptive comanagement to achieve climate‐ready fisheries. Conserv. Lett. , 11(6) , e12452, doi:10.1111/conl.12452.
Wilson, N.L.W., B.J. Rickard, R. Saputo, and S.-T. Ho, 2017: Food waste: The role of date labels, package size, and product category. Food Qual. Prefer. , 55, 35–44, doi:10.1016/J.FOODQUAL.2016.08.004.
Winett, R.A., J.H. Kagel, R.C. Battalio, and R.C. Winkler, 1978: Effects of monetary rebates, feedback, and information on residential electricity conservation. J. Appl. Psychol. , 63(1) , 73–80, doi:10.1037/0021-9010.63.1.73.
Wise, R.M. et al., 2014: Reconceptualising adaptation to climate change as part of pathways of change and response. Glob. Environ. Change, 28, 325–336, doi:10.1016/j.gloenvcha.2013.12.002.
Woiwode, C. et al., 2021: Inner transformation to sustainability as a deep leverage point: fostering new avenues for change through dialogue and reflection. Sustain. Sci., 16(3) , 841–858, doi:10.1007/S11625-020-00882-Y.
Wolbertus, R., M. Kroesen, R. van den Hoed, and C.G. Chorus, 2018: Policy effects on charging behaviour of electric vehicle owners and on purchase intentions of prospective owners: Natural and stated choice experiments. Transp. Res. Part D Transp. Environ. , 62, 283–297, doi:10.1016/j.trd.2018.03.012.
Wolfram, P., T. Wiedmann, and M. Diesendorf, 2016: Carbon footprint scenarios for renewable electricity in Australia. J. Clean. Prod. , 124, 236–245, doi:10.1016/j.jclepro.2016.02.080.
Wolfram, P., Q. Tu, N. Heeren, S. Pauliuk, and E.G. Hertwich, 2021: Material efficiency and climate change mitigation of passenger vehicles. J. Ind. Ecol. , 25(2) , 494–510, doi:10.1111/JIEC.13067.
Wolsink, M., 2007: Wind power implementation: The nature of public attitudes: Equity and fairness instead of “backyard motives.”Renew. Sustain. Energy Rev. , 11(6) , 1188–1207, doi:10.1016/j.rser.2005.10.005.
Wolske, K.S., A. Todd, M. Rossol, J. McCall, and B. Sigrin, 2018: Accelerating demand for residential solar photovoltaics: Can simple framing strategies increase consumer interest?Glob. Environ. Change, 53 (November), 68–77, doi:10.1016/j.gloenvcha.2018.08.005.
Wolske, K.S., K.T. Gillingham, and P.W. Schultz, 2020: Peer influence on household energy behaviours. Nat. Energy, 5(3) , 202–212, doi:10.1038/s41560-019-0541-9.
Wong-Parodi, G., T. Krishnamurti, J. Gluck, and Y. Agarwal, 2019: Encouraging energy conservation at work: A field study testing social norm feedback and awareness of monitoring. Energy Policy, 130 (July 2019), 197–205, doi:10.1016/j.enpol.2019.03.028.
World Bank, 2019: CO2 emissions (metric tons per capita). World Bank Data. Washington, DC, USA, https://data.worldbank.org/indicator/EN.ATM.CO2E.PC (Accessed December 11, 2019).
Worrell, E. and M.A.E. Van Sluisveld, 2013: Material efficiency in Dutch packaging policy. Philos. Trans. R. Soc. A Math. Phys. Eng. Sci. , 371(1986) , doi:10.1098/rsta.2011.0570.
Wu, S., X. Zheng, and C. Wei, 2017: Measurement of inequality using household energy consumption data in rural China. Nat. Energy, 2(10) , 795–803, doi:10.1038/s41560-017-0003-1.
Wu, X.D., J.L. Guo, J. Meng, and G.Q. Chen, 2019: Energy use by globalized economy: Total-consumption-based perspective via multi-region input-output accounting. Sci. Total Environ. , 662, 65–76, doi:10.1016/j.scitotenv.2019.01.108.
Wüstenhagen, R., M. Wolsink, and M.J. Bürer, 2007: Social acceptance of renewable energy innovation: An introduction to the concept. Energy Policy, 35(5) , 2683–2691, doi:10.1016/j.enpol.2006.12.001.
Xie, B., M.J. Hurlstone, and I. Walker, 2018: Correct me if I’m wrong: groups outperform individuals in the climate stabilization task. Front. Psychol. , 9, 17–28, doi:10.3389/fpsyg.2018.02274.
Yadav, P., A.P. Heynen, and D. Palit, 2019: Pay-As-You-Go financing: A model for viable and widespread deployment of solar home systems in rural India. Energy Sustain. Dev. , 48, 139–153, doi:10.1016/j.esd.2018.12.005.
Yamin, F., A. Rahman, and S. Huq, 2005: Vulnerability, Adaptation and Climate Disasters: A Conceptual Overview. IDS Bull. , 36(4) , 1–14, doi:10.1111/j.1759-5436.2005.tb00231.x.
Yan, L. et al., 2020: Quantifying and analyzing traffic emission reductions from ridesharing: A case study of Shanghai. Transp. Res. Part D Transp. Environ. , 89 (November), 102629, doi:10.1016/j.trd.2020.102629.
Yangka, D. and M. Diesendorf, 2016: Modeling the benefits of electric cooking in Bhutan: A long term perspective. Renew. Sustain. Energy Rev. , 59, 494–503, doi:10.1016/j.rser.2015.12.265.
Yao, Y., M. Hu, F. Di Maio, and S. Cucurachi, 2020: Life cycle assessment of 3D printing geo-polymer concrete: An ex-ante study. J. Ind. Ecol. , 24(1) , doi:10.1111/jiec.12930.
Yin, B., L. Liu, N. Coulombel, and V. Viguié, 2017: Evaluation of ridesharing impacts using an integrated transport land-use model: A case study for the Paris region. Transp. Res. Procedia, 27, 824–831, doi:10.1016/j.trpro.2017.12.083.
Yoeli, E. et al., 2017: Behavioral science tools to strengthen energy & environmental policy. Behav. Sci. Policy, 3(1) , 68–79, doi:10.1353/bsp.2017.0006.
Young, W., K. Hwang, S. McDonald, and C.J. Oates, 2010: Sustainable consumption: green consumer behaviour when purchasing products. Sustain. Dev. , 18(1) , 20–31, doi:10.1002/sd.394.
Yu, A., Y. Wei, W. Chen, N. Peng, and L. Peng, 2018: Life cycle environmental impacts and carbon emissions: A case study of electric and gasoline vehicles in China. Transp. Res. Part D Transp. Environ. , 65 (September), 409–420, doi:10.1016/j.trd.2018.09.009.
Yuana, S.L., F. Sengers, W. Boon, M.A. Hajer, and R. Raven, 2020: A dramaturgy of critical moments in transition: Understanding the dynamics of conflict in socio-political change. Environ. Innov. Soc. Transitions, 37, 156–170, doi:10.1016/j.eist.2020.08.009.
Yumashev, A., B. Ślusarczyk, S. Kondrashev, and A. Mikhaylov, 2020: Global Indicators of Sustainable Development: Evaluation of the Influence of the Human Development Index on Consumption and Quality of Energy. Energies, 13(11) , 2768, doi:10.3390/en13112768.
Zangheri, Serrenho, and Bertoldi, 2019: Energy Savings from Feedback Systems: A Meta-Studies’ Review. Energies, 12(19) , 3788, doi:10.3390/en12193788.
Zapico Lamela, J.L., M. Turpeinen, and M. Guath, 2011: Kilograms or cups of tea: comparing footprints for better CO2 understanding. PsychNology, 9(1) , 43–54.
Zawadzki, S.J., L. Steg, and T. Bouman, 2020: Meta-analytic evidence for a robust and positive association between individuals’ pro-environmental behaviors and their subjective wellbeing. Environ. Res. Lett. , 15(12) , 123007, doi:10.1088/1748-9326/ABC4AE.
Zhang, Y. and Z. Mi, 2018: Environmental benefits of bike sharing: A big data-based analysis. Appl. Energy, 220 (December 2017), 296–301, doi:10.1016/j.apenergy.2018.03.101.
Zhang, Y., D. Lin, and Z. Mi, 2019: Electric fence planning for dockless bike-sharing services. J. Clean. Prod. , 206, 383–393, doi:10.1016/j.jclepro.2018.09.215.
Zheng, J., A.A. Chien, and S. Suh, 2020: Mitigating Curtailment and Carbon Emissions through Load Migration between Data Centers. Joule, 4(10) , doi:10.1016/j.joule.2020.08.001.
Zhou, S. and D. Noonan, 2019: Justice Implications of Clean Energy Policies and Programs in the United States: A Theoretical and Empirical Exploration. Sustainability, 11(3) , 807, doi:10.3390/su11030807.
Zimm, C., 2019: Methodological issues in measuring international inequality in technology ownership and infrastructure service use. Dev. Stud. Res. , 6(1) , 92–105, doi:10.1080/21665095.2019.1605533.
Zimmerman, M.A., and G.J. Zeitz, 2002: Beyond Survival: Achieving New Venture Growth by Building Legitimacy. Acad. Manag. , 27(3) , 414–431, doi:10.5465/amr.2002.7389921.
Zink, T. and R. Geyer, 2017: Circular Economy Rebound. J. Ind. Ecol. , 21(3) , 593–602, doi:10.1111/jiec.12545.
Zubi, G., G.V. Fracastoro, J.M. Lujano-Rojas, K. El Bakari, and D. Andrews, 2019: The unlocked potential of solar home systems; an effective way to overcome domestic energy poverty in developing regions. Renew. Energy, 132, 1425–1435, doi:10.1016/j.renene.2018.08.093.


