Figure 6.8
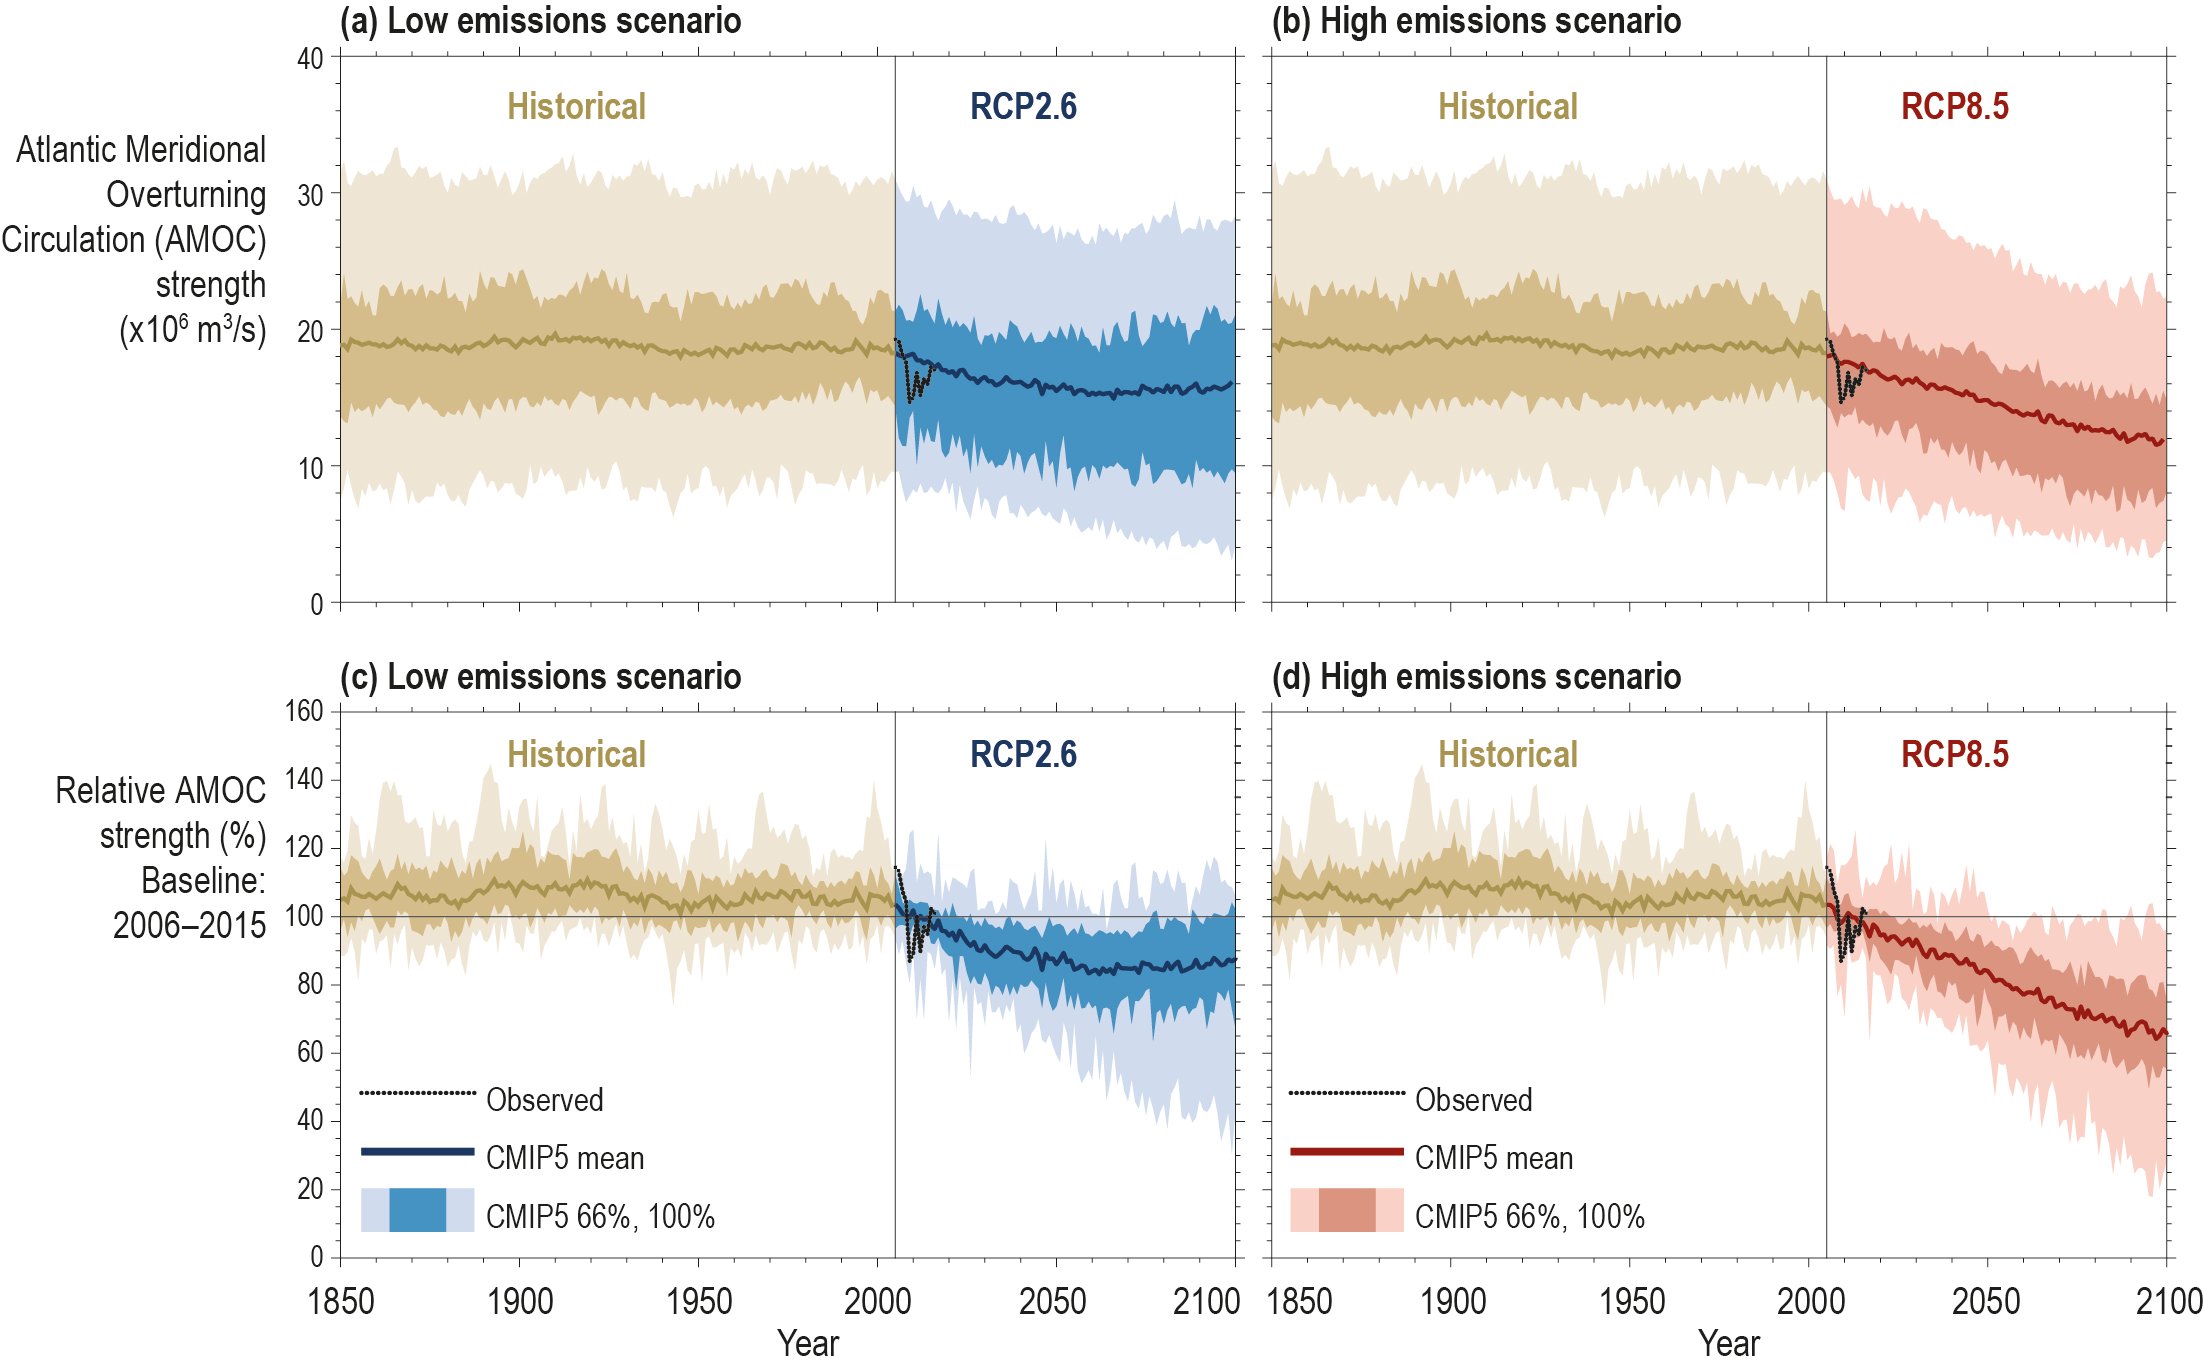
Figure 6.8 | Atlantic Meridional Overturning Circulation (AMOC) changes at 26oN as simulated by 27 models (only 14 were shown in the IPCC 5th Assessment Report (AR5); IPCC, 2013). The dotted line shows the observation-based estimate at 26oN (McCarthy et al. 2015b) and the thick grey/blue/red lines the multi-model ensemble mean. Values of AMOC maximum at 26oN (in units 106 m3 s–1) are shown in historical simulations (most of the time 1850–2005) followed for 2006–2100 by a) Representative Concentration Pathway (RCP)2.6 simulations and b) RCP8.5 simulations. In c) and d), the time series show the AMOC strength relative to the value during 2006–2015, a period over which observations are available. c) shows historical followed by RCP2.6 simulations and d) shows historical followed by RCP8.5 simulations. The 66% and 100% ranges of all-available CMIP5 simulations are shown in grey for historical, blue for RCP2.6 scenario and red for RCP8.5 scenario.