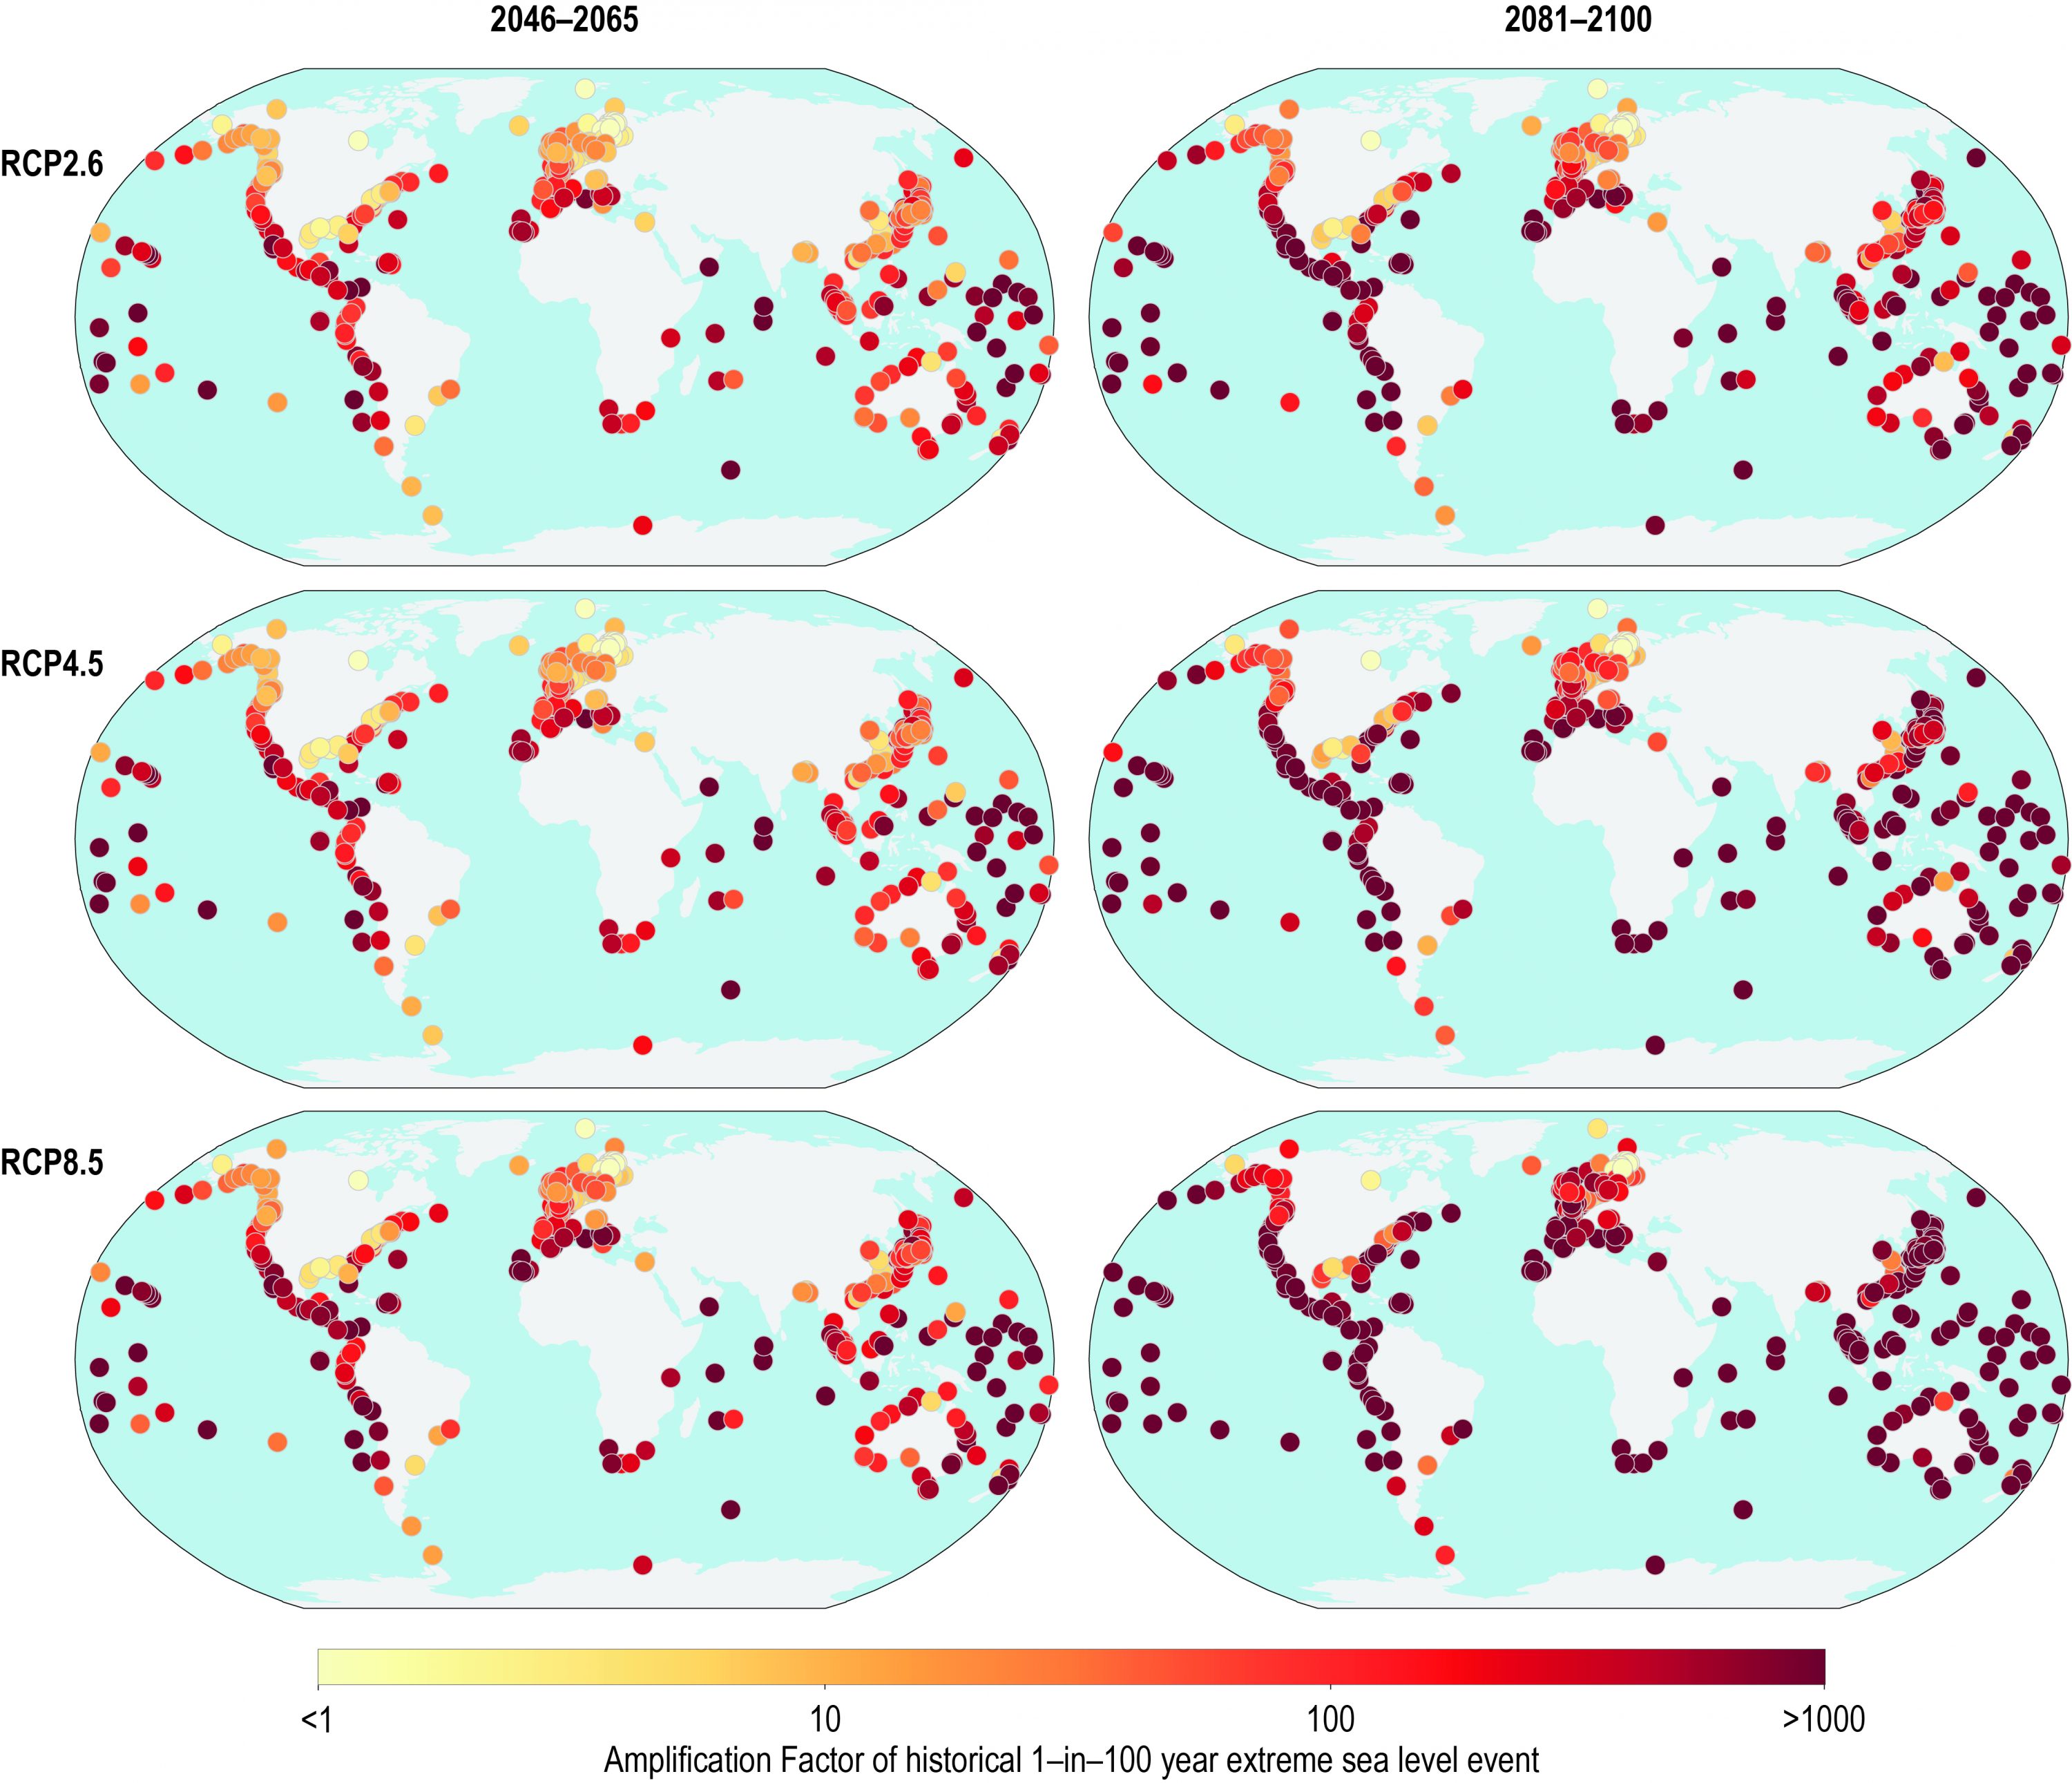
Figure 4.12 | The colours of the dots express the factor by which the frequency of extreme sea level (ESL) events increase in the future for events which historically have a return period of 100 years. Hence a value of 50 means that what is currently 1-in-100 year event will happen every 2 years due to a rise in mean sea level. Results are shown for three RCP scenarios and two future time slices as median values. Results are shown for tide gauges in the GESLA2 database. The accompanying confidence interval can be found in SM4.2 as well as a list of all locations. The data underlying the graph are identical to those presented in Figure 4.11. The amplification factor is schematically explained in the upper right panel of figure 4.11. Storm climatology is constant in these projections.