Figure 1.5
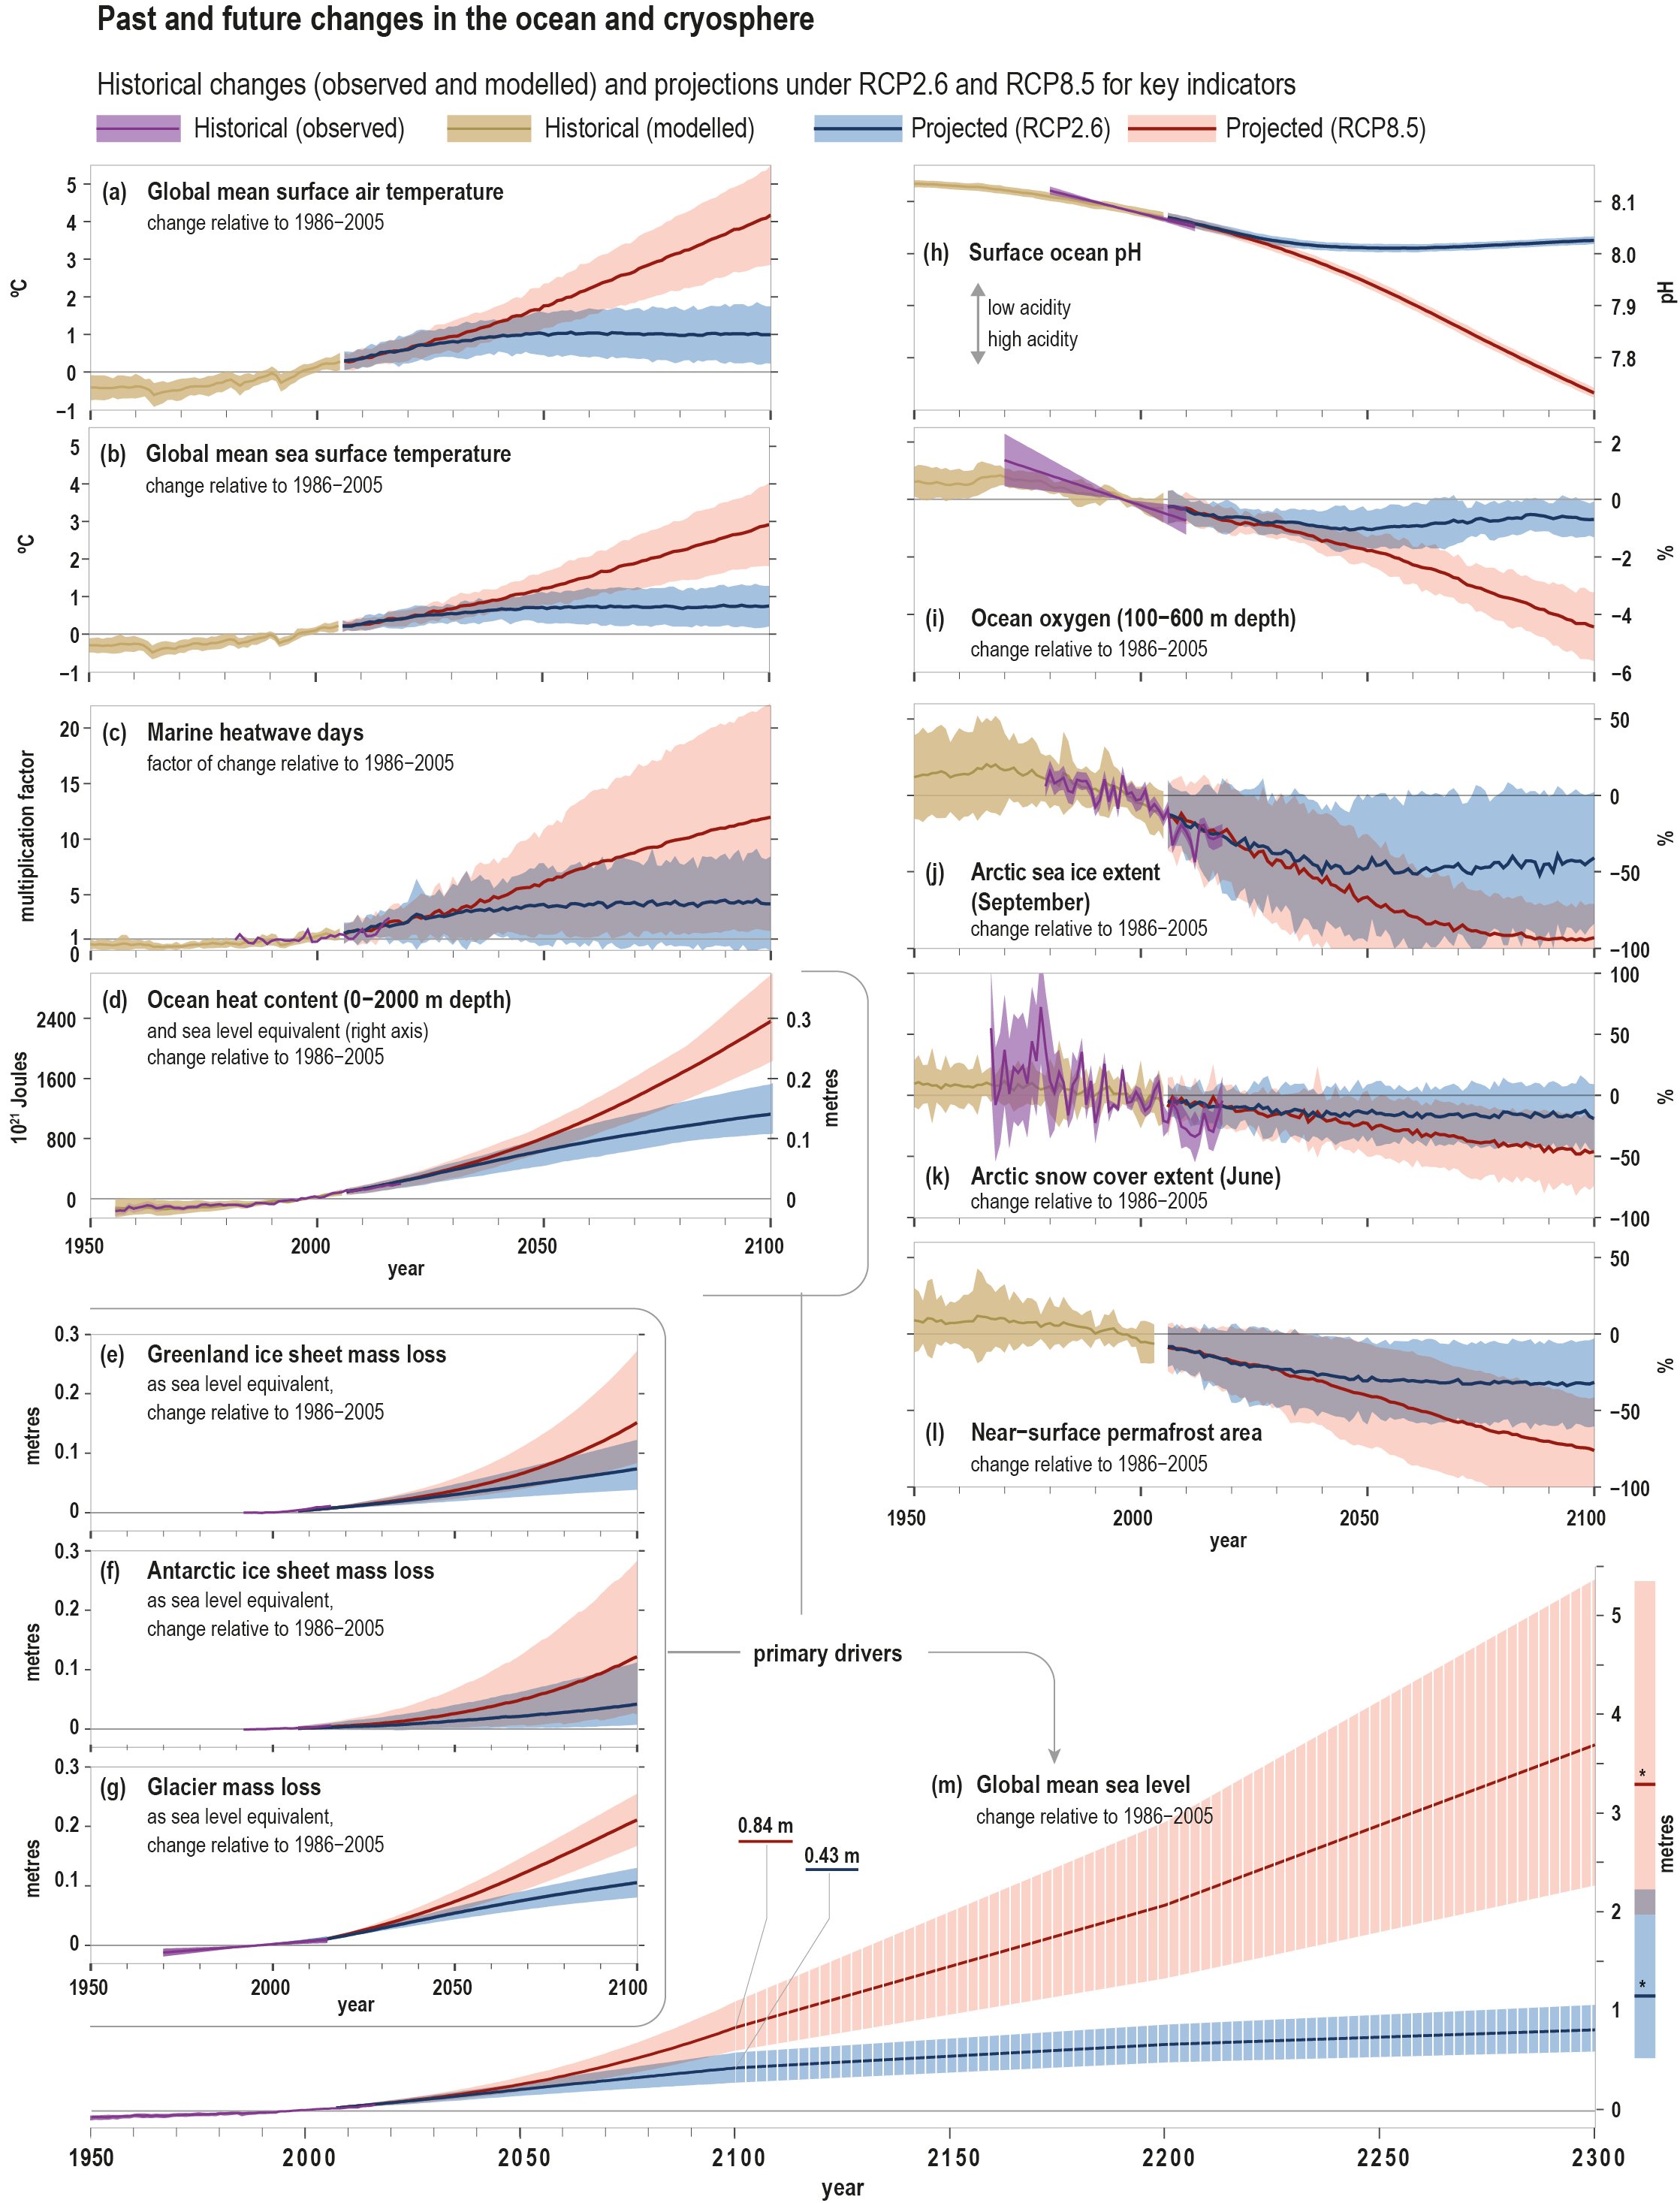
Figure 1.5 | Observed and modelled historical changes in the ocean and cryosphere since 1950, and projected future changes under low (RCP2.6) and high (RCP8.5) greenhouse gas emissions scenarios (Cross-Chapter Box 1 in Chapter 1). Changes are shown for: (a) Global mean surface air temperature change with likely range (Cross-Chapter Box 1 in Chapter 1). Ocean-related changes with very likely ranges for (b) Global mean sea surface temperature change (Box 5.1, Section 5.2.2); (c) Change factor in surface ocean marine heatwave days (6.4.1);
(d) Global ocean heat content change (0–2000 m depth). An approximate steric sea level equivalent is shown with the right axis by multiplying the ocean heat content by the global-mean thermal expansion coefficient (ε ≈ 0.125 m per 1024 Joules) for observed warming since 1970 (Figure 5.1); (h) Global mean surface pH (on the total scale). Assessed observational trends are compiled from open ocean time series sites longer than 15 years (Box 5.1, Figure 5.6, Section 5.2.2); and (i) Global mean ocean oxygen change (100–600 m depth). Assessed observational trends span 1970–2010 centered on 1996 (Figure 5.8, Section 5.2.2). Sea-level changes with likely ranges for (m) Global mean sea level change. Hashed shading reflects low confidence in sea level projections beyond 2100 and bars at 2300 reflect expert elicitation on the range of possible sea level change (Section 4.2.3, Figure 4.2); and components from (e,f) Greenland and Antarctic ice sheet mass loss (Section 3.3.1); and (g) Glacier mass loss (Cross-Chapter Box 6 in Chapter 2, Table 4.1). Further cryosphere-related changes with very likely ranges for (j) Arctic sea ice extent change for September (Sections 3.2.1, 3.2.2 Figure 3.3); (k) Arctic snow cover change for June (land areas north of 60oN) (Sections 3.4.1, 3.4.2, Figure 3.10); and (l) Change in near-surface (within 3–4 m) permafrost area in the Northern Hemisphere (Sections 3.4.1, 3.4.2, Figure 3.10).