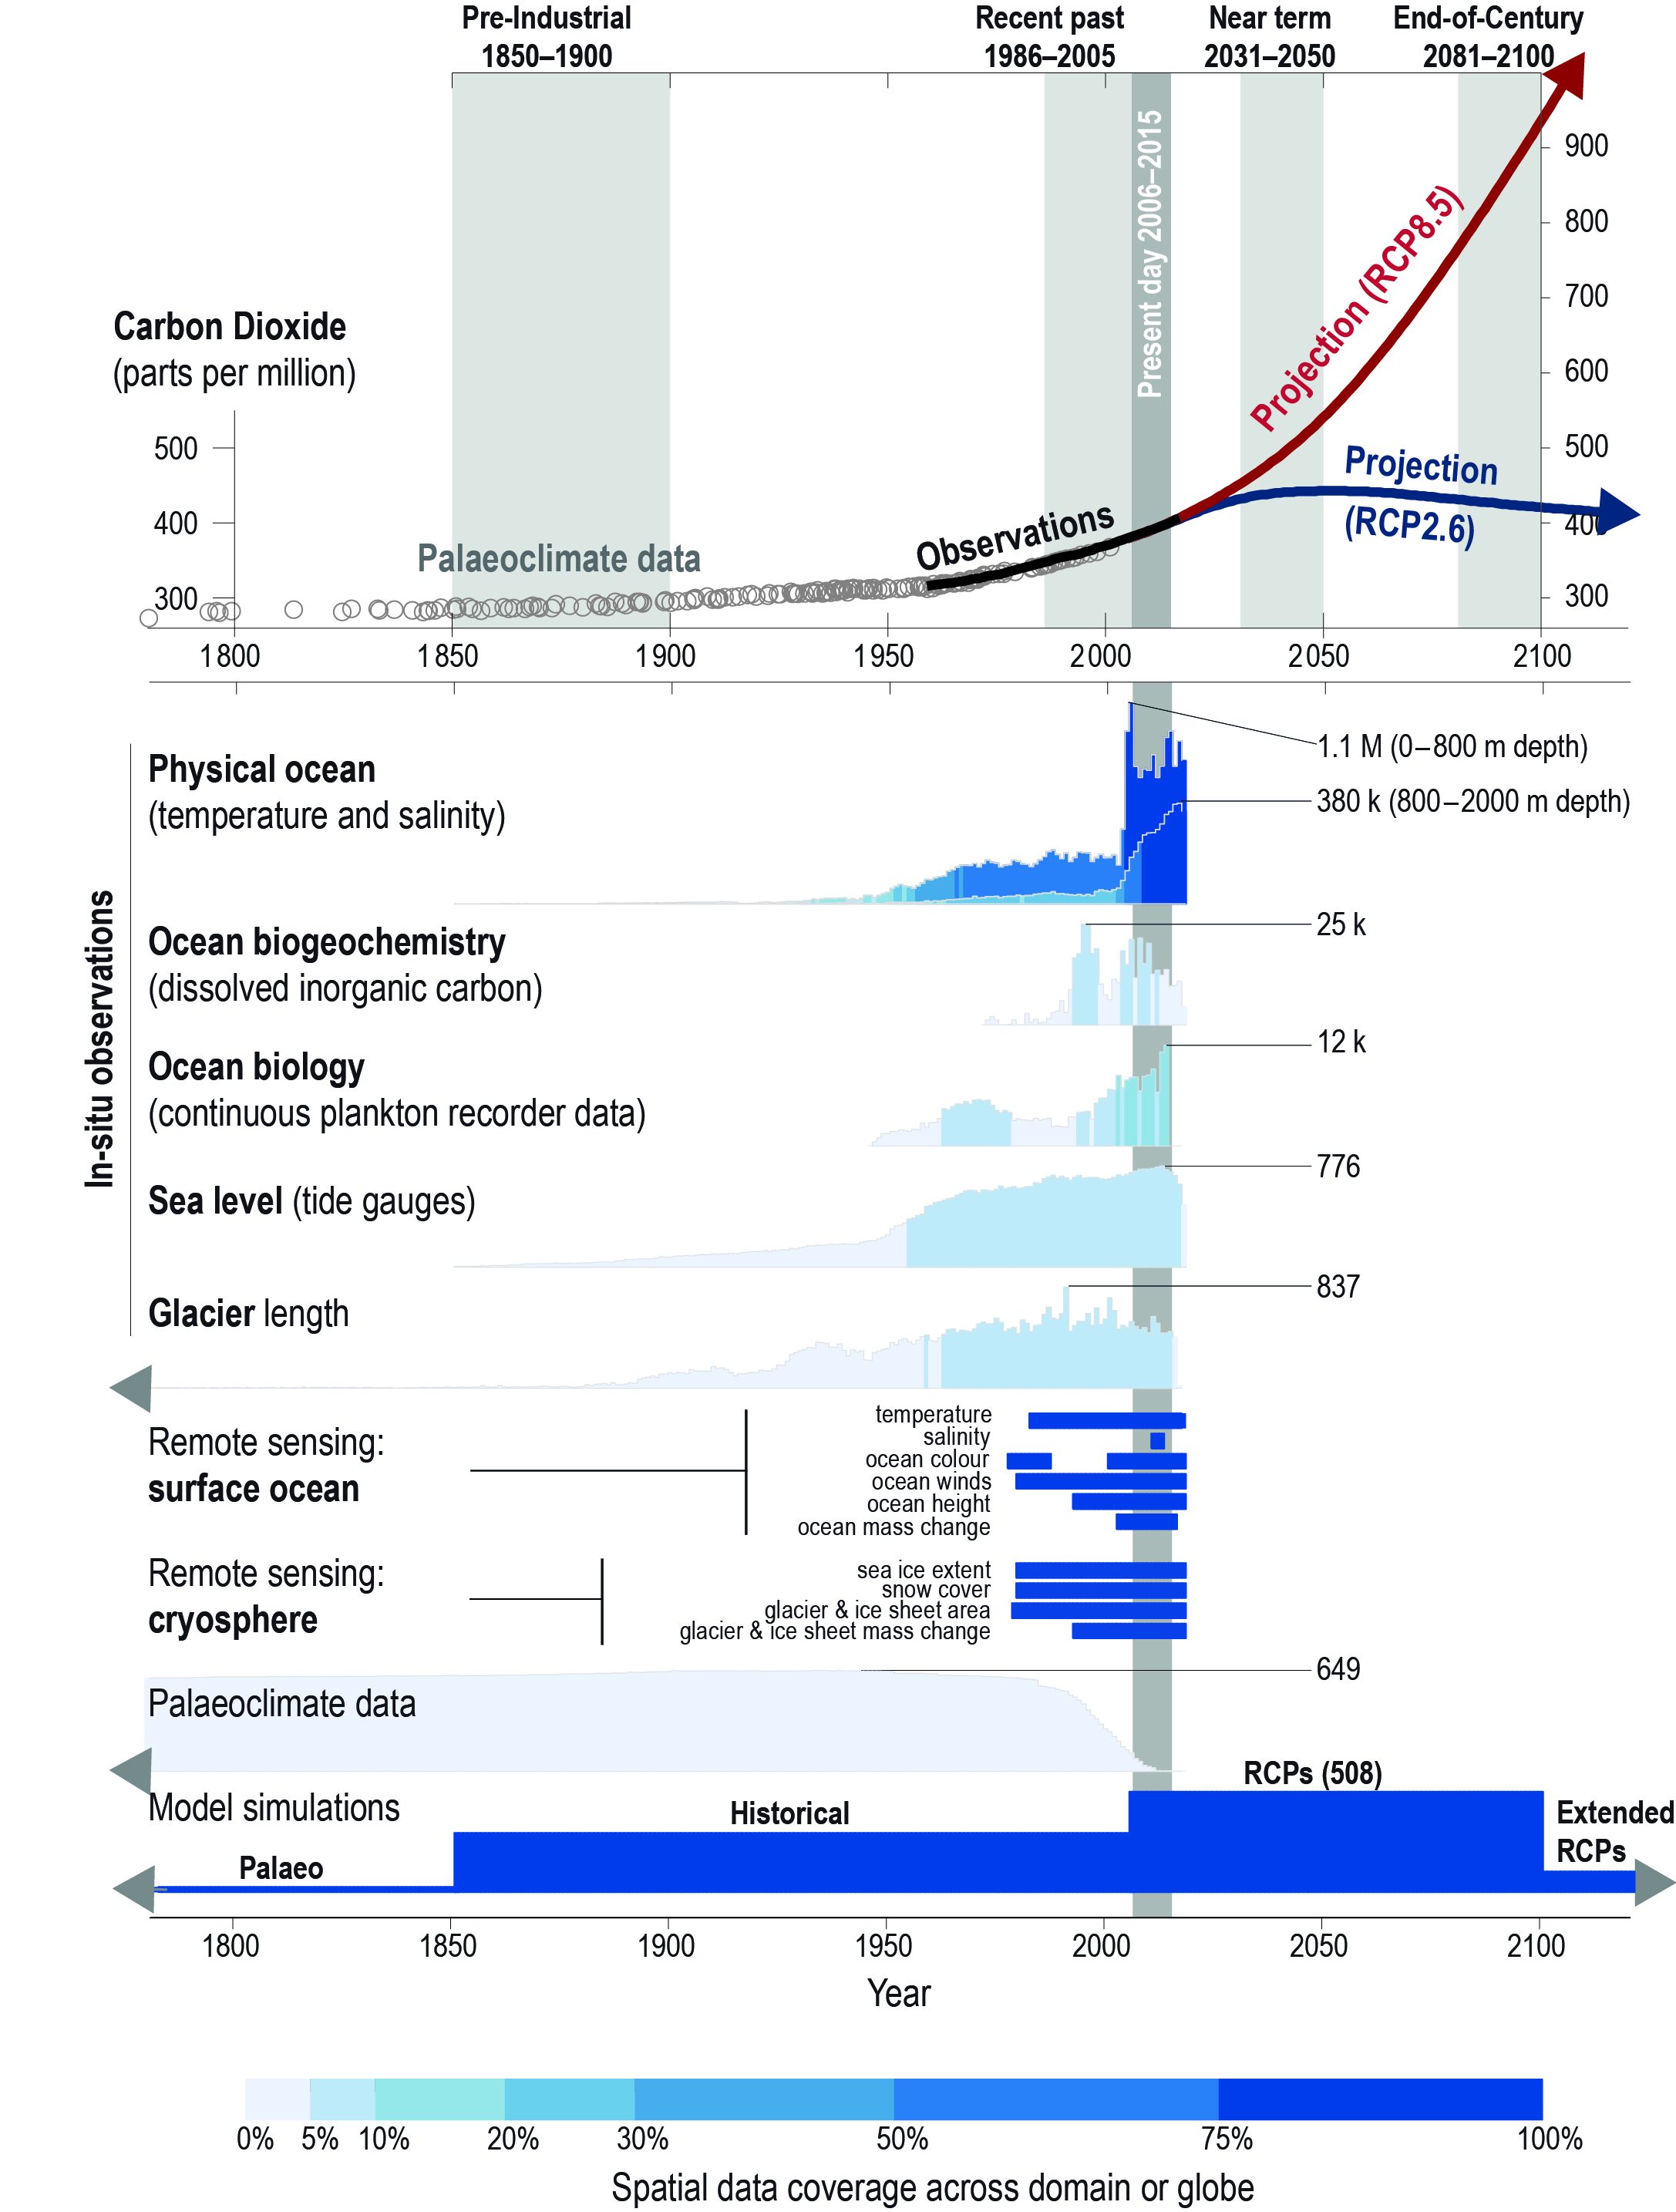
Figure 1.3
Figure 1.3 | Illustrative examples of the availability of ocean and cryosphere data relative to the major time periods assessed in the Special Report on the Oceans and Cryosphere in a Changing Climate (SROCC). Upper panel; observed (Keeling et al., 1976) and reconstructed (Bereiter et al., 2015) atmospheric CO2 concentrations, as well as the Representative Concentration Pathways (RCPs) of CO2 for low (RCP2.6) and high (RCP8.5) future emission scenarios (van Vuuren et al., 2011a; Cross-Chapter Box 1 in Chapter 1). Lower panel; illustrative examples of data availability for the ocean and cryosphere (Section 1.8.1; Taylor et al., 2012; Boyer et al., 2013; Dowell et al., 2013; McQuatters-Gollop et al., 2015; Raup et al., 2015; Olsen et al., 2016; PSMSL, 2016; PAGES2K Consortium, 2017; WGMS, 2017). The amount of data available through time is shown by the heights of the time series for observational data, palaeoclimate data and model simulations, expressed relative to the maximum annual data availability (maximum values given on plot; M = million, k = thousand). Spatial coverage of data across the globe or the relevant domain is shown by colour scale. See SM1.4 for further details.