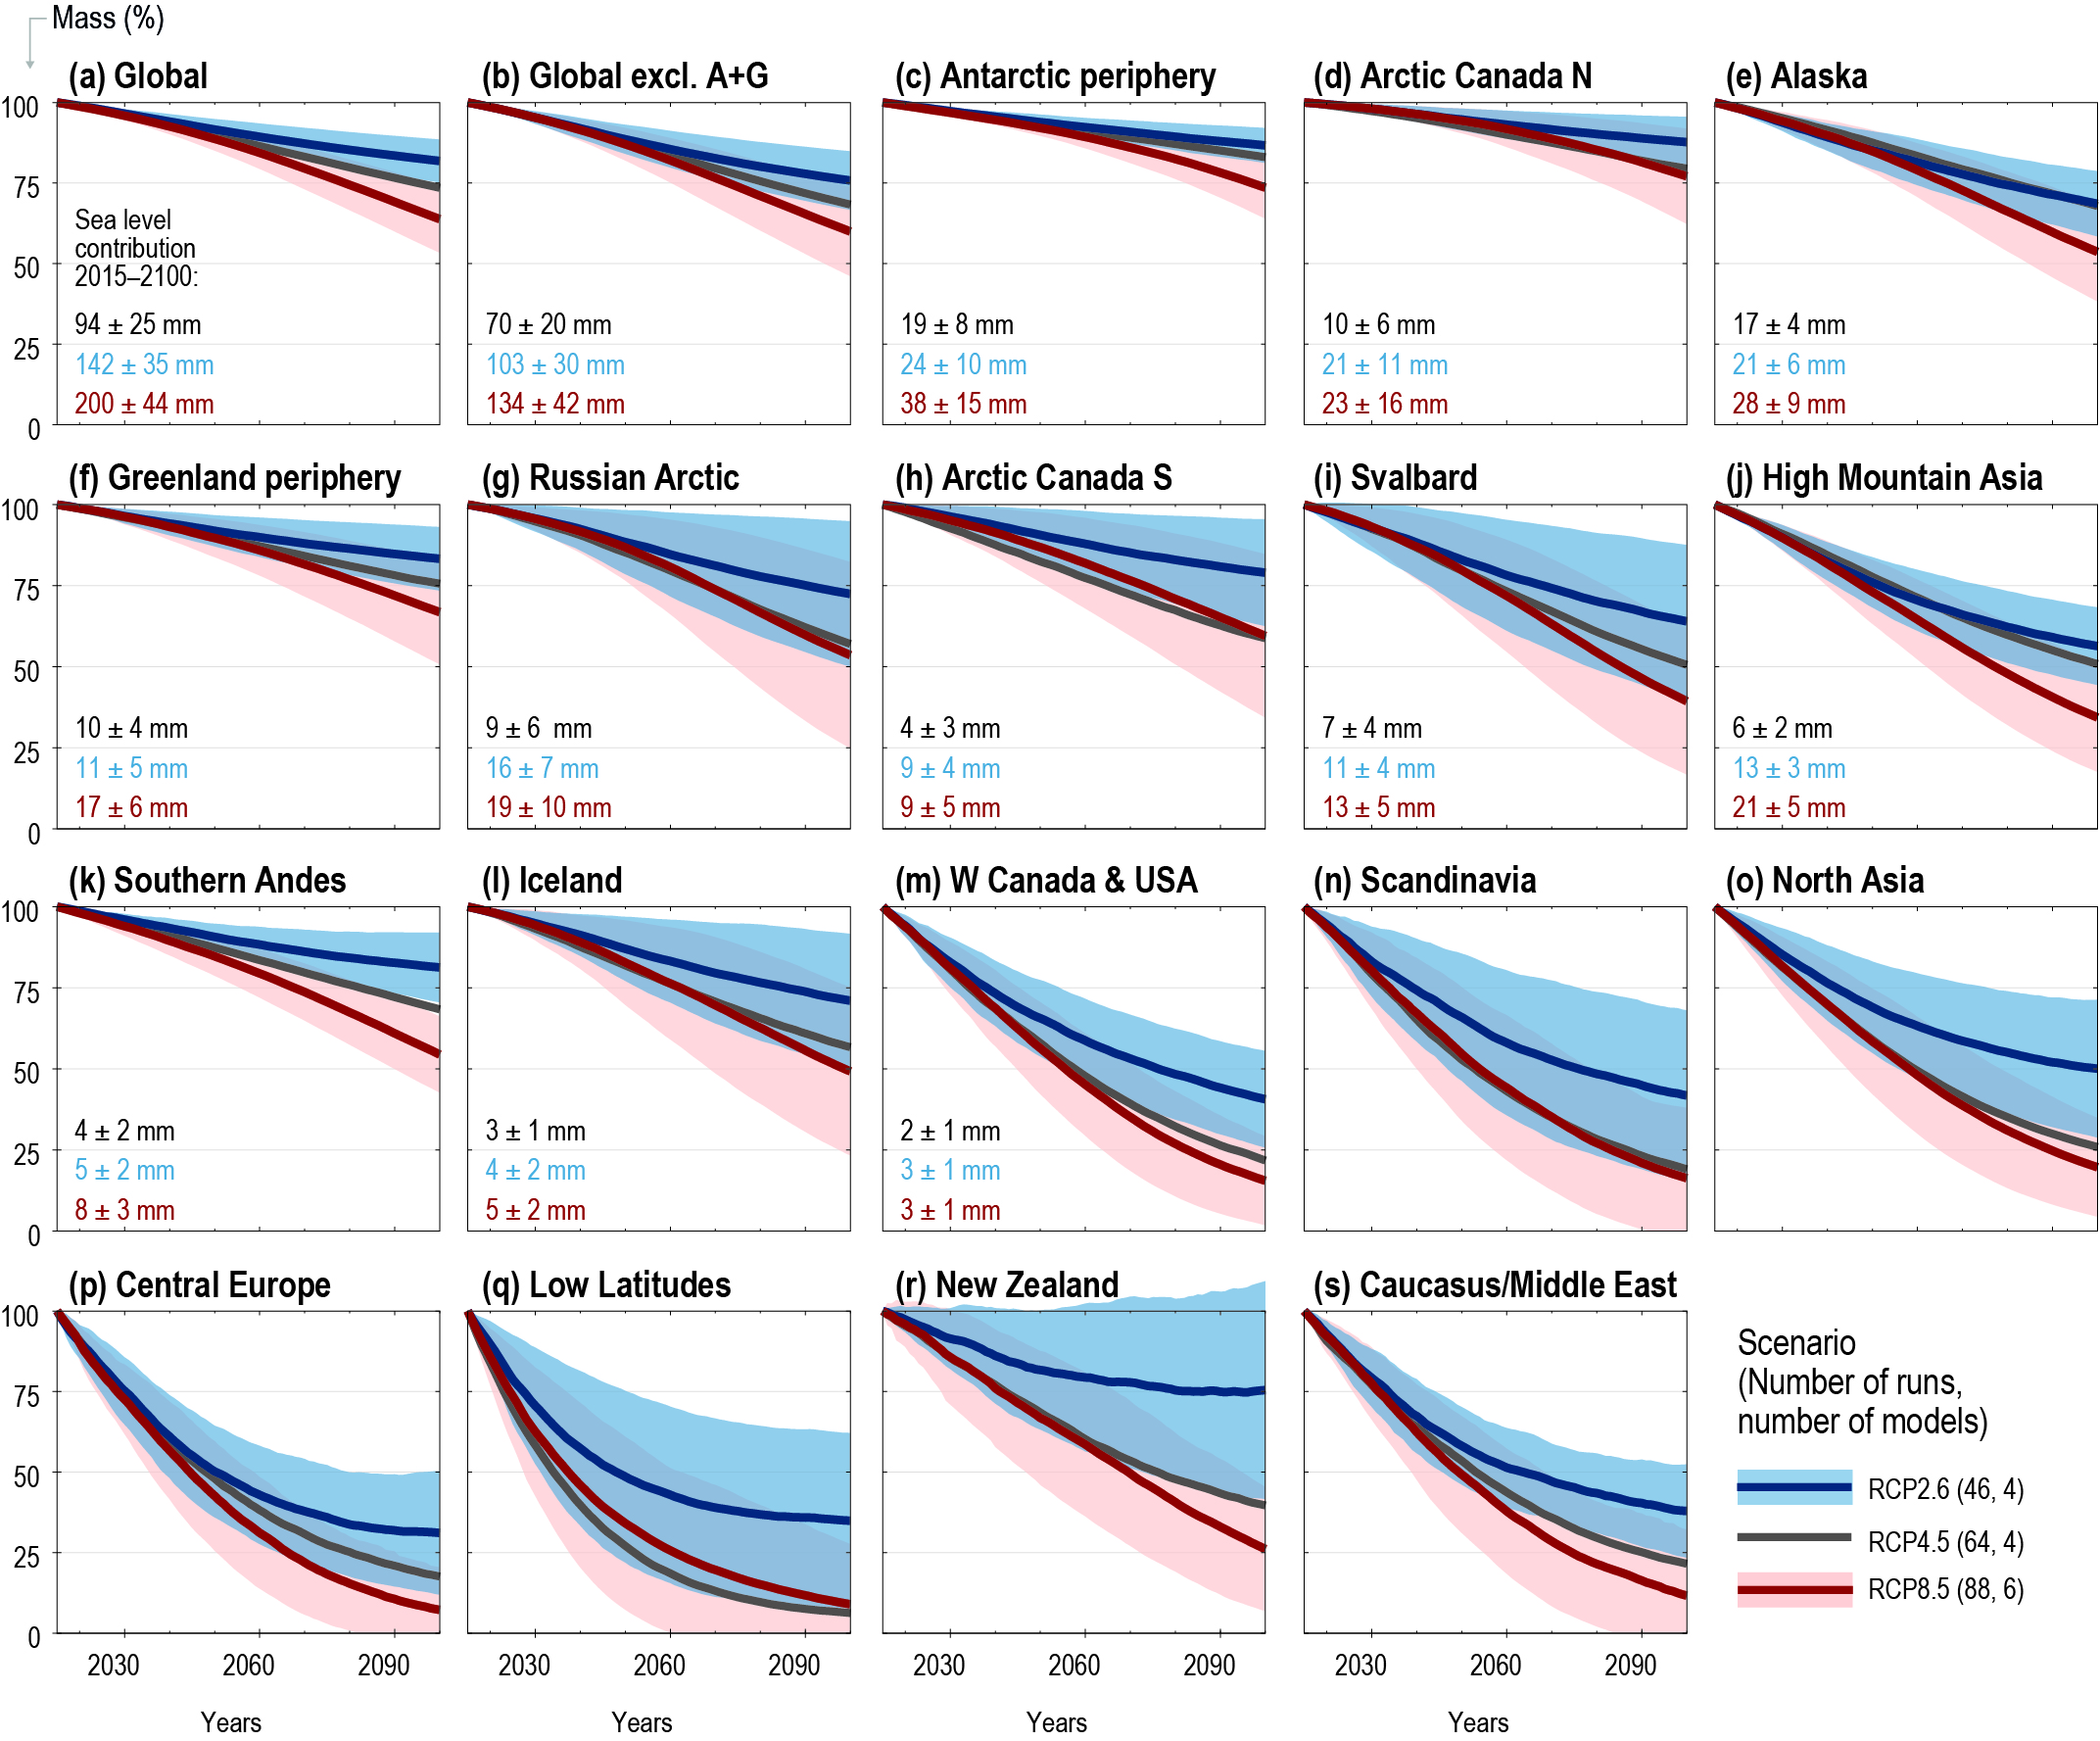
Figure CB6.1
Figure CB6.1 | Projected glacier mass evolution between 2015 and 2100 relative to each region’s glacier mass in 2015 (100%) based on three Representative Concentration Pathways (RCP) emission scenarios (Cross-Chapter Box 1 in Chapter 1). Thick lines show the averages of 46 to 88 model projections based on four to six glacier models for the same RCP, and the shading marks ± 1 standard deviation (not shown for RCP4.5 for better readability). Global projections are shown excluding and including the Antarctic (A) and Greenland (G) periphery. Regional sea level contributions are given for three RCPs for all regions with >0.5 mm sea level equivalent (SLE) between 2015–2100. The Low Latitudes region includes the glaciers in the tropical Andes, Mexico, eastern Africa and Indonesia. Region Alaska includes adjacent glaciers in the Yukon and British Columbia, Canada. Regions are sorted by glacier volume according to Farinotti et al. (2019). Data based on Marzeion et al. (2012); Giesen and Oerlemans (2013); Hirabayashi et al. (2013); Bliss et al. (2014); Huss and Hock (2015); Slangen et al. (2017). Modified from Hock et al. (2019).