Figure 2.1
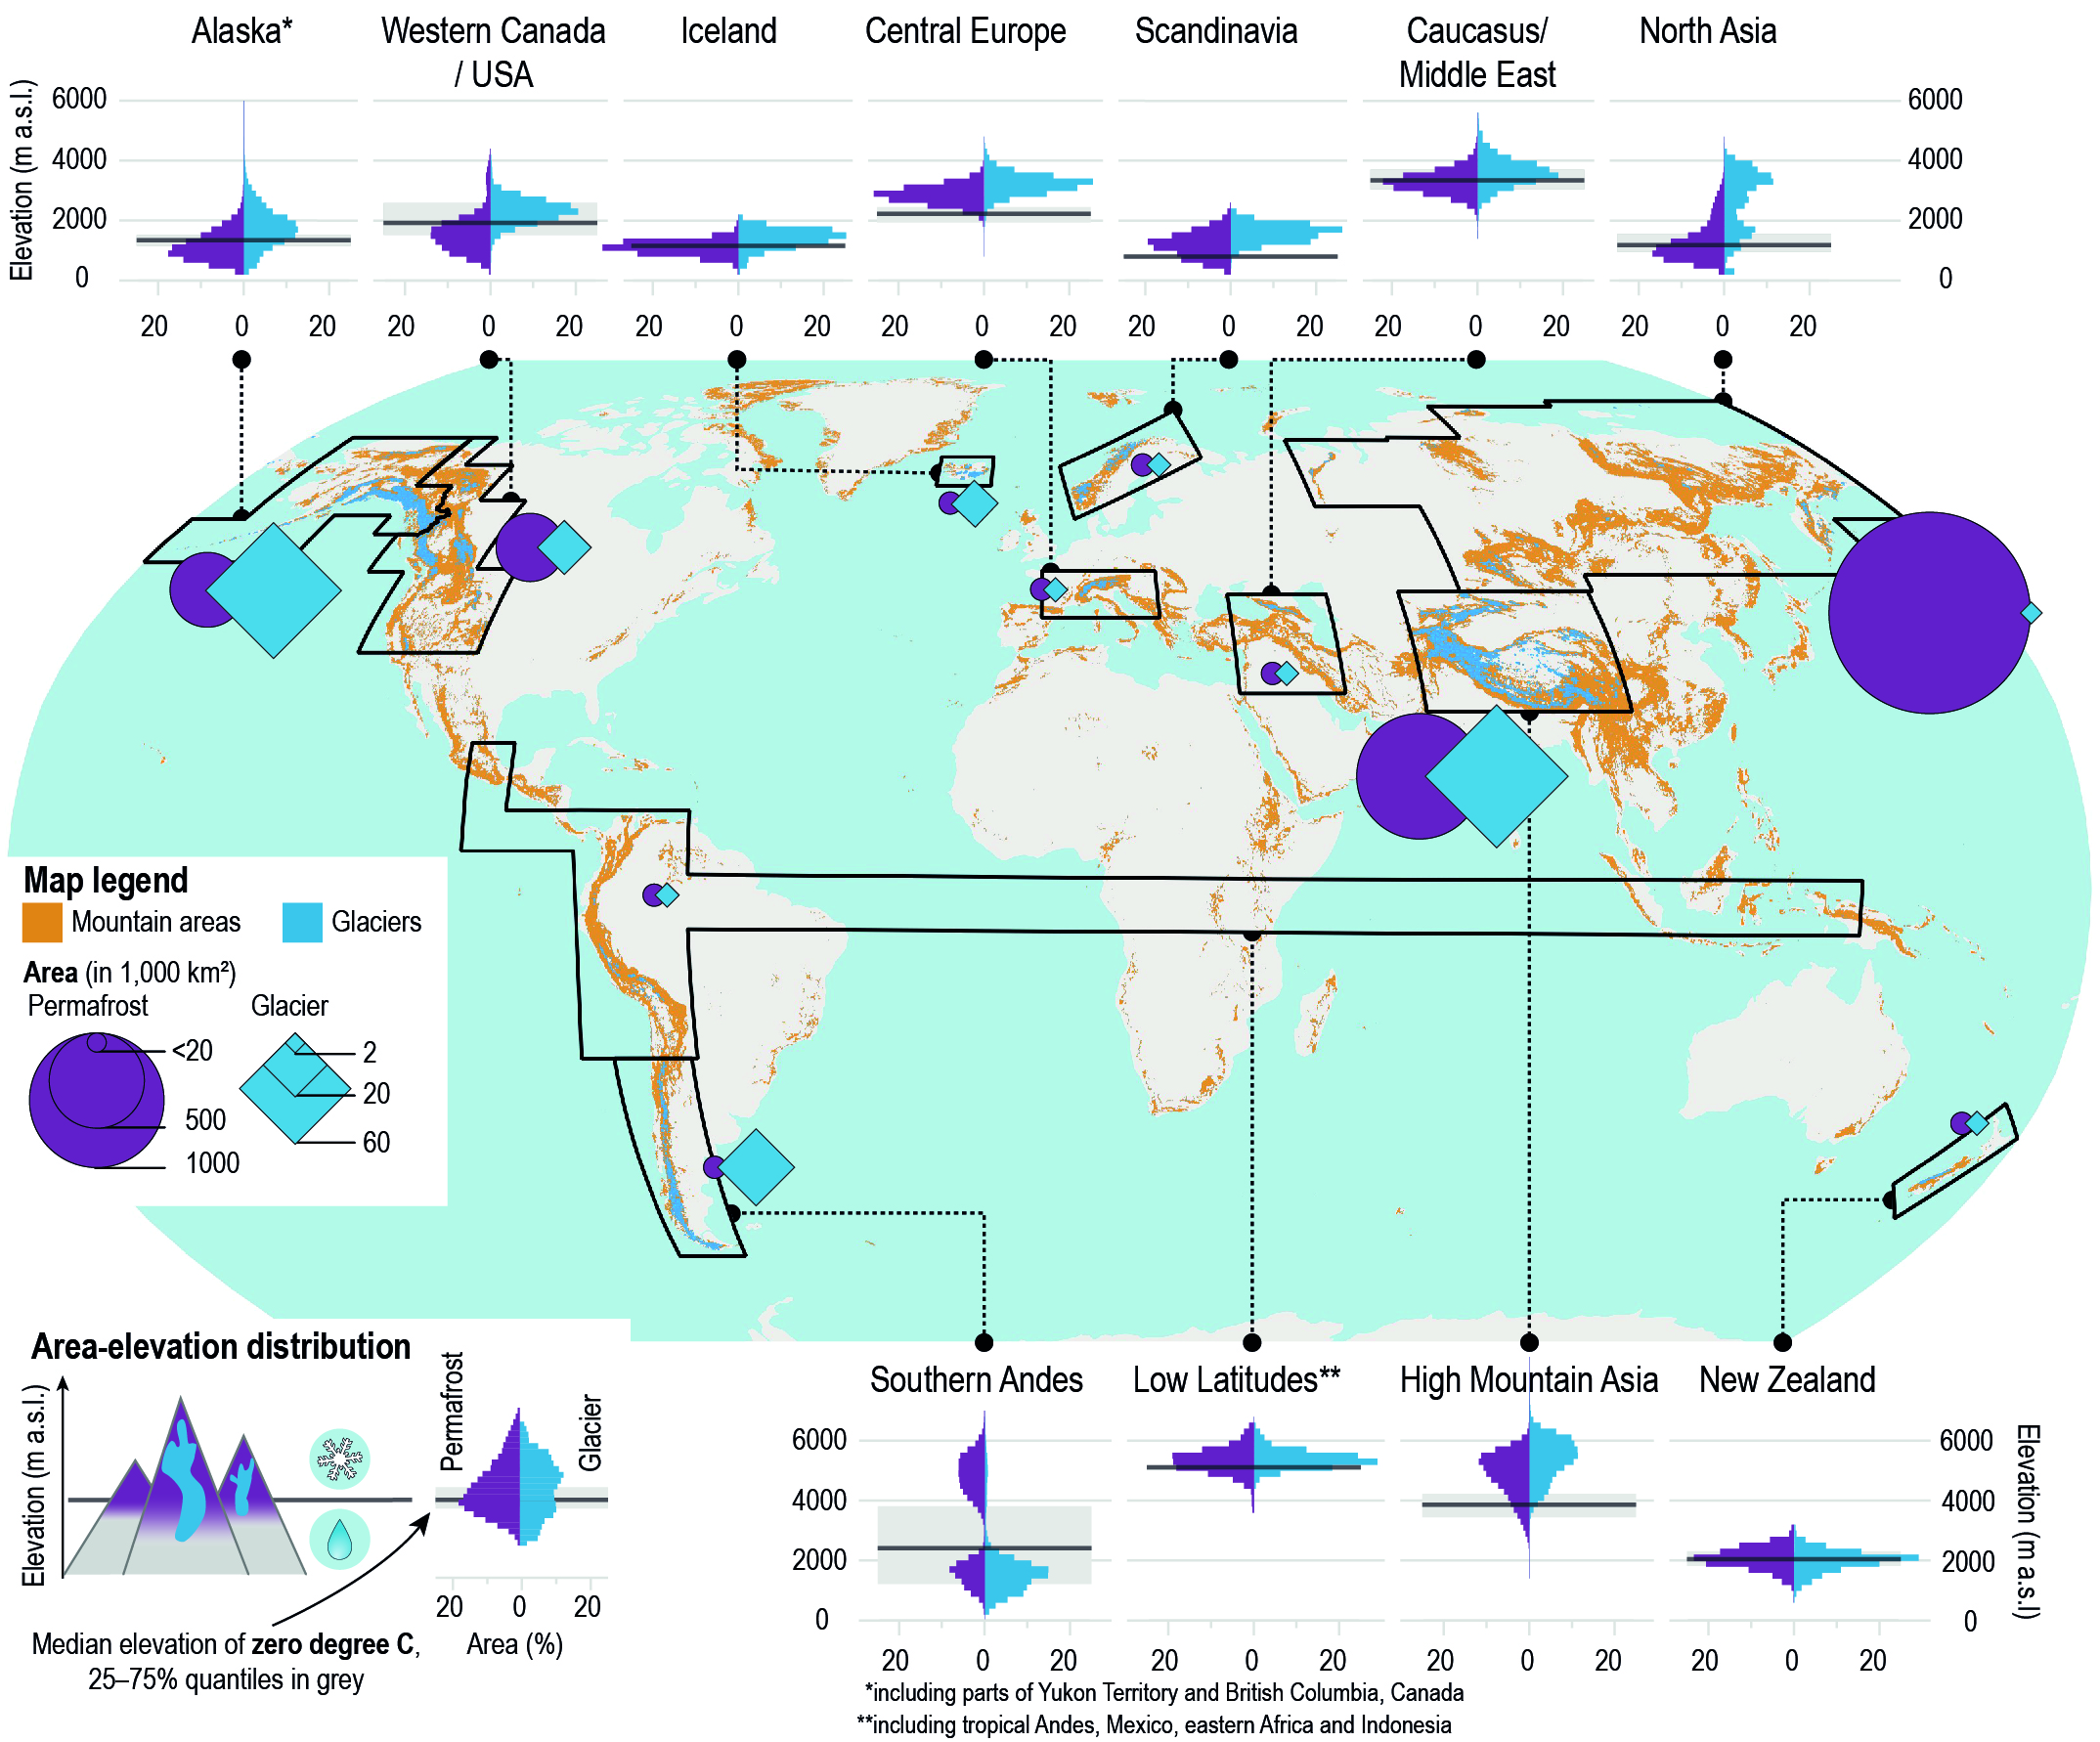
Figure 2.1 | Distribution of mountain areas (orange shading) and glaciers (blue) as well as regional summary statistics for glaciers and permafrost in mountains. Mountains are distinguished based on a ruggedness index (>3.5), a logarithmically scaled measure of relative relief (Gruber, 2012). Eleven distinct regions with glaciers, generally corresponding to the primary regions in the Randolph Glacier Inventory, RGI v6.0 (RGI Consortium, 2017) are outlined, although some cryosphere related impacts presented in this chapter may go beyond these regions. Region names correspond to those in the RGI. Diamonds represent regional glacier area (RGI 6.0) and circles the permafrost area in all mountains within each region boundary (Obu et al., 2019). Histograms for each region show glacier and permafrost area in 200 m elevation bins as a percentage of total regional glacier and permafrost area, respectively. Also shown is the median elevation of the annual mean 0oC free-atmosphere isotherm calculated from the ERA-5 re-analysis of the European Centre for Medium Range Weather Forecasts over each region’s mountain area for the period 2006–2015, with 25–75% quantiles in grey. The annual 0oC isotherm elevation roughly separates the areas where precipitation predominantly falls as snow and rain. Areas above and below this elevation are loosely referred to as high and low elevations, respectively, in this chapter.