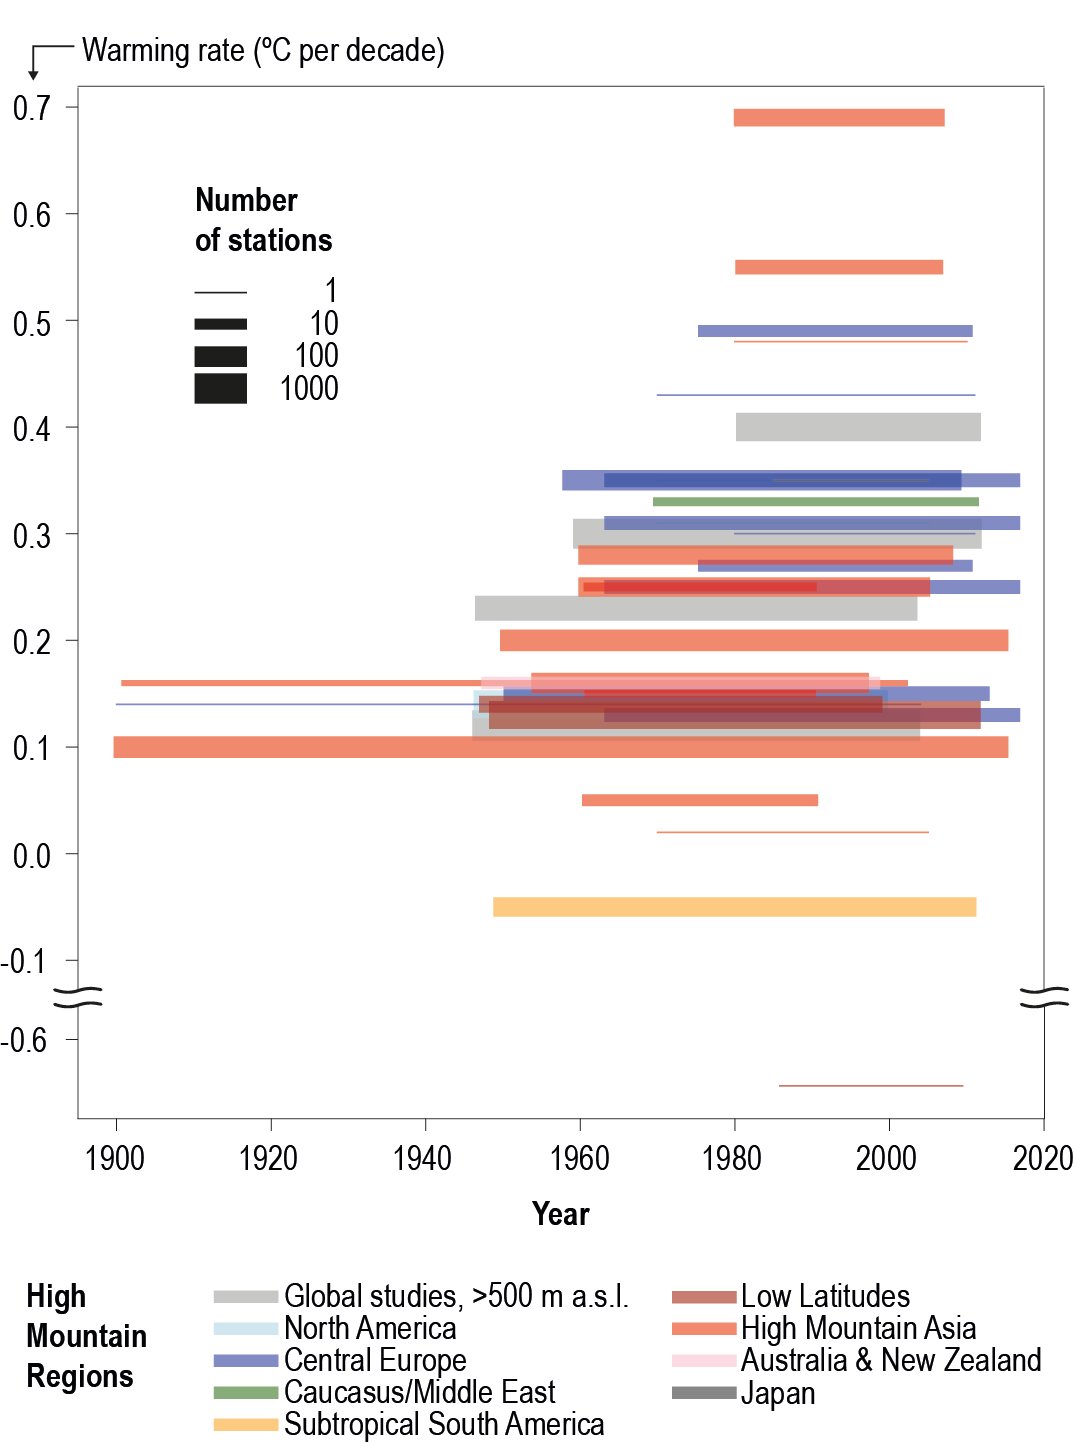
Figure 2.2 | Synthesis of trends in mean annual surface air temperature in mountain regions, based on 4672 observation stations (partly overlapping) aggregated in 38 datasets reported in 19 studies. Each line refers to a warming rate from one dataset, calculated over the time period indicated by the extent of the line. Colours indicate mountain region (Figure 2.1), and line thickness the number of observation stations used. Detailed references are found in Table SM2.2, which also provides additional information on trends for individual seasons and other temperature indicators (daily minimum or maximum temperature).