Figure 2.6
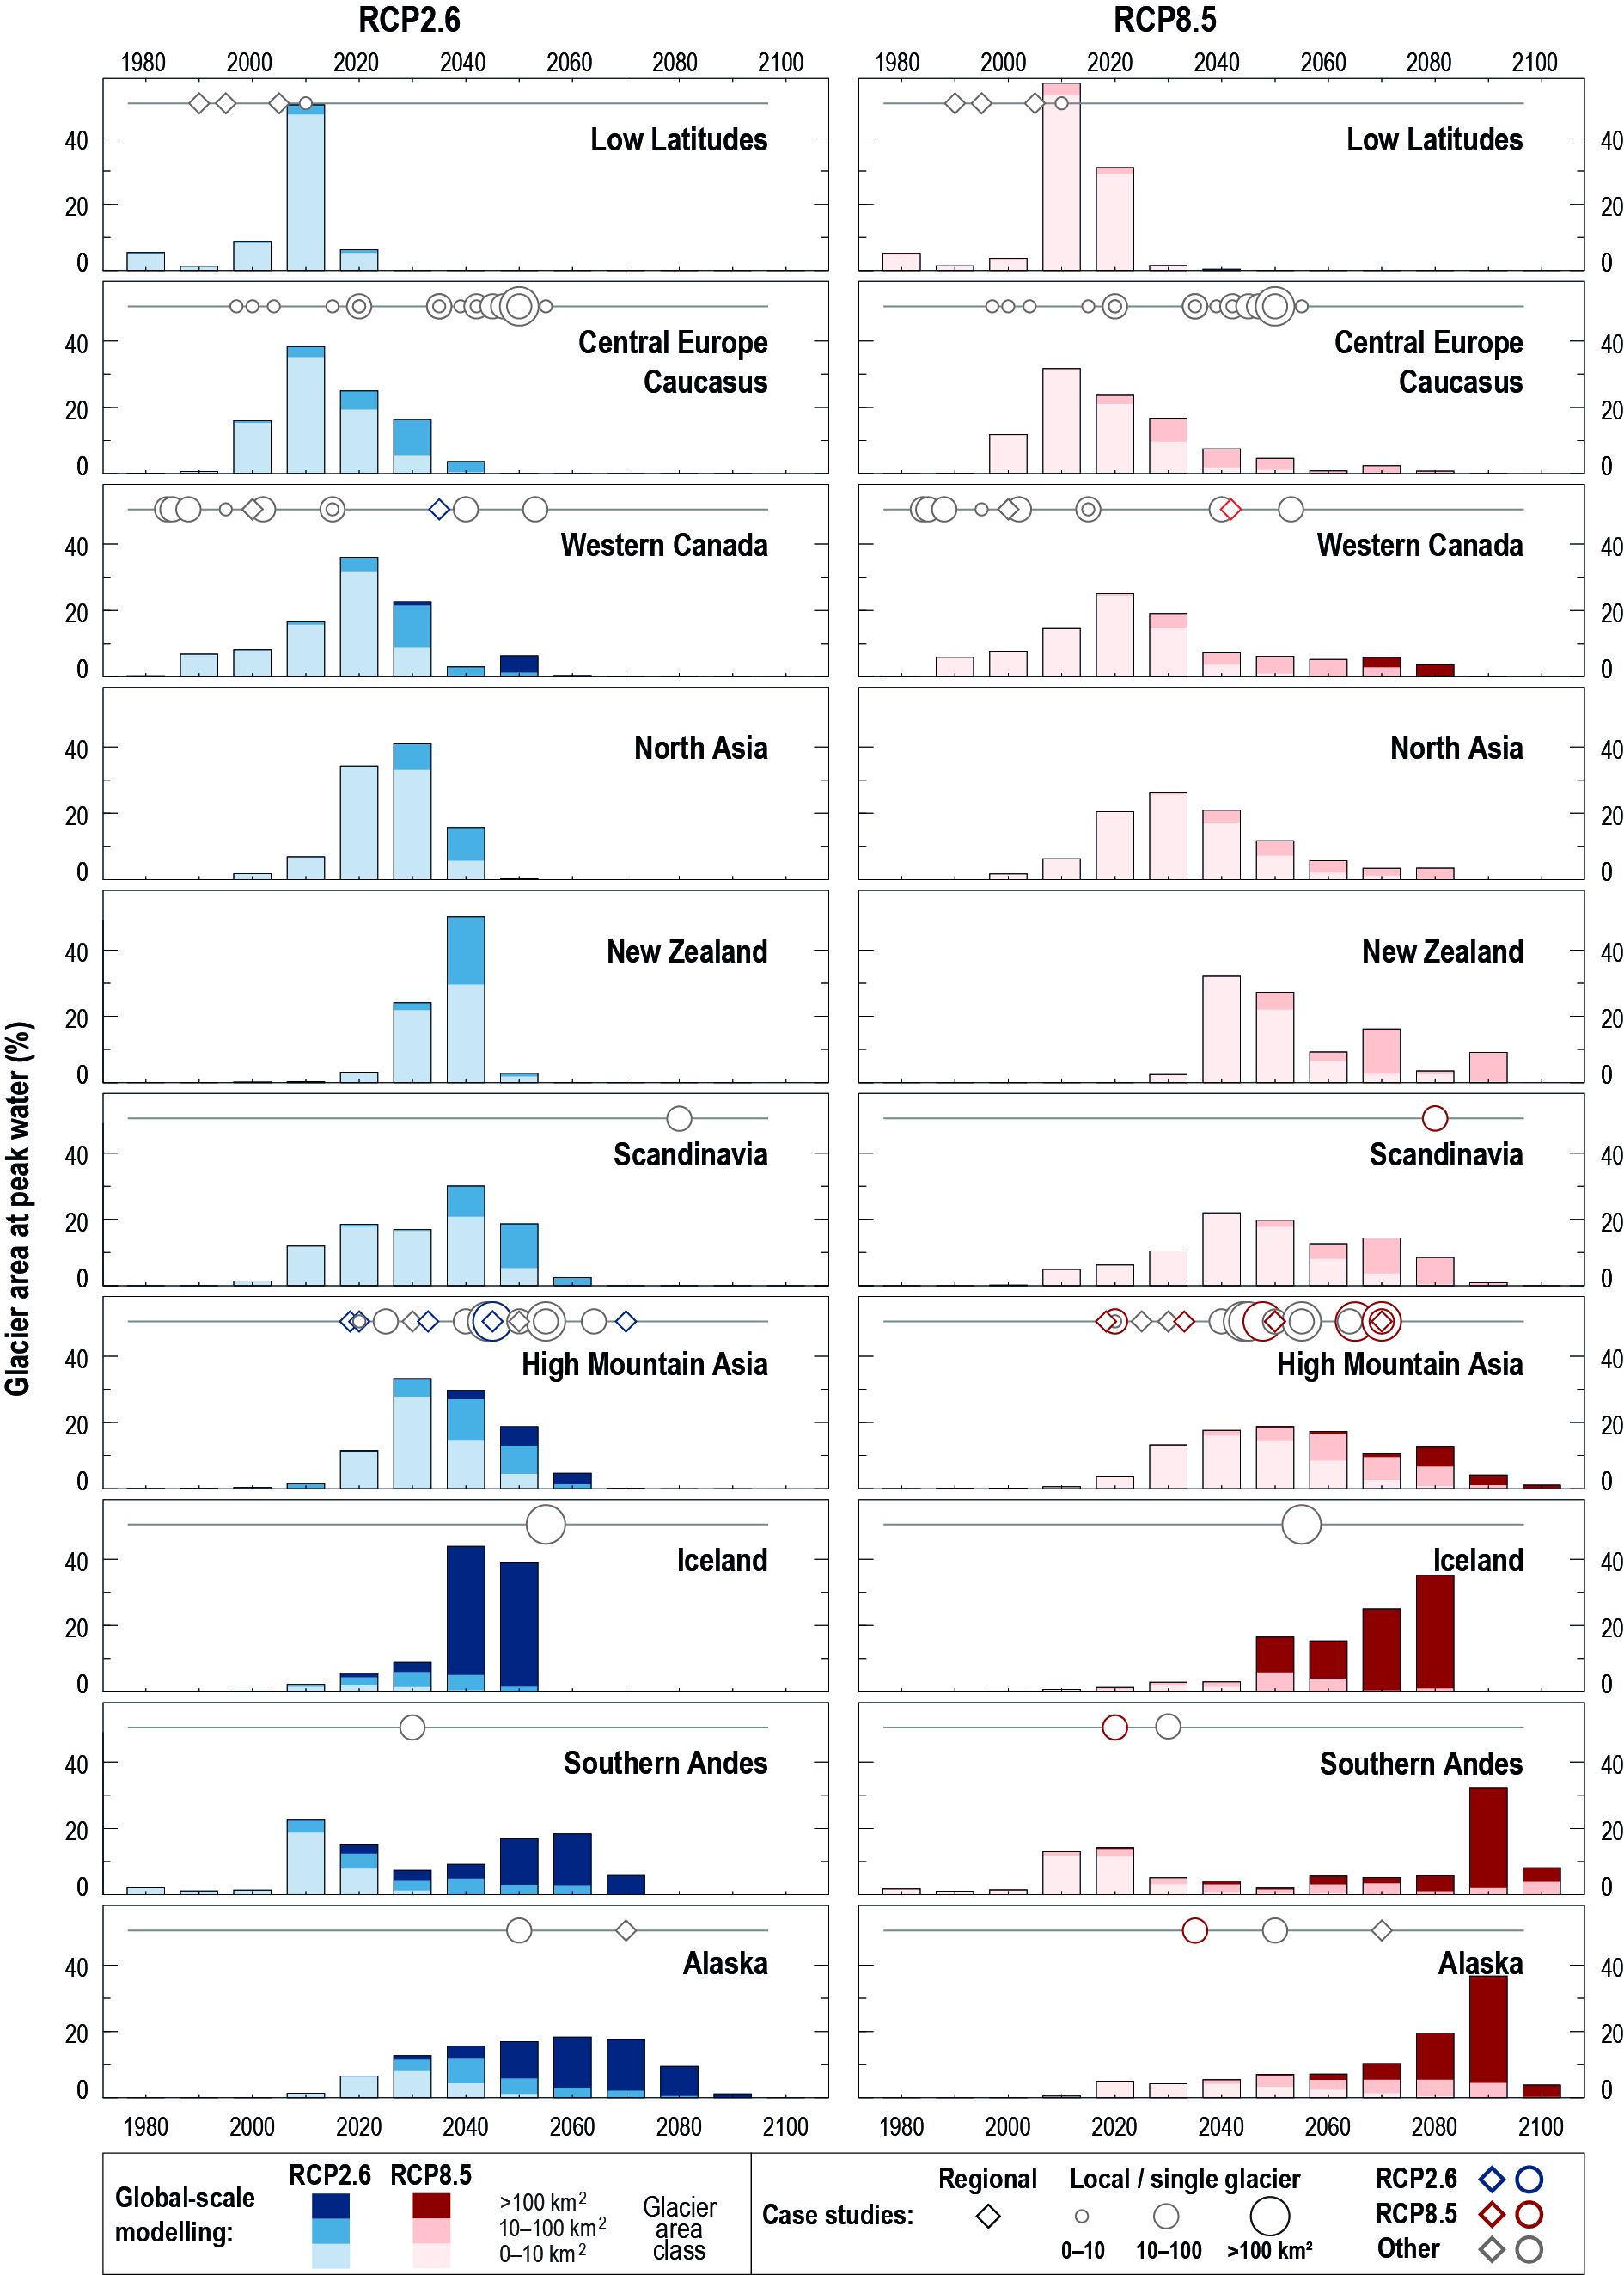
Figure 2.6 | Timing of peak water from glaciers in different regions (Figure 2.1) under two emission scenarios for Representative Concentration Pathways RCP2.6 and RCP8.5. Peak water refers to the year when annual runoff from the initially glacier-covered area will start to decrease due to glacier shrinkage after a period of melt induced increase. The bars are based on Huss and Hock (2018) who used a global glacier model to compute the runoff of all individual glaciers in a region until year 2100 based on 14 General Circulation Models (GCMs). Depicted is the area of all glaciers that fall into the same 10-year peak water interval expressed as a percentage of each region’s total glacier area, i.e., all bars for the same RCP sum up to 100% glacier area. Shadings of the bars distinguish different glacier sizes indicating a tendency for peak water to occur later for larger glaciers. Circles/diamonds mark timing of peak water from individual case studies based on observations or modelling (Table SM2.10). Circles refer to results from individual glaciers regardless of size or a collection of glaciers covering 150 km2 glacier coverage. Case studies based on observations or scenarios other than RCP2.6 and RCP8.5 are shown in both the left and right set of panels.