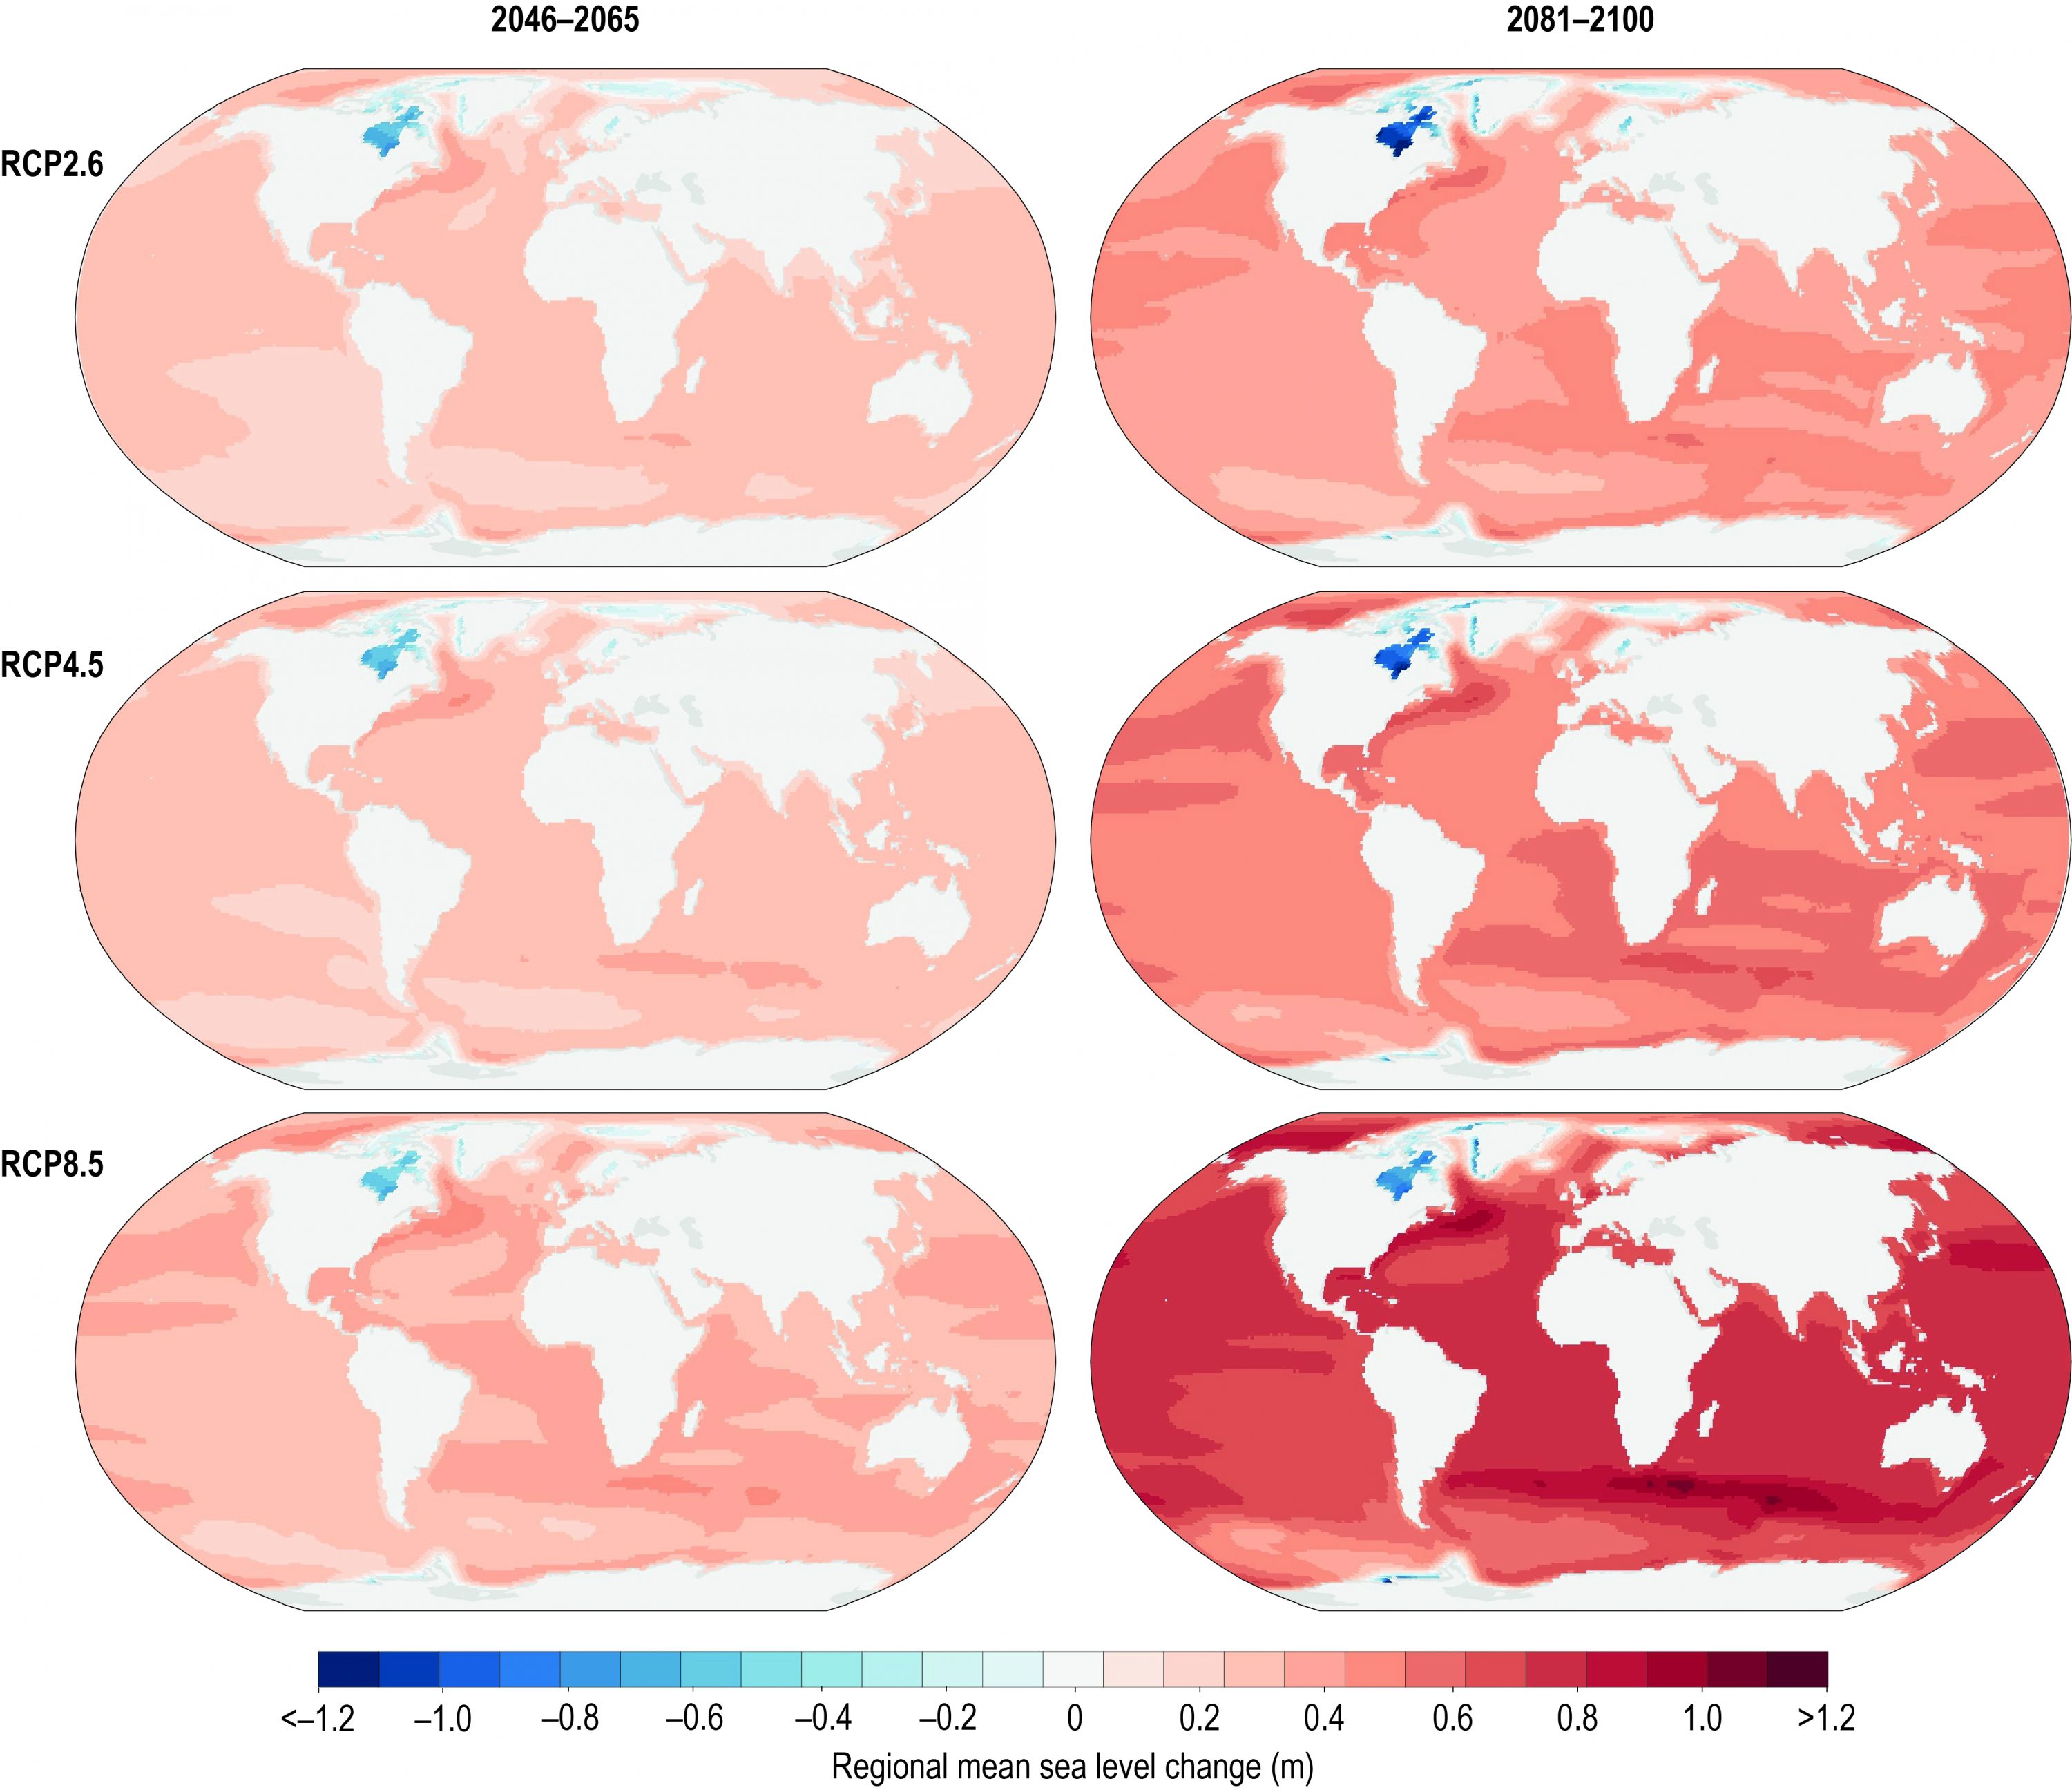
Figure 4.10 | Regional sea level change for RCP2.6, RCP4.5 and RCP8.5 in metres as used in this report for extreme sea level (ESL) events. Results are median values based on the values in Table 4.4 for Antarctica including GIA and the gravitational and rotational effects, and results by Church et al. (2013) for glaciers, land water storage (LWS) and Greenland. The left column is for the time slice 2046–2065 and the right column for 2081–2100.