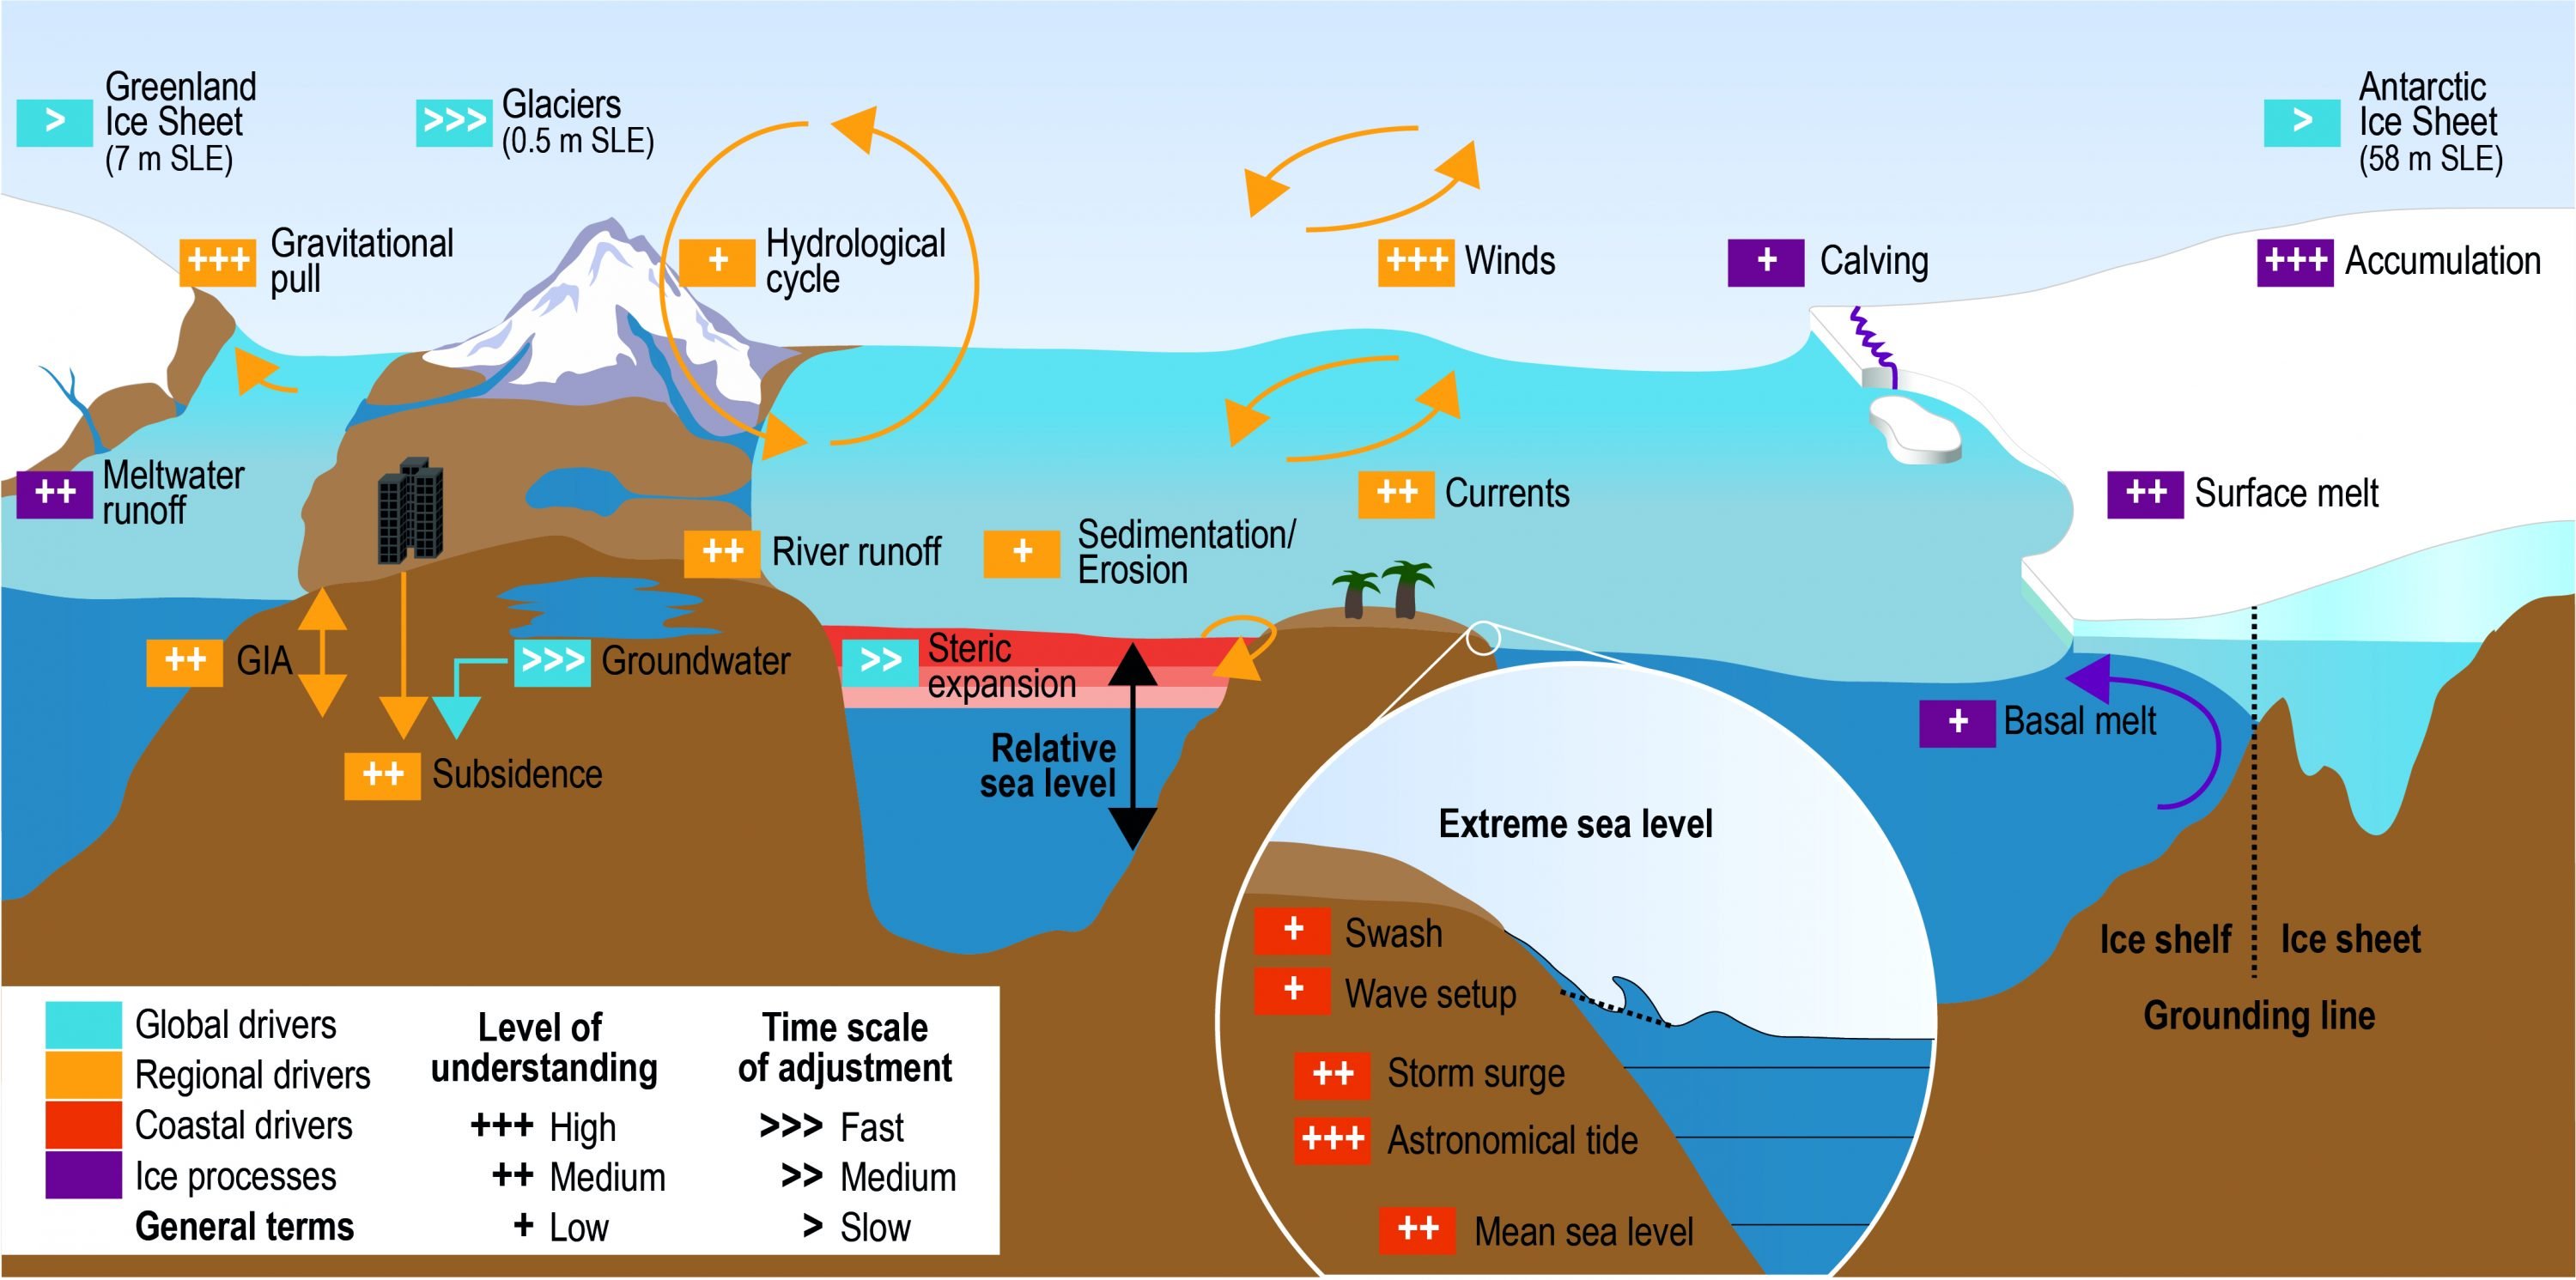
Figure 4.4 | A schematic illustration of the climate and non-climate driven processes that can influence global, regional (green colours), relative and extreme sea level (ESL) events (red colours) along coasts. Major ice processes are shown in purple and general terms in black. SLE stands for Sea Level Equivalent and reflects the increase in GMSL if the mentioned ice mass is melted completely and added to the ocean.