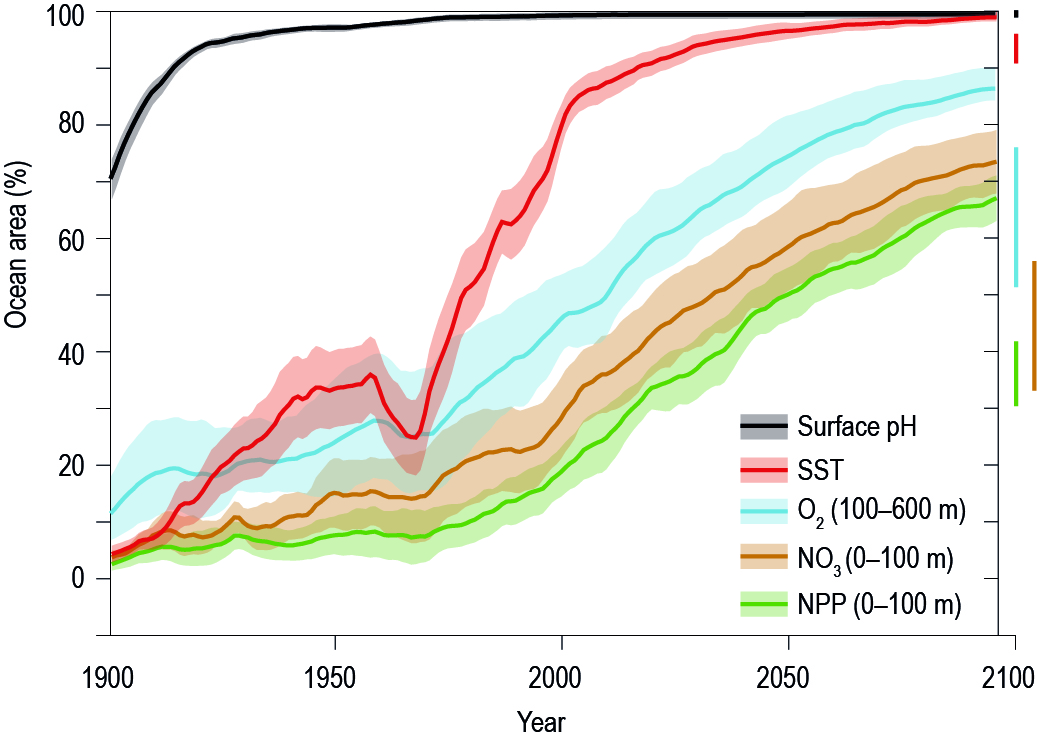
Box 5.1, Figure 1 | Time of emergence of key ocean condition variables: sea surface temperature (SST), surface pH, 100–600 m oxygen (O2), 0–100 m nitrate (NO3), and 0–100 m integrated net primary production (NPP). The year of emergence represents the year when the mean change relative to the reference period of 1861–1900 is above the standard deviation of each variable over the historical period (Frölicher et al. 2016) and is expressed here in terms of the rate at which different climate signals emerge as a proportion of total ocean area for the Representative Concentration Pathway (RCP)8.5 scenario. The final area (and standard deviation) by 2100 under the RCP2.6 scenario is indicated by vertical lines at 2100.