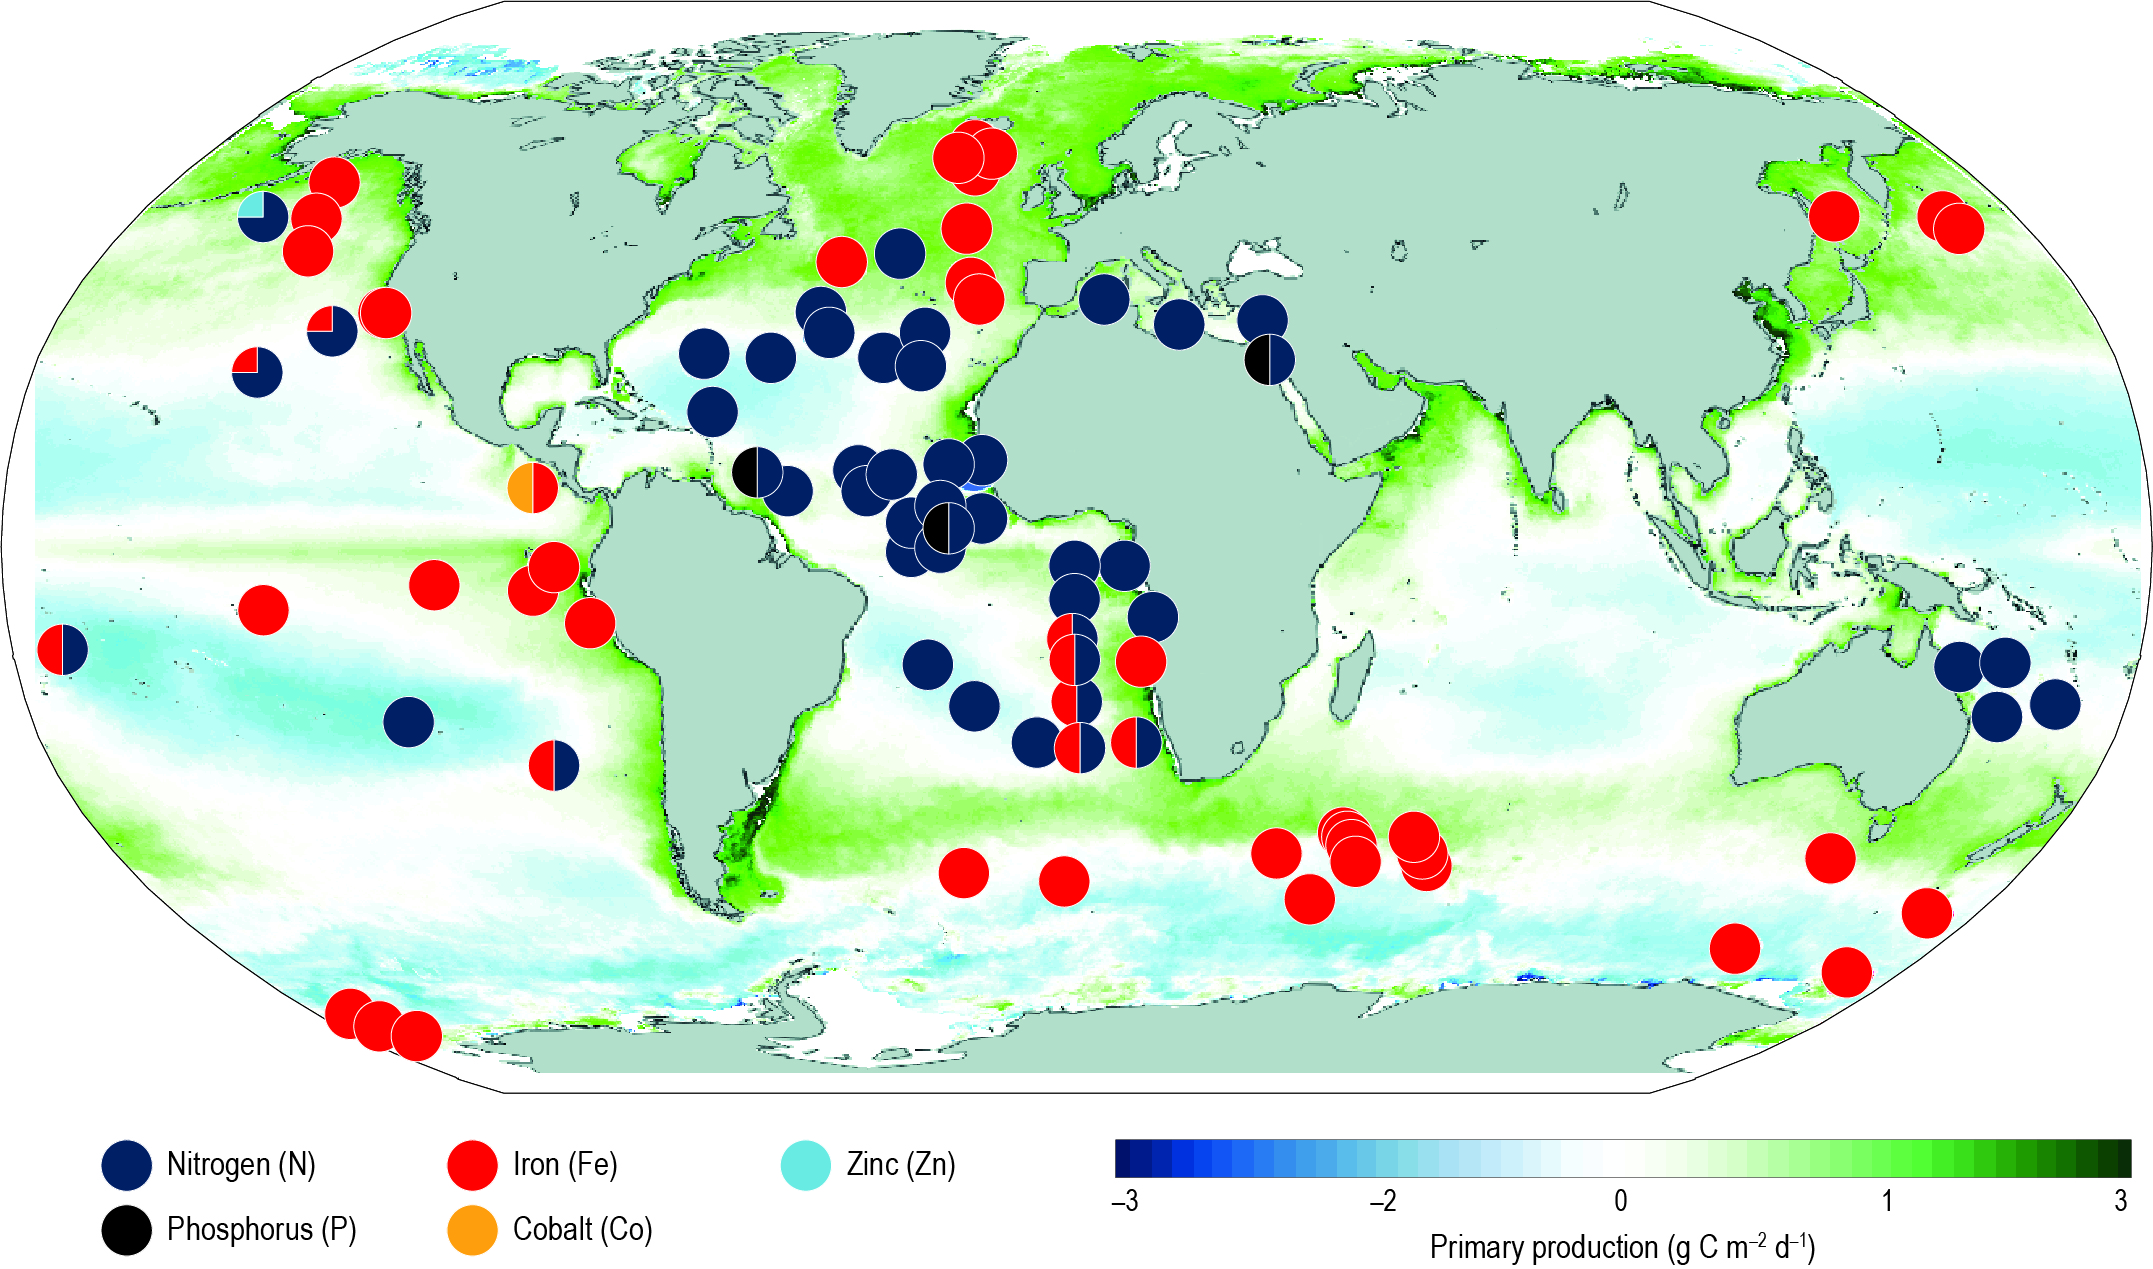
Figure 5.11 | Map of the dominant limiting resource (Moore et al. 2013), updated to include new experiments from the north Pacific, tropical Atlantic and south east Atlantic (Browning et al. 2017; Shilova et al. 2017). The background is depth integrated primary productivity using the Vertically Generalized Production Model algorithm. Colouring of the circles indicates the primary limiting nutrients inferred from chlorophyll and/or primary productivity increases following artificial amendment of: N (blue), P (black), Fe (red), Co (yellow) and Zn (cyan). Divided circles indicate potentially co-limiting nutrients, for example, a red-blue divided circle indicates Fe-N co-limitation.