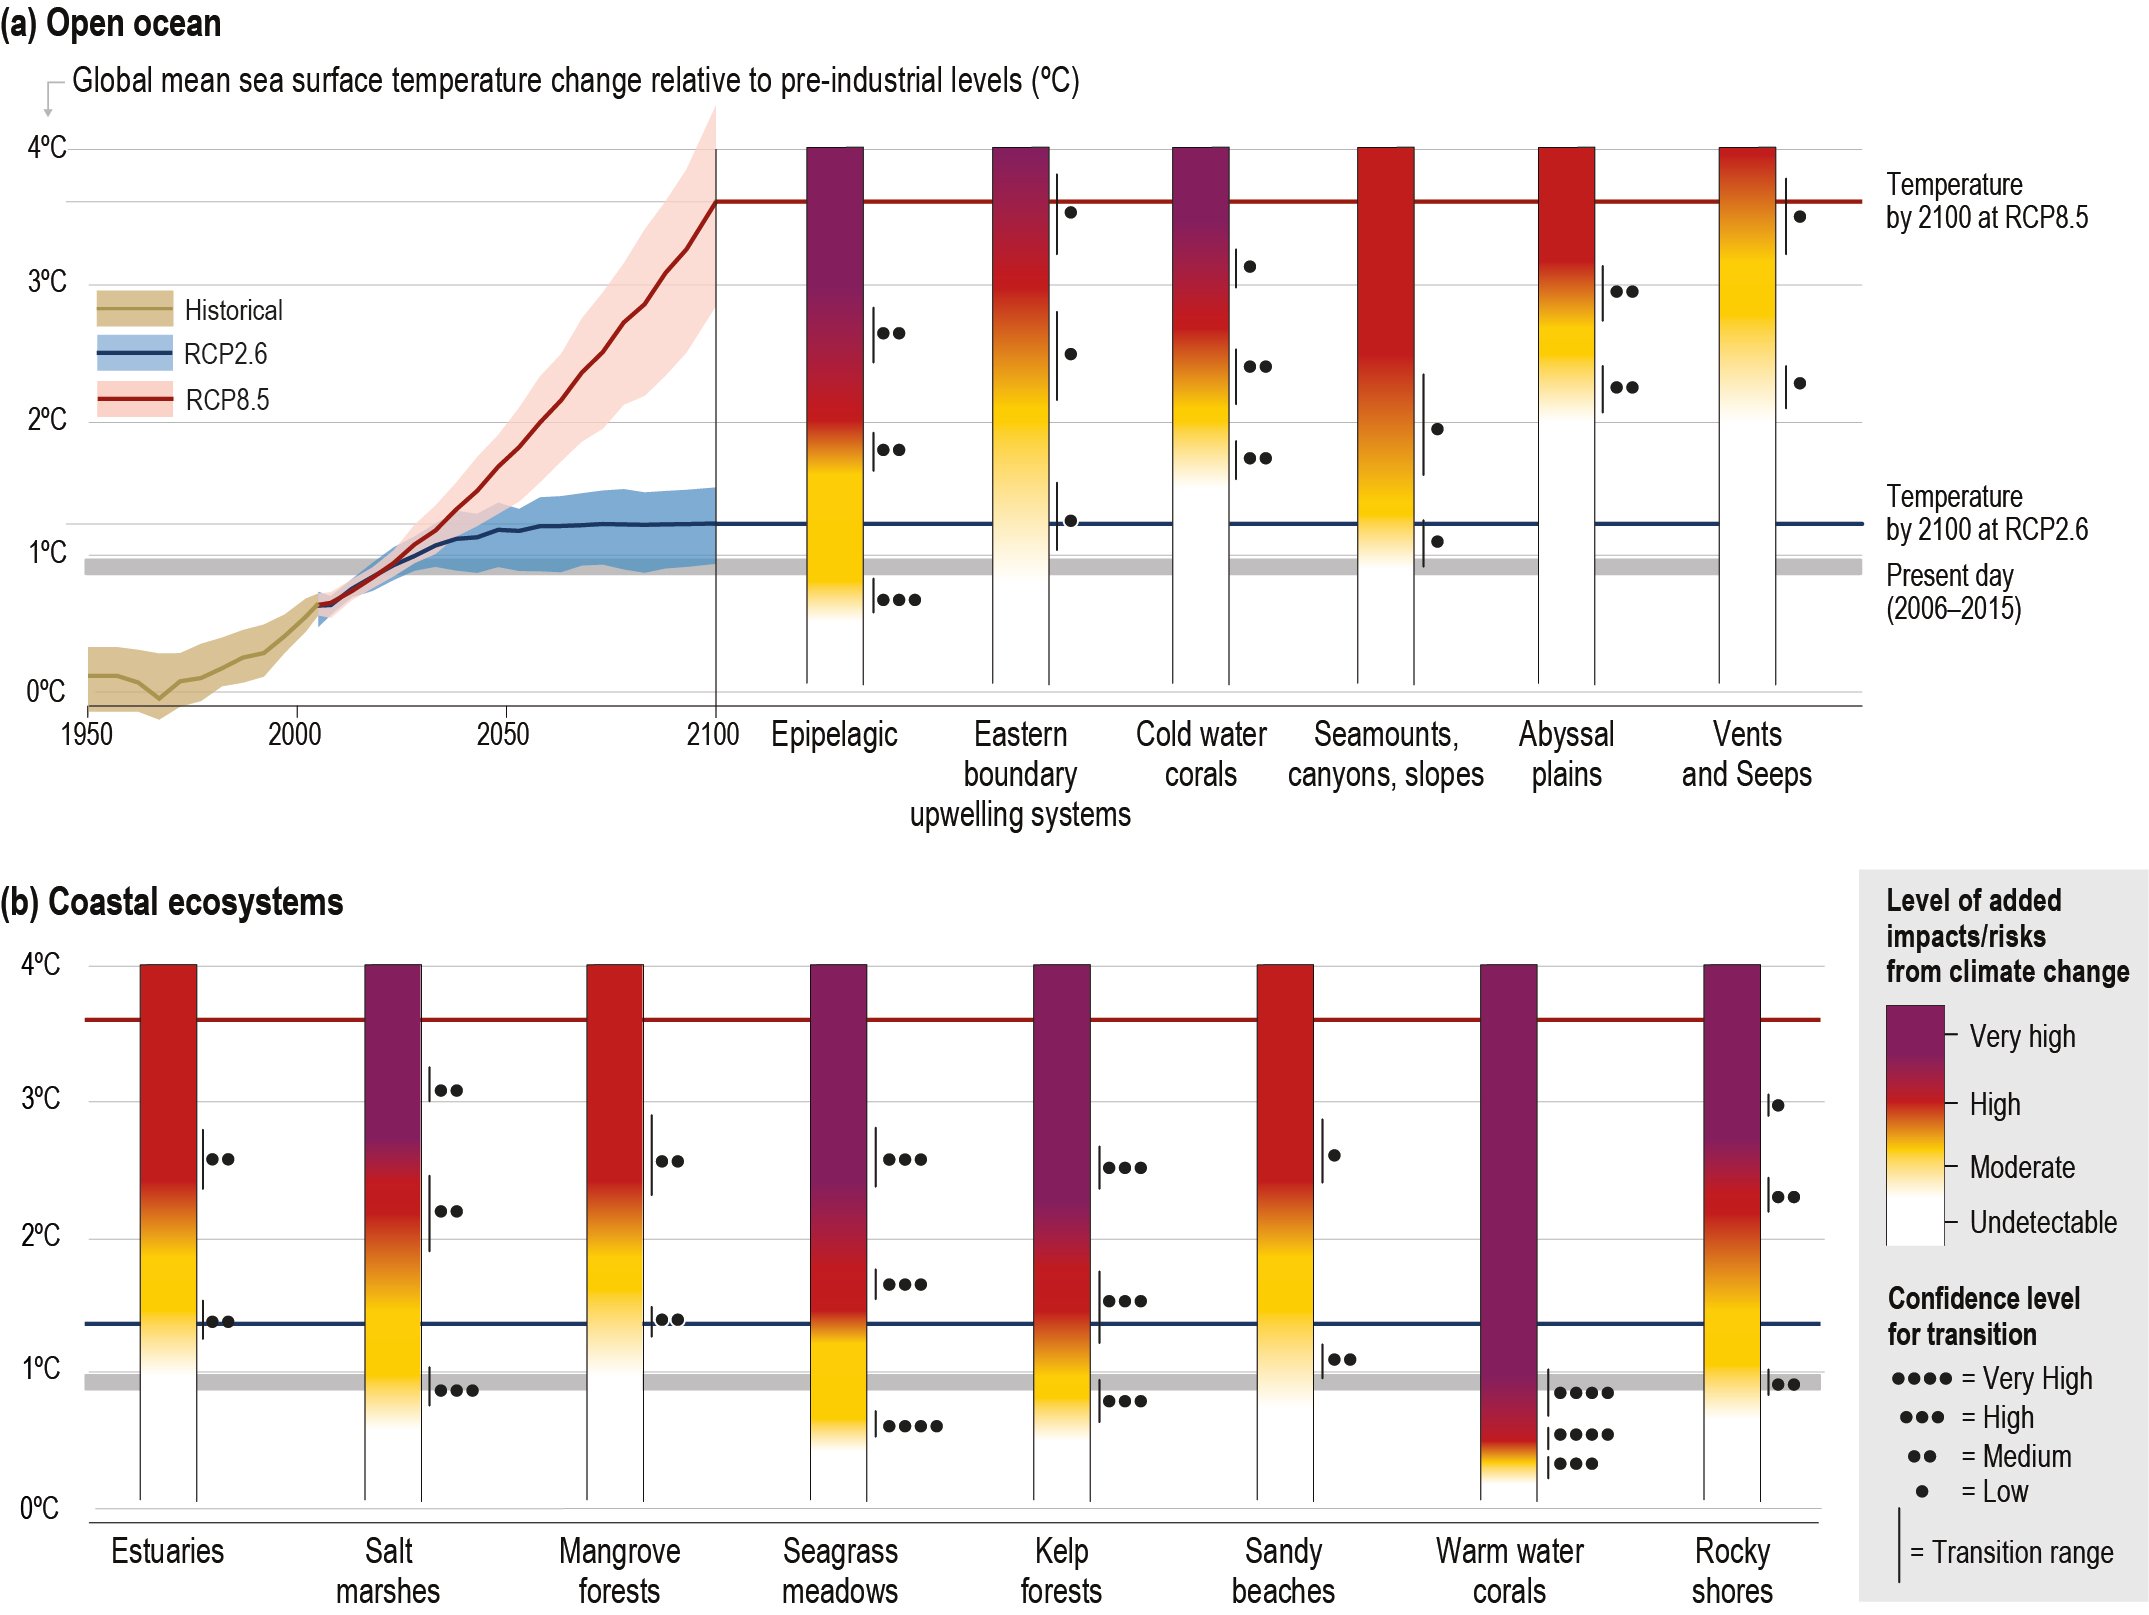
Figure 5.16
Figure 5.16 | Risk scenarios for open ocean (upper panel) and coastal (lower panel) ecosystems based on observed and projected climate impacts. ‘Present day’ corresponds to the 2000s, whereas the different greenhouse emissions scenarios: Representative Concentration Pathway (RCP)2.6 and RCP8.5 correspond to year 2100. Multiple climatic hazards are considered, including ocean warming, deoxygenation, acidification, changes in nutrients, particulate organic carbon flux and sea level rise (SLR) (see sections 5.2 and 5.3). The projected changes in sea surface temperature (SST) from an ensemble of general circulation models (left panels) indicate the level of ocean changes under RCP2.6 and RCP8.5 (see Cross Chapter Box 1 Table CB1 for the projected global average changes in average air temperature, SST and other selected ocean variables). Global average impacts/risks are represented. Regional variations of risks/impacts are described in Section 5.2.5, 5.3.7, SM5.2 and SM5.5. Impact/risk levels do not consider human risk reduction strategies such as societal adaptation, or future changes in non-climatic hazards. The grey vertical bars indicate the transition between the levels of risks, with their confidence level based on expert judgment. Note: The figure depicts climate change impacts and risks on warm water corals taken from SR15, based on global models. Observed impacts on coral reefs ecosystems outlined in Section 5.3.4 and Box 5.5 reveal a more complex situation that may result in regional differences in confidence levels.