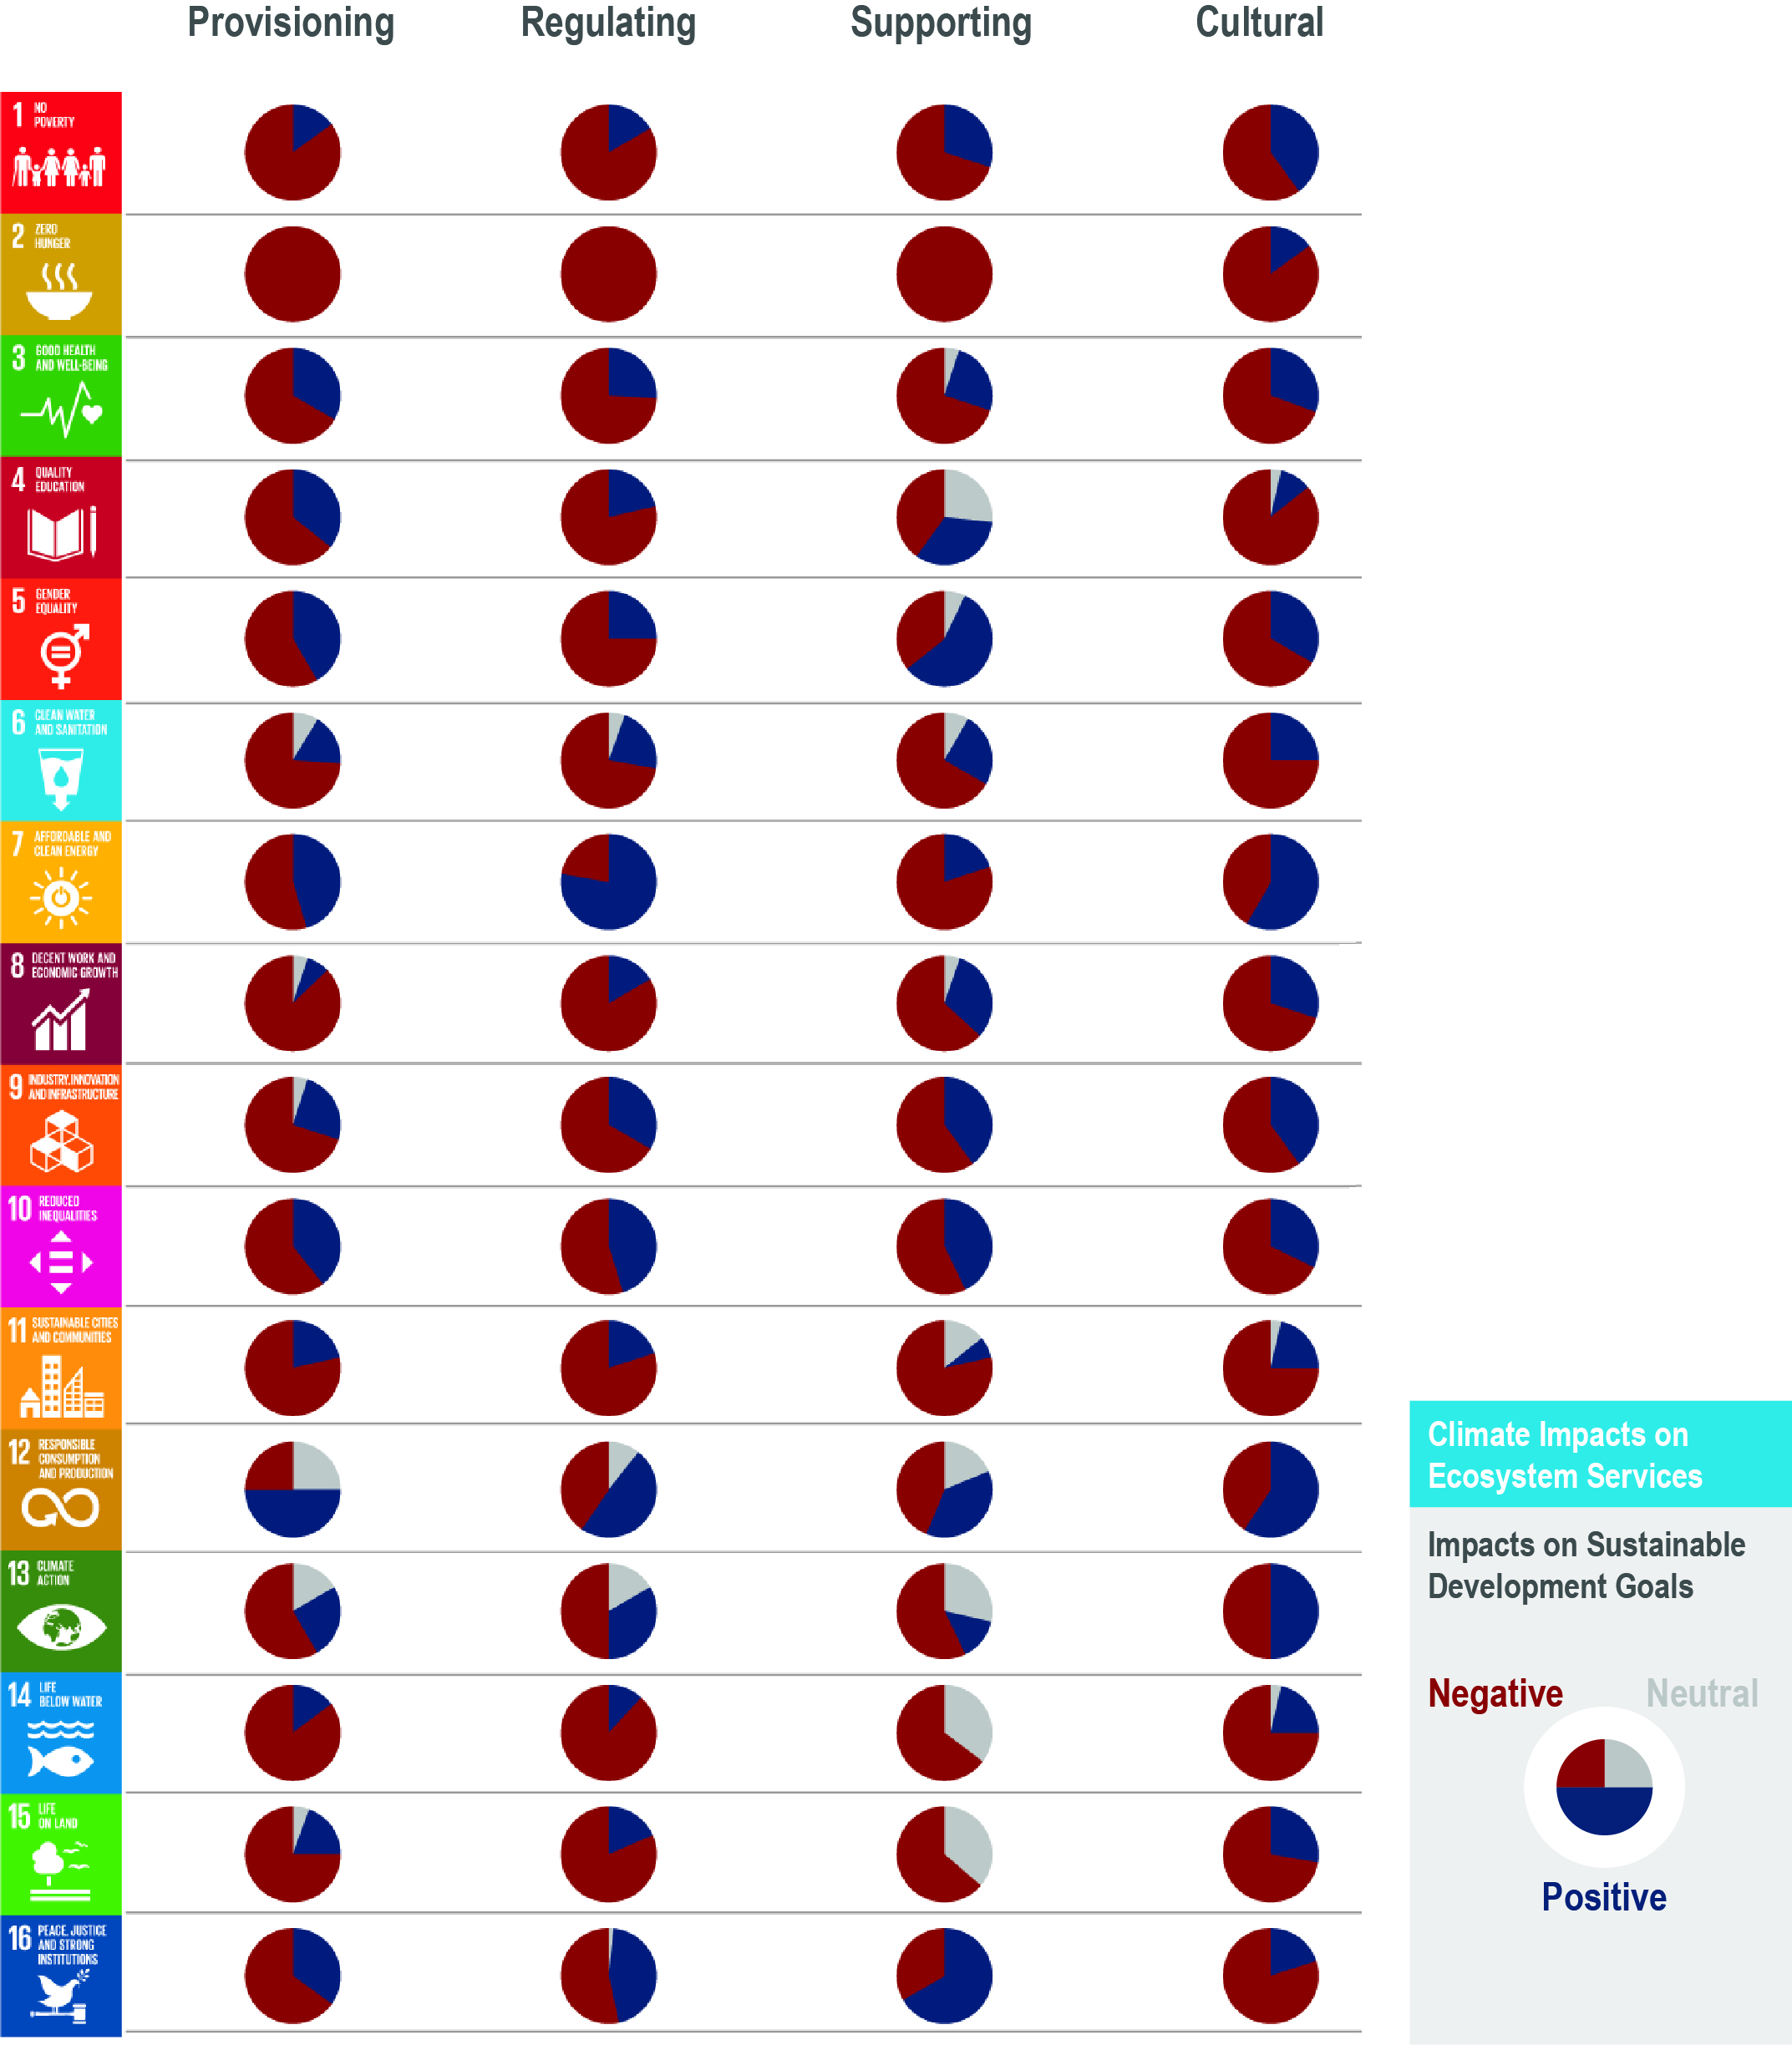
Figure 5.22 | Summary of the types of relationships (negative, neutral and positive) between impacted marine ecosystem services (Provisioning, Regulating, Supporting and Cultural) and the Sustainable Development Goals (SDGs) based on literature review and expert-based analysis (Singh et al. 2019). Pie charts represent the proportion of targets within SDGs that a particular ocean SDG target contributes to according to the literature reviewed and expert-based analysis presented in Singh et al. (2019).