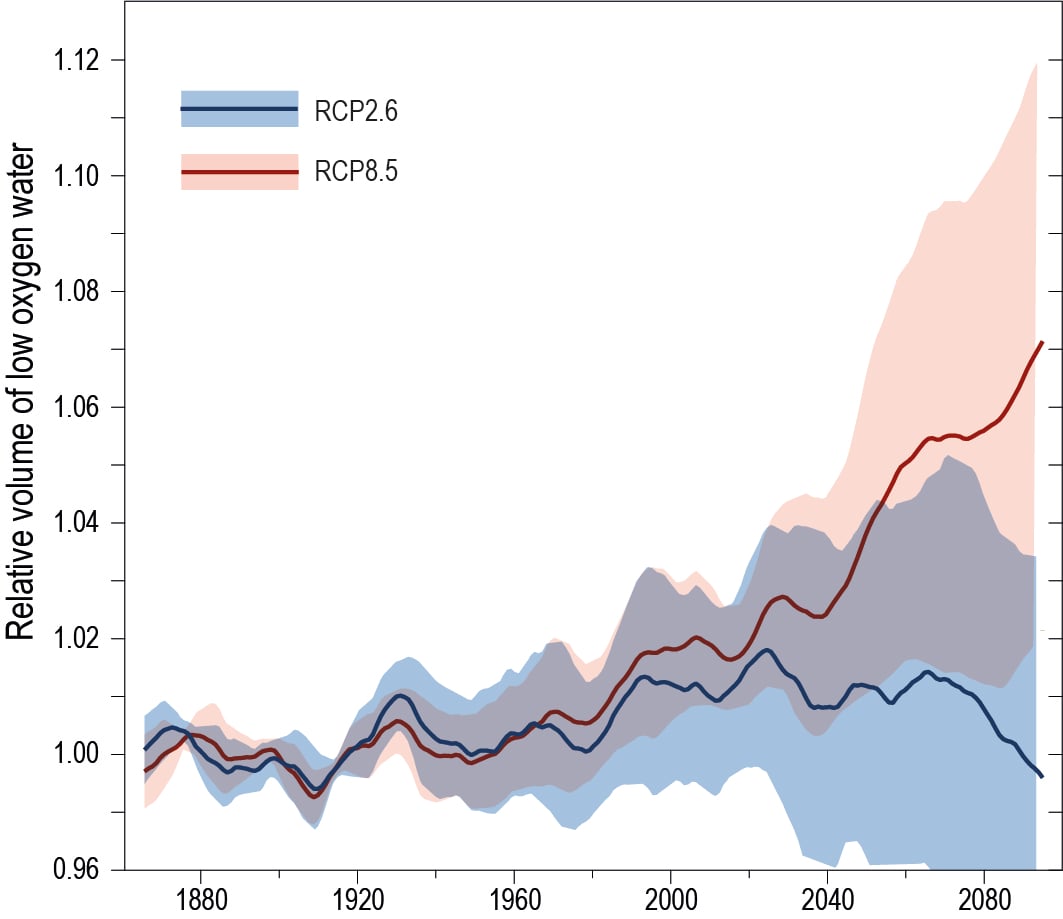
Figure 5.10 | The evolution of the volume of the 100–600 m layer of the ocean with oxygen concentrations less than 80 mmol L–1 for the RCP8.5 (red line) and the RCP2.6 (blue line), normalised to the volume in 1850–1900. Dashed lines indicated the very likely range (90% confidence intervals) across the CMIP5 models (CNRM-CM5, GFDL-ESM2M, GFDL-ESM2G, IPSL-CM5A-LR, IPSL-CM5A-MR, MPI-ESM-LR, MPI-ESM-MR and the NCAR-CESM1 models). Models are corrected for drift in O2 using their control simulations.