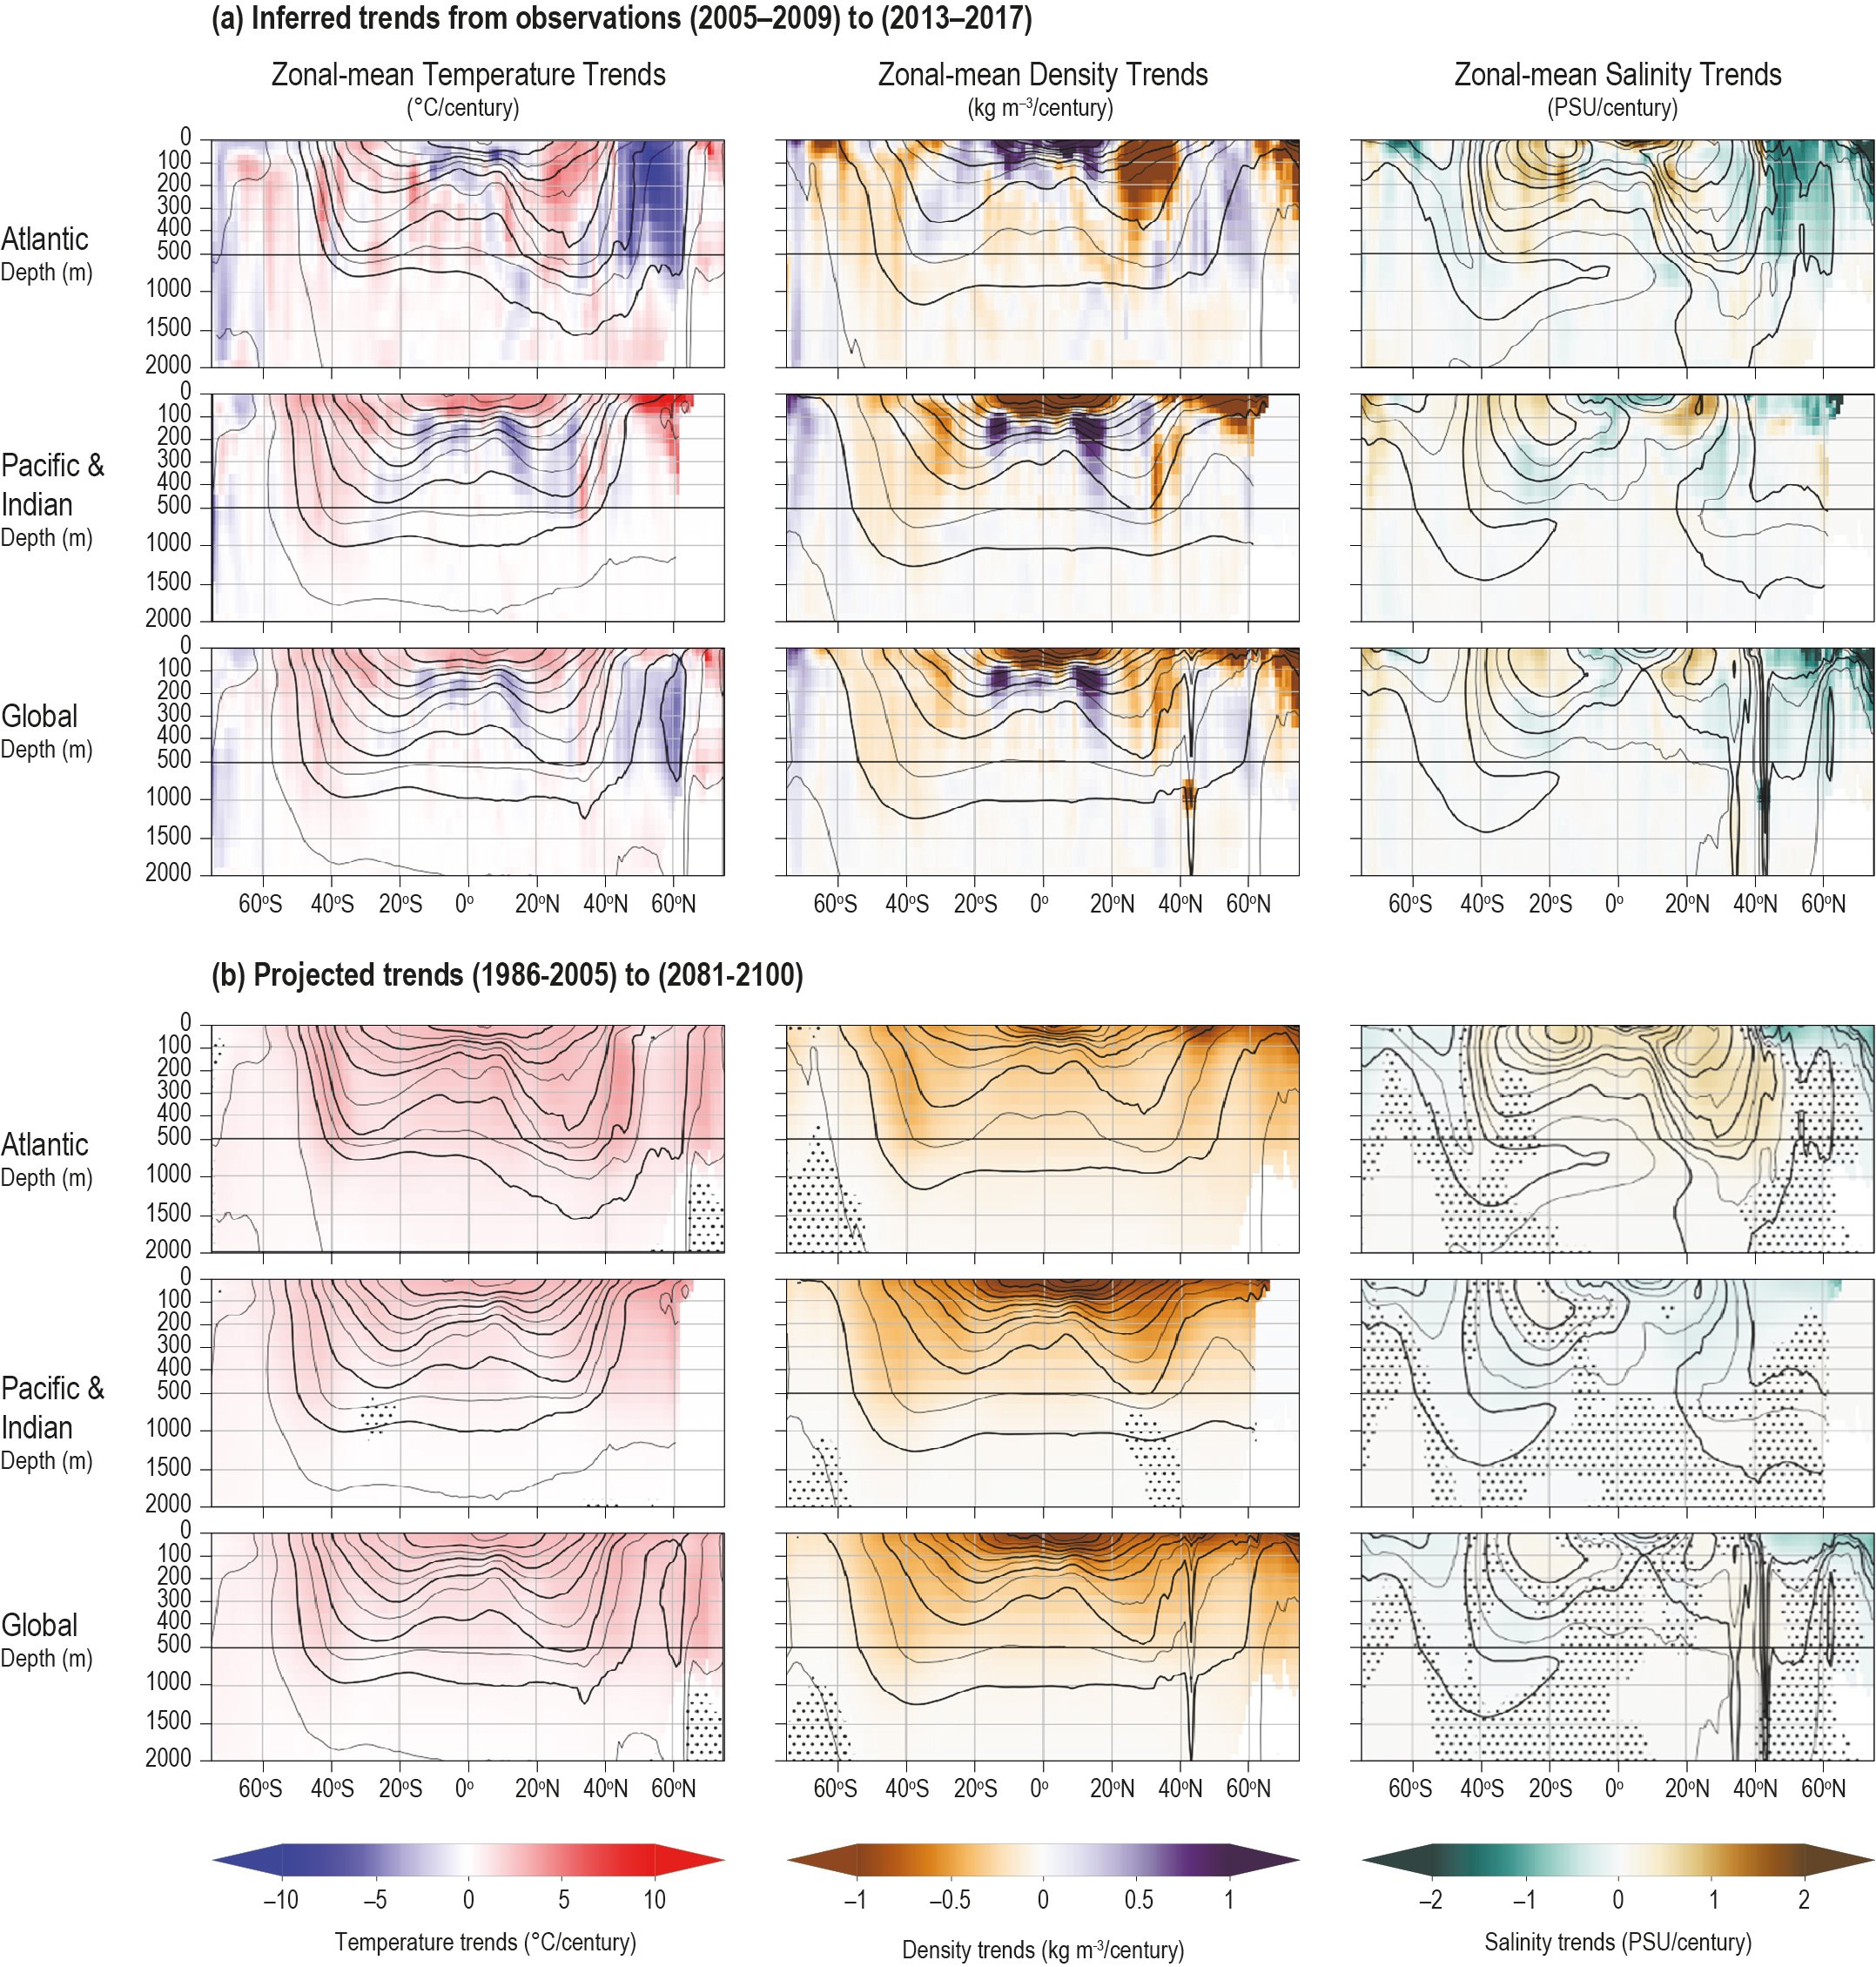
Figure 5.3
Figure 5.3 | Side-view basin-averaged zonal-mean trends (change per century) in water-mass properties in the top 2000 m by basin (a) as inferred from observations (average of 2013–2017 minus average of 2005–2009) and (b) Coupled Model Intercomparison Project Phase 5 (CMIP5) model projections with Representative Concentration Pathway (RCP)8.5 forcing (average of 2081–2100 minus average of 1981–2000) trends in water-mass changes forcing. Subpanels within each group: top-to-bottom (Atlantic, combined Pacific and Indian, Global); left-to-right (Temperature, in situ Density, Salinity). Shaded areas show where the projected changes are not statistically significant at the 95% level. This figure uses the same observationally-derived reanalysis datasets and ensemble of Earth System Models (ESMs) as in Figure 5.2c and 5.2d. Solid lines show present contours of these fields; the notable structure in the northern hemisphere of the global-zonal mean contours of density and salinity are due to the relatively salty Mediterranean and fresh Black seas.