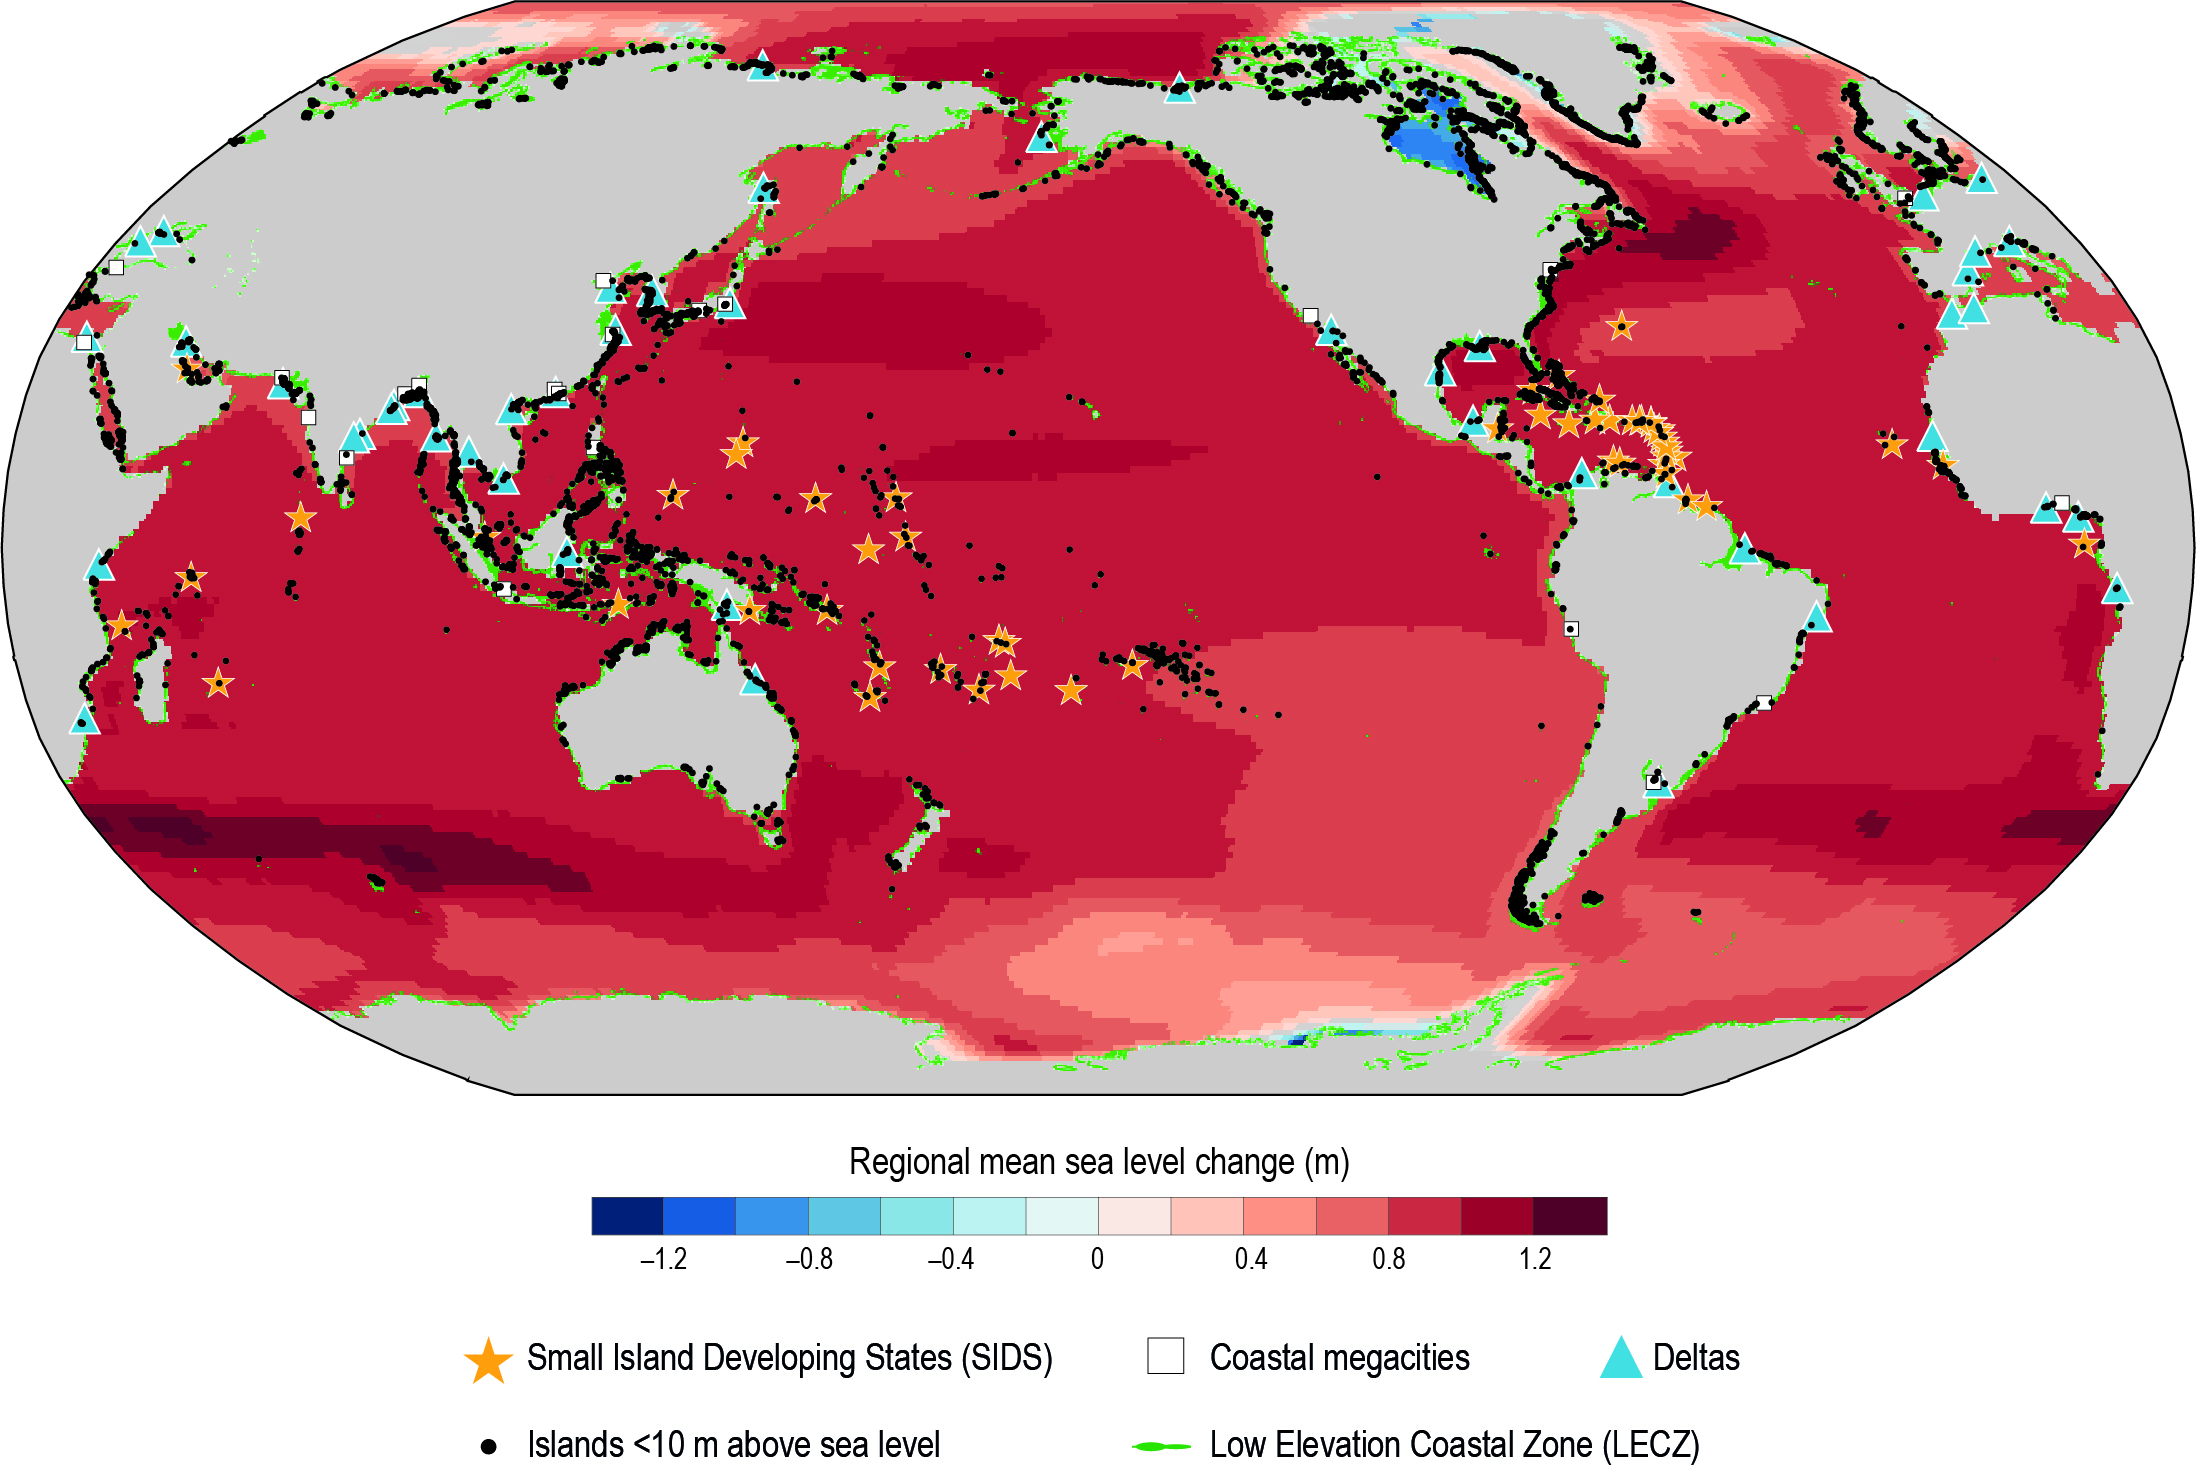
Figure CB9.1 | The global distribution of low-lying islands and coasts (LLIC) particularly at risk from sea level rise This map considers the Low Elevation Coastal Zone (elevation data from National Geophysical Data Center, 1999; LECZ, defined by McGranahan et al., 2007), islands with a maximum elevation of 10 m above sea level (Weigelt et al., 2013), Small Island Developing States (SIDS; UN-OHRLLS, n.d.), coastal megacities (cities with more than 10 million inhabitants, within 100 km from coast, and maximum 50 m above sea level; Pelling and Blackburn, 2013; UN-DESA, 2018) and deltas (Tessler et al., 2015). Regional sea level changes refer to projections under Representative Concentration Pathway(RCP)8.5 (2081–2100) (see Figure 4.8).