Errata Figure 3.3
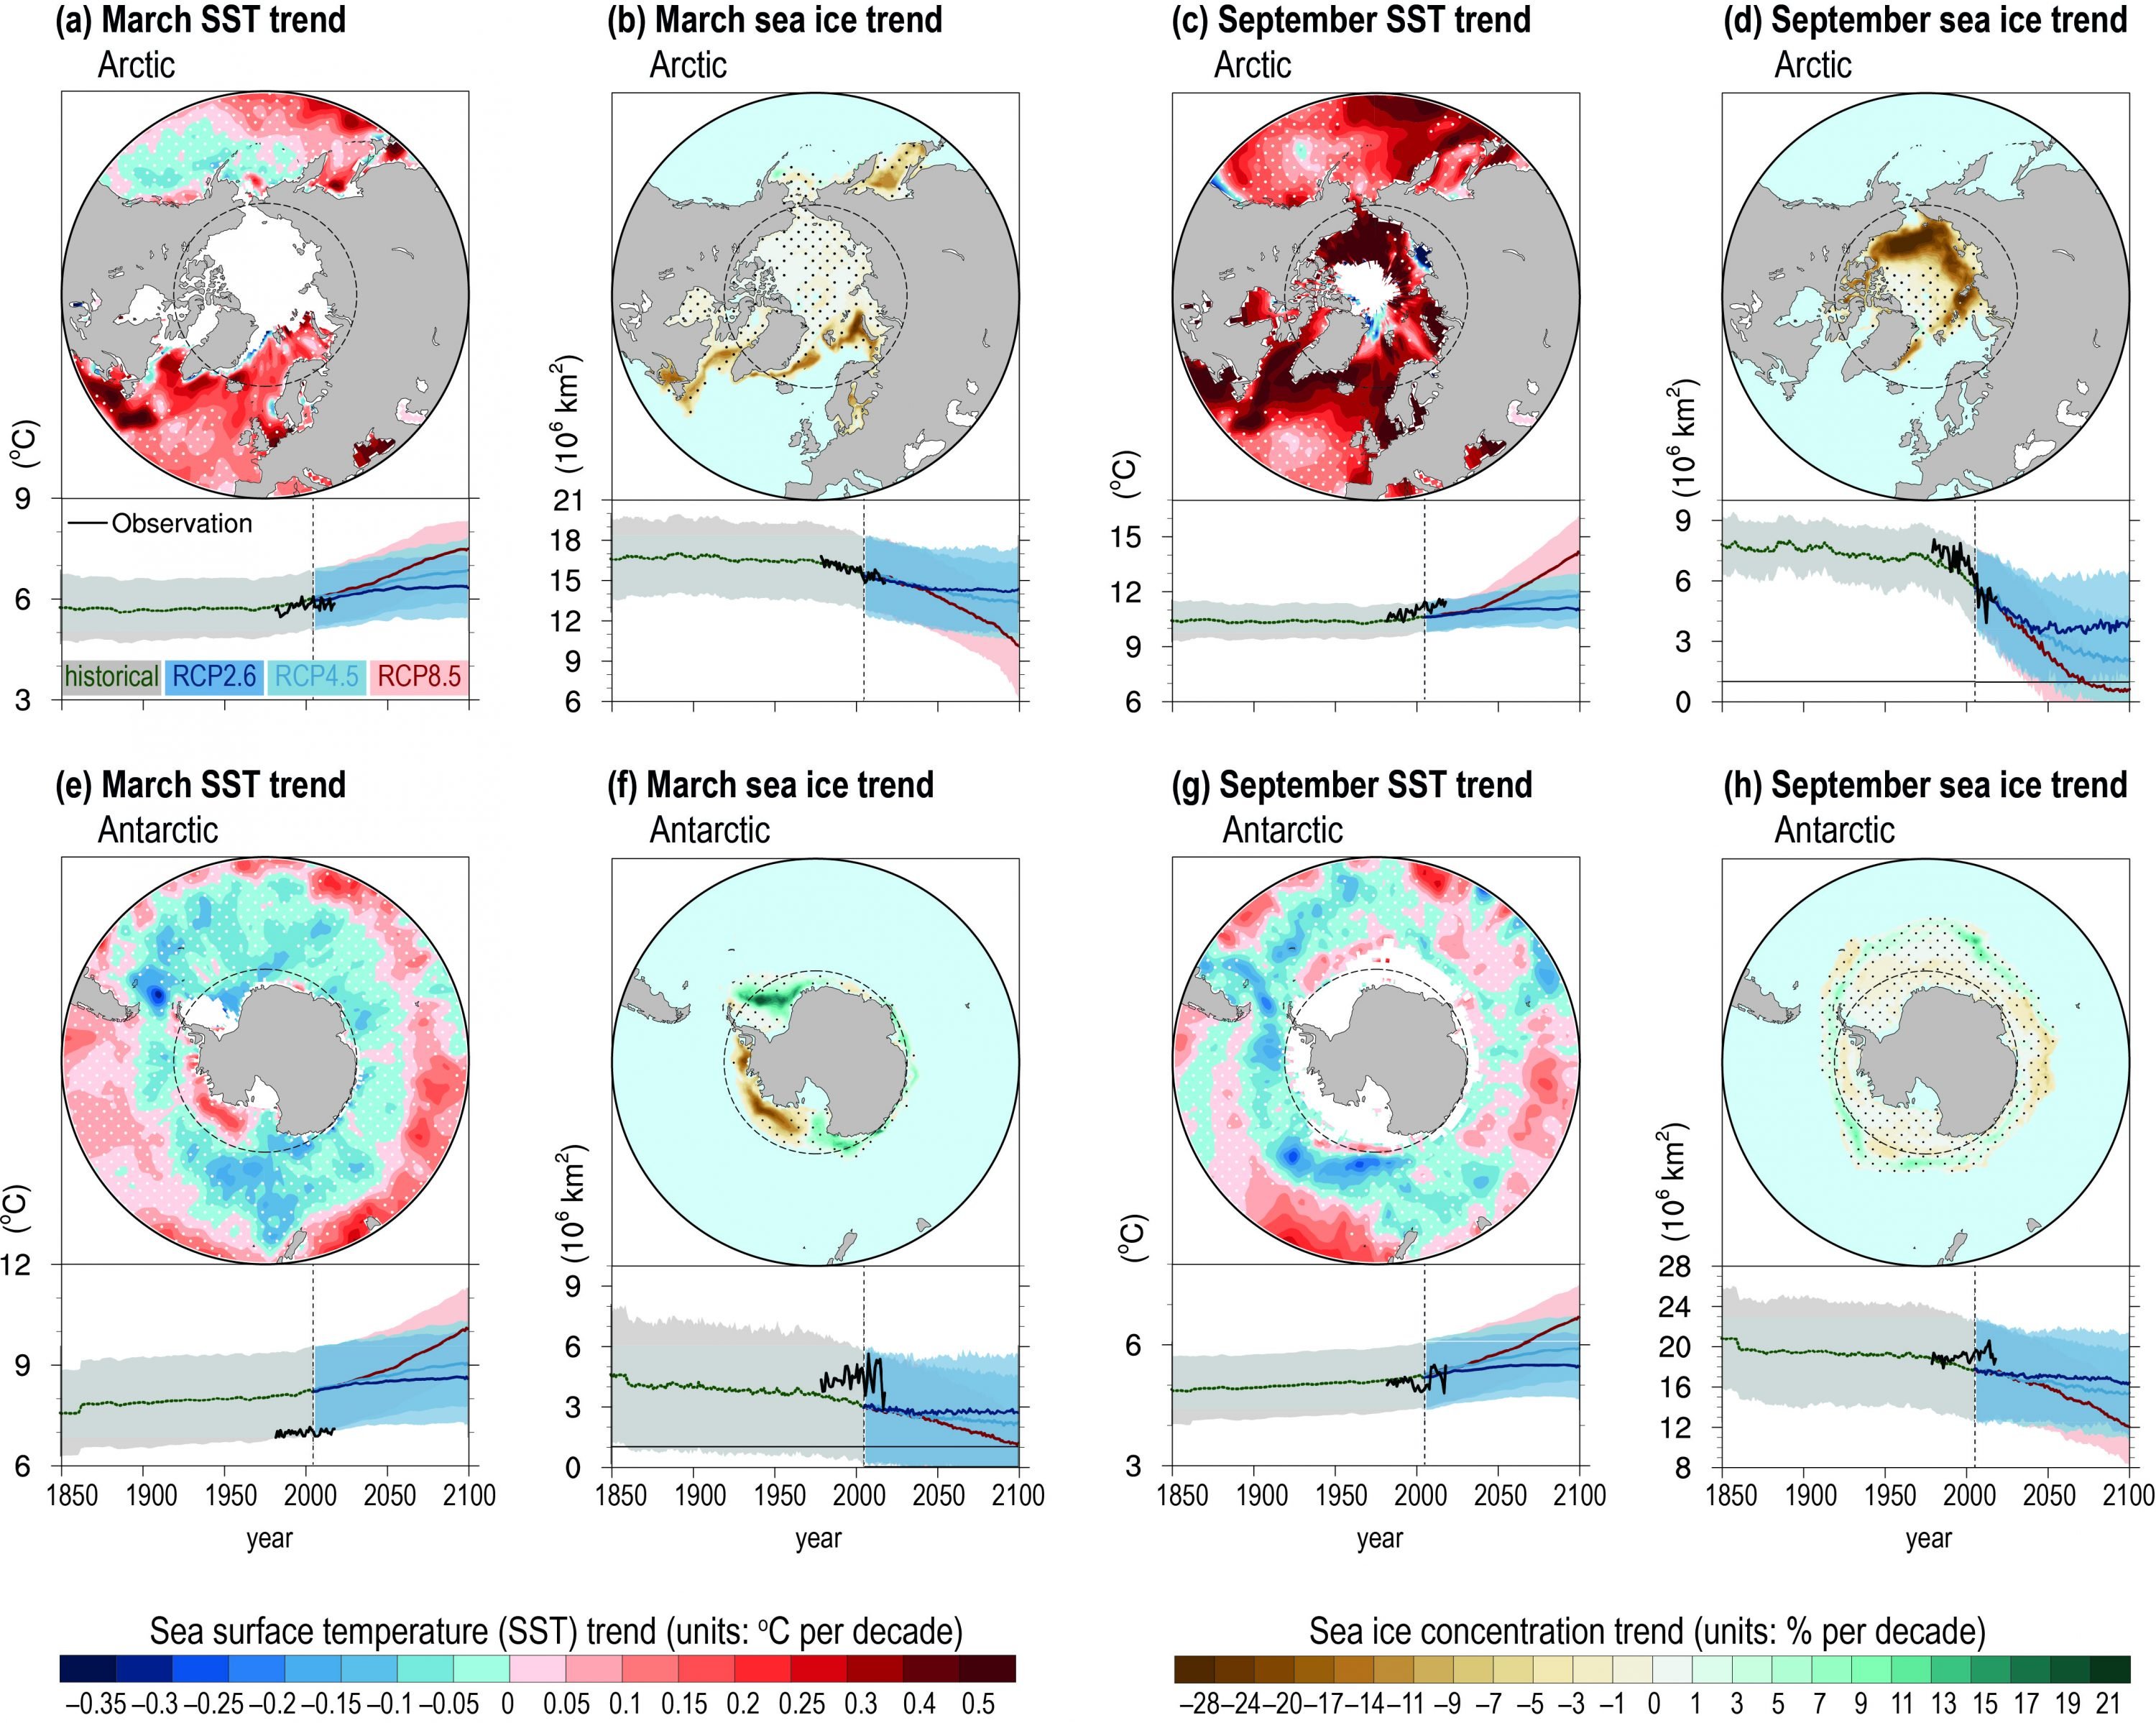
Maps of linear trends (in oC per decade) of Arctic (a, c) and Antarctic (e, g) sea surface temperature (SST) for 1982−2017 in March (a, e) and September (c, g). (b, d, f, h) same as (a, c, e, g), but for the linear trends of sea ice concentration (in % per decade). Stippled regions indicate the trends that are statistically insignificant. Dashed circles indicate the Arctic/Antarctic Circle. Beneath each map of linear trend shows the time series of SST (area-averaged north of 40oN/south of 40oS) or sea ice extent in the northern/southern hemisphere. Black, green, blue, orange, and red curves indicate observations, Coupled Model Intercomparison Project Phase 5 (CMIP5) historical simulation, Representative Concentration Pathway (RCP)2.6, RCP4.5, and RCP8.5 projections respectively; shading indicates ± standard deviation of multi-models. SST trend was calculated from Hadley Centre Sea Ice and Sea Surface Temperature data set (Version 1, HadISST1; Rayner, 2003). Sea ice concentration trend was calculated from the NOAA/NSIDC Climate Data Record of Passive Microwave Sea Ice Concentration, Version 3 (https://nsidc.org/data/g02202). The time series of observed SST are averages of HadISST1 and NOAA Optimum Interpolation SST dataset (version 2; Reynolds et al., 2002). The time series of observed sea ice extent are the averages of HadISST, the NOAA/NSIDC Climate Data Record of Passive Microwave Sea Ice Concentration, and the Global sea ice concentration reprocessing dataset from EUMETSAT (http://osisaf.met.no/p/ice/ice_conc_reprocessed.html).