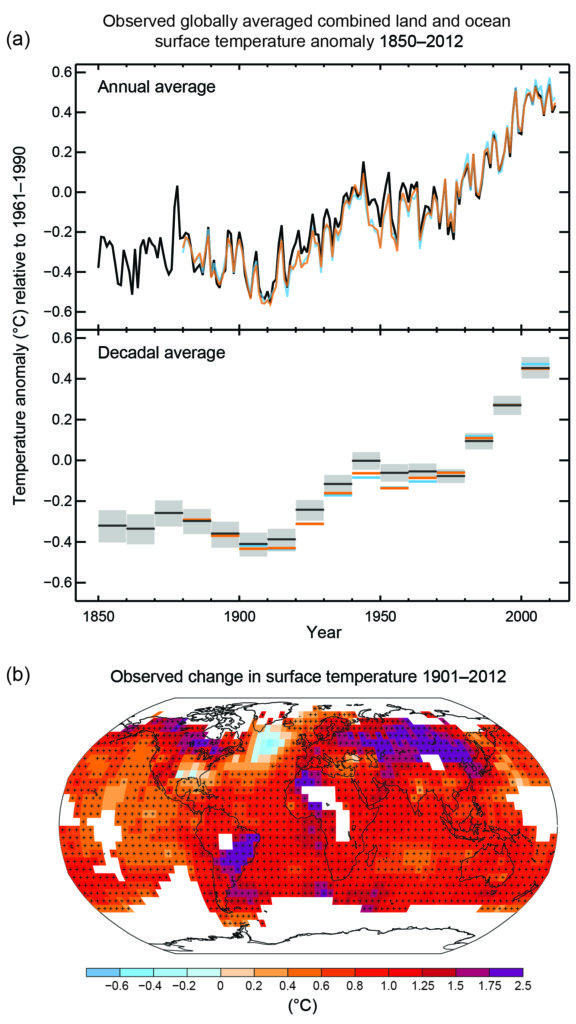
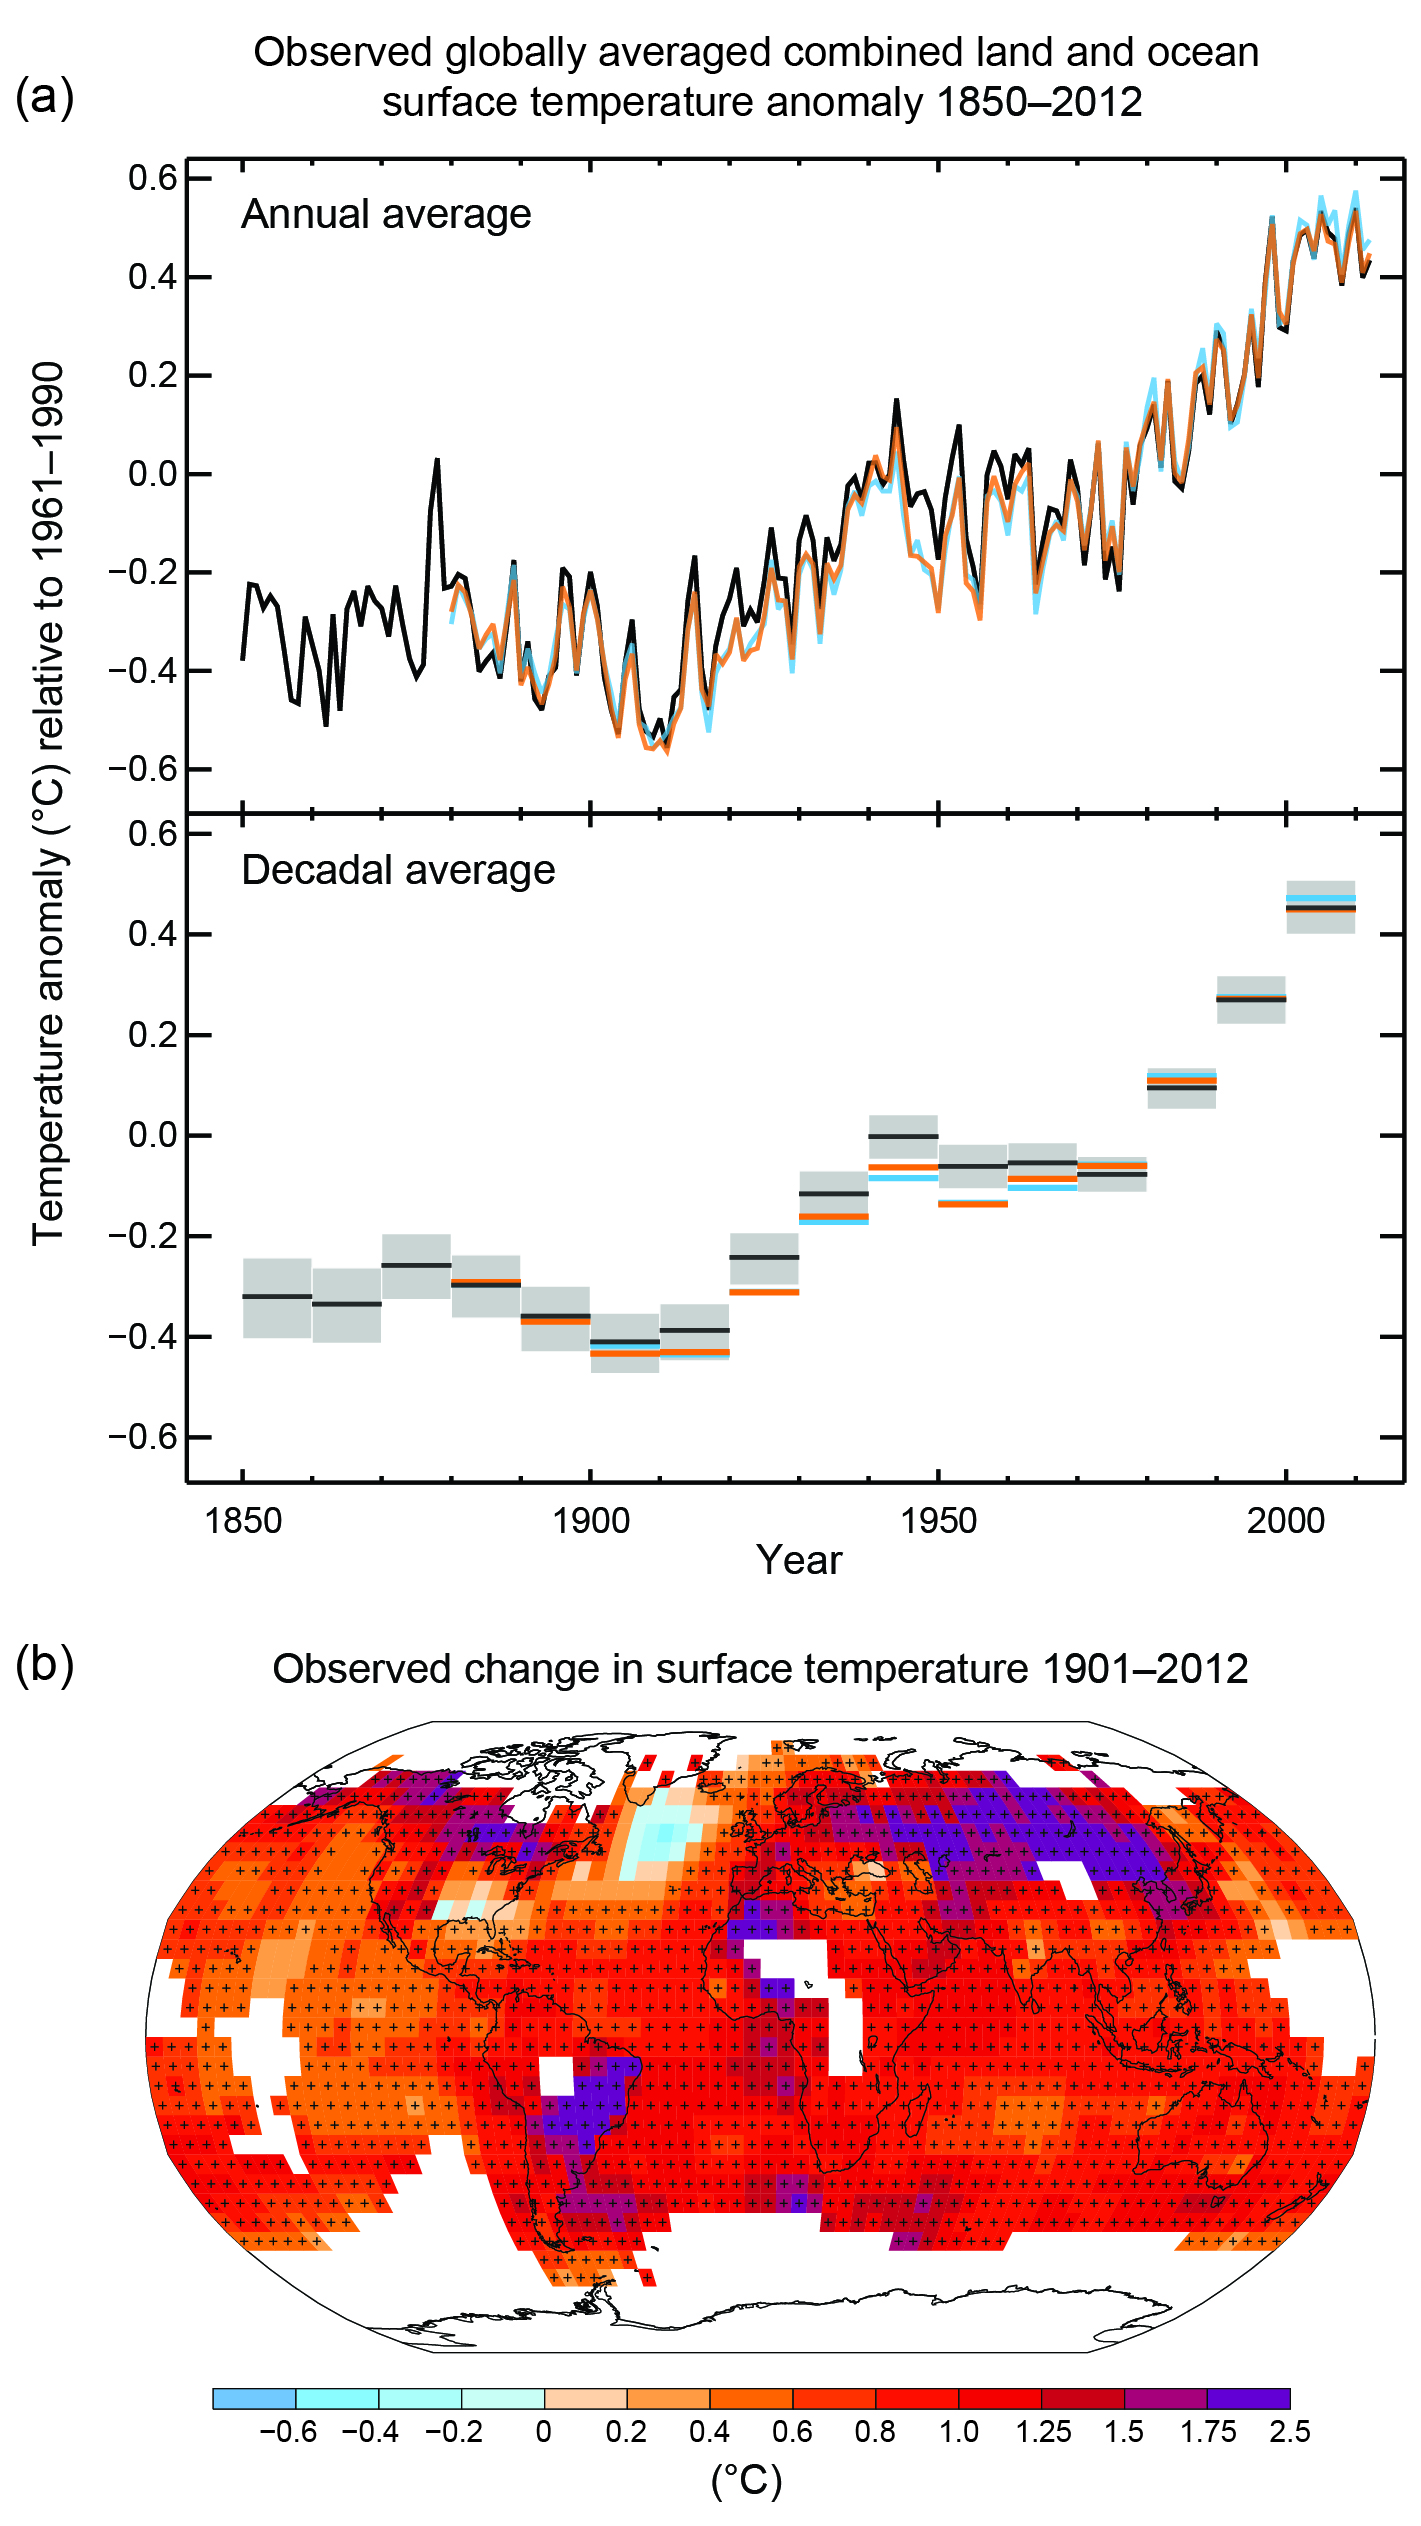
Figure SPM.1
(a) Observed global mean combined land and ocean surface temperature anomalies, from 1850 to 2012 from three data sets. Top panel: annual mean values. Bottom panel: decadal mean values including the estimate of uncertainty for one dataset (black). Anomalies are relative to the mean of 1961−1990. (b) Map of the observed surface temperature change from 1901 to 2012 derived from temperature trends determined by linear regression from one dataset (orange line in panel a). Trends have been calculated where data availability permits a robust estimate (i.e., only for grid boxes with greater than 70% complete records and more than 20% data availability in the first and last 10% of the time period). Other areas are white. Grid boxes where the trend is significant at the 10% level are indicated by a + sign. For a listing of the datasets and further technical details see the Technical Summary Supplementary Material. {Figures 2.19–2.21; Figure TS.2}.
You may freely download and copy the material contained on this website for your personal, non-commercial use, without any right to resell, redistribute, compile or create derivative works therefrom, subject to more specific restrictions that may apply to specific materials.