
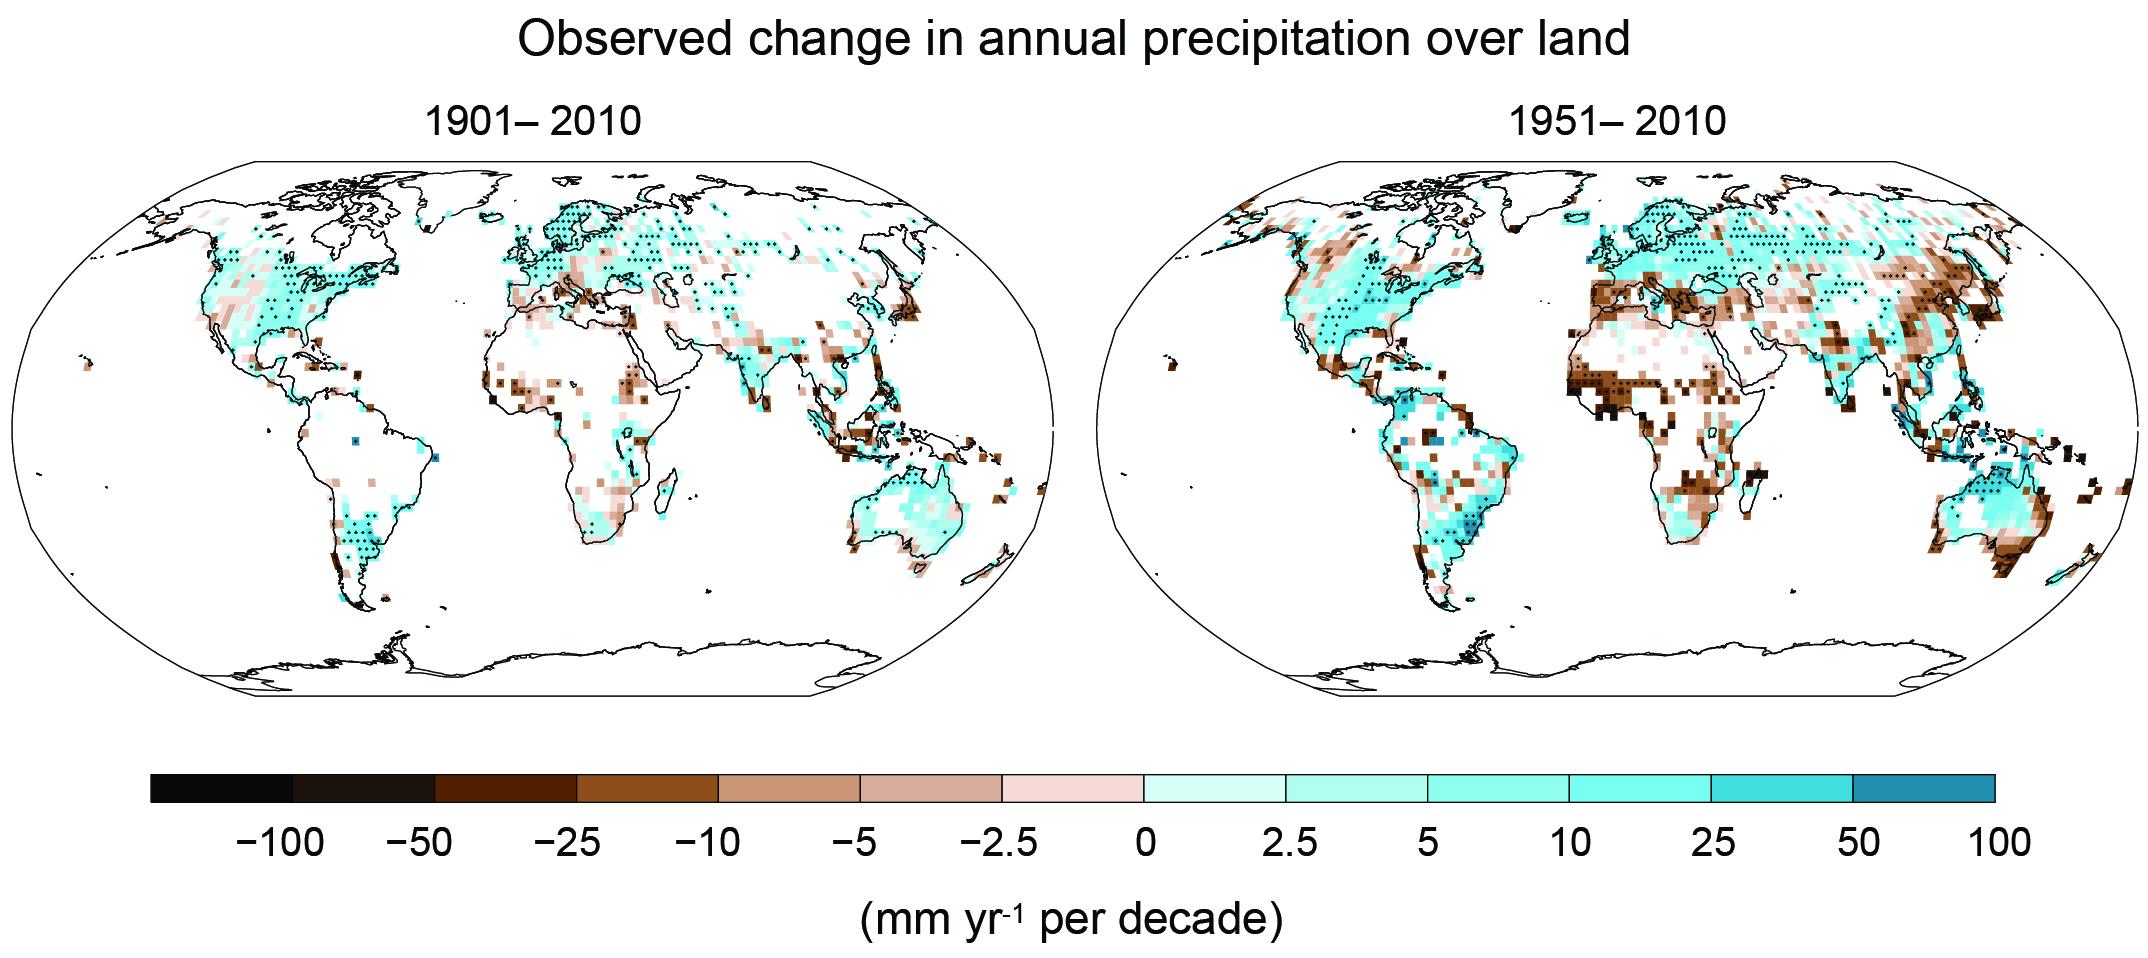
Figure SPM.2
Maps of observed precipitation change from 1901 to 2010 and from 1951 to 2010 (trends in annual accumulation calculated using the same criteria as in Figure SPM.1) from one data set. For further technical details see the Technical Summary Supplementary Material. {TS TFE.1, Figure 2; Figure 2.29}.
You may freely download and copy the material contained on this website for your personal, non-commercial use, without any right to resell, redistribute, compile or create derivative works therefrom, subject to more specific restrictions that may apply to specific materials.
Share