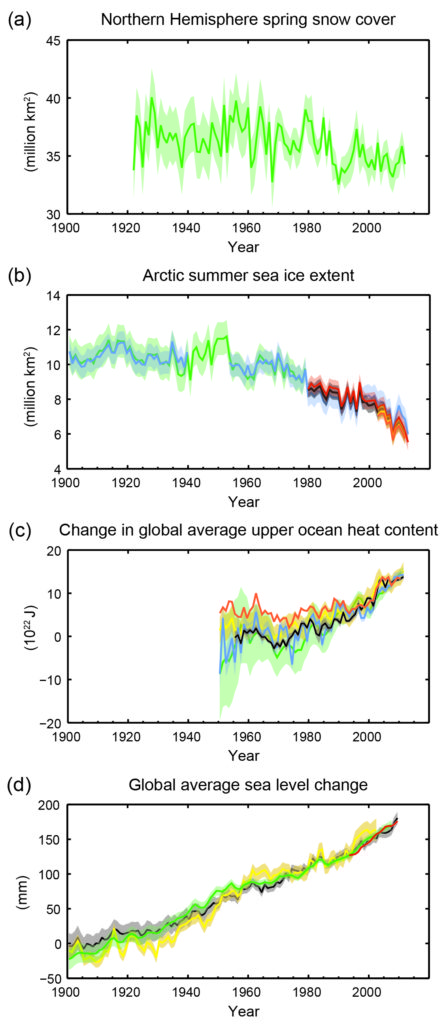
Figure SPM.3
Multiple observed indicators of a changing global climate: (a) Extent of Northern Hemisphere March-April (spring) average snow cover; (b) extent of Arctic July-August-September (summer) average sea ice; (c) change in global mean upper ocean (0–700 m) heat content aligned to 2006−2010, and relative to the mean of all datasets for 1970; (d) global mean sea level relative to the 1900–1905 mean of the longest running dataset, and with all datasets aligned to have the same value in 1993, the first year of satellite altimetry data. All time-series (coloured lines indicating different data sets) show annual values, and where assessed, uncertainties are indicated by coloured shading. See Technical Summary Supplementary Material for a listing of the datasets. {Figures 3.2, 3.13, 4.19, and 4.3; FAQ 2.1, Figure 2; Figure TS.1}
You may freely download and copy the material contained on this website for your personal, non-commercial use, without any right to resell, redistribute, compile or create derivative works therefrom, subject to more specific restrictions that may apply to specific materials.