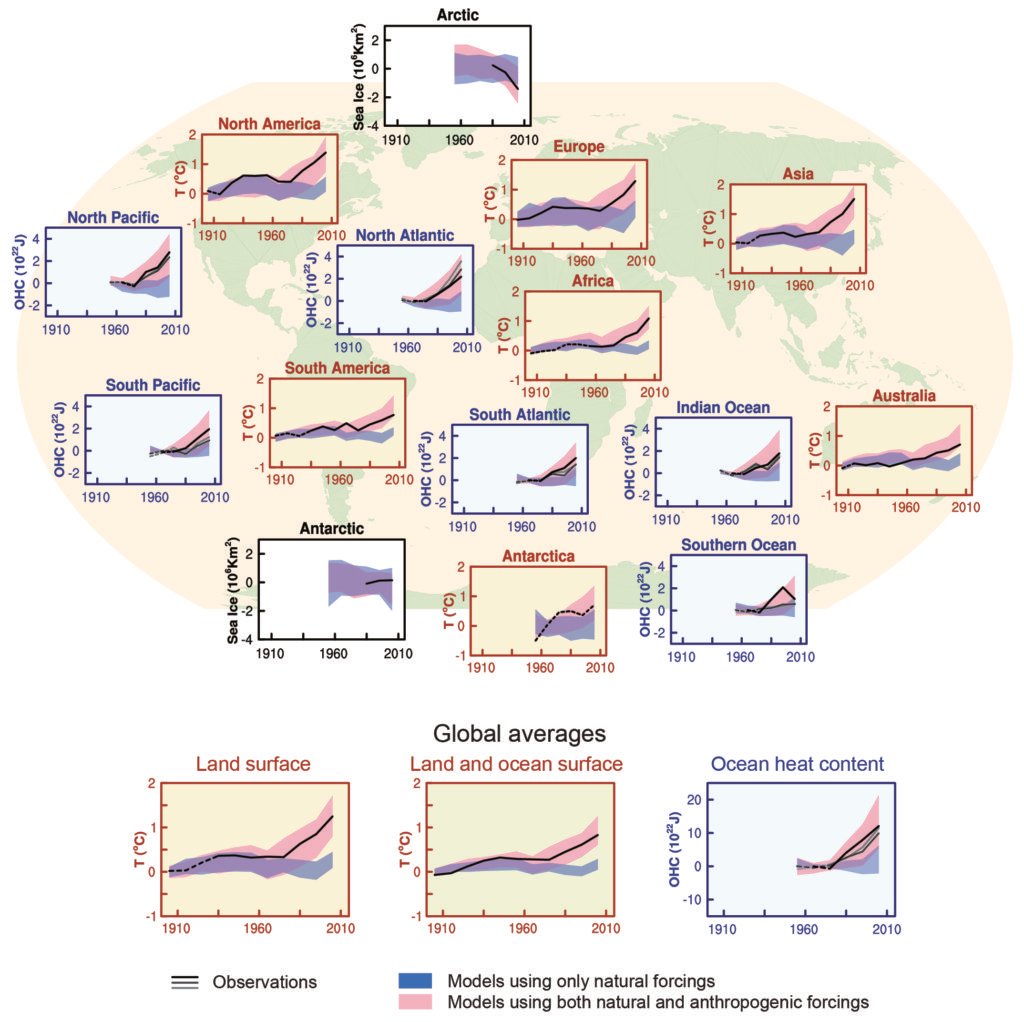
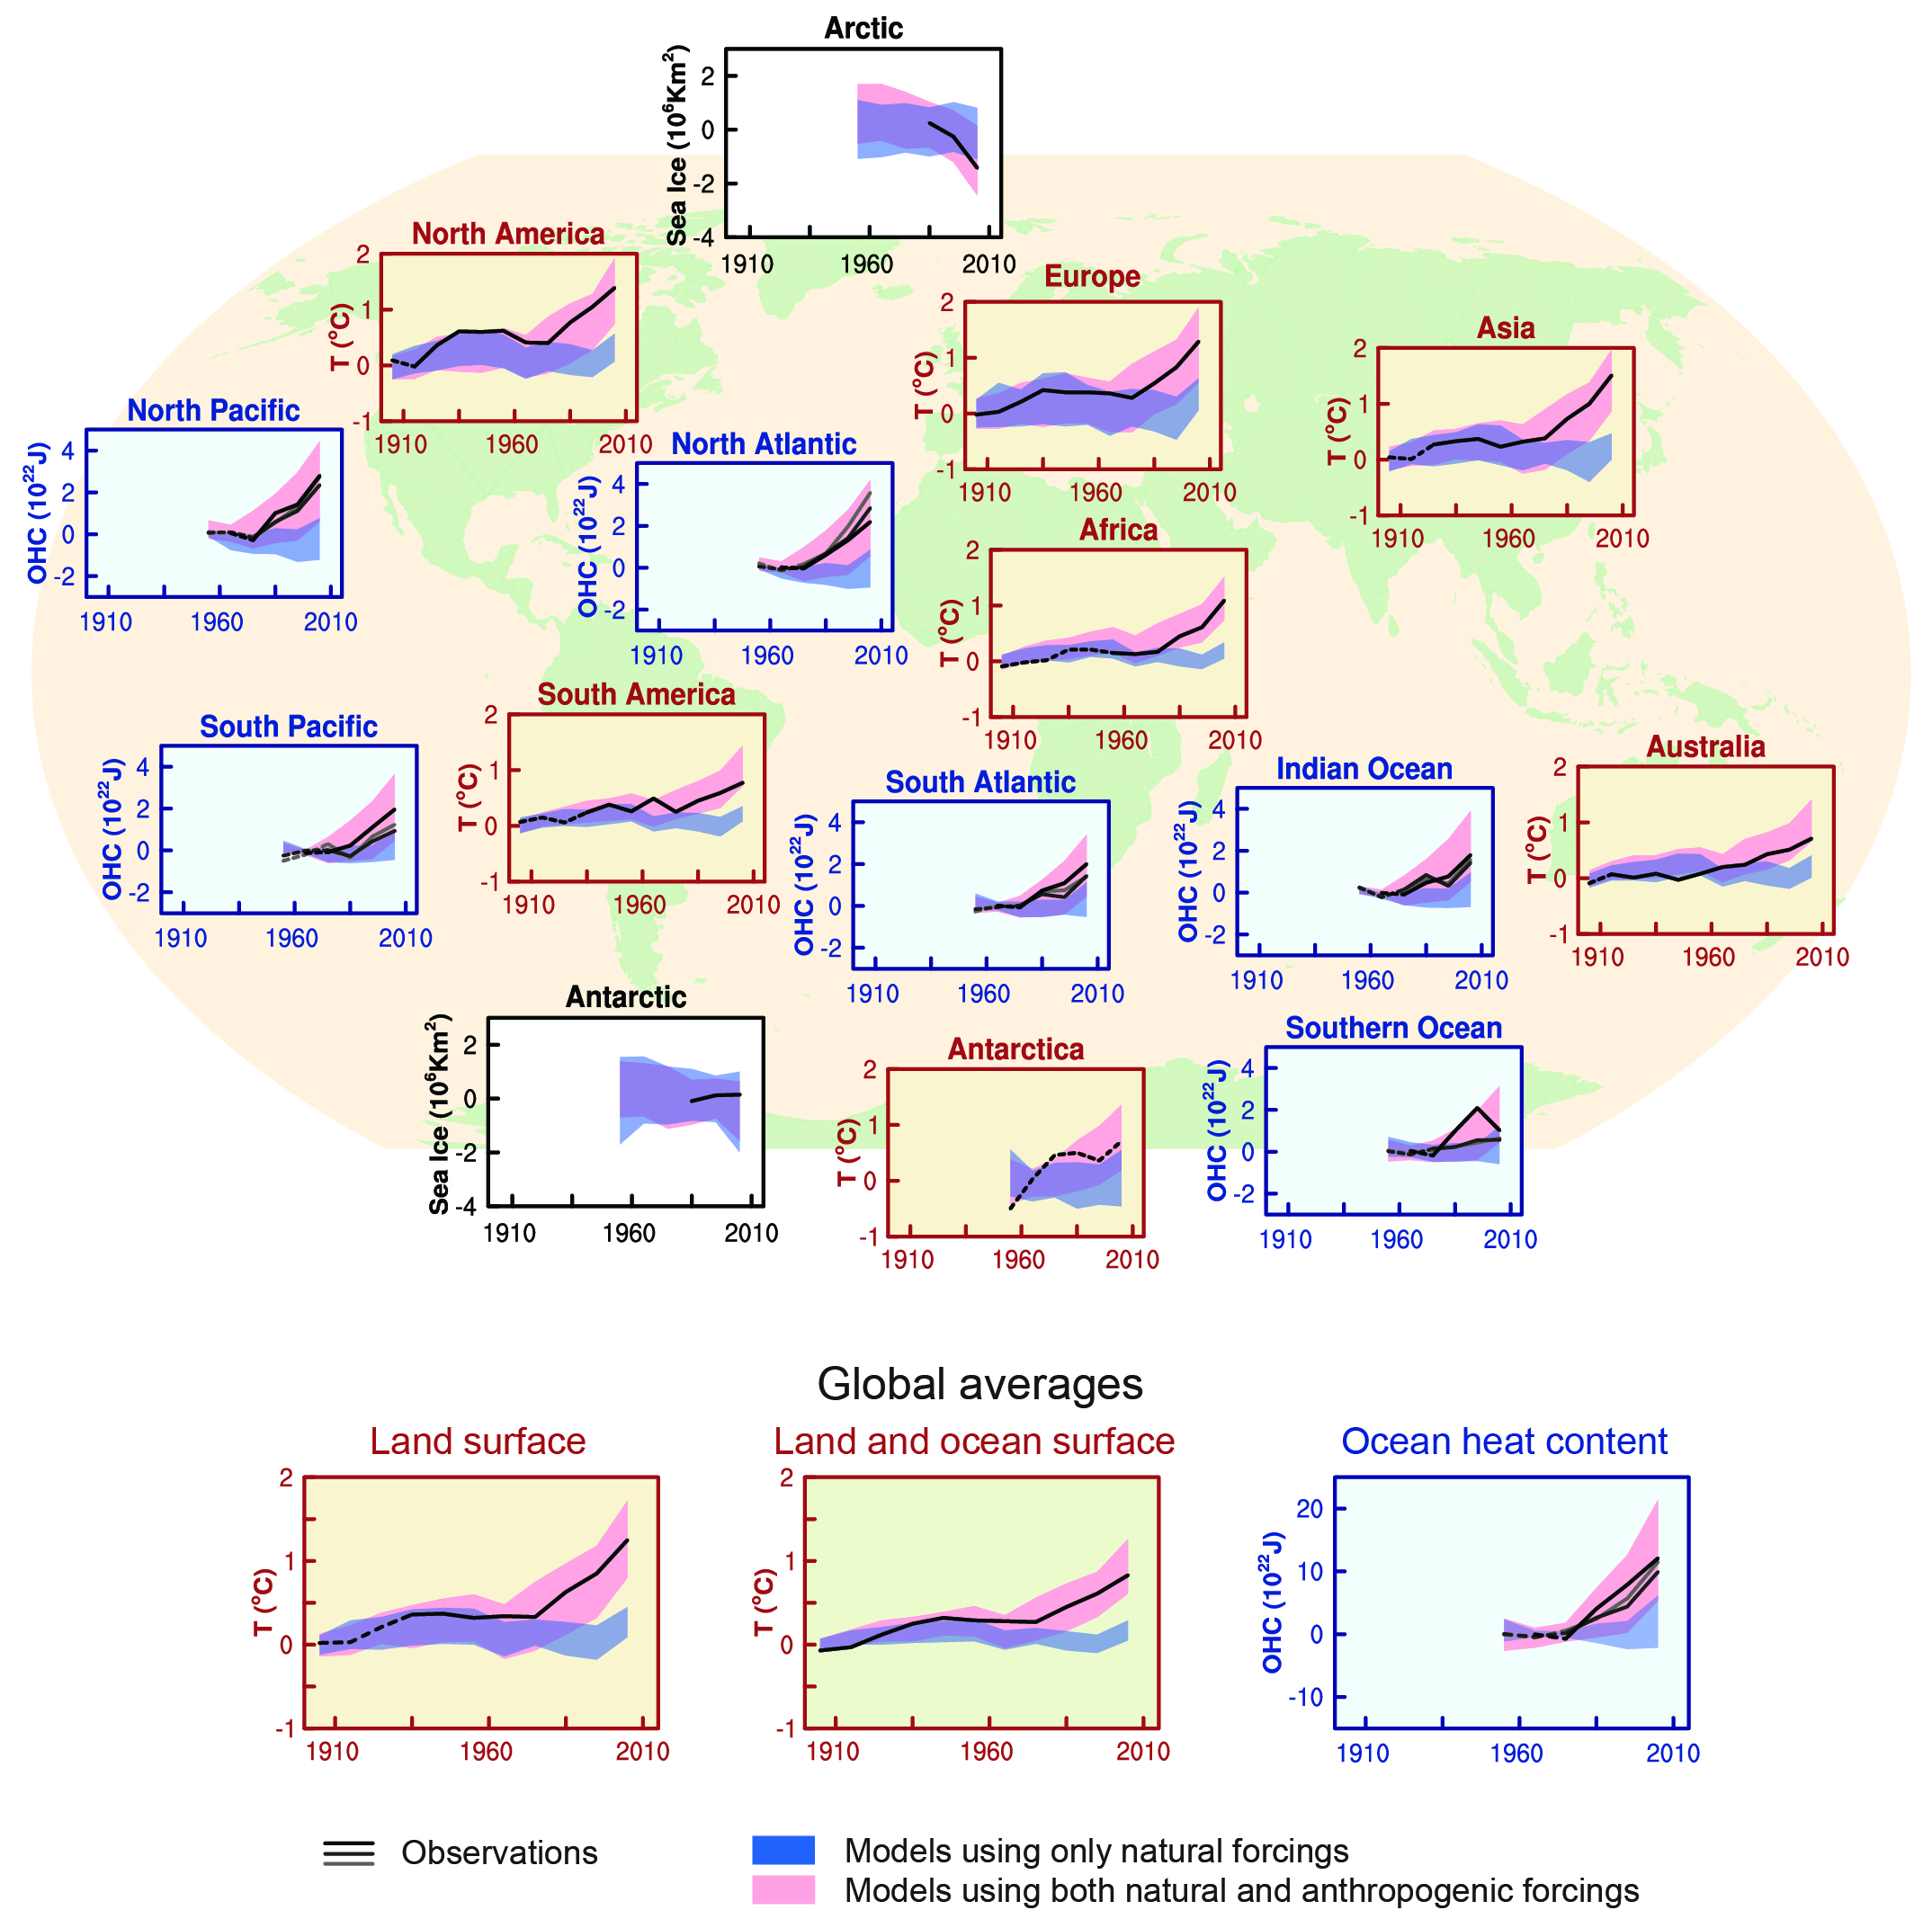
Figure SPM.6
Comparison of observed and simulated climate change based on three large-scale indicators in the atmosphere, the cryosphere and the ocean: change in continental land surface air temperatures (yellow panels), Arctic and Antarctic September sea ice extent (white panels), and upper ocean heat content in the major ocean basins (blue panels). Global average changes are also given. Anomalies are given relative to 1880–1919 for surface temperatures, 1960–1980 for ocean heat content and 1979–1999 for sea ice. All time-series are decadal averages, plotted at the centre of the decade. For temperature panels, observations are dashed lines if the spatial coverage of areas being examined is below 50%. For ocean heat content and sea ice panels the solid line is where the coverage of data is good and higher in quality, and the dashed line is where the data coverage is only adequate, and thus, uncertainty is larger. Model results shown are Coupled Model Intercomparison Project Phase 5 (CMIP5) multi-model ensemble ranges, with shaded bands indicating the 5 to 95% confidence intervals. For further technical details, including region definitions see the Technical Summary Supplementary Material. {Figure 10.21; Figure TS.12}
You may freely download and copy the material contained on this website for your personal, non-commercial use, without any right to resell, redistribute, compile or create derivative works therefrom, subject to more specific restrictions that may apply to specific materials.