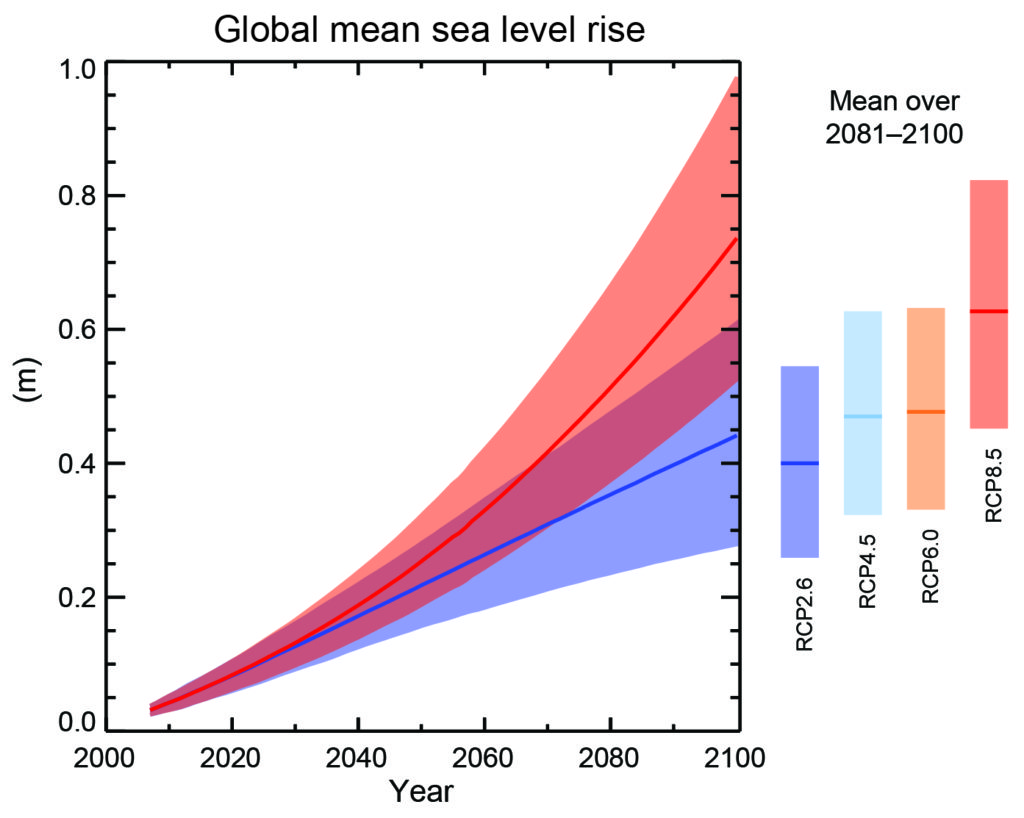
Figure SPM.9
Projections of global mean sea level rise over the 21st century relative to 1986–2005 from the combination of the CMIP5 ensemble with process-based models, for RCP2.6 and RCP8.5. The assessed likely range is shown as a shaded band. The assessed likely ranges for the mean over the period 2081–2100 for all RCP scenarios are given as coloured vertical bars, with the corresponding median value given as a horizontal line. For further technical details see the Technical Summary Supplementary Material {Table 13.5, Figures 13.10 and 13.11; Figures TS.21 and TS.22}
You may freely download and copy the material contained on this website for your personal, non-commercial use, without any right to resell, redistribute, compile or create derivative works therefrom, subject to more specific restrictions that may apply to specific materials.