
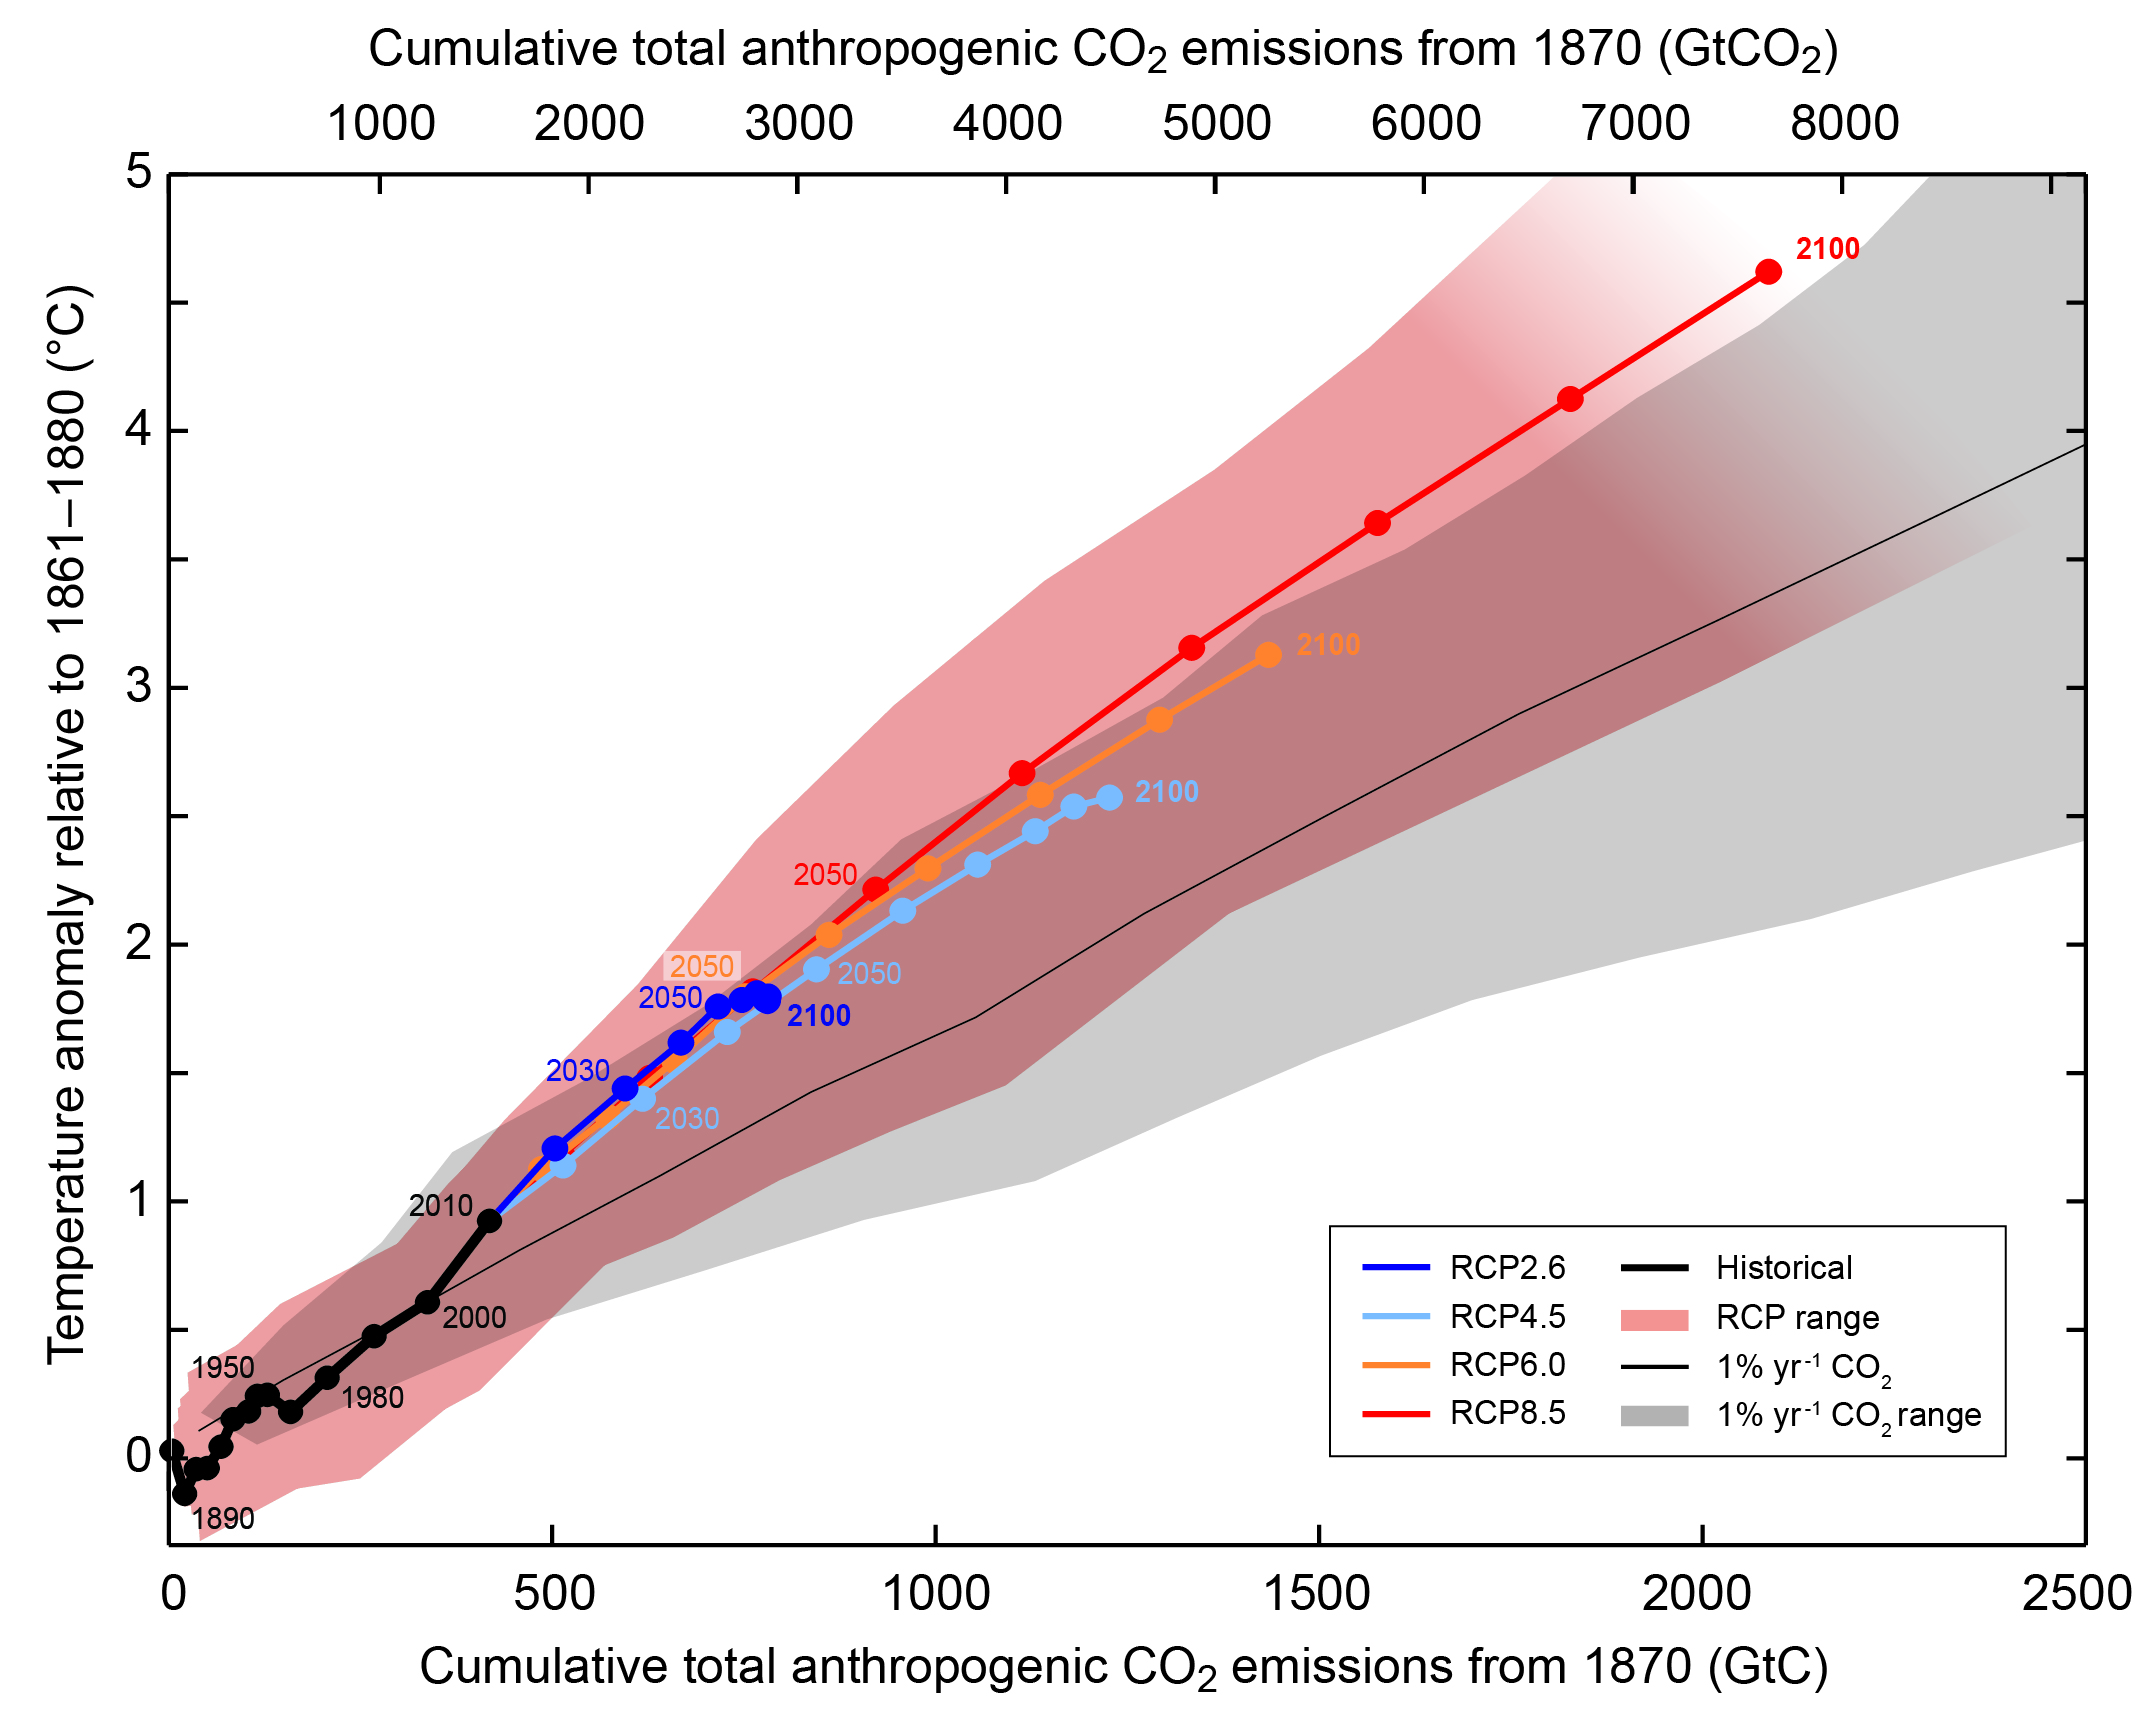
Figure SPM.10
Global mean surface temperature increase as a function of cumulative total global CO2 emissions from various lines of evidence. Multi- model results from a hierarchy of climate-carbon cycle models for each RCP until 2100 are shown with coloured lines and decadal means (dots). Some decadal means are labeled for clarity (e.g., 2050 indicating the decade 2040−2049). Model results over the historical period (1860 to 2010) are indicated in black. The coloured plume illustrates the multi-model spread over the four RCP scenarios and fades with the decreasing number of available models in RCP8.5. The multi-model mean and range simulated by CMIP5 models, forced by a CO2 increase of 1% per year (1% yr–1 CO2 simulations), is given by the thin black line and grey area. For a specific amount of cumulative CO2 emissions, the 1% per year CO2 simulations exhibit lower warming than those driven by RCPs, which include additional non-CO2 forcings. Temperature values are given relative to the 1861−1880 base period, emissions relative to 1870. Decadal averages are connected by straight lines. For further technical details see the Technical Summary Supplementary Material. {Figure 12.45; TS TFE.8, Figure 1}
You may freely download and copy the material contained on this website for your personal, non-commercial use, without any right to resell, redistribute, compile or create derivative works therefrom, subject to more specific restrictions that may apply to specific materials.