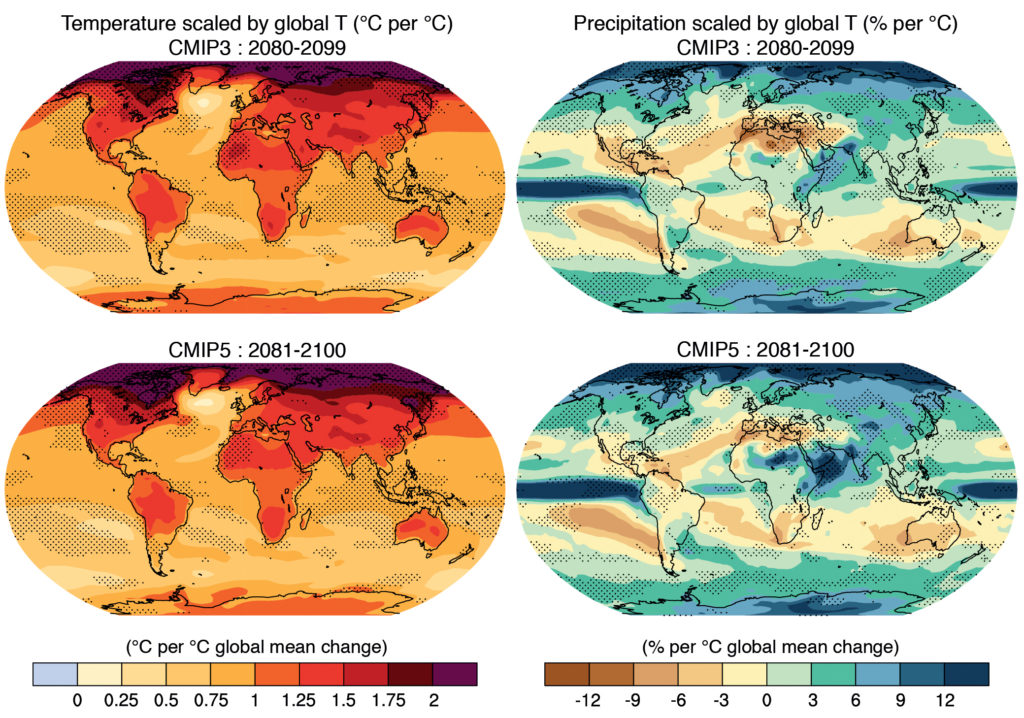
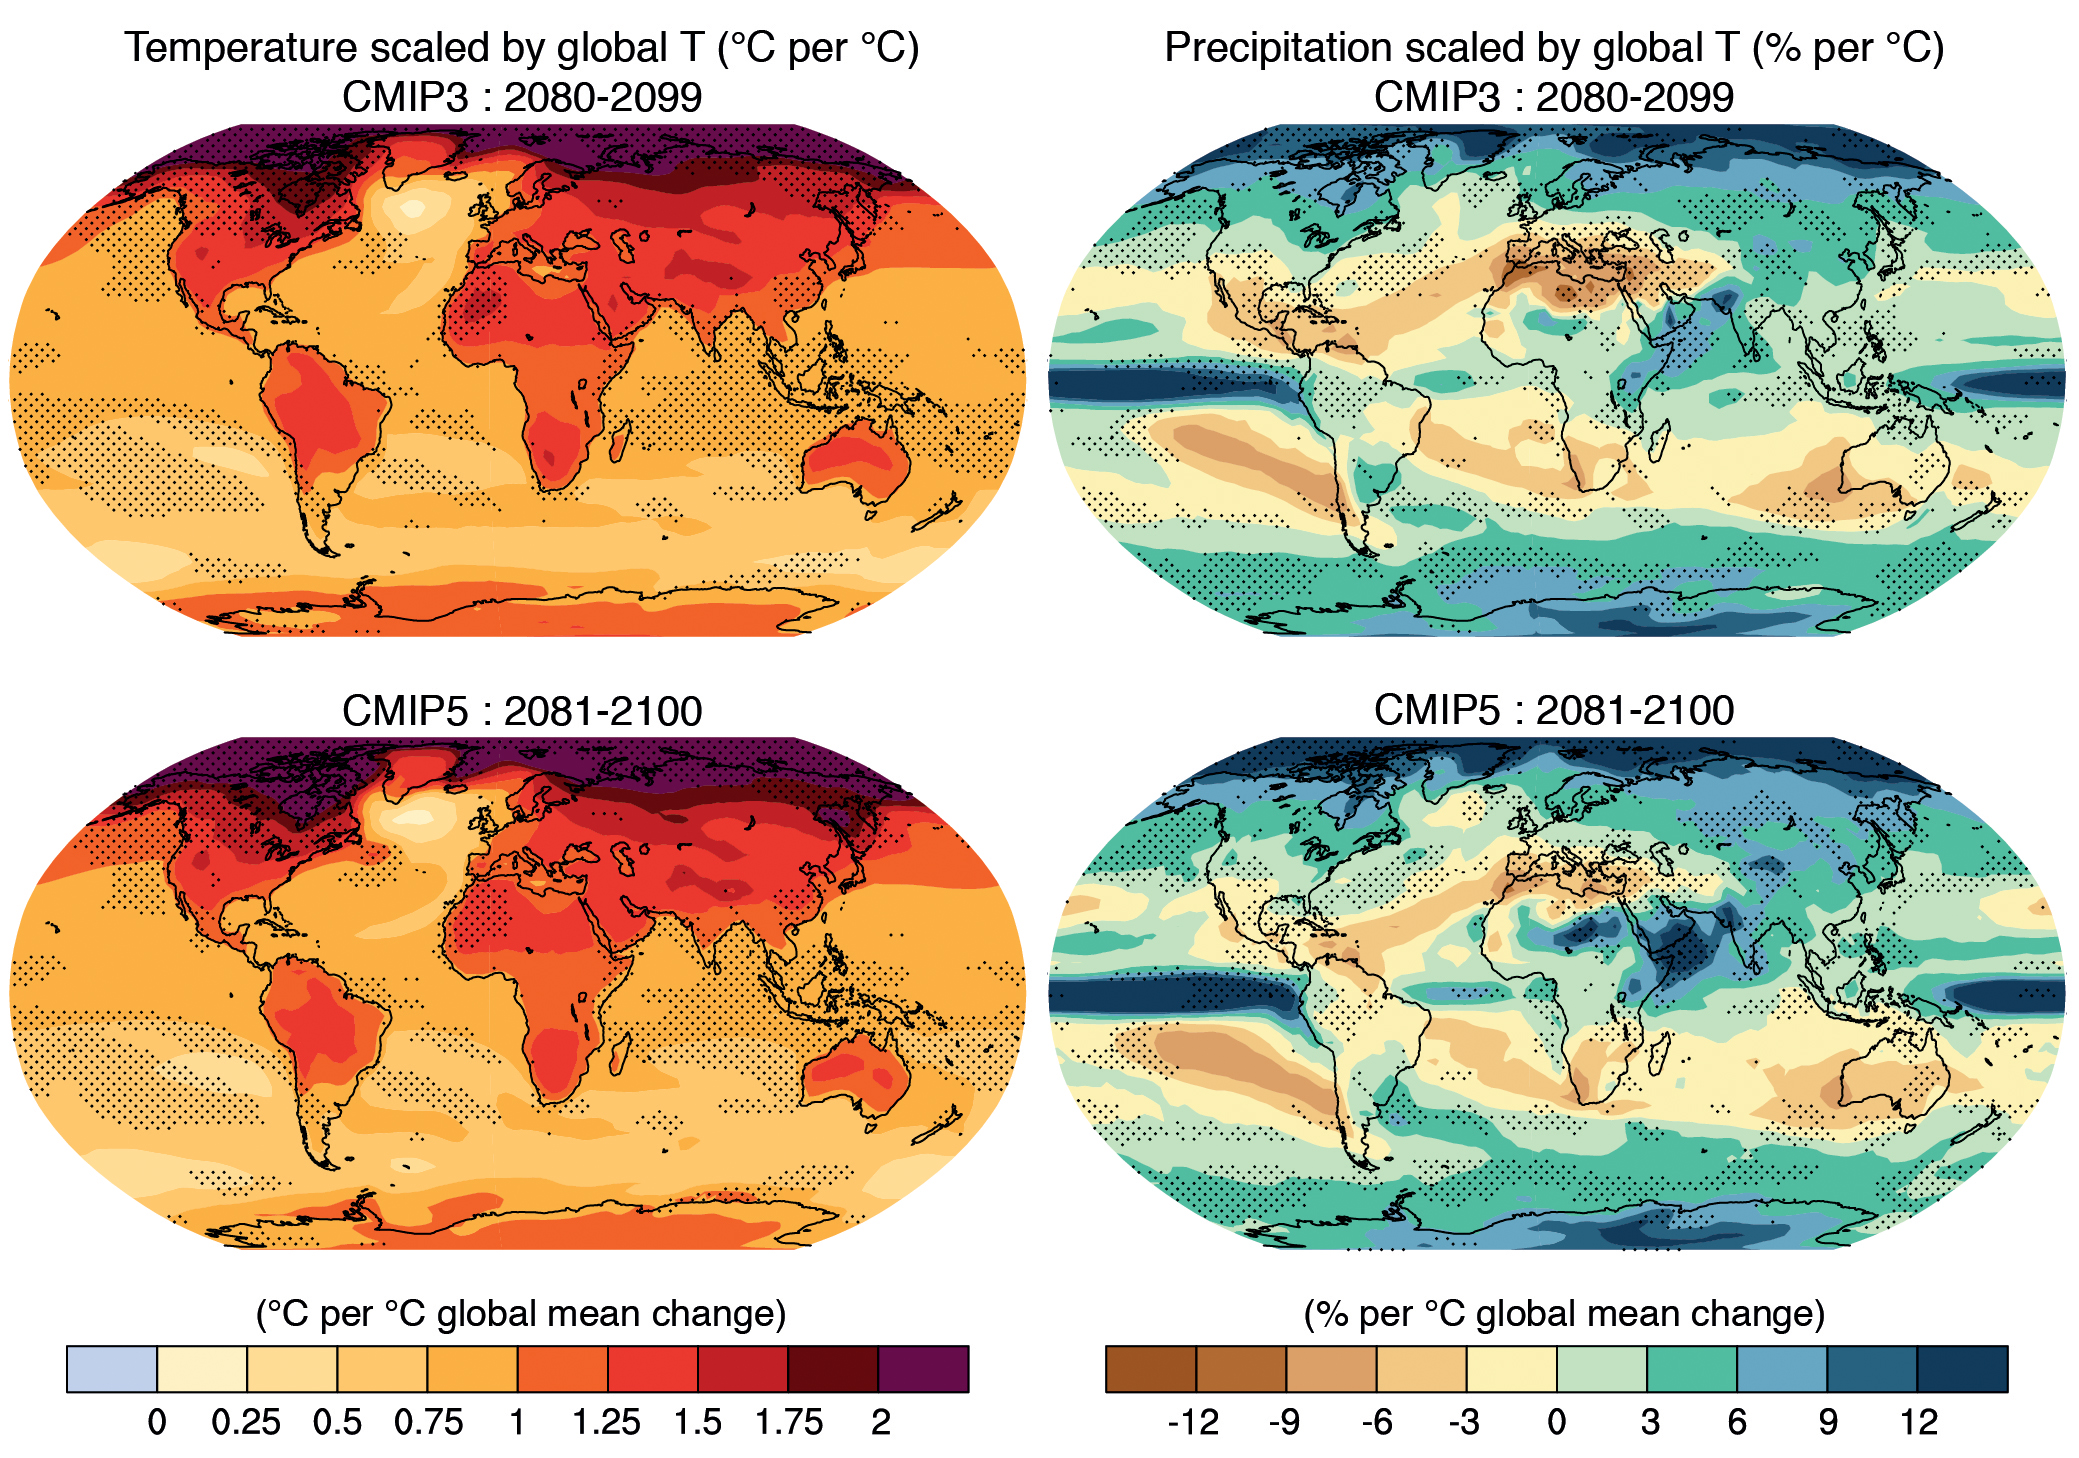
Box TS.6, Figure 1
Patterns of temperature (left column) and percent precipitation change (right column) for the CMIP3 models average (first row) and CMIP5 models average (second row), scaled by the corresponding global average temperature changes. The patterns are computed in both cases by taking the difference between the averages over the last 20 years of the 21st century experiments (2080–2099 for CMIP3 and 2081–2100 for CMIP5) and the last 20 years of the historic experiments (1980–1999 for CMIP3, 1986–2005 for CMIP5) and rescaling each difference by the corresponding change in global average temperature. This is done first for each individual model, then the results are averaged across models. Stippling indicates a measure of significance of the difference between the two correspond- ing patterns obtained by a bootstrap exercise. Two subsets of the pooled set of CMIP3 and CMIP5 ensemble members of the same size as the original ensembles, but without distinguishing CMIP3 from CMIP5 members, were randomly sampled 500 times. For each random sample the corresponding patterns and their difference are computed, then the true difference is compared, grid-point by grid-point, to the distribution of the bootstrapped differences, and only grid-points at which the value of the difference falls in the tails of the bootstrapped distribution (less than the 2.5th percentiles or the 97.5th percentiles) are stippled. {Figure 12.41}
You may freely download and copy the material contained on this website for your personal, non-commercial use, without any right to resell, redistribute, compile or create derivative works therefrom, subject to more specific restrictions that may apply to specific materials.