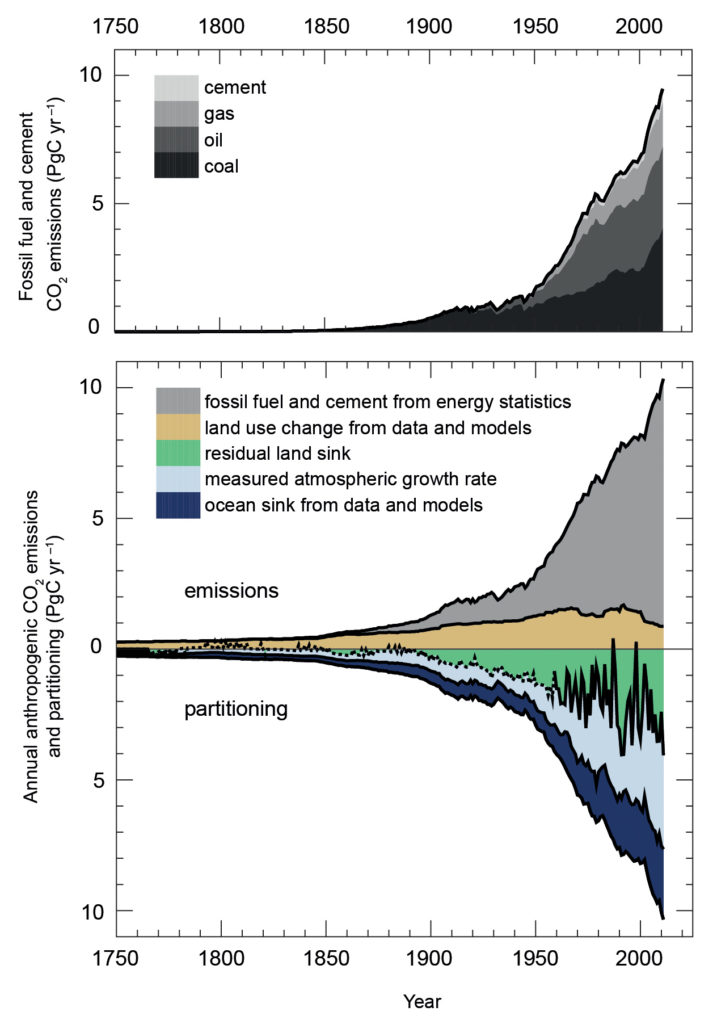
Figure TS.4
Annual anthropogenic CO2 emissions and their partitioning among the atmosphere, land and ocean (PgC yr–1) from 1750 to 2011. (Top) Fossil fuel and cement CO2 emissions by category, estimated by the Carbon Dioxide Information Analysis Center (CDIAC). (Bottom) Fossil fuel and cement CO2 emissions as above. CO2 emissions from net land use change, mainly deforestation, are based on land cover change data (see Table 6.2). The atmospheric CO2 growth rate prior to 1959 is based on a spline fit to ice core observations and a synthesis of atmospheric measurements from 1959. The fit to ice core observations does not capture the large interannual variability in atmospheric CO2 and is represented with a dashed line. The ocean CO2 sink is from a combination of models and observations. The residual land sink (term in green in the figure) is computed from the residual of the other terms. The emissions and their partitioning include only the fluxes that have changed since 1750, and not the natural CO2 fluxes (e.g., atmospheric CO2 uptake from weathering, outgassing of CO2 from lakes and rivers and outgassing of CO2 by the ocean from carbon delivered by rivers; see Figure 6.1) between the atmosphere, land and ocean reservoirs that existed before that time and still exist today. The uncertainties in the various terms are discussed in Chapter 6 and reported in Table 6.1 for decadal mean values. {Figure 6.8}
You may freely download and copy the material contained on this website for your personal, non-commercial use, without any right to resell, redistribute, compile or create derivative works therefrom, subject to more specific restrictions that may apply to specific materials.