
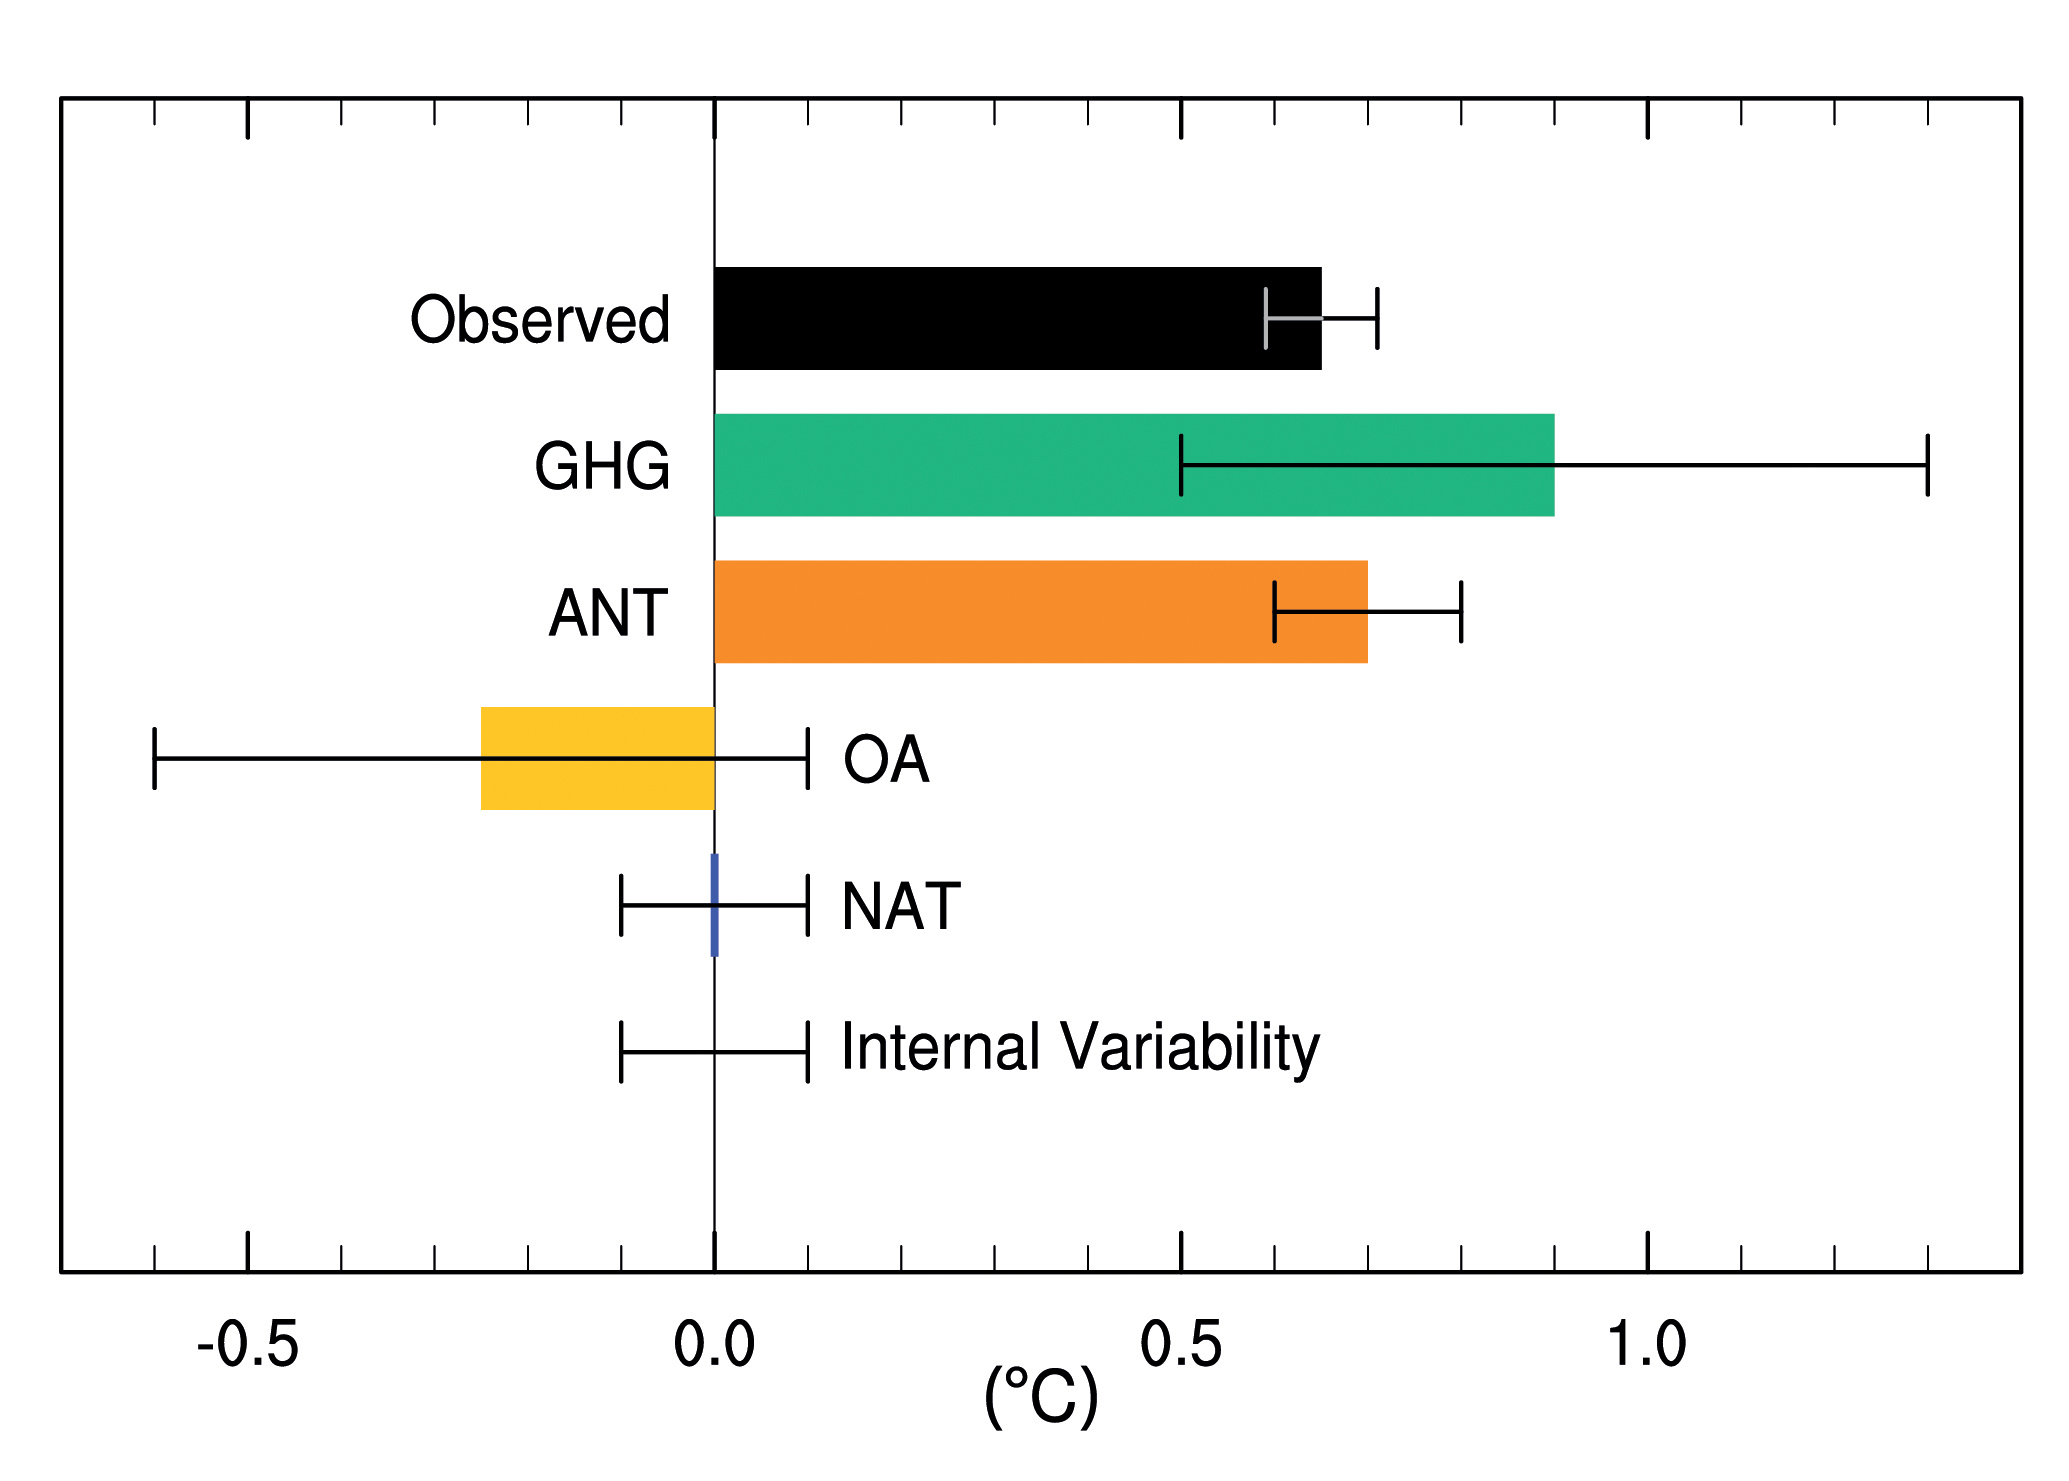
Figure TS.10
Assessed likely ranges (whiskers) and their midpoints (bars) for warming trends over the 1951–2010 period due to well-mixed greenhouse gases (GHG), anthropogenic forcings (ANT) anthropogenic forcings other than well-mixed greenhouse gases (OA), natural forcings (NAT) and internal variability. The trend in the Hadley Centre/ Climatic Research Unit gridded surface temperature data set 4 (HadCRUT4) observations is shown in black with its 5 to 95% uncertainty range due only to observational uncertainty in this record. {Figure 10.5}
You may freely download and copy the material contained on this website for your personal, non-commercial use, without any right to resell, redistribute, compile or create derivative works therefrom, subject to more specific restrictions that may apply to specific materials.