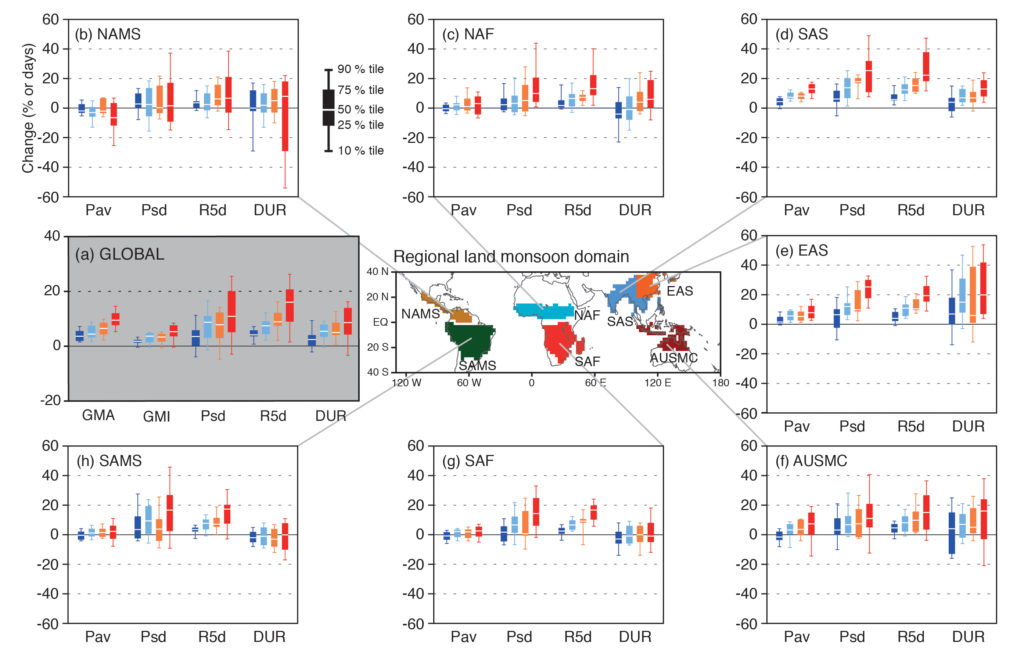
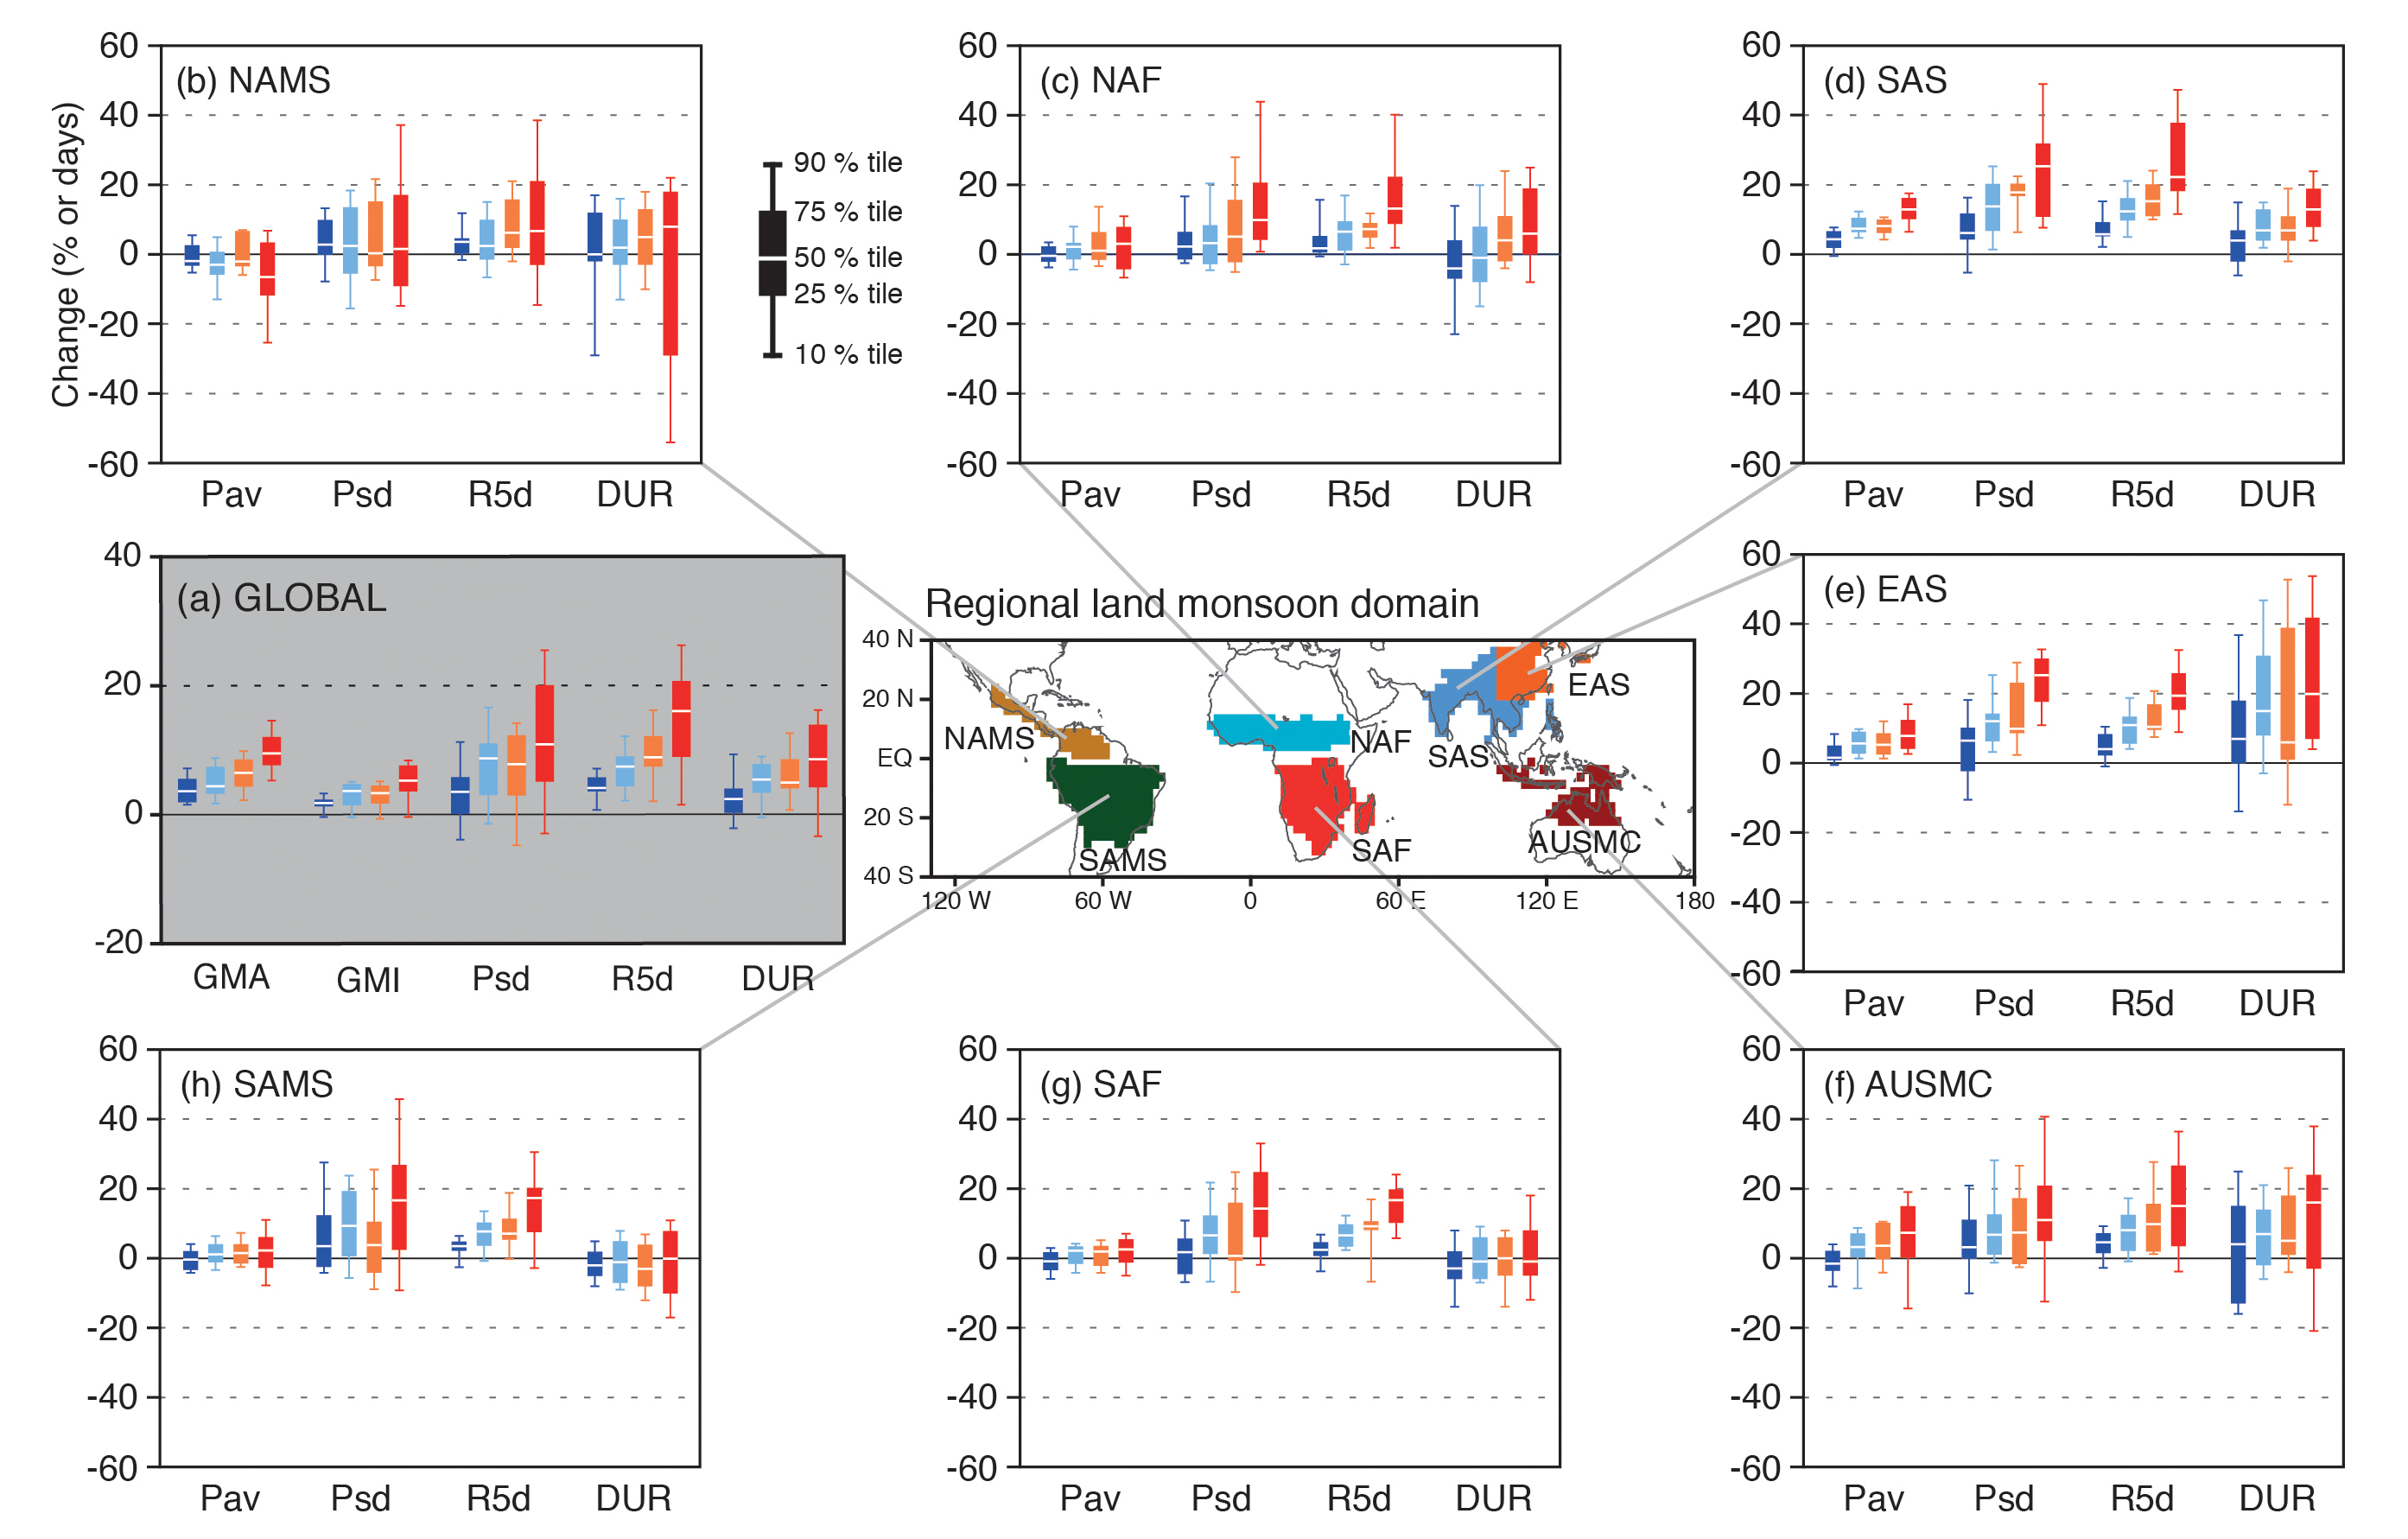
Figure TS.24
Future change in monsoon statistics between the present-day (1986–2005) and the future (2080–2099) based on CMIP5 ensemble from RCP2.6 (dark blue; 18 models), RCP4.5 (blue; 24), RCP6.0 (yellow; 14), and RCP8.5 (red; 26) simulations. (a) GLOBAL: Global monsoon area (GMA), global monsoon intensity (GMI), standard deviation of inter-annual variability in seasonal precipitation (Psd), seasonal maximum 5-day precipitation total (R5d) and monsoon season duration (DUR). Regional land monsoon domains determined by 24 multi-model mean precipitation in the present-day. (b)–(h) Future change in regional land monsoon statistics: seasonal average precipitation (Pav), Psd, R5d, and DUR in (b) North America (NAMS), (c) North Africa (NAF), (d) South Asia (SAS), (e) East Asia (EAS), (f) Australia-Maritime continent (AUSMC), (g) South Africa (SAF) and (h) South America (SAMS). Units are % except for DUR (days). Box-and-whisker plots show the 10th, 25th, 50th, 75th and 90th percentiles. All the indices are calculated for the summer season (May to September for the Northern, and November to March for the Southern Hemisphere) over each model’s monsoon domains. {Figures 14.3, 14.4, 14.6, 14.7}
You may freely download and copy the material contained on this website for your personal, non-commercial use, without any right to resell, redistribute, compile or create derivative works therefrom, subject to more specific restrictions that may apply to specific materials.