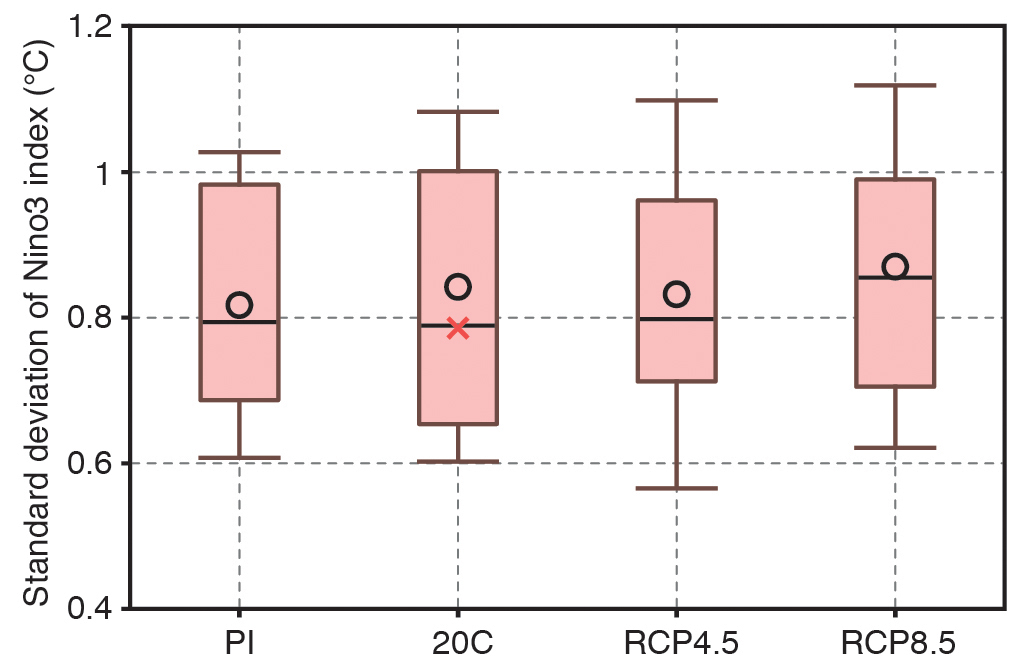
Figure TS.25
Standard deviation in CMIP5 multi-model ensembles of sea surface temperature variability over the eastern equatorial Pacific Ocean (Nino3 region: 5°S to 5°N, 150°W to 90°W), a measure of El Niño amplitude, for the pre-industrial (PI) control and 20th century (20C) simulations, and 21st century projections using RCP4.5 and RCP8.5. Open circles indicate multi-model ensemble means, and the red cross symbol is the observed standard deviation for the 20th century. Box-and-whisker plots show the 16th, 25th, 50th, 75th and 84th percentiles. {Figure 14.14}
You may freely download and copy the material contained on this website for your personal, non-commercial use, without any right to resell, redistribute, compile or create derivative works therefrom, subject to more specific restrictions that may apply to specific materials.