
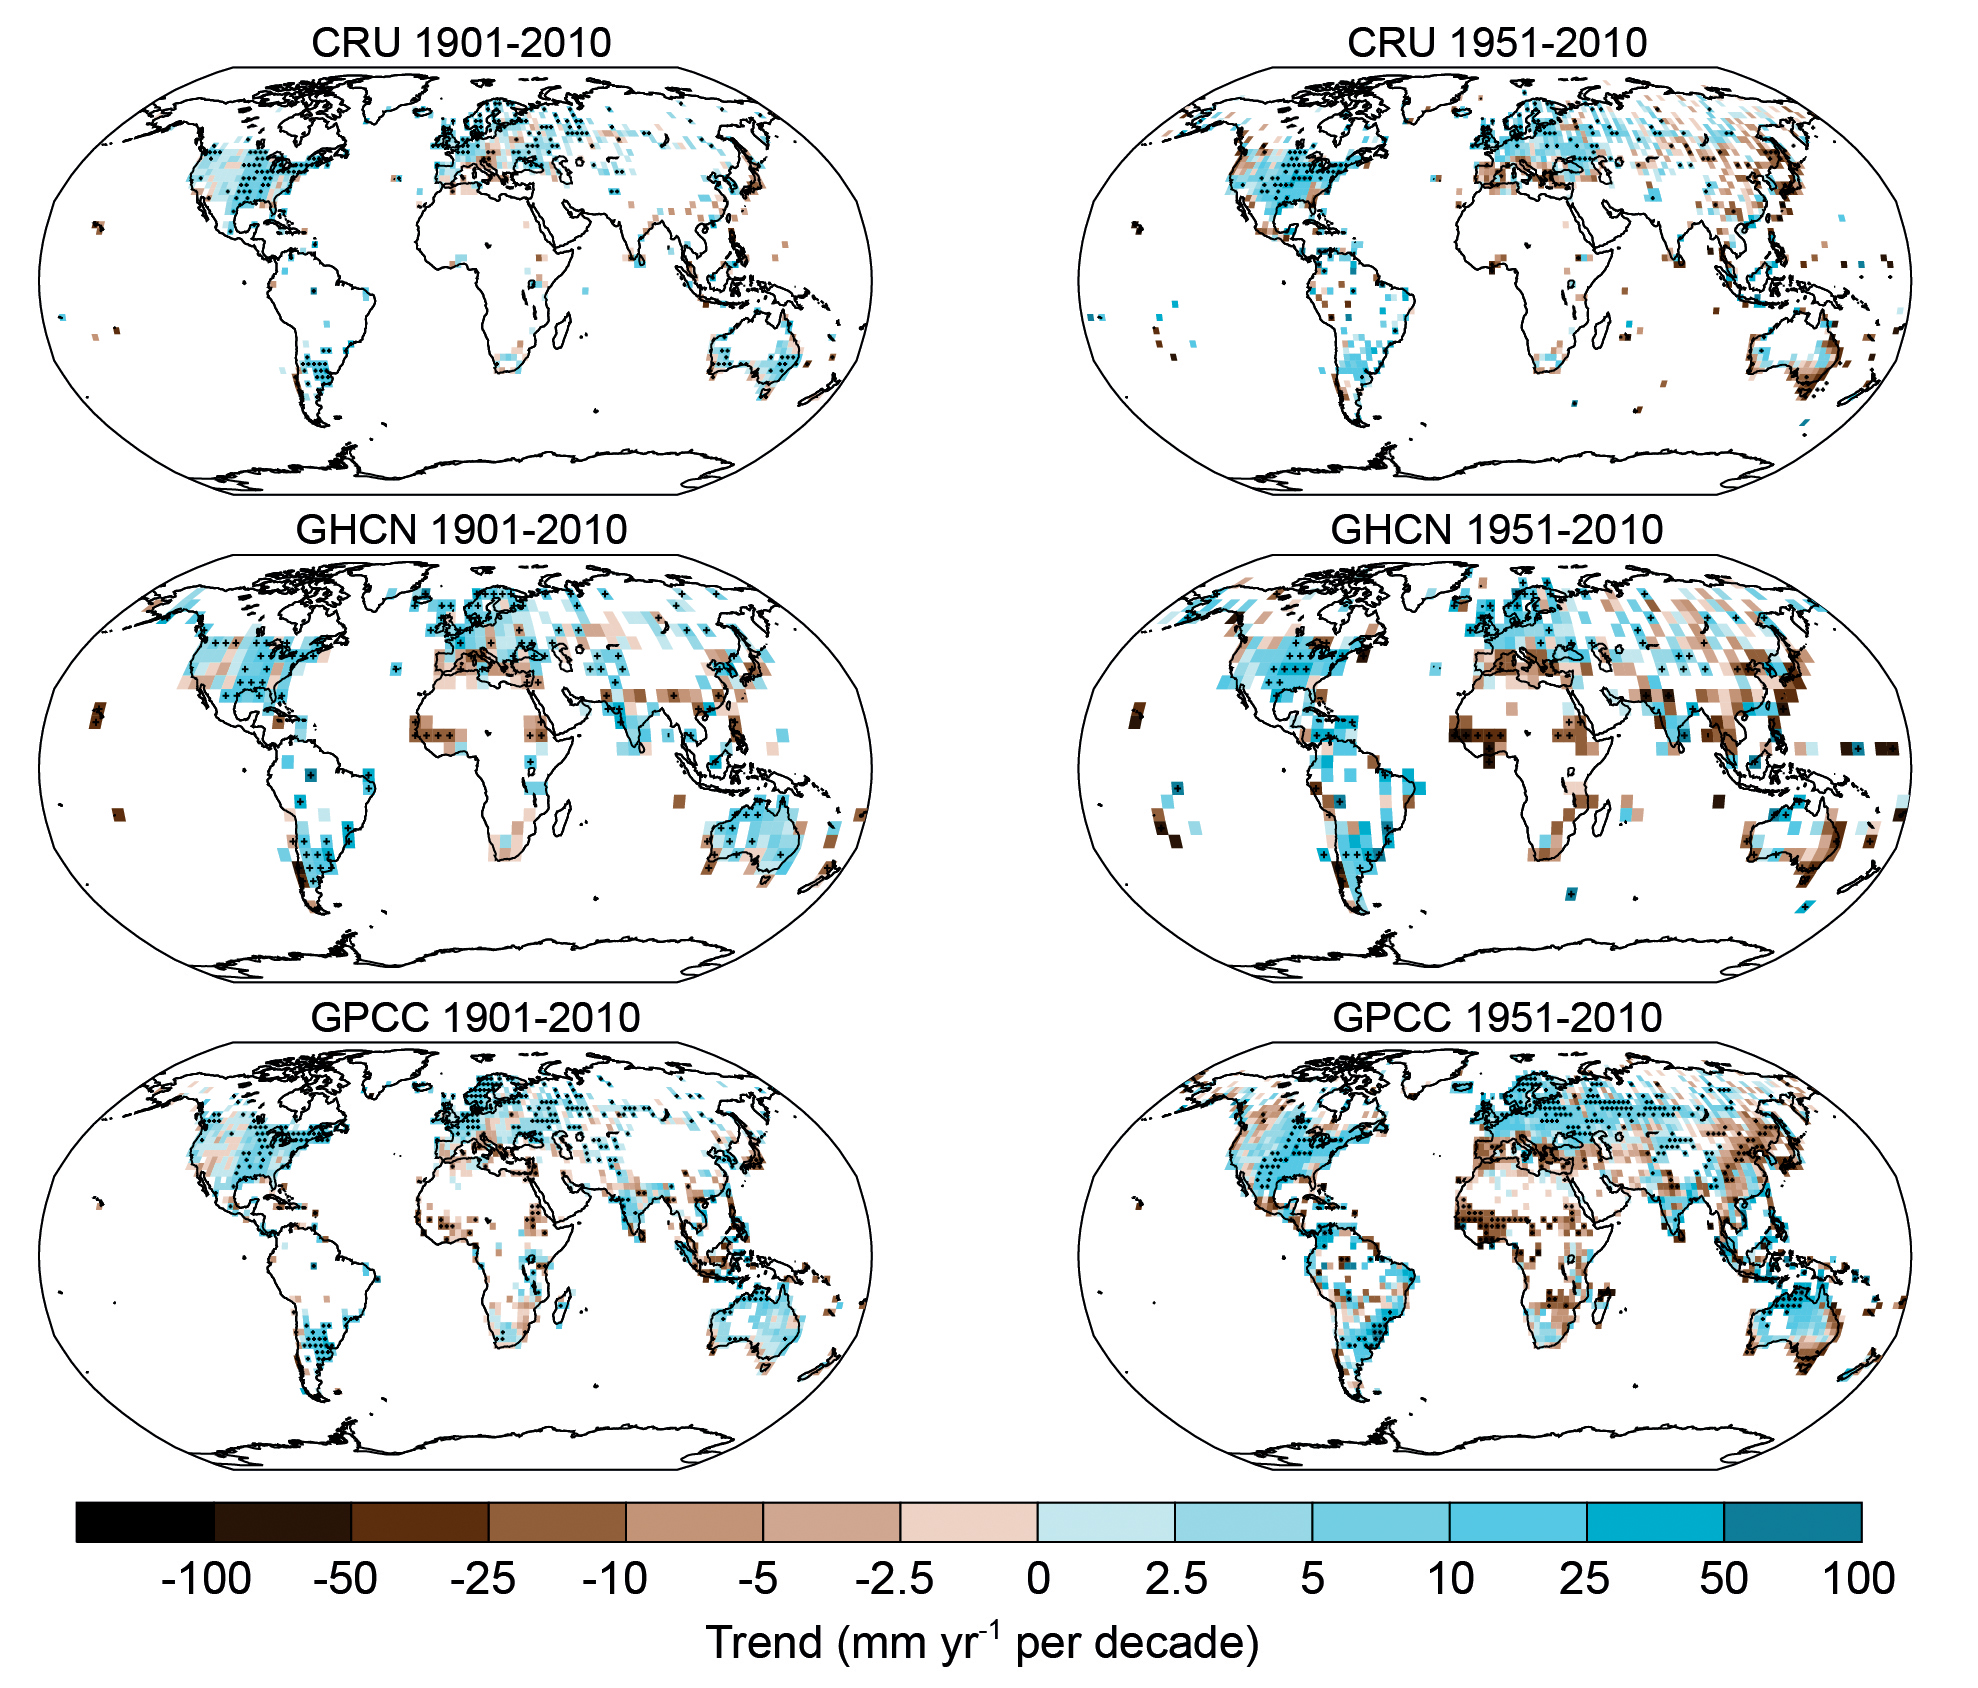
TFE.1, Figure 2
Maps of observed precipitation change over land from 1901 to 2010 (left-hand panels) and 1951 to 2010 (right-hand panels) from the Climatic Research Unit (CRU), Global Historical Climatology Network (GHCN) and Global Precipitation Climatology Centre (GPCC) data sets. Trends in annual accumulation have been calculated only for those grid boxes with greater than 70% complete records and more than 20% data availability in first and last decile of the period. White areas indicate incomplete or missing data. Black plus signs (+) indicate grid boxes where trends are significant (i.e., a trend of zero lies outside the 90% confidence interval). Further detail regarding the related Figure SPM.2 is given in the TS Supplementary Material. {Figure 2.29; 2.5.1}
You may freely download and copy the material contained on this website for your personal, non-commercial use, without any right to resell, redistribute, compile or create derivative works therefrom, subject to more specific restrictions that may apply to specific materials.