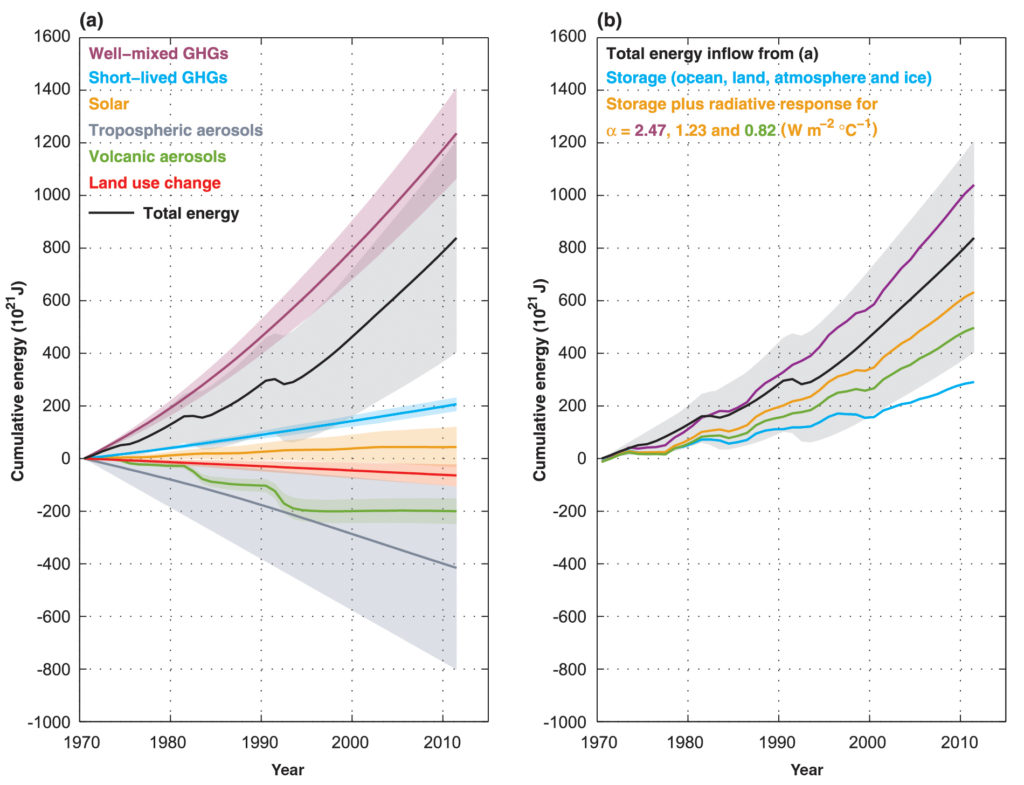
TFE.4, Figure 1
The Earth’s energy budget from 1970 through 2011. (a) The cumulative energy inflow into the Earth system from changes in well-mixed and short- lived greenhouse gases, solar forcing, tropospheric aerosol forcing, volcanic forcing and changes in surface albedo due to land use change (all relative to 1860–1879) are shown by the coloured lines; these contributions are added to give the total energy inflow (black; contributions from black carbon on snow and contrails as well as contrail-induced cirrus are included but not shown separately). (b) The cumulative total energy inflow from (a, black) is balanced by the sum of the energy uptake of the Earth system (blue; energy absorbed in warming the ocean, the atmosphere and the land, as well as in the melting of ice) and an increase in outgoing radiation inferred from changes in the global mean surface temperature. The sum of these two terms is given for a climate feedback parameter α of 2.47, 1.23 and 0.82 W m–2 °C–1, corresponding to an equilibrium climate sensitivity of 1.5°C, 3.0°C and 4.5°C, respectively; 1.5°C to 4.5°C is assessed to be the likely range of equilibrium climate sensitivity. The energy budget would be closed for a particular value of α if the corresponding line coincided with the total energy inflow. For clarity, all uncertainties (shading) shown are likely ranges. {Box 12.2; Box 13.1, Figure 1}
You may freely download and copy the material contained on this website for your personal, non-commercial use, without any right to resell, redistribute, compile or create derivative works therefrom, subject to more specific restrictions that may apply to specific materials.