TFE.6, Figure 2
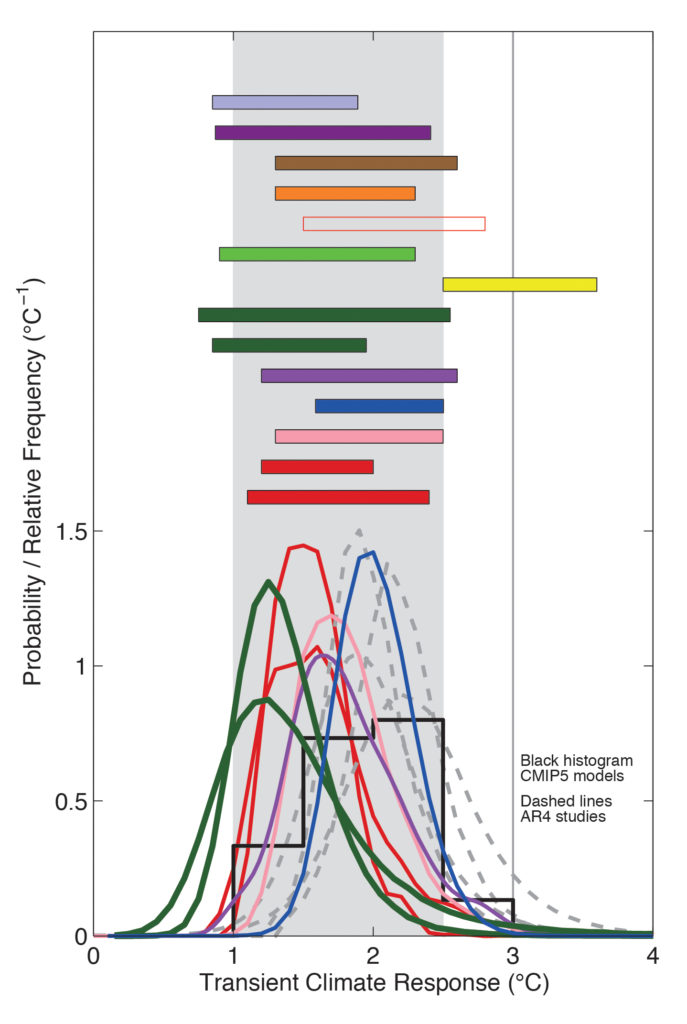
Probability density functions, distributions and ranges (5 to 95%) for the transient climate response from different studies, based on Figure 10.20a, and results from CMIP5 (black histogram, Table 9.5). The grey shaded range marks the likely 1°C to 2.5°C range, the grey solid line marks the extremely unlikely greater than 3°C. See Figure 10.20a and Chapter 10 Supplementary Material for full caption and details. {Box 12.2, Figure 2}
You may freely download and copy the material contained on this website for your personal, non-commercial use, without any right to resell, redistribute, compile or create derivative works therefrom, subject to more specific restrictions that may apply to specific materials.
Share