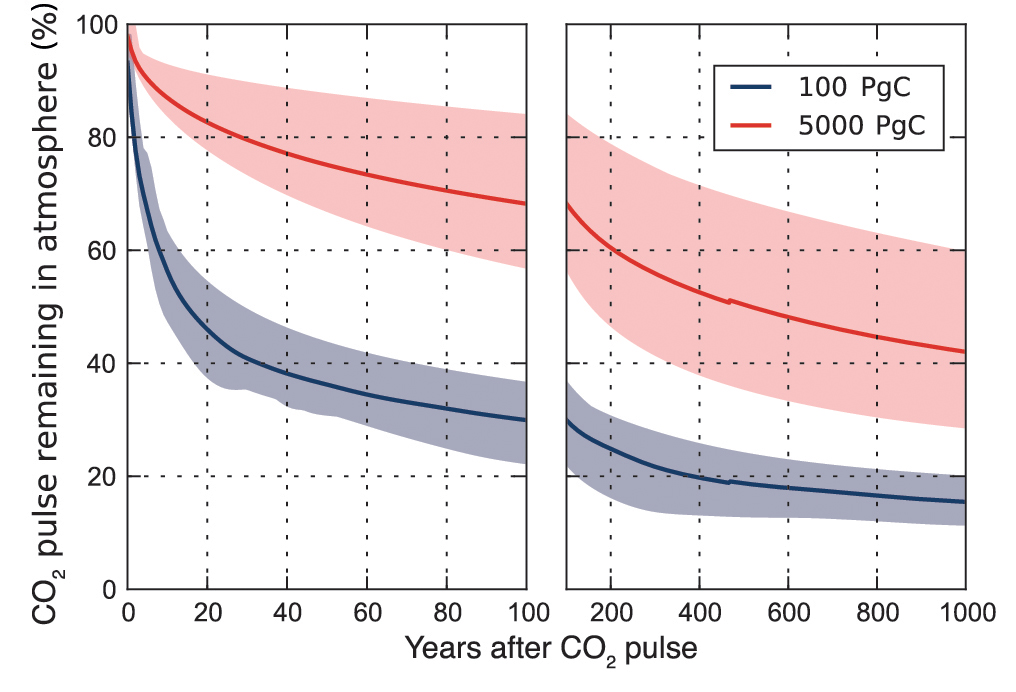
TFE.7, Figure 1
Percentage of initial atmospheric CO2 perturbation remaining in the atmosphere in response to an idealized instantaneous CO2 emission pulse in year 0 as calculated by a range of coupled climate–carbon cycle models. Multi-model mean (line) and the uncertainty interval (maximum model range, shading) simulated during 100 years (left) and 1 kyr (right) following the instantaneous emission pulse of 100 PgC (blue) and 5,000 PgC (red). {Box 6.1, Figure 1}
You may freely download and copy the material contained on this website for your personal, non-commercial use, without any right to resell, redistribute, compile or create derivative works therefrom, subject to more specific restrictions that may apply to specific materials.
Share