
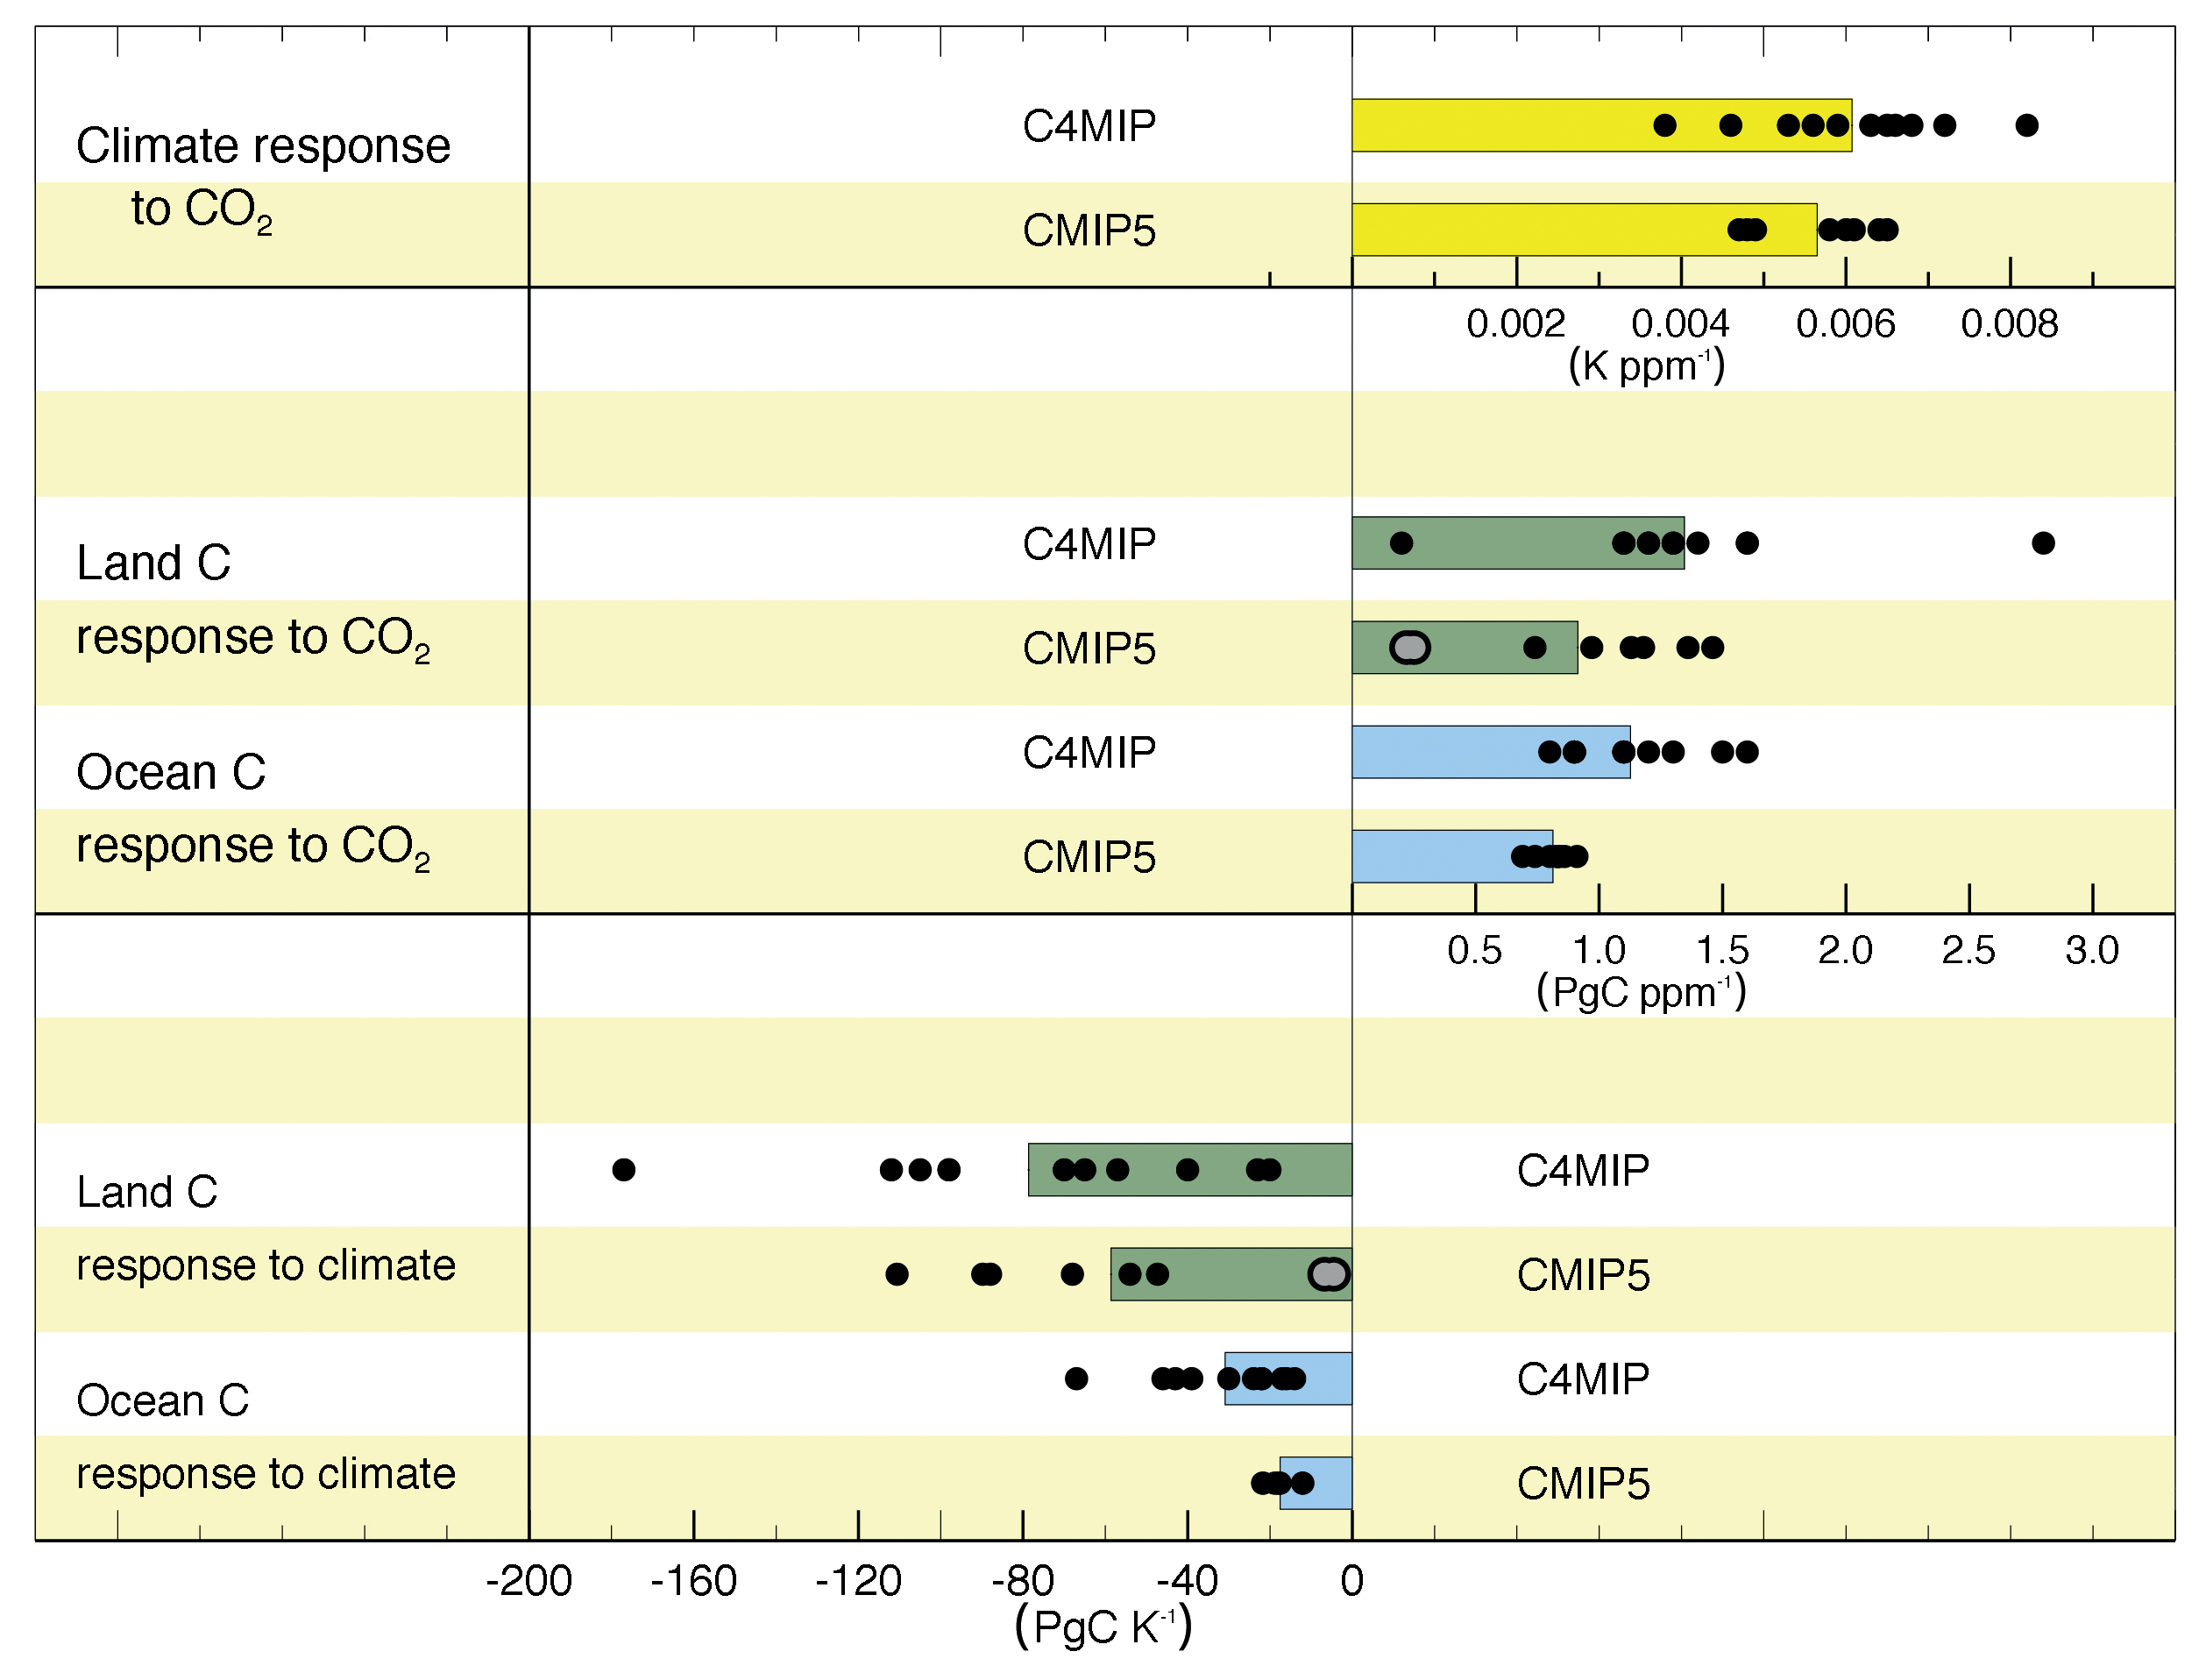
TFE.7, Figure 2
Comparison of carbon cycle feedback metrics between the ensemble of seven General Circulation Models (GCMs) and four Earth System Models of Intermediate Complexity (EMICs) at the time of AR4 (Coupled Carbon Cycle Climate Model Intercomparison Project (C4MIP)) under the SRES A2 scenario and the eight CMIP5 models under the 140-year 1% CO2 increase per year scenario. Black dots represent a single model simulation and coloured bars the mean of the multi-model results, grey dots are used for models with a coupled terrestrial nitrogen cycle. The comparison with C4MIP models is for context, but these metrics are known to be variable across different scenarios and rates of change (see Section 6.4.2). The SRES A2 scenario is closer in rate of change to a 0.5% CO2 increase per year scenario and as such it should be expected that the CMIP5 climate–carbon sensitivity terms are comparable, but the concentration–carbon sensitivity terms are likely to be around 20% smaller for CMIP5 than for C4MIP due to lags in the ability of the land and ocean to respond to higher rates of CO2 increase. This dependence on scenario reduces confidence in any quantitative statements of how CMIP5 carbon cycle feedbacks differ from C4MIP. {Figure 6.21}
You may freely download and copy the material contained on this website for your personal, non-commercial use, without any right to resell, redistribute, compile or create derivative works therefrom, subject to more specific restrictions that may apply to specific materials.