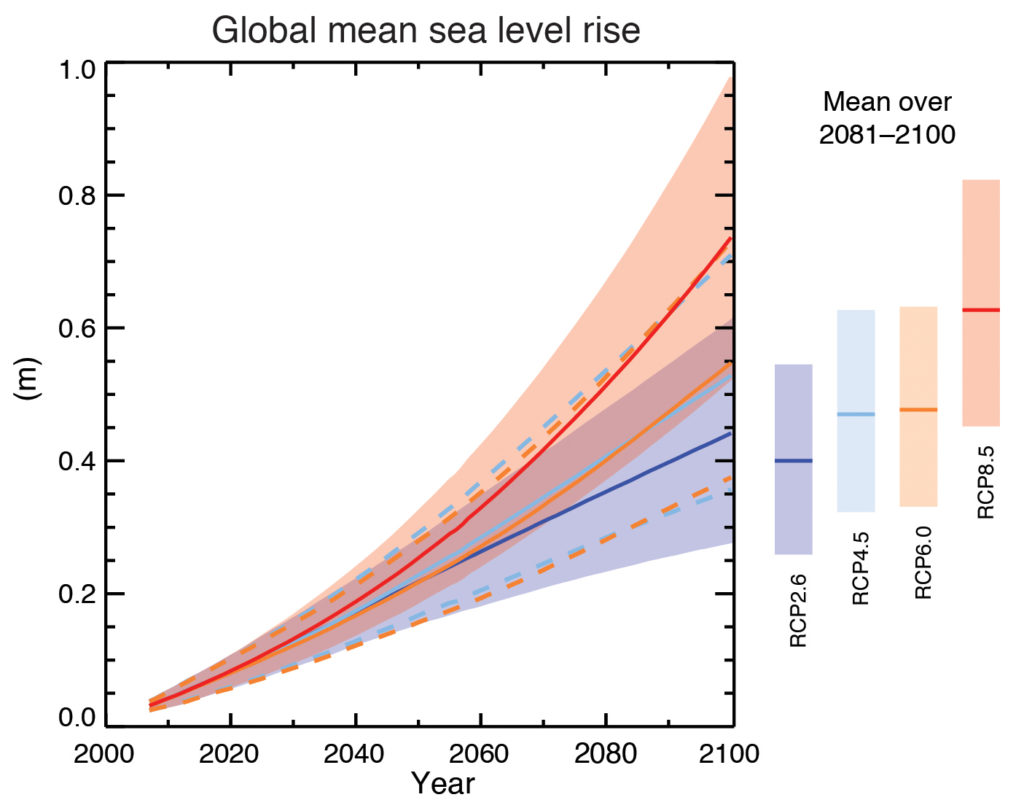
Figure TS.22
Projections from process-based models of global mean sea level (GMSL) rise relative to 1986–2005 for the four RCP scenarios. The solid lines show the median projections, the dashed lines show the likely ranges for RCP4.5 and RCP6.0, and the shading the likely ranges for RCP2.6 and RCP8.5. The time means for 2081–2100 are shown as coloured vertical bars. See Sections 13.5.1 and 13.5.3 and Supplementary Material for methods. Based on current understanding, only the collapse of the marine- based sectors of the Antarctic ice sheet, if initiated, could cause GMSL to rise substantially above the likely range during the 21st century. This potential additional contribution cannot be precisely quantified but there is medium confidence that it would not exceed several tenths of a metre during the 21st century. Further detail regarding the related Figure SPM.9 is given in the TS Supplementary Material. {Table 13.5; Figures 13.10, 13.11}
You may freely download and copy the material contained on this website for your personal, non-commercial use, without any right to resell, redistribute, compile or create derivative works therefrom, subject to more specific restrictions that may apply to specific materials.