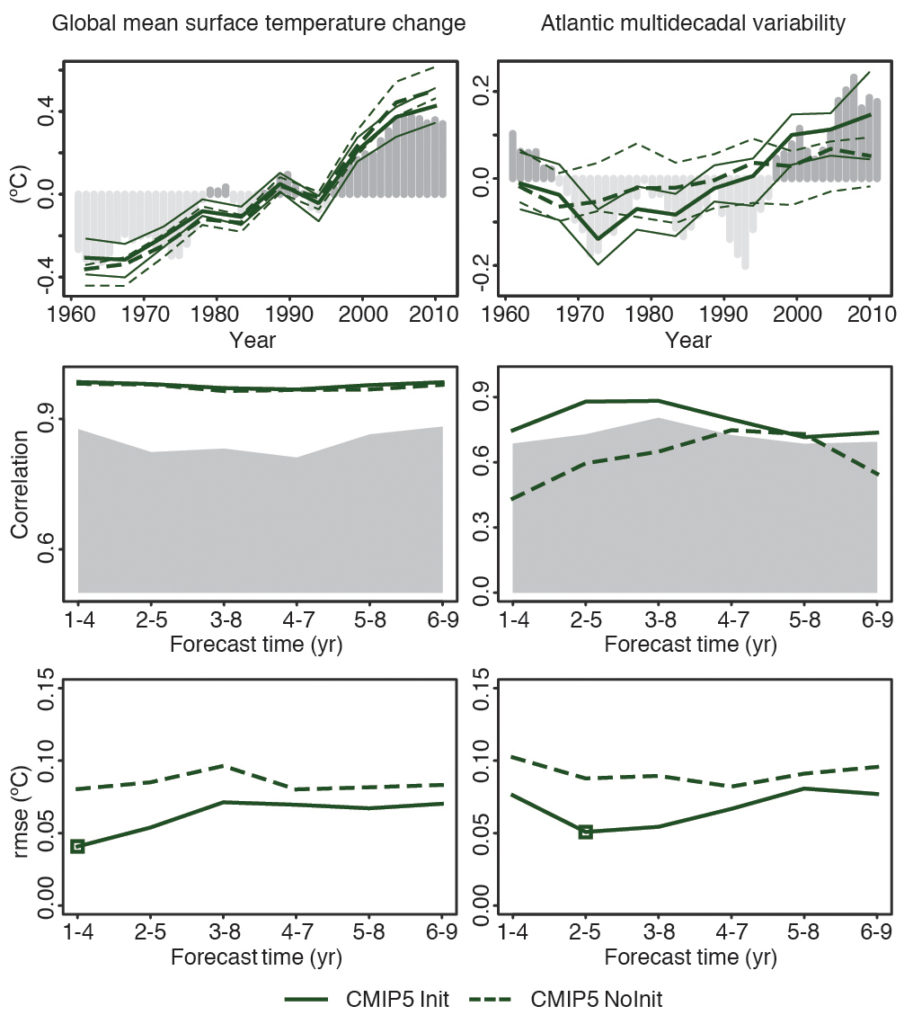
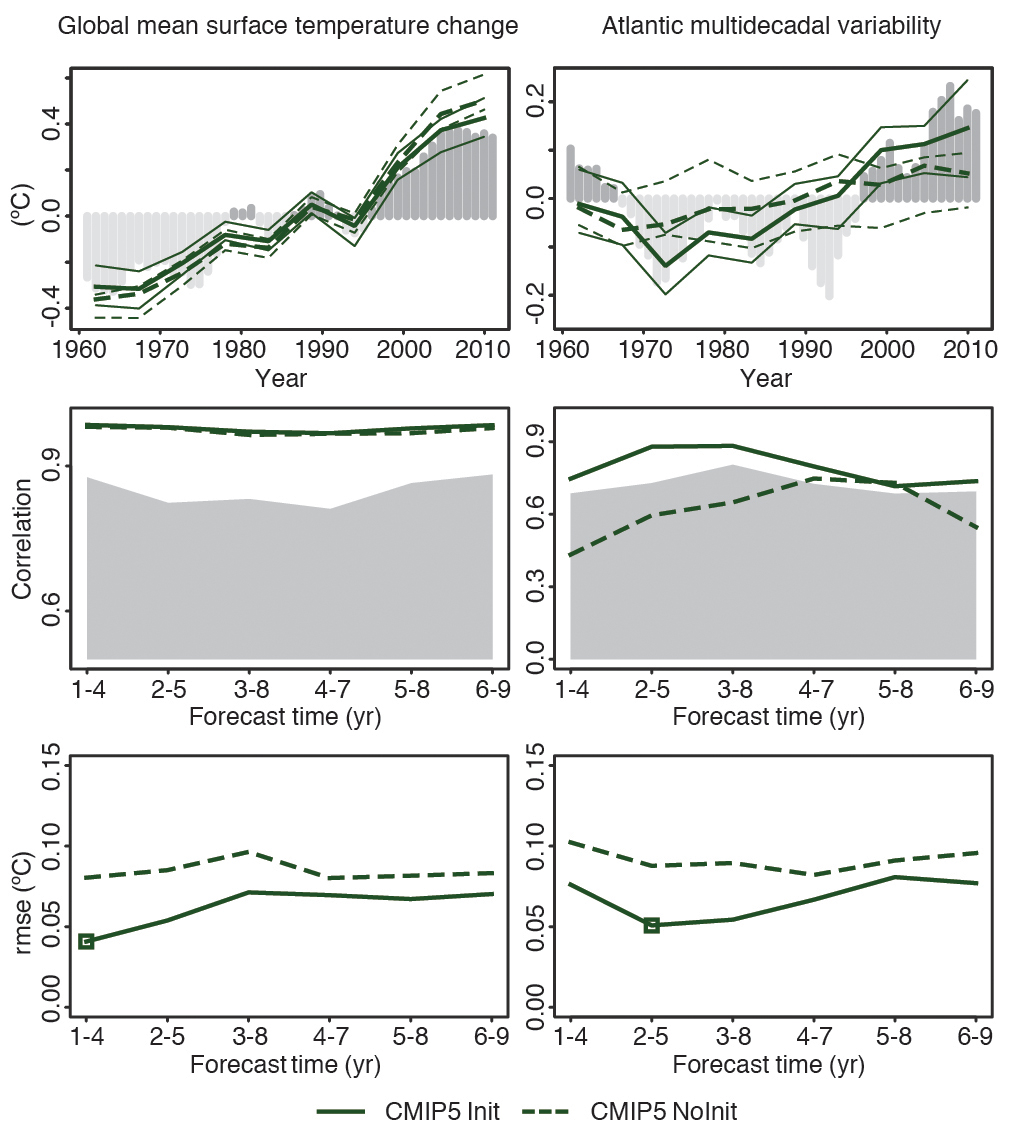
Figure TS.13
Decadal prediction forecast quality of several climate indices. (Top row) Time series of the 2- to 5-year average ensemble mean initialized hindcast anoma- lies and the corresponding non-initialized experiments for three climate indices: global mean surface temperature (GMST, left) and the Atlantic Multi-decadal Variability (AMV, right). The observational time series, Goddard Institute of Space Studies Goddard Insti- tute for Space Studies Surface Temperature Analysis (GISTEMP) global mean temperature and Extended Reconstructed Sea Surface Tempearture (ERSST) for the AMV, are represented with dark grey (positive anomalies) and light grey (negative anomalies) vertical bars, where a 4-year running mean has been applied for consistency with the time averaging of the predictions. Predicted time series are shown for the CMIP5 Init (solid) and NoInit (dotted) simulations with hindcasts started every 5 years over the period 1960–2005. The lower and upper quartile of the multi-model ensemble are plotted using thin lines. The AMV index was computed as the sea surface temperature (SST) anomalies averaged over the region Equator to 60oN and 80oW to 0oW minus the SST anomalies averaged over 60oS to 60oN. Note that the vertical axes are different for each time series. (Middle row) Correlation of the ensemble mean prediction with the observa- tional reference along the forecast time for 4-year averages of the three sets of CMIP5 hindcasts for Init (solid) and NoInit (dashed). The one-sided 95% confidence level with a t distribution is represented in grey. The effective sample size has been computed taking into account the autocorrelation of the observational time series. A two-sided t test (where the effective sample size has been computed taking into account the autocorrelation of the observational time series) has been used to test the differences between the correlation of the initialized and non-initialized experiments, but no differ- ences were found statistically significant with a confidence equal or higher than 90%. (Bottom row) Root mean square error (RMSE) of the ensemble mean prediction along the forecast time for 4-year averages of the CMIP5 hindcasts for Init (solid) and NoInit (dashed). A two-sided F test (where the effective sample size has been computed taking into account the autocorrelation of the observational time series) has been used to test the ratio between the RMSE of the Init and NoInit, and those forecast times with differences statistically significant with a confidence equal or higher than 90% are indicated with an open square. {Figure 11.3}
You may freely download and copy the material contained on this website for your personal, non-commercial use, without any right to resell, redistribute, compile or create derivative works therefrom, subject to more specific restrictions that may apply to specific materials.