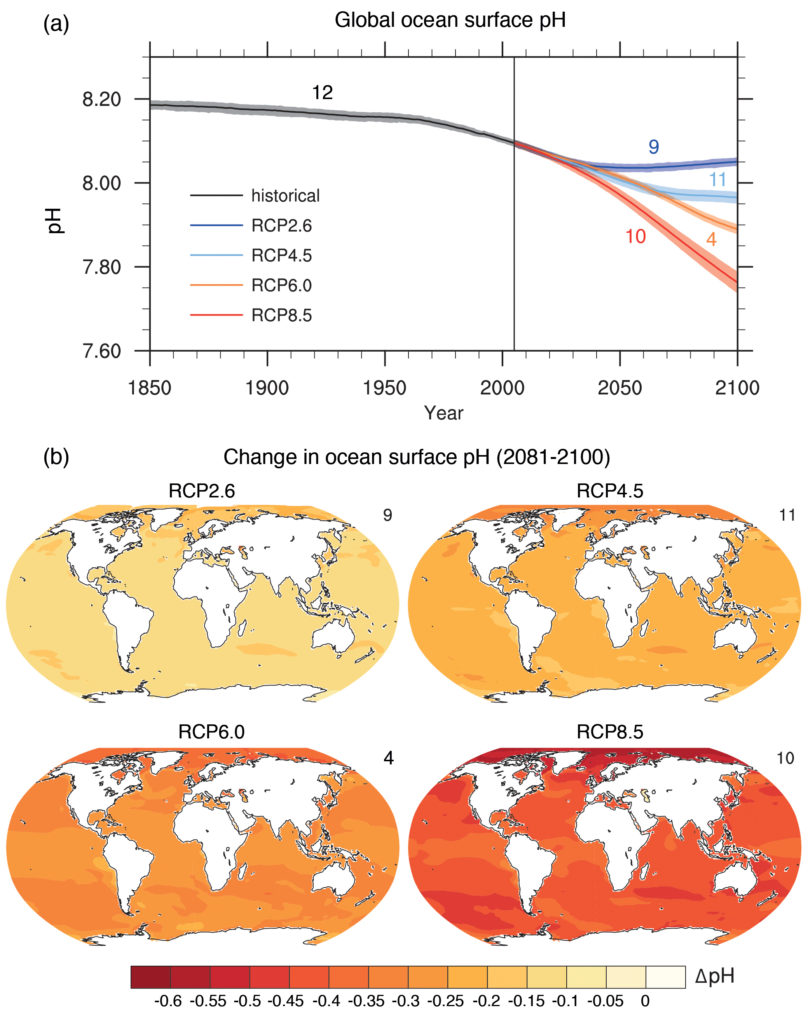
Figure TS.20
(a) Time series (model averages and minimum to maximum ranges) and (b) maps of multi-model surface ocean pH for the scenarios RCP2.6, RCP4.5, RCP6.0 and RCP8.5 in 2081–2100. The maps in (b) show change in global ocean surface pH in 2081–2100 relative to 1986–2005. The number of CMIP5 models to calculate the multi-model mean is indicated in the upper right corner of each panel. Further detail regarding the related Figures SPM.7c and SPM.8.d is given in the TS Supplementary Material. {Figure 6.28}
You may freely download and copy the material contained on this website for your personal, non-commercial use, without any right to resell, redistribute, compile or create derivative works therefrom, subject to more specific restrictions that may apply to specific materials.