
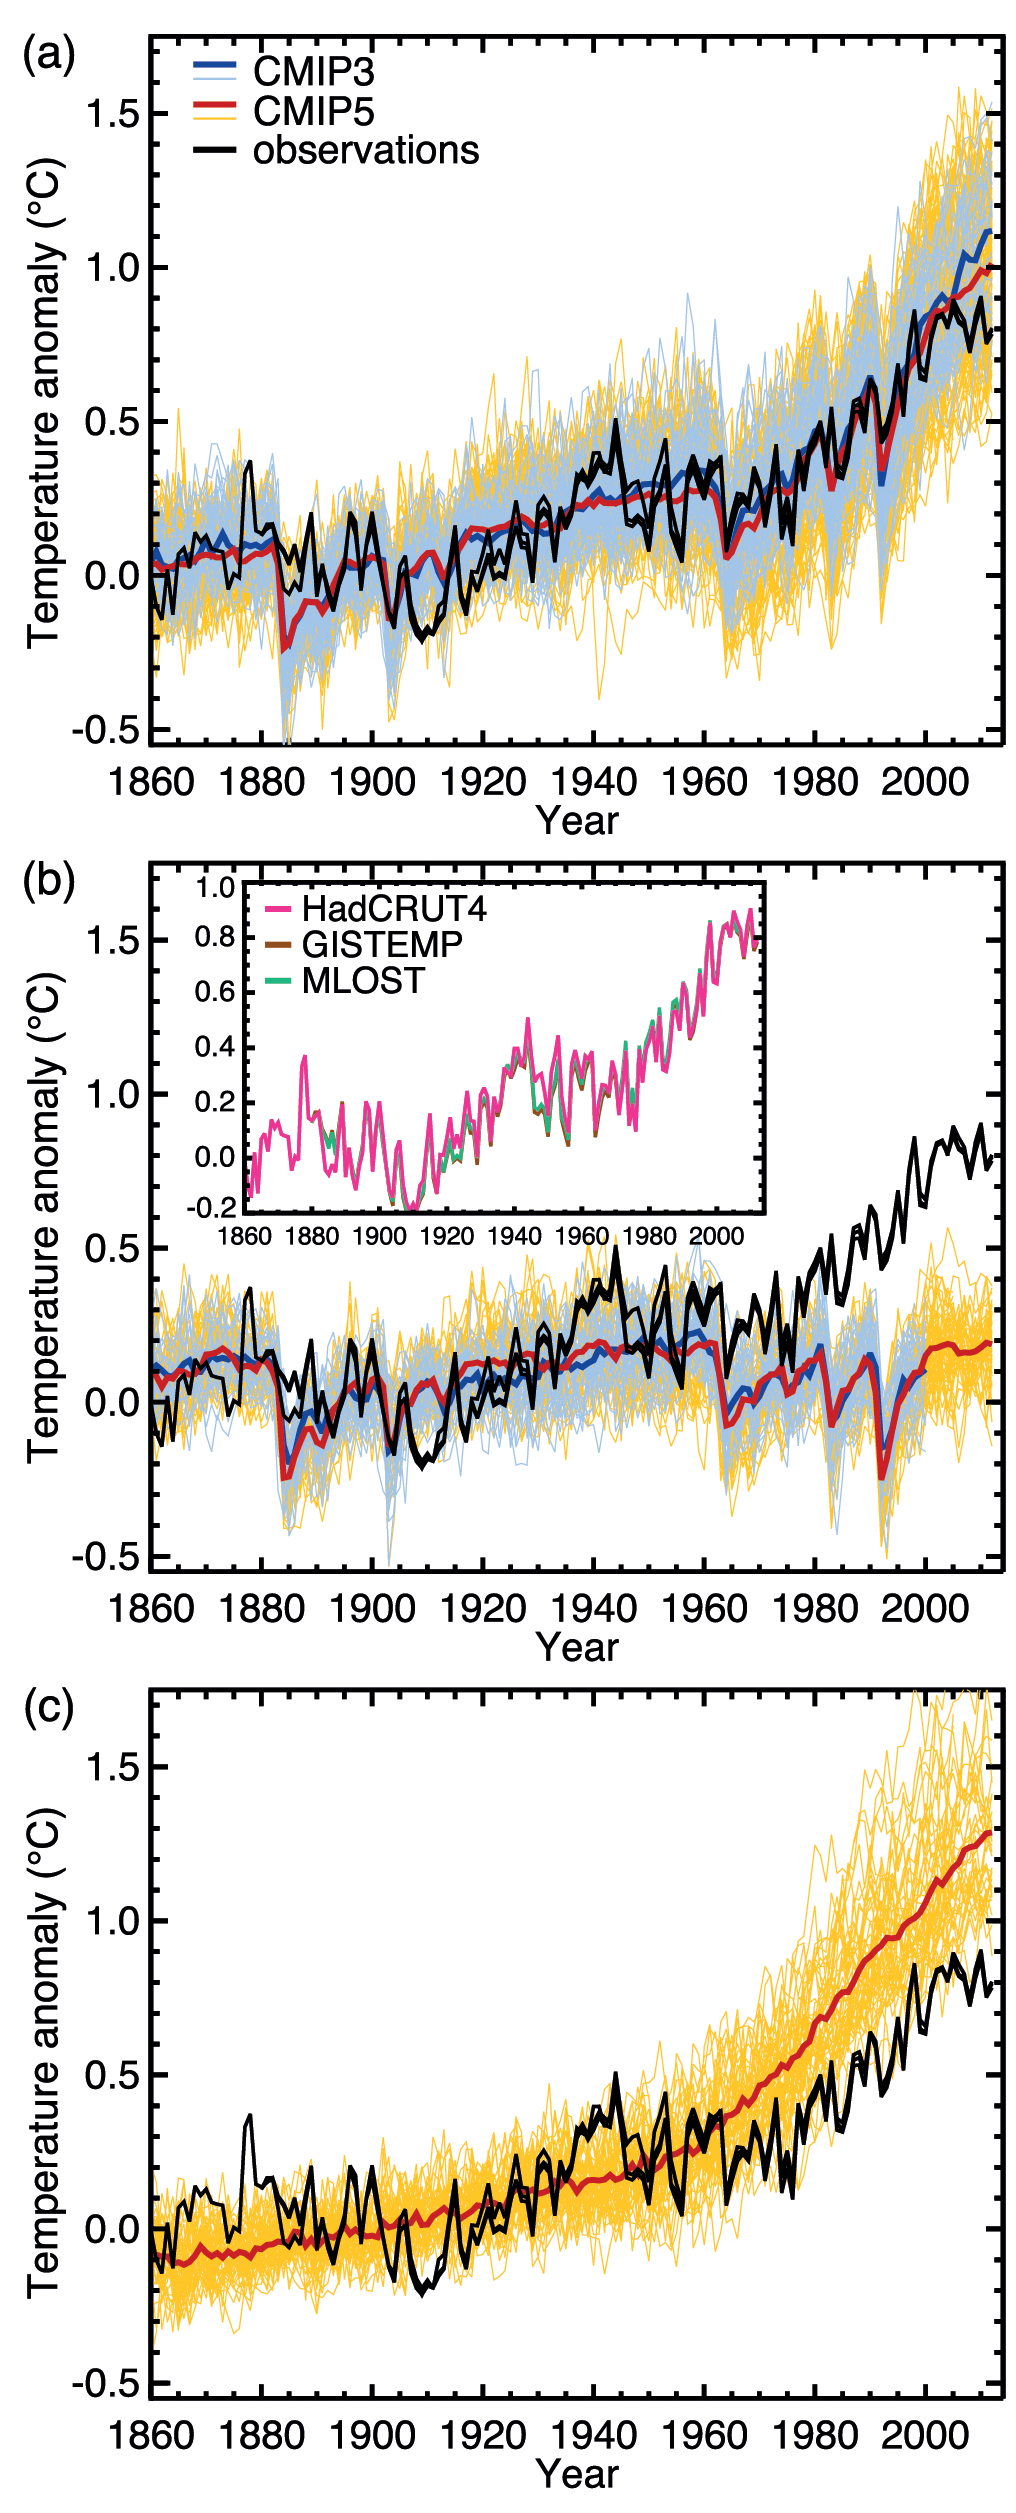
Figure TS.9
Three observational estimates of global mean surface temperature (black lines) from the Hadley Centre/Climatic Research Unit gridded surface temperature data set 4 (HadCRUT4), Goddard Institute for Space Studies Surface Temperature Analysis (GISTEMP), and Merged Land–Ocean Surface Temperature Analysis (MLOST), com- pared to model simulations (CMIP3 models— thin blue lines and CMIP5 models—thin yellow lines) with anthropogenic and natural forcings (a), natural forcings only (b) and greenhouse gas forcing only (c). Thick red and blue lines are averages across all avail- able CMIP5 and CMIP3 simulations respectively. All simulated and observed data were masked using the HadCRUT4 coverage (as this data set has the most restricted spatial coverage), and global average anomalies are shown with respect to 1880–1919, where all data are first calculated as anomalies relative to 1961–1990 in each grid box. Inset to (b) shows the three observational data sets distinguished by different colours. {Figure 10.1}
You may freely download and copy the material contained on this website for your personal, non-commercial use, without any right to resell, redistribute, compile or create derivative works therefrom, subject to more specific restrictions that may apply to specific materials.