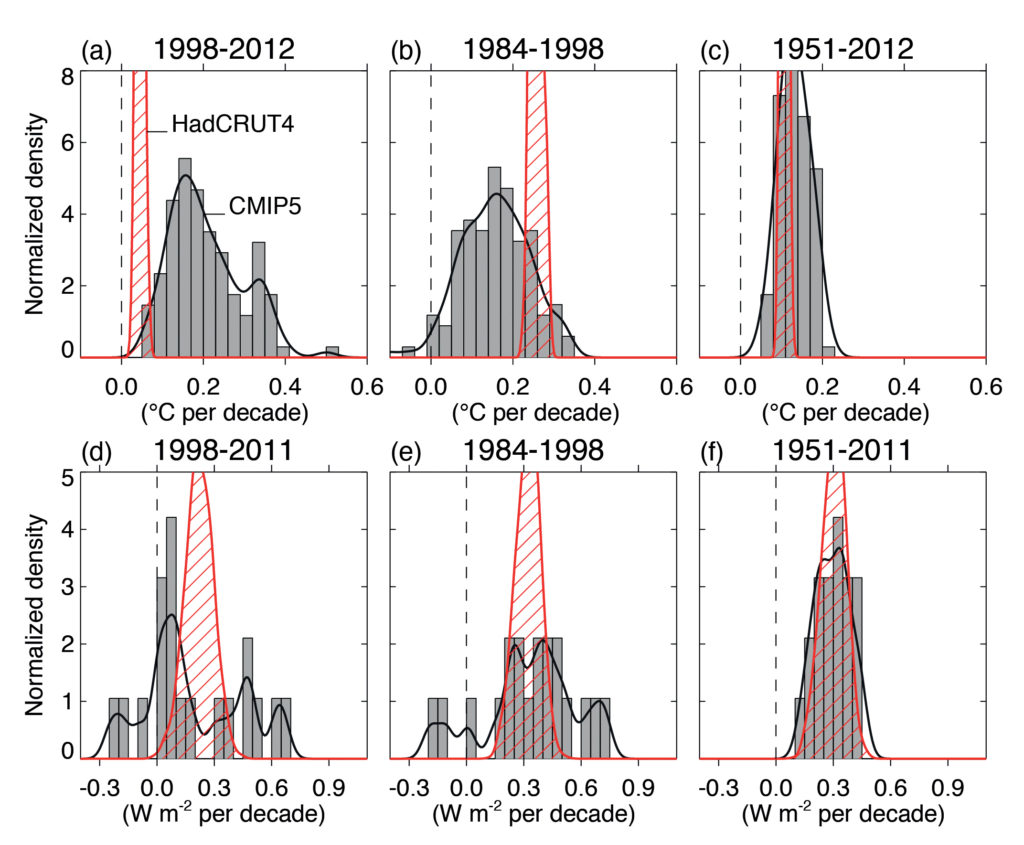
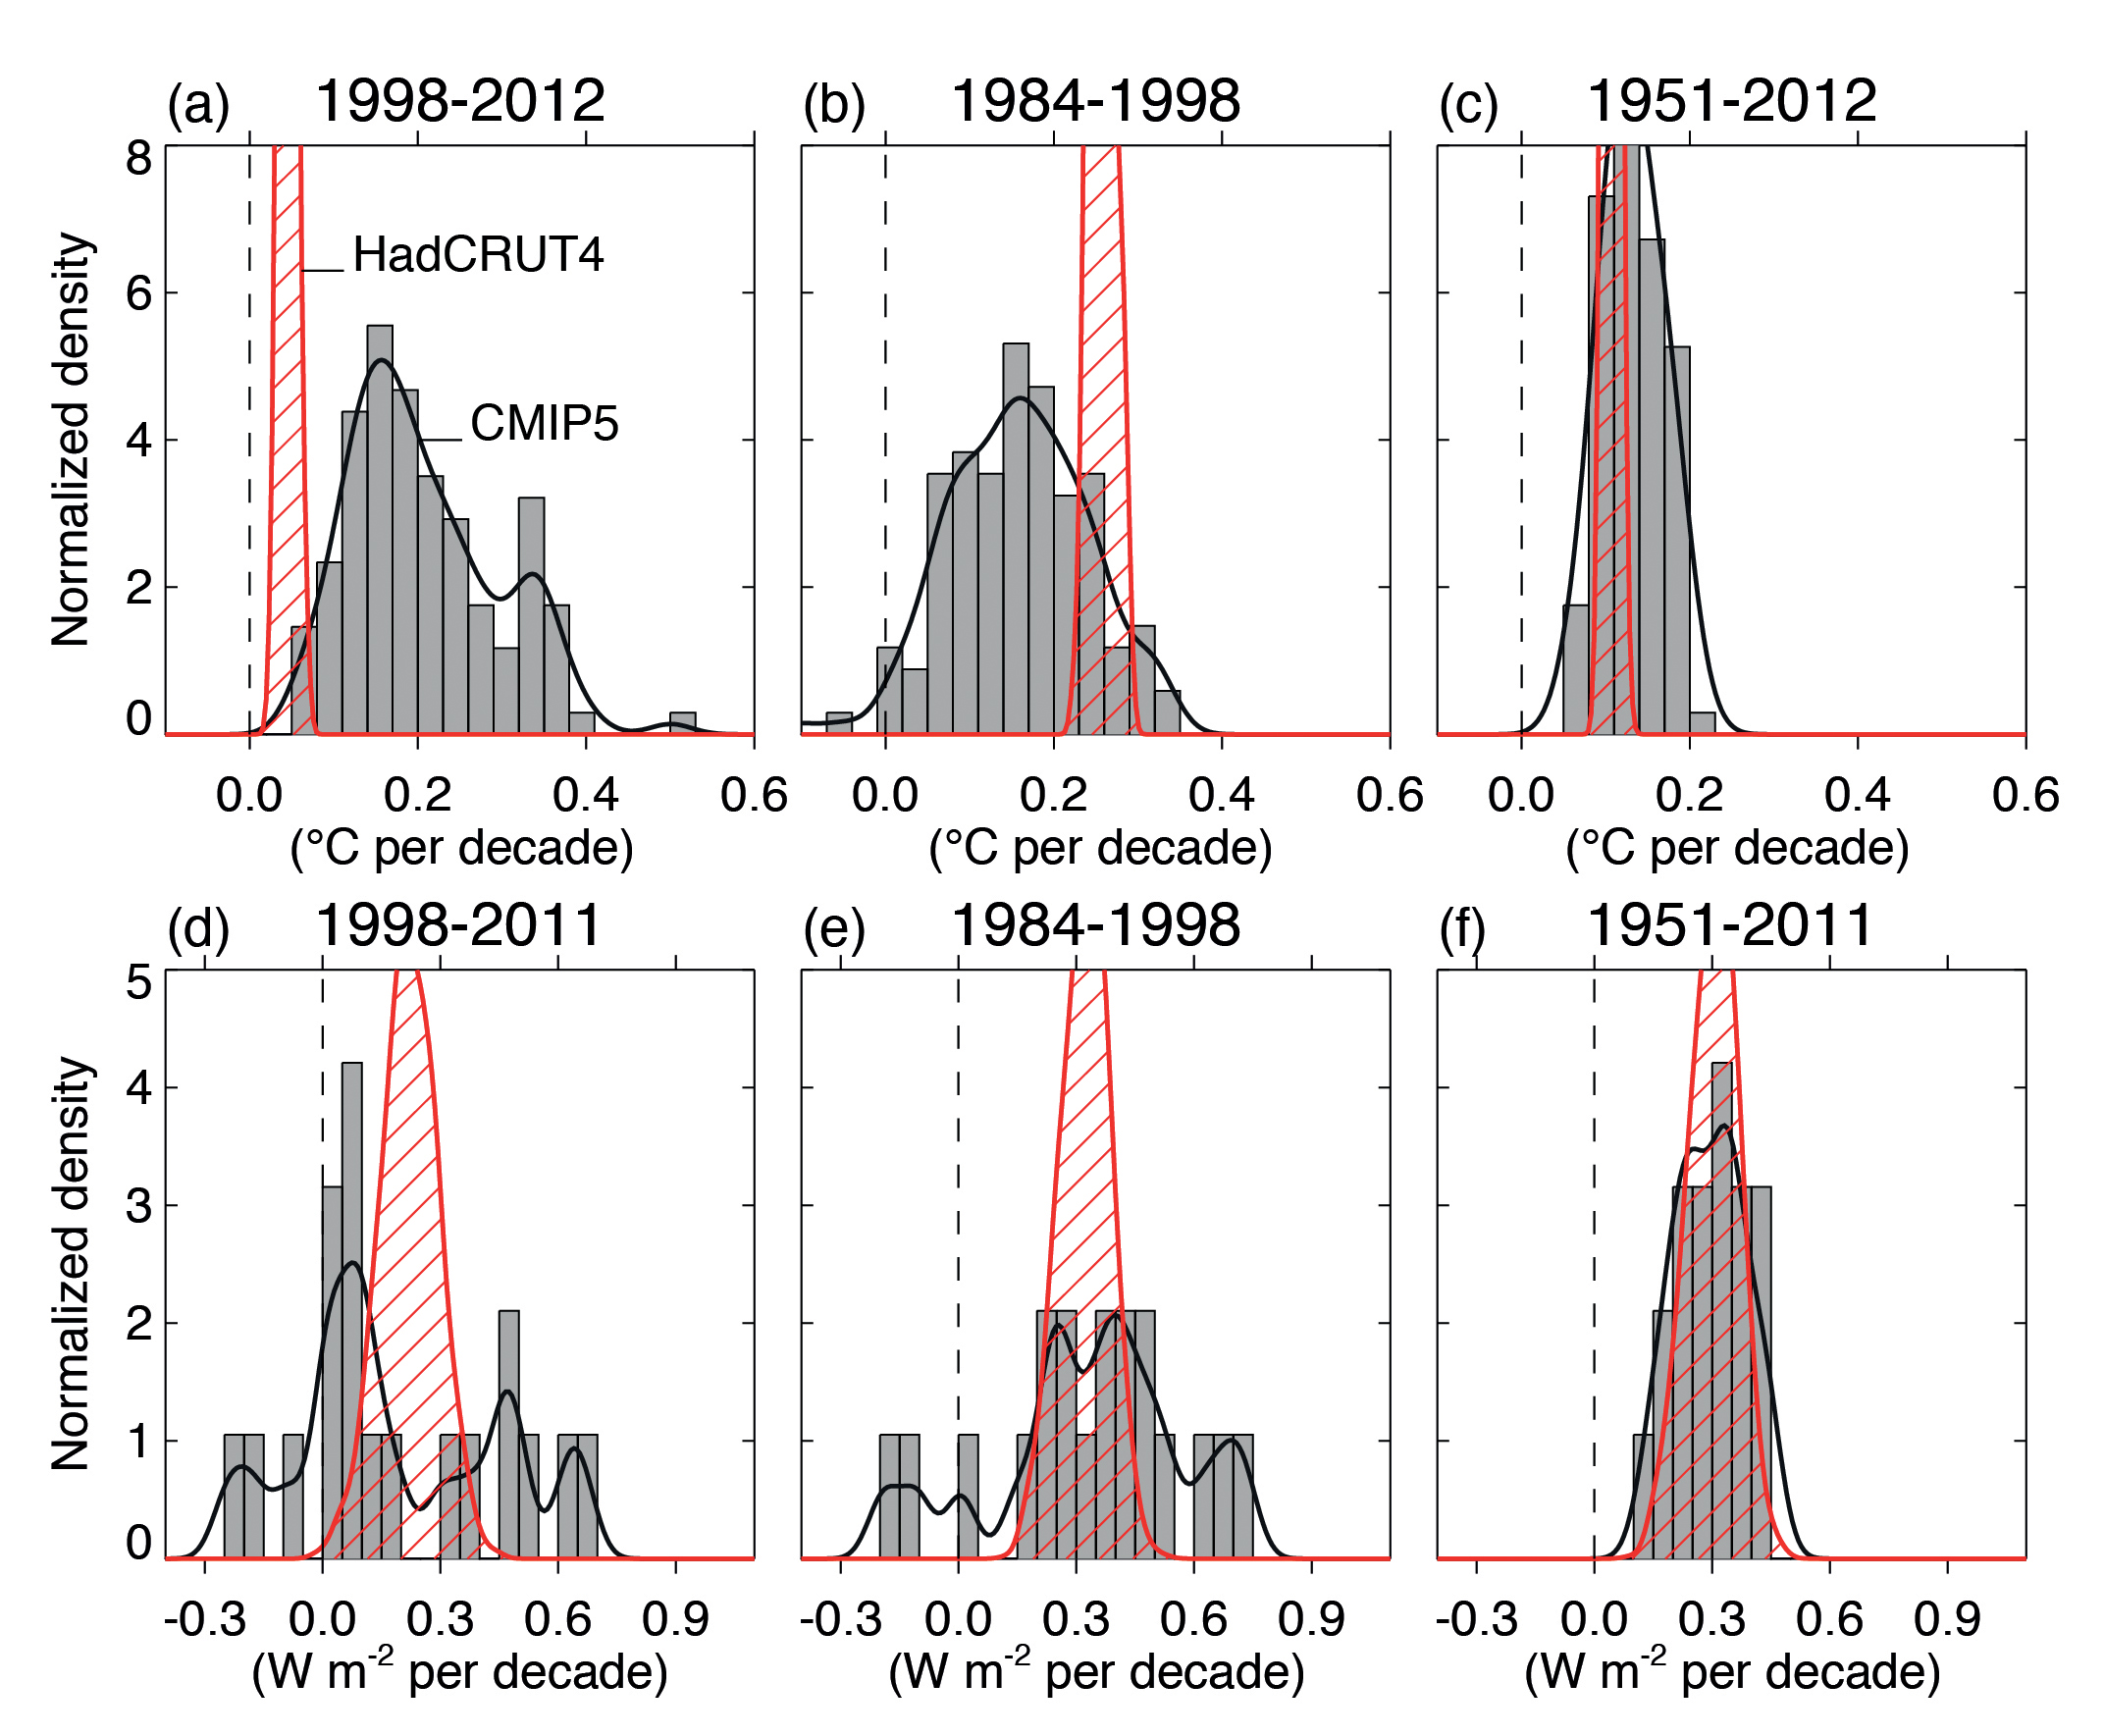
Box TS.3, Figure 1
(Top) Observed and simulated GMST trends in °C per decade, over the periods 1998–2012 (a), 1984–1998 (b), and 1951–2012 (c). For the observations, 100 realizations of the Hadley Centre/Climatic Research Unit gridded surface temperature data set 4 (HadCRUT4) ensemble are shown (red, hatched). The uncertainty displayed by the ensemble width is that of the statistical construction of the global average only, in contrast to the trend uncertainties quoted in Section 2.4.3, which include an estimate of internal climate variability. Here, by contrast, internal variability is characterized through the width of the model ensemble. For the models, all 114 available CMIP5 historical realizations are shown, extended after 2005 with the RCP4.5 scenario and through 2012 (grey, shaded). (Bottom) Trends in effective radiative forcing (ERF, in W m–2 per decade) over the periods 1998–2011 (d), 1984–1998 (e), and 1951–2011 (f). The figure shows AR5 best-estimate ERF trends (red, hatched) and CMIP5 ERF (grey, shaded). Black lines are smoothed versions of the histograms. Each histogram is normalized so that its area sums up to one. {2.4.3, 8.5.2; Box 9.2; Figure 8.18; Box 9.2, Figure 1}
You may freely download and copy the material contained on this website for your personal, non-commercial use, without any right to resell, redistribute, compile or create derivative works therefrom, subject to more specific restrictions that may apply to specific materials.