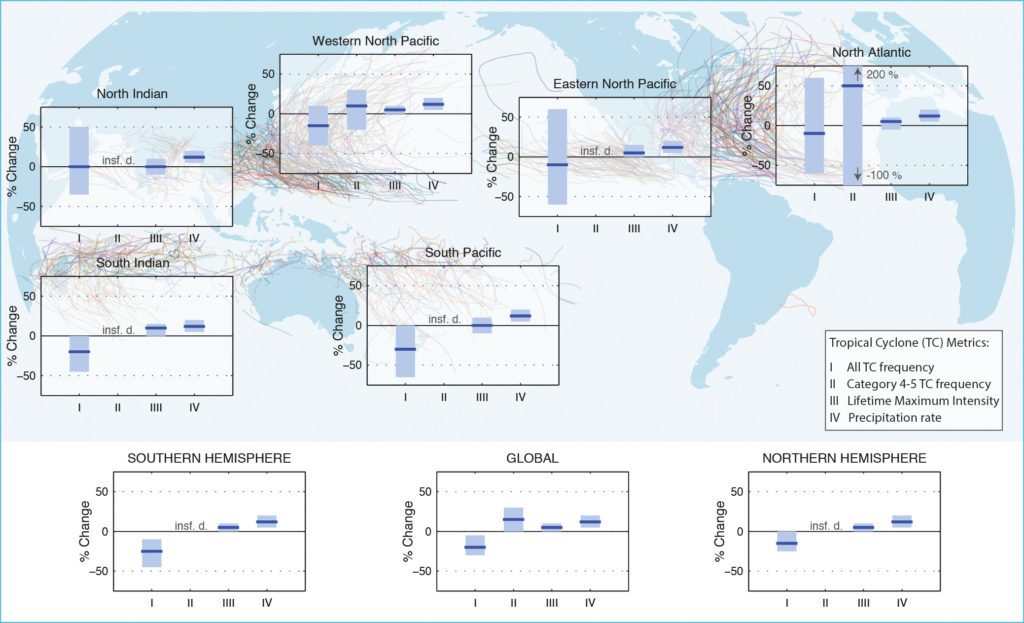
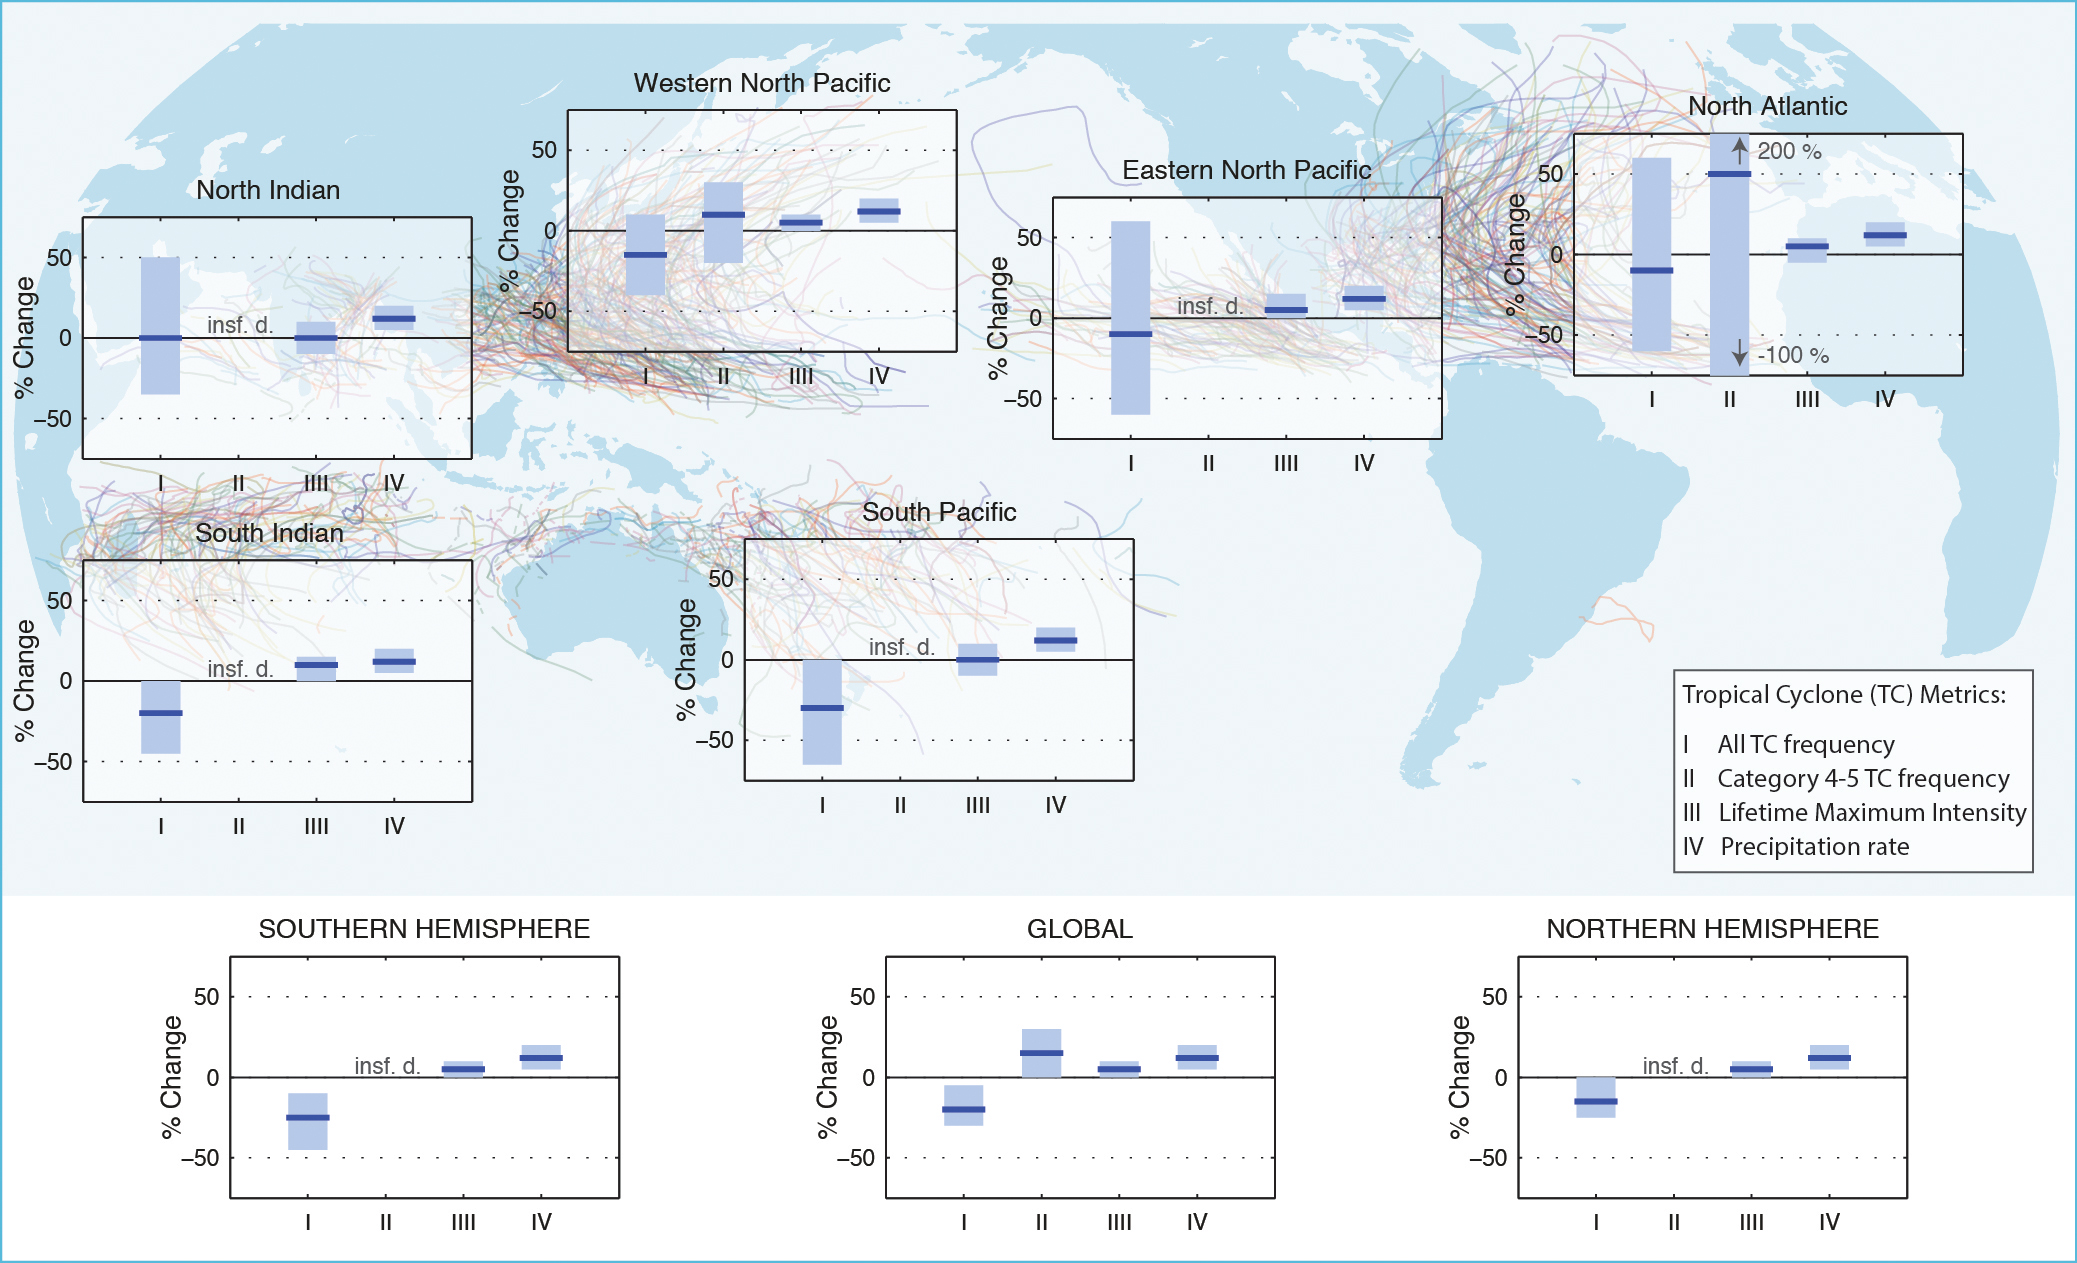
Figure TS.26
Projected changes in tropical cyclone statistics. All values represent expected percent change in the average over period 2081–2100 relative to 2000–2019, under an A1B-like scenario, based on expert judgement after subjective normalization of the model projections. Four metrics were considered: the percent change in I) the total annual frequency of tropical storms, II) the annual frequency of Category 4 and 5 storms, III) the mean Lifetime Maximum Intensity (LMI; the maximum intensity achieved during a storm’s lifetime) and IV) the precipitation rate within 200 km of storm center at the time of LMI. For each metric plotted, the solid blue line is the best guess of the expected percent change, and the coloured bar provides the 67% (likely) confidence interval for this value (note that this interval ranges across –100% to +200% for the annual frequency of Category 4 and 5 storms in the North Atlantic). Where a metric is not plotted, there are insufficient data (denoted X) available to complete an assessment. A randomly drawn (and coloured) selection of historical storm tracks are underlaid to identify regions of tropical cyclone activity. See Section 14.6.1 for details. {14.6.1}
You may freely download and copy the material contained on this website for your personal, non-commercial use, without any right to resell, redistribute, compile or create derivative works therefrom, subject to more specific restrictions that may apply to specific materials.